

Abstract
Calorie restriction (CR) enhances longevity in humans who are normal weight, overweight and obese. While dietary regimens can change self-efficacy, eating behaviors, and food cravings in individuals with obesity, the responses of these measures to prolonged CR in individuals who are exclusively not obese is unknown. The aim of this analysis was to test the effects of a two-year CR intervention on self-efficacy and eating attitudes and behaviors in humans without obesity by analyzing data from the Comprehensive Assessment of Long-term Effects of Reducing Intake of Energy Phase 2 (CALERIE 2) study. Participants (n = 218, BMI range = 21.3-29.0 kg/m2) were randomized to a 25% CR group or an ad libitum (AL) group. Eating attitudes and behaviors and self-efficacy were assessed using validated questionnaires at baseline, 12, and 24 months. Dietary restraint and self-efficacy increased in the CR compared to the AL group (ES ≥ 0.32). Increased self-efficacy was negatively related to weight change (ρ < −0.24). In the CR group, males showed a reduction in cravings for carbohydrates and fats at month 24, whereas females did not. The CR group showed elevations in state hunger, which were transient, and disinhibited eating (ES ≥ 0.37). In individuals without obesity, dietary restraint and self-efficacy could be important in promoting long-term CR for individuals looking to use CR as a tool to improve longevity.
Keywords: calorie restriction, eating behaviors, food cravings, self-efficacy
1. Introduction
Calorie restriction (CR) is a reduction in habitual energy intake that improves health span in a host of species (Finer, 2001). Studies have shown CR reduces the risk of chronic metabolic-related diseases and stimulates youthful physical and mental functionality without negatively influencing quality of life (C. K. Martin et al., 2016; Mattison et al., 2017; Redman et al., 2018). Though the benefits have been well established in individuals with obesity, CR interventions are effective in increasing health span and controlling weight in adults who are overweight and normal weight, especially those in obesogenic environments where energy-dense foods are easily accessible (Ravussin et al., 2015; Redman & Ravussin, 2011; Redman et al., 2018). Therefore, it is important to study the eating behaviors and attitudes that could influence body weight and energy intake during CR interventions among people without obesity.
During dietary regimens that restrict energy consumption, habitual eating behaviors and attitudes change. Dietary restraint, which refers to the cognitive intent and ability to limit food intake and eat less than one would like (Schaumberg, Anderson, Anderson, Reilly, & Gorrell, 2016), is often elevated and is beneficial in controlling weight, particularly when it does not occur concurrently with elevations in disinhibited eating (Williamson et al., 2008, 2007). Perceived hunger may also be reduced after prolonged reductions in energy consumption (Wadden, Stunkard, Day, Gould, & Rubin, 1987; Wing, Marcus, Blair, & Burton, 1991), implying individuals may not be sensitive to a dietary-stimulated energy deficit (Anton et al., 2009). Others, nevertheless, suggest an increase in hunger occurs during CR, indicating that precise hunger changes during prolonged CR are equivocal and further investigative work is needed (Polidori, Sanghvi, Seeley, & Hall, 2016). In addition, dietary weight loss interventions can alter food cravings, which are defined as a strong desire to consume a particular food (or type of food) that is difficult to resist and occurs in the absence of hunger (White, Whisenhunt, Williamson, Greenway, & Netemeyer, 2002). Food cravings are estimated to explain 11% of the variance in eating behavior and weight gain (Boswell & Kober, 2016), and have been positively related to body mass index (Delahanty, Meigs, Hayden, Williamson, & Nathan, 2002), yet their response to dietary regimens is ambiguous. Some have shown dietary restriction reduces food cravings (Kahathuduwa, Binks, Martin, & Dawson, 2017; C. K. Martin, O’Neil, & Pawlow, 2006; C. K. Martin et al., 2011), though others have found certain cravings are elevated (Jakubowicz, Froy, Wainstein, & Boaz, 2012) or unchanged (Barnard et al., 2009) in response to changes in diet. These mixed findings highlight the need for more studies assessing changes in food cravings in response to CR, particularly in individuals without obesity. Moreover, work is needed to explore sex-based variations in food cravings in individuals without obesity, since some suggest that females display a lower suppression of food cravings compared to males (Kahathuduwa et al., 2017).
Self-efficacy refers to one’s confidence in their ability to initiate and sustain a given behavior (Burke et al., 2015), and self-efficacy for weight control behaviors increases during dietary interventions among participants with obesity (P. D. Martin, Dutton, & Brantley, 2004). Improved (increased) self-efficacy is related to positive behavior change (Strecher, Devellis, Becker, & Rosenstock, 1986) and is viewed as beneficial when attempting to lose weight and follow a CR regimen, as it reflects confidence in one’s ability to manage food intake. During an intervention that aimed to enhance self-efficacy during weight loss, Warziski et al. showed that self-efficacy for controlling eating in a set of circumstances increases with weight loss and is correlated to the degree of weight loss (Warziski, Sereika, Styn, Music, & Burke, 2008). However, it is not known if strategies that improve self-efficacy in controlling food intake are effective in stimulating changes in eating behaviors in males and females without obesity and attempting to restrict energy intake over the long-term to augment metabolic health and longevity.
The primary aim of the current study was to test the effect of a behavioral intervention during prolonged CR on eating behaviors related to restraint, disinhibition, measures of appetite/hunger, state and trait food cravings, and self-efficacy. Our secondary aim was to examine the association between these constructs and change in body weight and percent CR achieved. As exploratory analyses, we also investigated whether sex modified the effect of CR on these eating behaviors and constructs. We hypothesize that individuals undergoing CR will display an increase in dietary restraint and self-efficacy, and a reduction in food cravings compared to a control ad libitum (AL) group. We further hypothesize that the change in selfefficacy to control eating would be positively related to weight loss.
2. Material and methods
2.1. Ethics and trial registration
The Comprehensive Assessment of Long-term Effects of Reducing Intake of Energy Phase 2 (CALERIE 2) was a multi-site single study that received approval from the institutional review boards at Pennington Biomedical Research Center, Washington University, Tufts University, and Duke University (Rochon et al., 2011). Participants provided written informed consent and obtained financial compensation for their participation.
This study was a 2-year randomized controlled trial with participants randomized in a 2:1 ratio to a CR group or an ad libitum (AL) control group. From the onset of the intervention period, the CR group aimed to achieve a reduction in energy intake of 25%, whereas the AL group were instructed to maintain their habitual energy intake (Supplementary Figure 1) (Ravussin et al., 2015).
2.2. Participants
Details of study recruitment, the screening process and exclusion criteria are detailed elsewhere (Rochon et al., 2011; Stewart et al., 2013). In short, healthy male (aged 20-50 years) and female (aged 20-47 years to avoid the menopause in most females) participants with a body mass index (BMI) of 22.0-28.0 kg/m2 at screening were eligible. Three screening visits were used to examine eligibility and participants were excluded if they reported psychiatric problems, personality disorders and depression (Stewart et al., 2013). Participants were also screened for eating disorders if they displayed symptoms triggered by other eating disorder assessments such as the Multiaxial Assessment of Eating Disorder Symptoms and the Body Morph Assessment (Stewart et al., 2013). This was performed via the Interview for the Diagnosis of Eating Disorders, which is a semi-structured clinical interview that is used to examine the presence or absence of eating disorder symptoms according to Diagnostic and Statistical Manual of Mental Disorders-IV (Kutlesic, Williamson, Gleaves, Barbin, & Murphy-Eberenz, 1998; Stewart et al., 2013).
2.3. Study design
Participant (n = 220) randomization was stratified by site, sex and BMI, with the latter dichotomized into normal weight (22.0 ≤ BMI < 25.0 kg/m2) or overweight (25.0 ≤ BMI < 28.0 kg/m2). Habitual energy requirements of participants were obtained using two back-to-back measures of doubly labelled water. All outcomes were collected during baseline testing and at months 6, 12, and 24.
Details of the intervention have been reported elsewhere (Rickman et al., 2011). Briefly, in the CR group, an immediate and sustained 25% decrease in energy intake from energy requirements determined at baseline was targeted (Racette et al., 2012). Treatment occurred via individual and group sessions during which nutrition and behavioral material was delivered to optimize dietary adherence and assist participants in meeting their CR goals, including sessions on social support, hunger management, motivation, and management of food cravings (Rickman et al., 2011). The intervention also employed behavioral strategies to foster adherence, including meal provision, use of portion-controlled foods, stimulus control, and self-monitoring of diet and body weight. Participants were closely monitored for eating disorder symptoms throughout the trial and appropriate interventions or referrals were conducted if these arose. Participants in the AL control group were instructed to maintain their current diet and did not receive dietary intervention or counselling sessions. There were no incidences of eating disorder development (Ravussin et al., 2015).
2.4. Evaluation of eating behaviors
All questionnaires were administered as a packet at the study sites shortly after a standardized lunch was provided on the assessment visit days.
The Eating Inventory is a 51-item validated questionnaire that examines three eating behavior constructs: dietary restraint, disinhibition, and perceived hunger (Stunkard & Messick, 1985). Of the 51 items, 36, 1 and 14 of the items are on a binary-point (true/false), 6-point and 4-point response scale, respectively. It demonstrates good internal consistency within our sample (coefficient alpha: 0.65-0.74) and has been found to be sensitive to CR interventions and, among frequently utilized restraint scales, was found to be the only one associated with objectively measured energy balance/CR (Williamson et al., 2007). Dietary restraint measures the intent and ability to restrict food intake, disinhibition measures the tendency to overeat and hunger measures susceptibility to feelings of hunger. Scores for restraint, disinhibition and hunger range from 0-21, 0-18 and 0-14, respectively, and a greater number indicates greater levels of each respective eating component (Stunkard & Messick, 1985).
The Food Craving Inventory (FCI) is a 28-item self-report measure to quantify the frequency of trait food cravings for different groups of foods over the previous four weeks on a 5-point response format (never/rarely/sometimes/often/always) (White et al., 2002). The FCI has shown good content, concurrent, construct and discriminant validity (White et al., 2002), and demonstrated internal consistency values ranging from 0.73-0.85 in our study. Four scores are calculated pertaining to cravings for high fat foods (fats), sweets, carbohydrates/starches, and fast food fats. A total craving score is also derived. Scores range from 1 to 5 and higher scores for each sub-scale indicate higher cravings for each respective food group (White et al., 2002).
The Food Craving Questionnaire State (FCQ-S) is a 15-item measure that assesses the strength of state food cravings at the moment of administration on a 5-point response format (strongly disagree/disagree/neutral/agree/strongly agree) (Cepeda-Benito, Gleaves, Williams, & Erath, 2000). The FCQ-S has demonstrated good validity in non-clinical populations at the moment of provision (Cepeda-Benito et al., 2000; Moreno, Rodríguez, Fernandez, Tamez, & Cepeda-Benito, 2008), and also presented good internal consistency in our study (coefficient alpha: 0.80-0.93). Desire, anticipation positive, anticipation negative, lack of control, and hunger sub-scale scores are measured. Scores for each sub-scale range from 3-15 for each of these subscales and greater scores denote higher levels of craving in response to each momentary situation or psychological and physiological state (Nijs, Franken, & Muris, 2007).
The 20-item Weight Efficacy Lifestyle Questionnaire (WEL) measures self-efficacy for regulating food intake across a number of situations (Clark, Abrams, Niaura, Eaton, & Rossi, 1991). Each item consists of a statement expressing the ability to resist or control eating in particular situations (e.g. I can resist eating when I am watching TV). Participants rate their confidence to complete each item on 10-point Likert scale ranging from 0 (not confident) to 9 (very confident). The WEL exhibited good internal consistency in our study (coefficient alpha: 0.70-0.88), and has good validity and test-retest reliability (Navidian, Abedi, Baghban, Fatehizadeh, & Poursharifi, 2009). Weight self-efficacy includes 5 sub-scales: food availability, negative emotions, social pressure, physical discomfort and positive activities, and a total score (Clark et al., 1991). The possible range of summed scores on each sub-scale is 10-40, with higher scores representing greater self-efficacy (Clark et al., 1991).
2.5. Anthropometry
At baseline, month 12 and month 24, body weight, fat mass and fat free mass were measured. Calibrated scales standardized across study sites (Scale Tronix 5200; Welch Allyn) were used to measure participants body weight. Body weight measurements occurred in the morning after an overnight fast (≥ 8 h), with participants only wearing a pre-weighed hospital gown. Fat mass and fat free mass were measured by dual-energy X-ray absorptiometry (DXA) scanners (Hologic 4500A, Delphi W, or Discovery A; Bedford; MA), with subject positioning, scan mode and analysis standardized.
2.6. Energy intake and percent CR
Energy intake was calculated using the intake balance methods, which ascertains energy intake through the addition of doubly labelled water-determined energy expenditure and the change in body composition (Racette et al., 2012). Energy intake values were then used to calculate percent CR at months 12 and 24.
2.7. Statistical analysis
Statistical methods undertaken in CALERIE 2 have been described before (Ravussin et al., 2015). To summarize, intention-to-treat (ITT) analysis was utilized to account for noncompliance and participant withdrawal (Gupta, 2011). Repeated-measures analysis of covariance was applied, with change from baseline as the dependent variable. Independent variables were group (CR vs. AL) and time (study visit), and treatment x time interaction. Study site, sex, BMI stratum, and baseline values were used as covariates. Between-group differences in changes in the dependent variables were tested by defining contrasts among regression parameters. The predicted mean changes ± SE are the adjusted values from this model. A gatekeeping strategy was used to control the type-1 error rate (Dmitrienko, Millen, Brechenmacher, & Paux, 2011). A hierarchical structure was identified among hypotheses of interest; specifically, the treatment x time interaction was tested first at α = 0.05, and if not significant, the main effects were tested. Specific within- and between-group comparisons were tested at α = 0.05 only if significance was obtained at α = 0.05 at the higher level in the hierarchy. Otherwise, the Bonferroni correction was used. Main effects for sex, sex x treatment interactions, and sex x treatment x time interactions were also assessed. Absolute standardized effect sizes (ES) were calculated by dividing the difference between the groups (CR vs. AL group) with the pooled standard deviation (Cohen, 1988). An ES of 0.2 was considered the minimum important difference for all outcome measures, 0.5 moderate and 0.8 large. In the CR group, spearman correlations were calculated to examine if baseline measures and change in measures from baseline to month 24 were associated with percent CR and absolute weight change from baseline to month 24. Data analysis was performed using SAS version 9.2 (SAS Institute Inc.). Values are mean ± SE, unless stated otherwise. Statistical tests were 2-tailed and significance threshold was set at P < 0.05, except for spearman correlations, which was P < 0.01 to account for spurious correlations.
3. Results
3.1. Participants
A detailed summary of participant characteristics is presented elsewhere (Ravussin et al., 2015), though key characteristics are presented in Table 1. Initially, 220 participants were randomized, but two participants dropped out prior to commencing the intervention; thus, 218 participants (CR, 143; AL 75) were included in the ITT analyses. The majority were female (69.7%) and the racial distribution was 77.1% White, 11.9% Black, and 11.0% other. Mean ± SD age and BMI were 37.9 ± 7.2 yr and 25.1 ± 1.7 kg/m2, respectively. No significant differences in baseline characteristics were found (P ≥ 0.34; Table 1).
Table 1.
Baseline demographic and anthropometric measures.
| Characteristic | AL (n = 75) | CR (n = 143) | P-value |
|---|---|---|---|
| Age (yrs) | 37.9 (7.0) | 38.0 (7.3) | 0.89 |
| Sex | |||
| Male (n) | 22 (29.3) | 44 (30.8) | 0.88 |
| Female (n) | 53 (70.7) | 99 (69.2) | |
| Race | |||
| White (n) | 57 (76.0) | 111 (77.6) | |
| African American (n) | 11 (14.7) | 15 (10.5) | 0.62 |
| Othera (n) | 7 (9.3) | 17 (11.9) | |
| Height (cm) | 168.4 (8.3) | 168.9 (8.6) | 0.93 |
| Mass (kg) | 71.3 (8.6) | 71.8 (9.2) | 0.95 |
| BMI (kg/m2) | 25.1 (1.6) | 25.2 (1.8) | 0.90 |
| Body fat (%) | 33.6 (6.6) | 32.9 (6.1) | 0.34 |
| Fat-free mass (kg) | 47.6 (8.6) | 48.5 (9.2) | 0.48 |
Abbreviations: AL, ad libitum; CR, calorie restriction; BMI, body mass index.
Values are mean (± SD), except for Sex and Race, which are mean (%).
Includes American Indian/Alaska Native, Asian, more than one race, and unknown.
3.2. Weight loss and percent CR achieved
The CR group lost 8.3 ± 0.3 kg (11.5% of baseline body mass) and 7.6 ± 0.3 kg (10.4% of baseline body mass) at months 12 and 24, respectively, whereas the AL group exhibited almost no change in weight at 12 (−0.4 ± 0.4 kg; P < 0.01 for CR vs AL group) and 24 months (0.4 ± 0.5 kg; P < 0.01 for CR vs AL group) (Das et al., 2017). Males in the CR group lost 1.0 ± 0.5 kg more than females at 24 months (P = 0.04) (Das et al., 2017). Mean CR attained in the CR group was 15.2 ± 0.7% at month 12 and 11.9 ± 0.7% at month 24. The AL group experienced 1.3 ± 1.1% CR at month 12 and 0.8 ± 1.0% at month 24 (P < 0.01 for CR vs AL group at both time points) (Ravussin et al., 2015).
3.3. Questionnaires
As shown in Tables 2, 3, 4, and 5, no significant treatment group differences were detected for baseline scores on any questionnaires (P ≥ 0.17).
Table 2.
Baseline values and estimated change in measures of Eating Inventory in the CR and AL groups at 12 and 24 months.
| Outcome | AL Mean (s.e.)a | Within Group P-valueb | CR Mean (s.e)a | Within-Group P-valueb | Between-group Mean (s.e) | Between-group P-valueb | Between-group ES |
|---|---|---|---|---|---|---|---|
| Eating Inventory | |||||||
| Dietary Restraint | |||||||
| Baseline | 9.3 (0.47) | 9.7 (0.31) | 0.52 | ||||
| ΔMonth 12 | −0.26 (0.31) | 0.79 | 4.70 (0.23) | <0.01 | 4.96 (0.37) | <0.01* | 1.98 |
| ΔMonth 24 | −1.21 (0.32) | <0.01 | 4.80 (0.25) | <0.01 | 6.01 (0.39) | <0.01* | 2.31 |
| Disinhibition | |||||||
| Baseline | 4.6 (0.32) | 4.9 (0.23) | 0.36 | ||||
| ΔMonth 12 | −0.24 (0.23) | 0.60 | 0.68 (0.17) | <0.01 | 0.91 (0.27) | <0.01* | 0.49 |
| ΔMonth 24 | −0.02 (0.23) | 1.00 | 0.68 (0.18) | <0.01 | 0.70 (0.28) | 0.01* | 0.37 |
| Perceived Hunger | |||||||
| Baseline | 2.9 (0.28) | 3.7 (0.26) | 0.17 | ||||
| ΔMonth 12 | −0.38 (0.24) | 0.22 | −0.32 (0.18) | 0.15 | 0.07 (0.29) | 1.00 | 0.03 |
| ΔMonth 24 | −0.35 (0.25) | 0.33 | −0.37 (0.19) | 0.10 | −0.02 (0.31) | 1.00 | −0.01 |
Abbreviations: AL, ad libitum; CR, calorie restriction.
Baseline values are observed mean ± SE. Estimated change in outcome measures were determined through an ITT approach to determine whether change on the outcome variables differed between groups.
P-values reflect Bonferroni correction.
significant between-group difference between ad libitum and calorie restriction groups.
Table 3.
Baseline values and estimated change in sub scores of Food Craving Inventory in the CR and AL groups at 12 and 24 months.
| Outcome | AL Mean (s.e.)a | Within-Group P-valueb | CR Mean (s.e)a | Within-Group P-valueb | Between-group Mean (s.e.) | Between-group P-valueb | Between-group ES |
|---|---|---|---|---|---|---|---|
| Food Craving Inventory | |||||||
| Carbohydrate Score | |||||||
| Baseline | 1.67 (0.07) | 1.65 (0.05) | 0.51 | ||||
| ΔMonth 12 | 0.03 (0.06) | 1.0 | 0.08 (0.04) | 0.11 | 0.05 (0.07) | 0.85 | 0.12 |
| ΔMonth 24 | 0.03 (0.07) | 1.0 | 0.02 (0.05) | 1.0 | −0.00 (0.08) | 1.0 | −0.01 |
| Sweets Score | |||||||
| Baseline | 1.91 (0.07) | 1.87 (0.05) | 0.59 | ||||
| ΔMonth 12 | −0.01 (0.06) | 1.0 | 0.12 (0.05) | 0.03 | 0.12 (0.08) | 0.22 | 0.23 |
| ΔMonth 24 | −0.06 (0.07) | 0.71 | 0.09 (0.05) | 0.17 | 0.15 (0.08) | 0.13 | 0.27 |
| Fats Score | |||||||
| Baseline | 1.45 (0.05) | 1.40 (0.04) | 0.36 | ||||
| ΔMonth 12 | 0.04 (0.04) | 0.68 | −0.03 (0.03) | 0.84 | −0.07 (0.05) | 0.39 | −0.19 |
| ΔMonth 24 | 0.02 (0.05) | 1.0 | −0.03 (0.04) | 0.91 | −0.04 (0.06) | 0.91 | −0.11 |
| Fast Food Score | |||||||
| Baseline | 2.00 (0.08) | 2.00 (0.06) | 0.92 | ||||
| ΔMonth 12 | 0.04 (0.06) | 1.0 | 0.04 (0.05) | 0.72 | 0.01 (0.08) | 1.0 | 0.02 |
| ΔMonth 24 | 0.02 (0.07) | 1.0 | 0.02 (0.05) | 1.0 | −0.00(0.08) | 1.0 | −0.01 |
| FCI Total Score | |||||||
| Baseline | 1.72 (0.05) | 1.69 (0.04) | 0.48 | ||||
| ΔMonth 12 | 0.02 (0.04) | 1.0 | 0.06 (0.03) | 1.0 | 0.03 (0.05) | 1.0 | 0.10 |
| ΔMonth 24 | −0.00 (0.05) | 1.0 | 0.03 (0.04) | 1.0 | 0.03 (0.06) | 1.0 | 0.07 |
Abbreviations: AL, ad libitum; CR, calorie restriction.
Baseline values are observed mean ± SE. Estimated change in outcome measures were determined through an ITT approach to determine whether change on the outcome variables differed between groups.
P-values reflect Bonferroni correction.
significant between-group difference between ad libitum and calorie restriction groups.
Table 4.
Baseline values and estimated change in sub scores of Food Craving Questionnaire-State in the CR and AL groups at 12 and 24 months.
| Outcome | AL Mean (s.e.)a | Within-Group P-valueb | CR Mean (s.e)a | Within-Group P-valueb | Between-group Mean (s.e.) | Between-group P-valueb | Between-group ES |
|---|---|---|---|---|---|---|---|
| Food Craving Questionnaire | |||||||
| State Desire Score | |||||||
| Baseline | 5.71 (0.32) | 5.39 (0.21) | 0.43 | ||||
| ΔMonth 12 | 1.12 (0.37) | <0.01 | 1.79 (0.28) | <0.01 | 0.67 (0.45) | 0.14 | 0.22 |
| ΔMonth 24 | 0.49 (0.35) | 0.32 | 1.15 (0.27) | <0.01 | 0.65 (0.43) | 0.13 | 0.23 |
| State Anticipation Positive Score | |||||||
| Baseline | 5.25 (0.25) | 5.15 (0.19) | 0.57 | ||||
| ΔMonth 12 | 0.94 (0.29) | <0.01 | 1.01 (0.22) | <0.01 | 0.07 (0.35) | 1.0 | 0.03 |
| ΔMonth 24 | 0.51 (0.28) | 0.15 | 0.77 (0.22) | <0.01 | 0.26 (0.35) | 0.91 | 0.11 |
| State Anticipation Negative Score | |||||||
| Baseline | 6.08 (0.33) | 5.54 (0.21) | 0.25 | ||||
| ΔMonth 12 | 0.29 (0.28) | 0.62 | 0.61 (0.21) | 0.01 | 0.33 (0.34) | 0.68 | 0.14 |
| ΔMonth 24 | 0.25 (0.29) | 0.79 | 0.33 (0.23) | 0.30 | 0.08 (0.36) | 1.00 | 0.03 |
| State Lack of Control Score | |||||||
| Baseline | 4.36 (0.19) | 4.31 (0.15) | 0.67 | ||||
| ΔMonth 12 | 0.03 (0.23) | 1.0 | 0.85 (0.17) | <0.01 | 0.82 (0.28) | <0.01* | 0.44 |
| ΔMonth 24 | −0.05(0.22) | 1.0 | 0.47 (0.17) | 0.01 | 0.52 (0.27) | 0.06 | 0.29 |
| State Hunger Score | |||||||
| Baseline | 6.96 (0.38) | 6.84 (0.27) | 0.79 | ||||
| ΔMonth 12 | −0.18 (0.27) | 1.0 | 0.65 (0.20) | <0.01 | 0.83 (0.33) | 0.01* | 0.37 |
| ΔMonth 24 | −0.02 (0.30) | 1.0 | 0.34 (0.24) | 0.31 | 0.36 (0.37) | 0.34 | 0.14 |
Abbreviations: AL, ad libitum; CR, calorie restriction.
Baseline values are observed mean ± SE. Estimated change in outcome measures were determined through an ITT approach to determine whether change on the outcome variables differed between groups.
P-values reflect Bonferroni correction.
significant between-group difference between ad libitum and calorie restriction groups.
Table 5.
Baseline values and estimated change in sub-scales of the Weight Efficacy Lifestyle Questionnaire in the CR and AL groups at 12 and 24 months.
| Outcome | AL Mean (s.e.)a | Within-Group P-valueb | CR Mean (s.e)a | Within-Group P-valueb | Between-group Mean (s.e.) | Between-group P-valueb | Between-group ES |
|---|---|---|---|---|---|---|---|
| Weight Efficacy Lifestyle Questionnaire | |||||||
| Negative Emotions Score | |||||||
| Baseline | 29.0 (0.79) | 30.3 (0.49) | 0.19 | ||||
| ΔMonth 12 | −0.05 (0.57) | 1.0 | −0.17 (0.43) | 1.0 | −0.12 (0.68) | 1.0 | −0.03 |
| ΔMonth 24 | −1.18 (0.59) | 0.09 | −0.35 (0.45) | 0.88 | 0.83 (0.71) | 0.49 | 0.17 |
| Availability Score | |||||||
| Baseline | 25.8 (0.75) | 26.0 (0.57) | 0.52 | ||||
| ΔMonth 12 | −1.48 (0.69) | 0.07 | −0.34 (0.52) | 1.0 | 1.14 (0.84) | 0.35 | 0.20 |
| ΔMonth 24 | −1.01 (0.68) | 0.27 | −0.13 (0.52) | 1.0 | 0.88 (0.83) | 0.57 | 0.16 |
| Social Pressure Score | |||||||
| Baseline | 28.3 (0.61) | 28.0 (0.55) | 0.86 | ||||
| ΔMonth 12 | −0.82 (0.65) | 0.42 | 0.90 (0.49) | 0.13 | 1.72 (0.78) | 0.03* | 0.32 |
| ΔMonth 24 | −2.27 (0.65) | <0.01 | 1.18 (0.50) | 0.04 | 3.46 (0.79) | <0.01* | 0.65 |
| Physical Discomfort Score | |||||||
| Baseline | 29.9 (0.62) | 30.0 (0.45) | 0.74 | ||||
| ΔMonth 12 | −1.09 (0.56) | 0.10 | 0.54 (0.42) | 0.40 | 1.63 (0.67) | 0.02* | 0.35 |
| ΔMonth 24 | −2.08 (0.59) | <0.01 | 0.36 (0.45) | 0.85 | 2.44 (0.72) | <0.01* | 0.50 |
| Positive Activity Score | |||||||
| Baseline | 31.1 (0.43) | 31.0 (0.39) | 0.61 | ||||
| ΔMonth 12 | −0.68 (0.49) | 0.34 | 0.02 (0.37) | 1.0 | 0.70 (0.60) | 0.24 | 0.17 |
| ΔMonth 24 | −0.91 (0.44) | 0.08 | 0.35 (0.34) | 0.62 | 1.25 (0.54) | 0.02* | 0.35 |
| Global Score | |||||||
| Baseline | 143.9 (2.68) | 145.6 (2.14) | 0.44 | ||||
| ΔMonth 12 | −3.15 (2.42) | 0.39 | 1.13 (1.80) | 1.0 | 4.27 (2.91) | 0.14 | 0.22 |
| ΔMonth 24 | −7.15 (2.35) | <0.01 | 1.49 (1.81) | 0.82 | 8.64 (2.86) | <0.01* | 0.45 |
Abbreviations: AL, ad libitum; CR, calorie restriction.
Baseline values are observed mean ± SE. Estimated change in outcome measures were determined through an ITT approach to determine whether change on the outcome variables differed between groups.
P-values reflect Bonferroni correction.
significant between-group difference between ad libitum and calorie restriction groups.
3.4. Eating Inventory
The CR group displayed a large increase in dietary restraint at 12 and 24 months compared to the AL group (P < 0.01; ES ≥ 1.98; Table 2). Compared to the AL group, the CR group displayed a small increase in disinhibition at 12 and 24 months of less than 1 point (P < 0.01; ES ≥ 0.37; Table 2). There was no main effect of time or treatment x time effect for change in perceived hunger (P = 1.00; ES < 0.03). No sex x treatment interactions were observed for the change in constructs of the Eating Inventory (P ≥ 0.05; data not shown).
3.5. Food Craving Inventory
The ITT analyses revealed no treatment effect or treatment x time interaction for change in carbohydrate, sweets, fats, fast food fats or total cravings (P ≥ 0.13; ES ≤ 0.27, Table 3). There was a sex x treatment x time interaction for change in carbohydrate and fat cravings. Specifically, compared to change in carbohydrate (CR: 0.11 ± 0.06 [P = 0.07] vs AL: −0.01 ± 0.08 [P = 0.22]) and fat (CR: −0.02 ± 0.04 [P = 0.58] vs AL: −0.09 ± 0.05 [P = 0.12]) cravings in females, males experienced a reduction in cravings for carbohydrate (CR: −0.18 ± 0.09 [P = 0.06] vs AL: 0.10 ± 0.12 [P = 0.06]; P = 0.04; Figure 1A & 1B) and fats (CR: −0.05 ± 0.07 [P = 0.46] vs AL: 0.25 ± 0.09 [P < 0.01]; P = 0.03; Figure 1C & 1D) in the CR group compared to the AL group at month 24. No other sex x treatment x time interactions were seen for other food cravings (P > 0.05; Supplementary Table 1 and 2).
Figure 1.
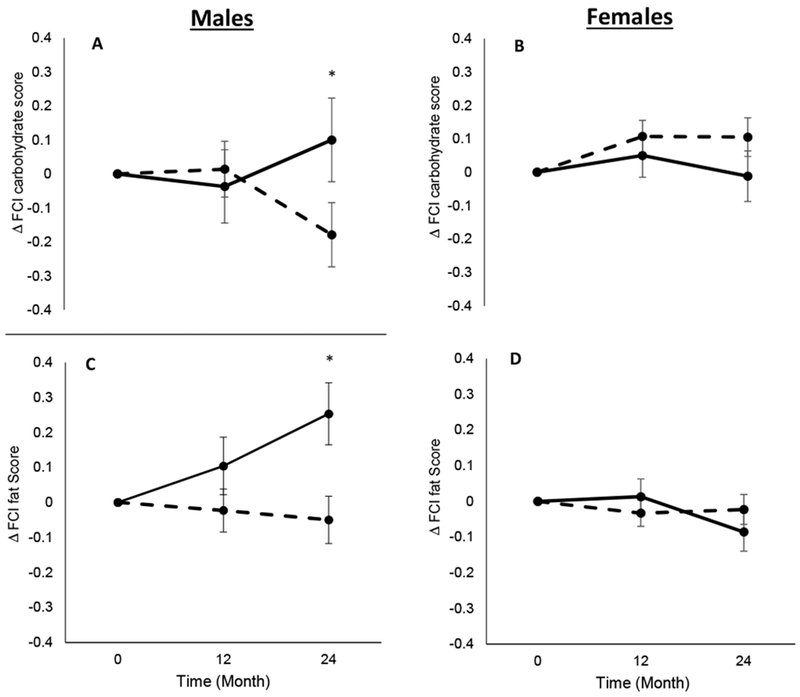
Change in Food Craving Inventory (FCI) carbohydrate score in males (1A) and females (1B), and change in Food Craving Inventory (FCI) fat score in males (1C) and females (1D). Dashed lines represent the calorie restriction (CR) group and solid lines represent the ad libitum (AL) group. * P < 0.05 for sex x treatment x time interaction.
3.6. Food Craving Questionnaire State
The CR and AL groups did not differ on change in desire, anticipation positive and anticipation negative scores (P ≥ 0.13; ES < 0.23; Table 4). The CR group displayed a greater increase in the lack of control score and the state hunger score than the AL group at 12 months (P ≤ 0.01; ES ≥ 0.37). Sex x treatment interactions were not demonstrated for change in any of the FCQ-S sub-scales (P ≥ 0.05; data not shown).
3.7. Weight Efficacy Lifestyle Questionnaire
Analysis of the change in WEL scores revealed a significant treatment x time interaction for the social pressure score, with increased self-efficacy in the CR group at 12 and 24 months (P ≤ 0.03; ES > 0.32; Table 5). Likewise, the CR group had an increased self-efficacy on the physical discomfort scale compared to the AL group at 12 and 24 months (P ≤ 0.02; ES ≥ 0.35), and the positive activity score at month 24 (P = 0.02; ES = 0.32; Table 5). No differences between the CR group and AL group were demonstrated for change in availability score and negative emotion score at month 12 and 24 (P ≥ 0.35; ES ≤ 0.20; Table 5). The change in global self-efficacy score was higher in the CR compared to the AL at month 24 (P < 0.01; ES = 0.45; Table 5). There was a significant sex x treatment x time interaction for change in social pressure score (P = 0.02; Figure 2A & 2B) and a significant sex main effect for WEL global score (P = 0.03; Figure 2C & 2D). For both endpoints, CR males had a greater change in values compared to AL at month 24 (P < 0.01), while both CR and AL females had decreased values, but CR females had significantly smaller decreases than AL females at month 24 (P < 0.01; Supplementary Table 1 and 2).
Figure 2.
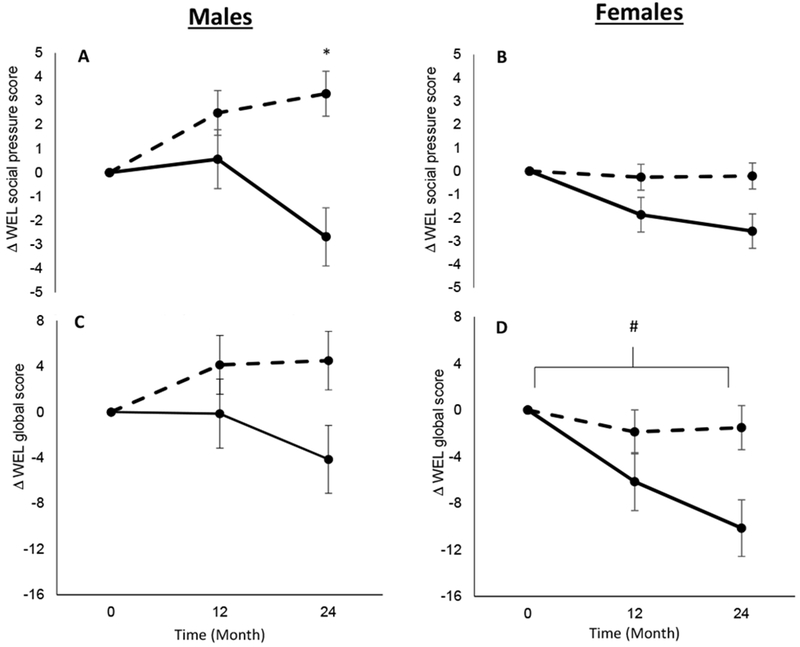
Change in the Weight Efficacy Lifestyle Questionnaire (WEL) social pressure sub-score in males (2A) and females (2B), and change in the Weight Efficacy Lifestyle Questionnaire (WEL) global score in males (2C) and females (2D). Dashed lines represent the calorie restriction (CR) group and solid lines represent the ad libitum (AL) group. * P < 0.05 for sex x treatment x time effect. # P < 0.05 for main effect of sex.
3.8. Spearman correlations
Modest negative correlations were identified between change in some WEL sub-scales from baseline to month 24 and change in weight from baseline. Changes in availability (ρ = −0.34, P < 0.01), social pressure (ρ = −0.24, P < 0.01), and the global score (ρ = −0.32, P < 0.01) were related to change in body weight at month 24. There were no other significant correlations between change in outcome measures from baseline to month 24 and change in weight from baseline to month 24 (Supplementary Figure 2). Similarly, no significant correlations were observed between change in questionnaire measures from baseline to month 24 and percent CR attained at month 24 (Supplementary Figure 2).
4. Discussion
Over 24-months, in this sample of individuals without obesity, the CR group experienced a marked increase in dietary restraint and self-efficacy, as well as a small increase in disinhibition and a transient increase at month 12 in appetite/state food cravings measured with the FCQ-S. A three-way interaction indicated that trait cravings, or cravings for specific types of foods, decreased only in males in the CR group compared to the AL group at month 24. Increased self-efficacy was associated with greater weight loss at month 24.
Our results show that self-efficacy increases in response to a CR intervention in participants without obesity. This was evident for self-efficacy to not eat in response to social pressure or physical discomfort. Furthermore, our results indicate that change in self-efficacy was related to the degree of weight loss in the CR group. This is consistent with other studies that included individuals with obesity (P. D. Martin et al., 2004; Warziski et al., 2008), and indicates that increasing self-efficacy for food intake regulation is an important component of effective weight management across a range of body weights. While we cannot rule out that changes in body weight altered self-efficacy ratings, positive changes in self-efficacy and the association between change in self-efficacy and weight change are likely, at least in part, driven by the behavioral intervention that promoted adherence to participants’ individual CR goals (Rickman et al., 2011). These strategies utilized components of social cognitive theory to increase self-efficacy in relation to eating situations (Bandura, 1997; Rickman et al., 2011). Specifically, CR participants were coached on behavioral methods to moderate food consumption during social situations, physical discomfort and periods of ample food availability, whereas the AL group received no intervention (Rickman et al., 2011). Although the effectiveness of similar interventions on behavioral change have been mixed (Burke et al., 2015), our results indicate that strategies to enhance self-efficacy for regulating energy intake were effective in assisting weight loss in humans without obesity and who are attempting CR to attenuate aging.
Our study adds to the literature by showing that there is a large increase in dietary restraint, measured via the Eating Inventory, over two years of CR in individuals without obesity. This increase in dietary restraint has been reported previously in response to 6 months of CR among individuals were overweight, and is strongly implicated in negating any elevations in hunger or desire to eat during weight loss (Williamson et al., 2007). Our results extend these findings by indicating that dietary restraint remains elevated during periods of weight loss and weight maintenance or mild weight regain typically associated with prolonged CR efforts. Not all studies find that dietary restraint is associated with food intake or weight control, however (Stice, Cooper, Schoeller, Tappe, & Lowe, 2007), which is consistent with our correlations showing no relationship between dietary restraint and CR and weight loss. Additionally, others have also shown that dietary restraint can lead to weight regain, especially in tandem with strategies considered unhealthy such as skipping meals (Lowe, Doshi, Katterman, & Feig, 2013; Savage & Birch, 2010). However, our intervention incorporated strategies normally considered positive such as increased consumption of foods with low energy density and portion size control. Additionally, dietary restraint was assessed solely in relation food intake via the Eating Inventory, which is notable as dietary restraint is positive in controlling weight when exclusively in the context of limiting or intending to limit food intake (Schaumberg et al., 2016). We therefore opine that elevated restraint in restricting food intake is important during CR for longevity in individuals without obesity, and should be advocated when inhibiting unhealthy foods as part of a controlled weight management lifestyle.
Notwithstanding the rise in self-efficacy and dietary restraint, our findings suggest that CR transiently increased self-reported state hunger and lack of controlled eating, at least as measured by the FCQ-S, and increased disinhibition measured by the Eating Inventory. This is at odds with evidence suggesting that state hunger is reduced (Wadden et al., 1987) in response to CR, but is in accord with others showing that state hunger is increased during CR (Polidori et al., 2016). In combination with an increase in dietary restraint, a rise in these constructs are associated with poor weight loss, an increase in food cravings and eating disorders (Schaumberg et al., 2016). However, the rise in state hunger on the FCQ-S in the CR group had receded by month 24, suggesting that people undergoing CR habituate and experience less hunger over time even though CR is maintained. The increase in disinhibition in the CR group was also small (less than 1 point), the mean baseline value was low (4.9), and the higher mean values at months 12 and 24 remained in the non-clinical range (Stunkard & Messick, 1985). We are therefore confident that the clinical implications of the elevation in disinhibited eating with CR is negligible (Stunkard & Messick, 1985), even though it was accompanied by increased restraint. This conclusion is supported by the careful monitoring of participants for eating disorder symptoms and the failure to detect the development of eating disorders during the trial.
Although some evidence indicates otherwise (Jakubowicz et al., 2012), the majority of studies in individuals with obesity indicates that diets involving CR suppress trait food cravings through a deconditioning model, whereby the conditioned consumption of certain foods with internal and external stimuli is removed when food intake or intake of different food groups are actively limited (Apolzan et al., 2017; Kahathuduwa et al., 2017; C. K. Martin et al., 2006; Myers, Martin, & Apolzan, 2018). Our results, however, indicated that only males experienced a reduction in cravings for carbohydrates and fats in the CR group compared to the AL group at month 24. The lack of robust decreases in food cravings across the sample could be due to the lower BMI of the cohort who exhibited low levels of food cravings at baseline. Indeed, many of the craving scores from the FCI had little room to decrease, but ample room to increase (the lowest score possible is 1, with a maximum of 5), indicating that the failure to detect increases in food cravings is noteworthy. Sex-based differences in food cravings have been documented, however, with females reporting higher and more frequent food cravings overall compared to males (Lafay et al., 2001). Furthermore, consonant with our findings, recent work has reported that reductions in food cravings after CR of 12 weeks were smaller in females compared to males (Kahathuduwa et al., 2017). These could occur because of a complex interplay between sociological factors and biological differences related to sex hormones (Hormes & Timko, 2011) and brain regions linked to cravings (Wang et al., 2009). In addition to food cravings, males displayed greater elevations in self-efficacy, particularly when coping with social pressures to eat. This is supportive of studies in individuals who are overweight or obese showing that males report higher levels of self-efficacy during dietary interventions (Linde et al., 2004; Presnell, Pells, Stout, & Musante, 2008). As a whole, though further studies are warranted in older participants who, in the case of females, are affected by menopause, which may alter eating behaviors (Drobnjak, Atsiz, Ditzen, Tuschen-Caffier, & Ehlert, 2014) and food cravings (Hormes & Rozin, 2009), these findings could suggest that females require additional forms of behavioral and psychological interventions to improve craving regulation and self-efficacy during CR for improved health span.
A limitation of our study is the failure of the CR group to achieve 25% CR over two years, though the CR group lost 10.4% of weight at month 24 and the amount of weight regain between months 12 and 24 was modest and participants demonstrated a high degree of weight maintenance. Moreover, though the individual and group sessions constituted a significant component of the intervention, we are unable to elucidate if changes in our outcomes were the result of CR in itself or the behavioral facets of the CR regimen. Strengths of the study include the randomization controlled trial design and use of well-validated instruments to assess the constructs of interest.
5. Conclusion
In conclusion, our results from CALERIE 2 suggest that CR results in robust increases in dietary restraint and self-efficacy among participants without obesity. Although there were elevations in disinhibition and a transient increase in hunger measured by the FCQ-S, the values were low and remained in non-clinical levels. Our findings suggest that CR regimens which enhance restraint and self-efficacy for regulating food intake are important for weight loss and maintenance in individuals without obesity and are attempting to adopt prolonged CR as a means of improving health span.
Supplementary Material
ACKNOWLEDGEMENTS:
We are indebted to the study participants who invested over 2 years to participate in this clinical trial. The efforts of the CALERIE data coordinating center (James Rochon and William Krauss) are also acknowledged and greatly appreciated. CALERIE 2 data, including the data reported herein, can be accessed at https://calerie.duke.edu/.
FUNDING: The research was supported by the National Institute on Aging and the National Institute of Diabetes and Digestive and Kidney Diseases, National Institutes of Health (grants U01AG022132, U01AG020478, U01AG020487, and U01AG020480); National Obesity Research Center (grant P30 DK072476), sponsored by the National Institute of Diabetes and Digestive and Kidney Diseases; and the National Institute of General Medical Sciences of the National Institutes of Health, which funds the Louisiana Clinical and Translational Science Center (grant 1 U54 GM104940).
ABREVIATIONS:
- CR
calorie restriction
- CALERIE 2
Comprehensive Assessment of Long-term Effects of Reducing Intake of Energy Phase 2
- AL
ad libitum
- BMI
body mass index
- FCI
Food Craving Inventory
- FCQ-S
Food Craving Questionnaire State
- WEL
Weight Efficacy Lifestyle Questionnaire
- ITT
intention-to-treat
- ES
Effect size
Footnotes
Publisher's Disclaimer: This is a PDF file of an unedited manuscript that has been accepted for publication. As a service to our customers we are providing this early version of the manuscript. The manuscript will undergo copyediting, typesetting, and review of the resulting proof before it is published in its final citable form. Please note that during the production process errors may be discovered which could affect the content, and all legal disclaimers that apply to the journal pertain.
CLINICAL TRIAL REGISTRATION: ClinicalTrials.gov, Identifier:
DISCLOSURE: The authors declare no conflict of interest.
References
- Anton SD, Han H, York E, Martin CK, Ravussin E, & Williamson DA (2009). Effect of calorie restriction on subjective ratings of appetite. Journal of Human Nutrition and Dietetics, 22, 141–147. [DOI] [PMC free article] [PubMed] [Google Scholar]
- Apolzan JW, Myers CA, Champagne CM, Beyl RA, Raynor HA, Anton SA, … Martin CK. (2017). Frequency of Consuming Foods Predicts Changes in Cravings for Those Foods During Weight Loss: The POUNDS Lost Study. Obesity, 25, 1343–1348. [DOI] [PMC free article] [PubMed] [Google Scholar]
- Bandura A (1997). Self Efficacy: the exercise of control. New York: W.H. Freeman and Company. [Google Scholar]
- Barnard ND, Gloede L, Cohen J, Jenkins DJA, Turner-McGrievy G, Green AA, & Ferdowsian H (2009). A low-fat vegan diet elicits greater macronutrient changes, but is comparable in adherence and acceptability, compared with a more conventional diabetes diet among individuals with type 2 diabetes. Journal of the American Dietetic Association, 109(2), 263–272. [DOI] [PMC free article] [PubMed] [Google Scholar]
- Boswell RG, & Kober H (2016). Food cue reactivity and craving predict eating and weight gain: A meta-analytic review. Obesity Reviews, 17, 159–177. [DOI] [PMC free article] [PubMed] [Google Scholar]
- Burke LE, Ewing LJ, Ye L, Styn M, Zheng Y, Music E, … Sereika SM. (2015). The SELF trial: A self-efficacy-based behavioral intervention trial for weight loss maintenance. Obesity, 23, 2175–2182. [DOI] [PMC free article] [PubMed] [Google Scholar]
- Cepeda-Benito A, Gleaves DH, Williams TL, & Erath SA (2000). The development and validation of the state and trait food-cravings questionnaires. Behavior Therapy, 31, 151–173. 10.1016/S0005-7894(00)80009-X [DOI] [PubMed] [Google Scholar]
- Clark MM, Abrams DB, Niaura RS, Eaton CA, & Rossi JS (1991). Self-efficacy in weight management. Journal of Consulting and Clinical Psychology, 59(5), 739–744. [DOI] [PubMed] [Google Scholar]
- Cohen J (1988). Statistical power analysis for the behavioral sciences. Statistical Power Analysis for the Behavioral Sciences. [Google Scholar]
- Das S, Roberts S, Bhapkar M, Villareal D, Fontana L, Martin C, … Redman L. (2017). Body-composition changes in the Comprehensive Assessment of Long-term Effects of Reducing Intake of Energy (CALERIE)-2 study: a 2-y randomized controlled trial of calorie restriction in nonobese humans. The American Journal of Clinical Nutrition, 105(4), 913–927. [DOI] [PMC free article] [PubMed] [Google Scholar]
- Delahanty LM, Meigs JB, Hayden D, Williamson DA, & Nathan DM (2002). Psychological and behavioral correlates of baseline BMI in the Diabetes Prevention Program (DPP). Diabetes Care, 25, 1992–1998. [DOI] [PMC free article] [PubMed] [Google Scholar]
- Dmitrienko A, Millen BA, Brechenmacher T, & Paux G (2011). Development of gatekeeping strategies in confirmatory clinical trials. Biometrical Journal, 53, 875–893. [DOI] [PubMed] [Google Scholar]
- Drobnjak S, Atsiz S, Ditzen B, Tuschen-Caffier B, & Ehlert U (2014). Restrained eating and self-esteem in premenopausal and postmenopausal women. Journal of Eating Disorders, 2(1), 23. [DOI] [PMC free article] [PubMed] [Google Scholar]
- Finer N (2001). Low-Calorie Diets and Sustained Weight Loss. Obesity, 9(S11), 290S–294S. [DOI] [PubMed] [Google Scholar]
- Gupta S (2011). Intention-to-treat concept: A review. Perspectives in Clinical Research, 2(3), 109–112. [DOI] [PMC free article] [PubMed] [Google Scholar]
- Hormes JM, & Rozin P (2009). Perimenstrual chocolate craving. What happens after menopause? Appetite, 53, 256–259. [DOI] [PubMed] [Google Scholar]
- Hormes JM, & Timko CA (2011). All cravings are not created equal. Correlates of menstrual versus non-cyclic chocolate craving. Appetite, 57(1), 81–92. [DOI] [PubMed] [Google Scholar]
- Jakubowicz D, Froy O, Wainstein J, & Boaz M (2012). Meal timing and composition influence ghrelin levels, appetite scores and weight loss maintenance in overweight and obese adults. Steroids, 77(4), 323–331. [DOI] [PubMed] [Google Scholar]
- Kahathuduwa CN, Binks M, Martin CK, & Dawson JA (2017). Extended calorie restriction suppresses overall and specific food cravings: a systematic review and a meta-analysis. Obesity Reviews, 18, 1122–1135. [DOI] [PMC free article] [PubMed] [Google Scholar]
- Kutlesic V, Williamson DA, Gleaves DH, Barbin J, & Murphy-Eberenz K (1998). The Interview for the Diagnosis of Eating Disorders IV: Application to DSM-IV diagnostic criteria. Psychological Assessment, 10, 41–48. [Google Scholar]
- Lafay L, Thomas F, Mennen L, Charles MA, Eschwege E, Borys JM, & Basdevant A (2001). Gender differences in the relation between food cravings and mood in an adult community: Results from the Fleurbaix Laventie Ville Santé study. International Journal of Eating Disorders, 29(2), 195–204. [DOI] [PubMed] [Google Scholar]
- Linde JA, Jeffery RW, Levy RL, Sherwood NE, Utter J, Pronk NP, & Boyle RG (2004). Binge eating disorder, weight control self-efficacy, and depression in overweight men and women. International Journal of Obesity, 28, 418–425. [DOI] [PubMed] [Google Scholar]
- Lowe MR, Doshi SD, Katterman SN, & Feig EH (2013). Dieting and restrained eating as prospective predictors of weight gain. Frontiers in Psychology, 4, 577 10.3389/fpsyg.2013.00577 [DOI] [PMC free article] [PubMed] [Google Scholar]
- Martin CK, Bhapkar M, Pittas AG, Pieper CF, Das SK, Williamson DA, … Roberts SB (2016). Effect of calorie restriction on mood, quality of life, sleep, and sexual function in healthy nonobese adults the CALERIE 2 randomized clinical trial. JAMA Internal Medicine, 176(6), 743–752. [DOI] [PMC free article] [PubMed] [Google Scholar]
- Martin CK, O’Neil PM, & Pawlow L (2006). Changes in food cravings during low-calorie and very-low-calorie diets. Obesity, 14, 115–121. [DOI] [PubMed] [Google Scholar]
- Martin CK, Rosenbaum D, Han H, Geiselman PJ, Wyatt HR, Hill JO, … Foster GD. (2011). Change in food cravings, food preferences, and appetite during a low-carbohydrate and low-fat diet. Obesity, 1963–1970. [DOI] [PMC free article] [PubMed] [Google Scholar]
- Martin PD, Dutton GR, & Brantley PJ (2004). Self-efficacy as a predictor of weight change in African-American women. Obesity Research, 12, 646–651. [DOI] [PubMed] [Google Scholar]
- Mattison JA, Colman RJ, Beasley TM, Allison DB, Kemnitz JW, Roth GS, … Anderson RM. (2017). Caloric restriction improves health and survival of rhesus monkeys. Nature Communications, 8, 14063. [DOI] [PMC free article] [PubMed] [Google Scholar]
- Moreno S, Rodríguez S, Fernandez MC, Tamez J, & Cepeda-Benito A (2008). Clinical validation of the trait and state versions of the food craving questionnaire. Assessment, 15(3), 375–387. [DOI] [PubMed] [Google Scholar]
- Myers CA, Martin CK, & Apolzan JW (2018). Food cravings and body weight: a conditioning response. Current Opinion in Endocrinology, Diabetes and Obesity, 25(5), 298–302. [DOI] [PMC free article] [PubMed] [Google Scholar]
- Navidian A, Abedi M, Baghban I, Fatehizadeh M, & Poursharifi H (2009). Reliability and validity of the weight efficacy lifestyle questionnaire in overweight and obese individuals. Journal of Behavioral Sciences, 3(3), 217–222. [Google Scholar]
- Nijs IMT, Franken IHA, & Muris P (2007). The modified Trait and State Food-Cravings Questionnaires: Development and validation of a general index of food craving. Appetite, 49, 38–46. [DOI] [PubMed] [Google Scholar]
- Polidori D, Sanghvi A, Seeley RJ, & Hall KD (2016). How strongly does appetite counter weight loss? Quantification of the feedback control of human energy intake. Obesity, 24, 2289–2295. [DOI] [PMC free article] [PubMed] [Google Scholar]
- Presnell K, Pells J, Stout A, & Musante G (2008). Sex differences in the relation of weight loss self-efficacy, binge eating, and depressive symptoms to weight loss success in a residential obesity treatment program. Eating Behaviors, 9, 170–180. [DOI] [PubMed] [Google Scholar]
- Racette SB, Das SK, Bhapkar M, Hadley EC, Roberts SB, Ravussin E, … Redman LM. (2012). Approaches for quantifying energy intake and %calorie restriction during calorie restriction interventions in humans: the multicenter CALERIE study. AJP: Endocrinology and Metabolism, 302, E441–E448. 10.1152/ajpendo.00290.2011 [DOI] [PMC free article] [PubMed] [Google Scholar]
- Ravussin E, Redman LM, Rochon J, Das SK, Fontana L, Kraus WE, … Roberts SB (2015). A 2-year randomized controlled trial of human caloric restriction: Feasibility and effects on predictors of health span and longevity. Journals of Gerontology - Series A Biological Sciences and Medical Sciences, 70(9), 1097–1104. [DOI] [PMC free article] [PubMed] [Google Scholar]
- Redman LM, & Ravussin E (2011). Caloric restriction in humans: Impact on physiological, psychological, and behavioral outcomes. Antioxid. Redox Signal, 14, 275–287. [DOI] [PMC free article] [PubMed] [Google Scholar]
- Redman LM, Smith SR, Burton JH, Martin CK, Il’yasova D, & Ravussin E (2018). Metabolic slowing and reduced oxidative damage with sustained caloric restriction support the rate of living and oxidative damage theories of aging. Cell Metabolism, 27, 805–814. [DOI] [PMC free article] [PubMed] [Google Scholar]
- Rickman AD, Williamson DA, Martin CK, Gilhooly CH, Stein RI, Bales CW, … Das SK (2011). The CALERIE Study: Design and methods of an innovative 25% caloric restriction intervention. Contemporary Clinical Trials, 32, 874–881. [DOI] [PMC free article] [PubMed] [Google Scholar]
- Rochon J, Bales CW, Ravussin E, Redman LM, Holloszy JO, Racette SB, … CALERIE Study Group, for the C. S. (2011). Design and conduct of the CALERIE study: comprehensive assessment of the long-term effects of reducing intake of energy. The Journals of Gerontology: Series A. Biological Sciences and Medical Sciences, 66(1), 97–108. 10.1093/gerona/glq168 [DOI] [PMC free article] [PubMed] [Google Scholar]
- Savage JS, & Birch LL (2010). Patterns of weight control strategies predict differences in women’s 4-year weight gain. Obesity, 18, 513–520. [DOI] [PMC free article] [PubMed] [Google Scholar]
- Schaumberg K, Anderson D. a, Anderson LM, Reilly EE., & Gorrell S. (2016). Dietary restraint: what’s the harm? A review of the relationship between dietary restraint, weight trajectory and the development of eating pathology. Clinical Obesity, 6, 89–100. [DOI] [PubMed] [Google Scholar]
- Stewart TM, Bhapkar M, Das S, Galan K, Martin CK, McAdams L, … Williamson DA (2013). Comprehensive Assessment of Long-term Effects of Reducing Intake of Energy Phase 2 (CALERIE Phase 2) screening and recruitment: Methods and results. Contemporary Clinical Trials, 34(1), 10–20. [DOI] [PMC free article] [PubMed] [Google Scholar]
- Stice E, Cooper JA, Schoeller DA, Tappe K, & Lowe MR (2007). Are dietary restraint scales valid measures of moderate- to long-term dietary restriction? Objective biological and behavioral data suggest not. Psychological Assessment, 19(4), 449–458. [DOI] [PubMed] [Google Scholar]
- Strecher VJ, Devellis BM, Becker MH, & Rosenstock IM (1986). The role of self-efficacy in achieving health behavior change. Spring, 13, 73–92. [DOI] [PubMed] [Google Scholar]
- Stunkard AJ, & Messick S (1985). The three-factor eating questionnaire to measure dietary restraint, disinhibition and hunger. Journal of Psychosomatic Research, 29(1), 71–83. 10.1016/0022-3999(85)90010-8 [DOI] [PubMed] [Google Scholar]
- Wadden TA, Stunkard AJ, Day SC, Gould RA, & Rubin CJ (1987). Less food, less hunger: reports of appetite and symptoms in a controlled study of a protein-sparing modified fast. International Journal of Obesity, 11, 239–249. [PubMed] [Google Scholar]
- Wang G-J, Volkow ND, Telang F, Jayne M, Ma Y, Pradhan K, … Fowler JS. (2009). Evidence of gender differences in the ability to inhibit brain activation elicited by food stimulation. Proceedings of the National Academy of Sciences, 106(4), 1249–1254. [DOI] [PMC free article] [PubMed] [Google Scholar]
- Warziski MT, Sereika SM, Styn MA, Music E, & Burke LE (2008). Changes in self-efficacy and dietary adherence: The impact on weight loss in the PREFER study. Journal of Behavioral Medicine, 31, 81–92. [DOI] [PubMed] [Google Scholar]
- White MA, Whisenhunt BL, Williamson DA, Greenway FL, & Netemeyer RG (2002). Development and validation of the food-craving inventory. Obesity Research, 10(2), 107–114. [DOI] [PubMed] [Google Scholar]
- Williamson DA, Martin CK, Anton SD, York-Crowe E, Han H, Redman L, & Eric Ravussin for the Pennington CALERIE Team. (2008). Is caloric restriction associated with development of eating-disorder symptoms? Results from the CALERIE trial. Health Psychology, 27, S32–S42. [DOI] [PubMed] [Google Scholar]
- Williamson DA, Martin CK, York-Crowe E, Anton SD, Redman LM, Han H, & Ravussin E (2007). Measurement of dietary restraint: Validity tests of four questionnaires. Appetite, 48, 183–192. [DOI] [PMC free article] [PubMed] [Google Scholar]
- Wing RR, Marcus MD, Blair EH, & Burton LR (1991). Psychological responses of obese type II diabetic subjects to very-low-calorie diet. Diabetes Care, 14, 596–599. [DOI] [PubMed] [Google Scholar]
Associated Data
This section collects any data citations, data availability statements, or supplementary materials included in this article.