Adipocytes have unique morphological traits in insulin sensitivity control. However, how the appearance of adipocytes can determine insulin sensitivity has not been understood. Here, we demonstrate that actin cytoskeleton reorganization upon lipid droplet (LD) configurations in adipocytes plays important roles in insulin-dependent glucose uptake by regulating GLUT4 trafficking.
KEYWORDS: actin, adipocytes, cytoskeleton, GLUT4, glucose transport, insulin sensitivity, lipid droplet
ABSTRACT
Adipocytes have unique morphological traits in insulin sensitivity control. However, how the appearance of adipocytes can determine insulin sensitivity has not been understood. Here, we demonstrate that actin cytoskeleton reorganization upon lipid droplet (LD) configurations in adipocytes plays important roles in insulin-dependent glucose uptake by regulating GLUT4 trafficking. Compared to white adipocytes, brown/beige adipocytes with multilocular LDs exhibited well-developed filamentous actin (F-actin) structure and potentiated GLUT4 translocation to the plasma membrane in the presence of insulin. In contrast, LD enlargement and unilocularization in adipocytes downregulated cortical F-actin formation, eventually leading to decreased F-actin-to-globular actin (G-actin) ratio and suppression of insulin-dependent GLUT4 trafficking. Pharmacological inhibition of actin polymerization accompanied with impaired F/G-actin dynamics reduced glucose uptake in adipose tissue and conferred systemic insulin resistance in mice. Thus, our study reveals that adipocyte remodeling with different LD configurations could be an important factor to determine insulin sensitivity by modulating F/G-actin dynamics.
INTRODUCTION
Adipocytes from different fat depots have distinct morphological and functional traits. White adipocytes usually contain a single (unilocular) lipid droplet (LD), whereas brown adipocytes contain numerous (multilocular) small LDs (1). White adipocytes primarily store excess energy sources in the form of neutral lipids, while brown adipocytes dissipate the energy sources as heat. Recent studies have revealed that brown adipose tissue (BAT) absorbs higher levels of glucose than white adipose tissue (WAT) in the basal and insulin-stimulated states (2, 3), which is important for efficient thermogenesis in brown adipocytes. Beige adipocytes exhibit morphological and functional characteristics of brown adipocytes. The emergence of beige adipocytes in subcutaneous fat depot upon cold or β-adrenergic stimuli has metabolically beneficial effects (4, 5). Although functional and morphological differences of white adipocytes and brown/beige adipocytes have been well documented concerning energy utilization and LD morphology (6, 7), the direct relationship between adipocyte function and LD configuration is unclear.
Depending on environmental and nutritional stimuli, adipose tissue (AT) can dynamically remodel its morphology and function. For instance, in pathological conditions such as obesity, unhealthy remodeling of AT accompanied with adipocyte hypertrophy, proinflammatory response, and hypoxia eventually leads to insulin resistance (8). Likewise, in physiological conditions such as thermoneutrality, BAT undergoes WAT-like remodeling and becomes prone to obesity-induced insulin resistance (9, 10). Conversely, after cold exposure or physical exercise, WAT can acquire brown-like morphology and functions, improving systemic insulin resistance in part by potentiating insulin-dependent glucose uptake (11, 12). Together, these findings imply that there might be certain relationships between adipocyte morphology with different LD configurations (size and locularity) and insulin-dependent glucose uptake ability.
In adipocytes, glucose transporter 4 (GLUT4) is the major insulin-dependent glucose transporter for uptake glucose. GLUT4 can travel along the actin cytoskeleton since it is contained in GLUT4 storage vesicles (GSVs) (13, 14). During the basal state, GLUT4 is mostly present in intracellular GSVs, the trans-Golgi network, and recycling endosomes. However, GSVs quickly translocate to the plasma membrane (PM) along actin cytoskeleton upon insulin stimulation (13, 15). In insulin-treated adipocytes, Akt phosphorylates AS160, a Rab GTPase-activating protein, followed by Rab-mediated membrane trafficking of GSVs, eventually leading to uptake glucose (16, 17). Genetic ablation of GLUT4 in the whole body or adipose tissue impairs systemic glucose tolerance and insulin sensitivity (18). In contrast, overexpression of GLUT4 in the whole body or adipose tissue augments glucose utilization in lean mice and ameliorates diabetic phenotypes of db/db mice (19, 20). Thus, it has been suggested that adipose GLUT4 is essential in regulating systemic insulin sensitivity. Despite of these findings, the underlying mechanisms of intracellular translocation of GLUT4 in adipocytes with different LD configurations under pathophysiological conditions such as obesity or β-adrenergic stimuli are poorly understood.
Evolutionarily well conserved actin is the most abundant intracellular cytoskeletal protein (21). Actin exists as a globular monomer called G-actin and as F-actin, a filamentous polymer that is a linear chain of G-actin subunits. The dynamics of the intracellular ratio between F-actin and G-actin (F/G-actin) are crucial for actin remodeling. Actin is indispensable for numerous cellular functions, including cell movement, intracellular vesicle transport, and maintenance of cell shape (22, 23). Actin remodeling plays a crucial role for the LD formation and morphological maturation during adipocyte differentiation (24, 25). Moreover, it has been proposed that F/G-actin dynamics in adipocytes are associated with several metabolic functions such as glucose uptake, fat utilization, and insulin signaling, indicating the potential significance of actin cytoskeleton in adipocytes (26–28). However, it is largely unknown which factors might modulate F/G-actin dynamics in adipocytes in pathophysiological circumstances.
In this study, we demonstrate that different LD configurations and F/G-actin dynamics determine insulin sensitivity in adipocytes. Using a variety of pathophysiological stimuli, we investigated GLUT4 trafficking, glucose uptake, and F/G-actin ratio of adipocytes with different LD configurations. To find key mediator(s) in the regulation of insulin sensitivity during adipocyte remodeling, transcriptomic and functional analyses were conducted. The collective data suggest that adipocyte remodeling with different LD sizes and locularities could determine insulin sensitivity through the regulation of F/G-actin dynamics and GLUT4 trafficking.
RESULTS
Warm and cold stimuli regulate LD locularity and insulin-dependent glucose uptake reversibly in adipocytes.
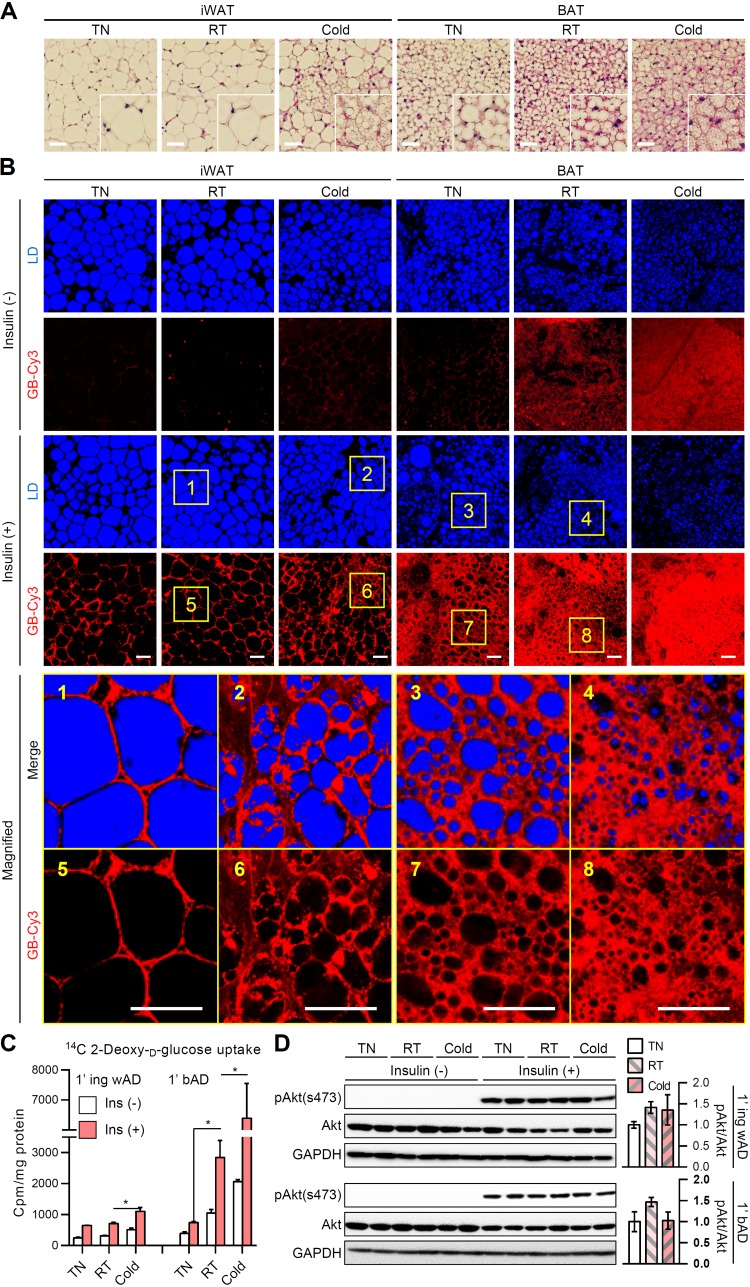
In inguinal WAT (iWAT), brown-like adipocytes appear upon cold exposure (12). In contrast, a thermoneutral condition suppresses the thermogenic program and induces white adipocyte-like morphology in BAT (10). To test the morphological and functional changes of each fat depot during different temperature stimuli, mice were exposed to thermoneutral (30°C), cold (4°C), and room temperature conditions. Consistent with previous reports (29, 30), unilocular LDs in white adipocytes were converted to multilocular LDs upon cold exposure, whereas multilocular LDs in brown adipocytes were converted to unilocular LDs in the thermoneutral condition (Fig. 1A). To examine the different insulin sensitivities in morphologically different adipocytes, we assessed the uptake of the insulin-dependent cyanine 3 fluorescence-labeled glucose bioprobe (GB-Cy3) as previously described (31, 32). Surprisingly, in iWAT, multilocular adipocytes induced by cold exposure exhibited greater absorption of glucose than unilocular adipocytes at room temperature (Fig. 1B, yellow box 1 versus box 2 and yellow box 5 versus box 6). Furthermore, in BAT, unilocularized brown adipocytes induced in the thermoneutral condition displayed diminished insulin-dependent glucose uptake compared to multilocular brown adipocytes at the room temperature condition (Fig. 1B, yellow box 3 versus box 4 and yellow box 7 versus box 8). To confirm this in primary adipocytes from each group, we performed insulin-dependent isotope-labeled 2-deoxy-glucose uptake assay. As shown in Fig. 1C, primary white adipocytes isolated from iWAT exposed to the cold stimulus upregulated insulin-dependent glucose uptake compared to those exposed to the room temperature condition. On the contrary, primary brown adipocytes isolated from BAT exposed to the thermoneutral stimulus displayed markedly downregulated insulin-dependent glucose uptake compared to those exposed to the room temperature condition. However, there were no significant changes in Akt phosphorylation in the presence of insulin (Fig. 1D), implying the possibility of an alternative regulatory mechanism of insulin-dependent glucose uptake, which likely bypasses canonical insulin signaling pathways. Together, these data suggested the provocative idea that reversible adipocyte remodeling with different LD configurations might play a crucial role in the regulation of glucose uptake.
FIG 1.
Differential regulation of insulin-dependent glucose uptake in adipocytes upon different temperatures. Eight-week-old male C57BL/6J mice were placed under thermoneutral (30°C), room temperature (25°C), or cold (4°C) conditions for 1 week. (A) Hematoxylin-eosin-stained paraffin sections of inguinal white adipose tissue (iWAT) and brown adipose tissue (BAT). Insets show ×2 magnifications of the indicated areas. Scale bars, 50 μm. (B) Ex vivo insulin-dependent glucose bioprobe (GB-Cy3, red) uptake assay. iWATs and BATs from mice were cultured with GB-Cy3 (5 μM) in the absence or presence of insulin (1 μM, 30 min). Lipid droplets (LDs, blue) were visualized by TCS SP8 CARS microscopy. Scale bars, 50 μm. Insets show ×5 magnifications of the indicated areas. (C and D) Insulin-dependent glucose uptake (C) and immunoblot of insulin signaling cascade (D) in primary adipocytes isolated from iWAT (1′ ing wAD) and BAT (1′ bAD) with or without insulin (100 nM, 30 min). Data represent means ± the standard deviations (SD). *, P < 0.05 (Student t test).
Transformation of LD locularity during adipocyte remodeling is associated with insulin-dependent glucose uptake.
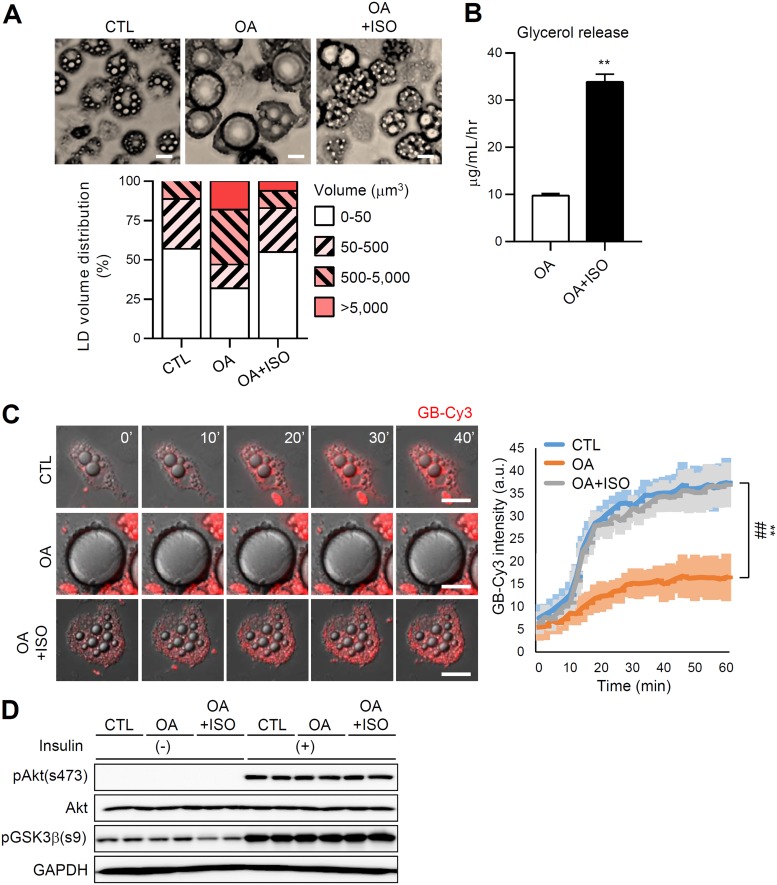
Adipocytes dynamically remodel their morphologies concerning LD size and locularity depending on the physiological and pathological conditions. We investigated whether reversible transformation of adipocyte morphology modulates insulin-dependent glucose uptake using a cell culture system that can induce unilocularization or multilocularization of LD in adipocytes. During oleic acid (OA) challenge, adipocytes displayed a gradual increase of LD volume and mostly became unilocular (Fig. 2A, OA group). In contrast, treatment of OA-overloaded adipocytes with the β-adrenergic agonist isoproterenol (OA+ISO group) stimulated lipolysis, which resulted in reduced size and volume of LDs and increased numbers of LDs (Fig. 2A and B). In accordance with the data presented in Fig. 1, adipocytes with large unilocular LDs in the OA group showed decreased insulin-dependent glucose uptake, while this decrease was restored in adipocytes with small multilocular LDs in the OA+ISO group (Fig. 2C; see also Movie S1 in the supplemental material), without significant changes in insulin downstream signaling cascades (Fig. 2D). These results suggested that the insulin-dependent glucose uptake ability of adipocytes is reversibly regulated by LD size and locularity.
FIG 2.
LD configuration is associated with insulin-dependent glucose uptake ability during adipocyte remodeling. Differentiated 3T3-L1 adipocytes were cultured for 6 days with oleic acid (OA; 500 μM) followed by isoproterenol (ISO, 2 μM, 12 h). CTL denotes control (BSA + DMSO). (A) Microscopic images of adipocytes with different LD locularities (top). Scale bar, 25 μm. A quantification of the LD volume (bottom) is also shown. (B) Glycerol release. Data represent means ± the SD. **, P < 0.01 (Student t test). (C) Insulin-dependent GB-Cy3 (5 μM, red) uptake assay. The fluorescence intensities of GB-Cy3 were monitored after stimulation with insulin (100 nM) using Deltavision time-lapse imaging (left) and quantified using ImageJ (right). Scale bars, 25 μm. Data represent means ± the SD. **, P < 0.01 (CTL versus OA) and ##, P < 0.01 (CTL versus OA+ISO), determined using two-way ANOVA with the Bonferroni post hoc test. (D) Immunoblot of insulin signaling cascade in adipocytes with or without insulin (10 nM, 30 min).
F/G-actin ratio in adipocytes with different LD configurations is crucial for GLUT4 translocation.
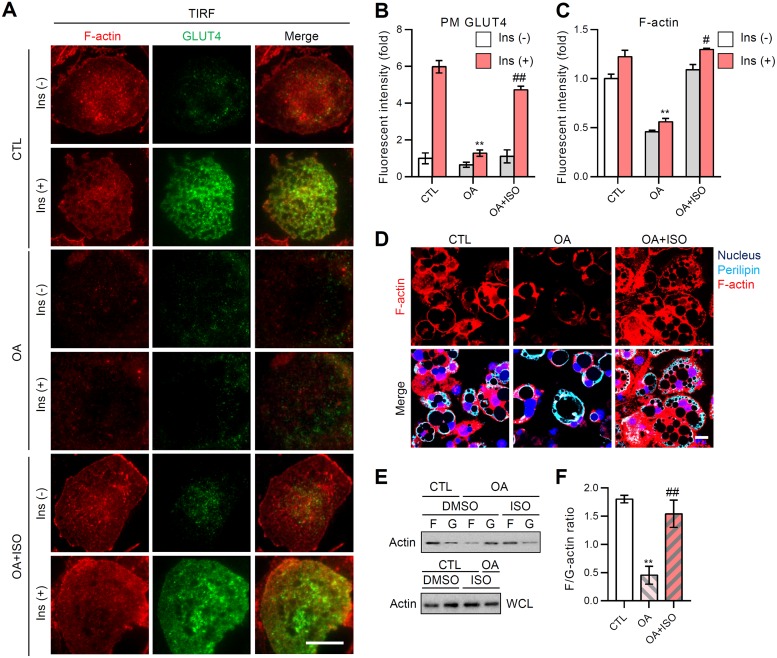
Given that insulin downstream signaling was not largely altered by adipocyte remodeling (Fig. 1D and 2D), the level of insulin-stimulated GLUT4 trafficking to the plasma membrane (PM) was assessed in adipocytes with different LD configurations by total internal reflection fluorescence microscopy (TIRFM). Upon insulin, adipocytes with multilocular LDs (CTL group) exhibited an ∼6-fold increase of GLUT4 signals in the PM (Fig. 3A and B). In contrast, adipocytes with unilocular large LDs (OA group) displayed severely downregulated insulin-dependent GLUT4 translocation to the PM (Fig. 3A and B). In adipocytes, reversible transformation of unilocular LD to multilocular LD upon the stimulation of lipolysis (OA+ISO group) restored the insulin-dependent translocation of GLUT4 to the PM (Fig. 3A and B). Moreover, fatty acid oxidation-induced LD multilocularization exhibited similar amelioration of insulin-dependent GLUT4 trafficking (data not shown). As we and others have previously reported that cortical F-actin is important to mediate GLUT4 translocation to the PM (32, 33), we examined the degree of cortical F-actin development in adipocytes with different LD configurations. The cortical F-actin structure of adipocytes was reversibly altered according to the LD configuration (Fig. 3A, C, and D). For instance, OA-induced LD enlargement and unilocularization resulted in the approximately 50% reduction of the cortical F-actin signal (Fig. 3C), while reacquisition of LD size reduction and multilocularization similar to control adipocytes (OA+ISO group in Fig. 2A) restored the cortical F-actin signal intensity to the control level (Fig. 3A and C). Intriguingly, the total amount of actin protein in adipocytes was not altered, although adipocytes exhibited different quantities of cortical F-actin depending on the LD configuration (Fig. 3E). As shown in Fig. 3E and F, transition of F-actin to G-actin was facilitated by LD unilocularization, resulting in a reduced F/G-actin ratio, whereas LD multilocularization accelerated the transition of G-actin to F-actin, to increase the F/G-actin ratio. Together, these data indicated that reversible transformation of LD configuration in adipocytes modulates GLUT4 trafficking and F/G-actin dynamics, which influences the insulin-dependent glucose uptake.
FIG 3.
F/G-actin ratio upon LD locularity in adipocytes is crucial for GLUT4 translocation to the plasma membrane (PM). 3T3-L1 adipocytes were challenged with oleic acid (OA; 500 μM) for 6 days, followed by isoproterenol (ISO; 2 μM; 12 h). (A) Insulin-stimulated PM insertion examined using TIRFM. The data are representative microscopic images of adipocytes in each indicated group: F-actin (phalloidin-TRITC, red), GLUT4 (green). Scale bar, 20 μm. (B and C) TIRF intensities of PM GLUT4 (B) and cortical F-actin (C) from the indicated groups were quantified using ImageJ. Data represent means ± the SD. **, P < 0.01 versus CTL; #, P < 0.05 versus OA; ##, P < 0.01 versus OA. (D) The F-actin structures (phalloidin-TRITC, red) of each group were visualized using confocal microscopy. The nucleus (Hoechst, blue) and perilipin (cyan) are shown. Scale bar, 20 μm. (E and F) Immunoblot analysis of F-actin and G-actin (E) in the indicated groups was quantified (F) using ImageJ. WCL, whole-cell lysates. Data represent means ± the SD. **, P < 0.01 versus CTL; ##, P < 0.01 versus OA (Student t test).
In ATs, insulin-dependent GLUT4 translocation is differently regulated by warm and cold stimuli.
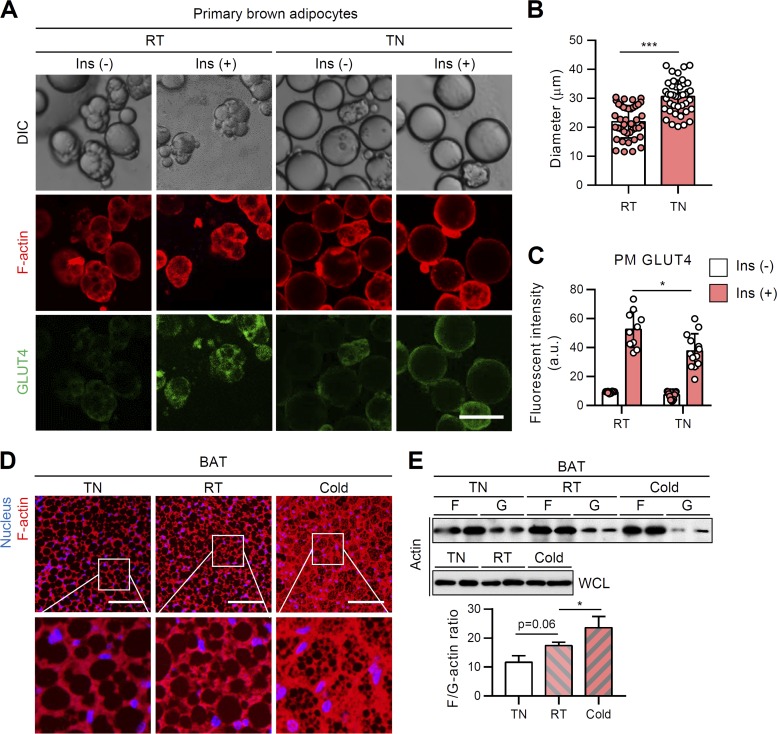
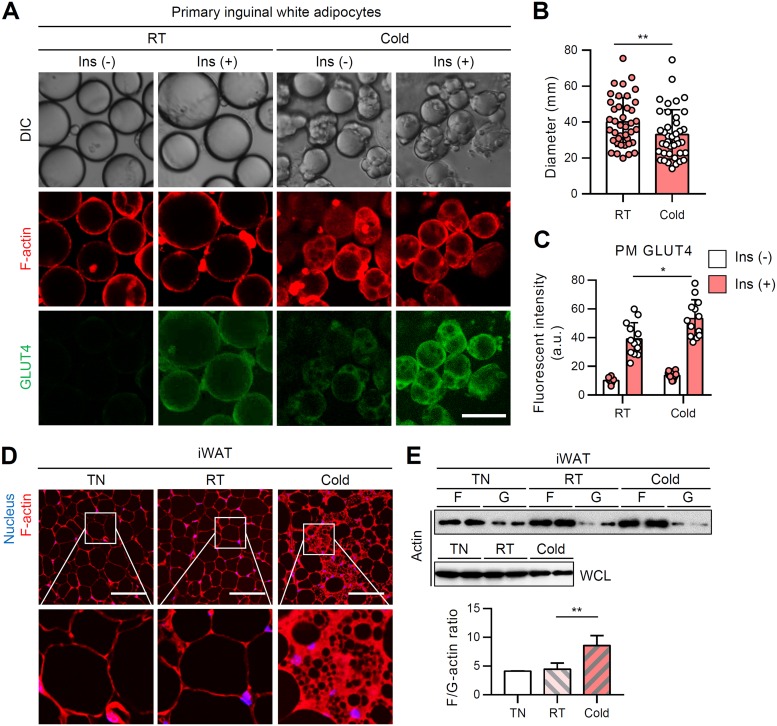
In contrast to unilocular white adipocytes, brown adipocytes contain innate multilocular LDs. However, under the thermoneutral condition, multilocular brown adipocytes remodeled into unilocular adipocytes similar to white adipocytes. To test the relationship between reversible LD locularity and insulin-dependent GLUT4 trafficking ability, primary brown and white adipocytes were isolated from mice exposed to different temperature conditions. As expected, primary brown adipocytes from the room temperature group mainly displayed multilocular LDs, while primary brown adipocytes from the thermoneutral group often exhibited unilocular LDs (Fig. 4A). Under the thermoneutral condition, the size of brown adipocytes became slightly, but substantially, increased, accompanied with unilocular LDs (Fig. 4B). Consistent with the data from the cell culture system (Fig. 3), LD unilocularization in brown adipocytes under the thermoneutral condition reduced insulin-dependent GLUT4 translocation to the PM (Fig. 4A and C). Furthermore, F-actin organization and the F/G-actin ratio were downregulated in BAT from the thermoneutral group (Fig. 4D and E). In contrast, upon cold exposure, the emergent small and multilocular beige adipocytes in iWAT displayed upregulated insulin-dependent GLUT4 translocation to PM (Fig. 5A to C). Multilocular beige adipocytes showed increased F-actin and F/G-actin ratio compared to unilocular white adipocytes from the room temperature condition (Fig. 5D and E). Collectively, these in vivo data suggested that distinct LD configurations in white and brown/beige adipocytes would be attributable to insulin-dependent glucose uptake.
FIG 4.
In BAT, thermoneutral condition-induced LD unilocularization downregulates insulin-dependent GLUT4 translocation to the PM. Primary brown adipocytes were isolated from BATs of 8-week-old, male, C57BL/6J mice housed under thermoneutral (30°C), room temperature (25°C), or cold (4°C) conditions for 1 week. (A to C) F-actin (phalloidin-TRITC, red) and PM-anchored GLUT4 (green) of primary brown adipocytes were assessed by immunohistochemistry in the absence or presence of insulin (100 nM, 30 min). Scale bar, 50 μm (A). The average diameters (B) and intensities of PM-anchored GLUT4 (C) of isolated primary brown adipocytes were determined. (D) F-actin structure (phalloidin-TRITC, red) of BAT. Scale bars, 50 μm. Insets show ×4 magnifications of the indicated areas (nucleus [Hoechst, blue]). (E) F/G-actin ratios in primary brown adipocytes isolated from BAT. WCL, whole-cell lysates. Data represent means ± the SD. *, P < 0.05; ***, P < 0.001 (Student t test).
FIG 5.
In WATs, cold-induced LD multilocularization upregulates insulin-dependent GLUT4 translocation to the PM. Primary white adipocytes were isolated from iWATs of 8-week-old, male, C57BL/6J mice housed under thermoneutral (30°C), room temperature (25°C), or cold (4°C) conditions for 1 week. (A to C) F-actin (phalloidin-TRITC, red) and PM-anchored GLUT4 (green) of primary white adipocytes were assessed by immunohistochemistry in the absence or presence of insulin (100 nM, 30 min). Scale bar, 50 μm. The average diameters (B) and intensities of PM-anchored GLUT4 (C) of isolated primary white adipocytes were determined. (D) F-actin structure (phalloidin-TRITC, red) of iWAT. Scale bars, 50 μm. Insets show ×4 magnifications of the indicated areas (nucleus [Hoechst, blue]). (E) F/G-actin ratios in primary white adipocytes isolated from iWAT. WCL, whole-cell lysates. Data represent means ± the SD. *, P < 0.05; **, P < 0.01 (Student t test).
Obesity-induced LD enlargement in WAT suppresses insulin-dependent GLUT4 translocation.
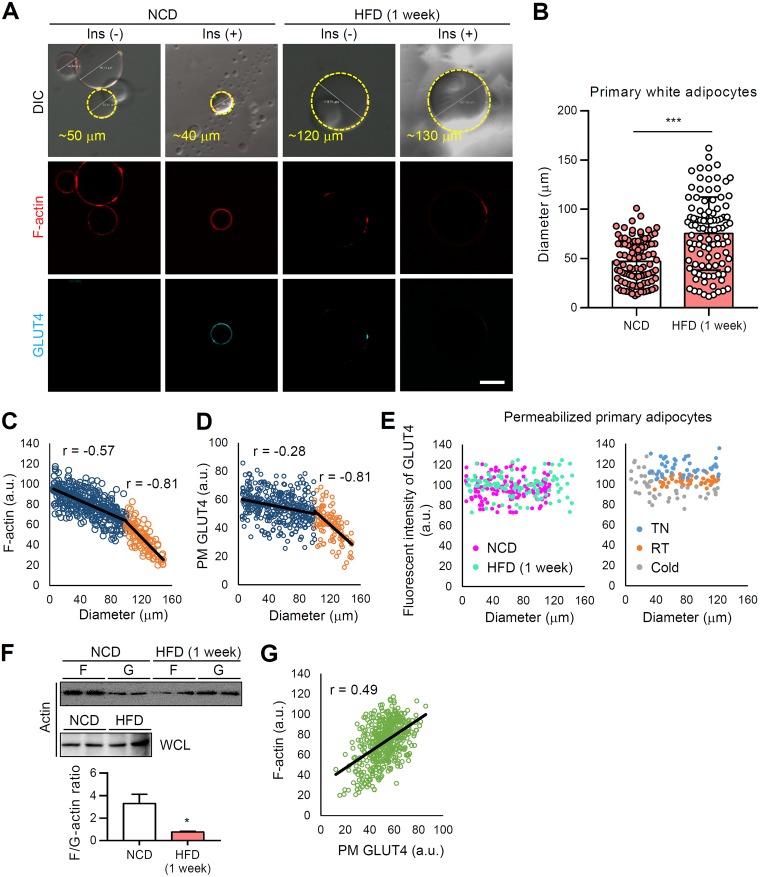
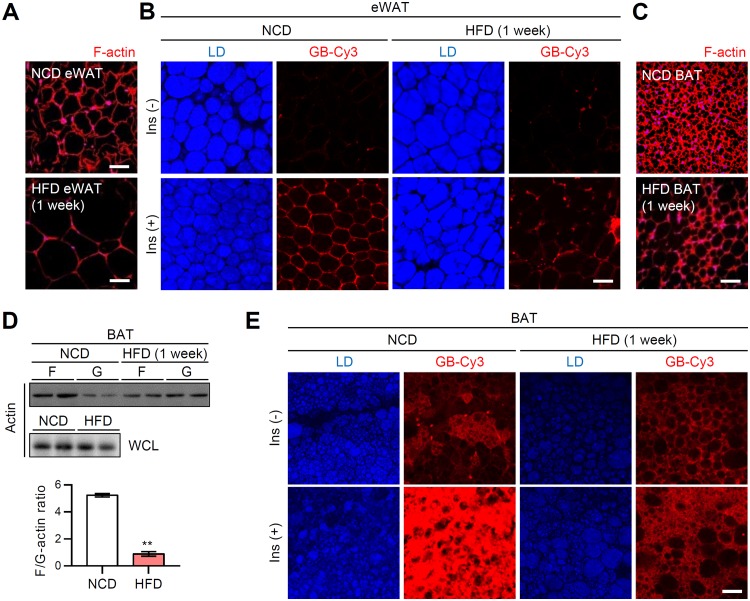
It has been well accepted that adipocyte size inversely correlates with insulin sensitivity. For instance, adipose-specific overexpression of MitoNEET, which plays key role in mitochondrial iron transport, results in massive de novo differentiation of small adipocytes (hyperplasia) in iWAT of obese mice, leading to improved insulin sensitivity despite of their increased adiposity (34). On the other hand, it has been demonstrated that adipocyte enlargement (hypertrophy) per se can attenuate insulin-dependent glucose uptake in in vitro lipid-overloaded adipocytes (32, 35). Given that LD size primarily dictates the mass of adipocytes, we investigated whether LD expansion in primary white adipocytes would affect insulin-dependent GLUT4 trafficking and actin dynamics. Isolated primary white adipocytes were used to examine the levels of GLUT4 translocation to the PM and F-actin with or without insulin. Upon short-term (1 week) high-fat diet (HFD) feeding, the sizes of primary white adipocytes were significantly increased (Fig. 6A and B). Next, to examine whether the size of unilocular LD in primary white adipocytes could be crucial in determining F-actin formation and GLUT4 trafficking, F-actin- and PM-associated GLUT4 in nonpermeabilized adipocytes were stained with phalloidin-tetramethyl rhodamine isothiocyanate (TRITC) and antibody against the external epitope of GLUT4, respectively (Fig. 6A). The F-actin and PM GLUT4 fluorescent signals displayed strong negative correlations with the size of adipocytes (Fig. 6C and D), even though there was no significant reduction of total GLUT4 protein levels (Fig. 6E). Compared to relatively small adipocytes, large adipocytes (diameter > 100 μm) exhibited a strongly augmented negative correlation between F-actin and fat cell size (Fig. 6C) (r = –0.57 → r = –0.81). In addition, the negative correlations between PM GLUT4 fluorescent intensity and fat cell size were further potentiated in large adipocytes (> 100 μm) compared to small adipocytes (< 100 μm) (Fig. 6D) (r = –0.28 → r = –0.81). It is of interest to note that large adipocytes in obese WAT exhibited not only reduced PM GLUT4 and F-actin signals but also reduced F/G-actin ratio (Fig. 6F). In accordance with the positive correlation between F-actin and PM GLUT4 (Fig. 6G) (r = 0.49), it seems that reduced F-actin and PM GLUT4 in hypertrophic adipocytes would result in decreased insulin-dependent glucose uptake in obese WAT (Fig. 7A and B). Furthermore, we observed that short-term HFD-induced whitening of BAT showed a reduction of F-actin development, F/G-actin ratio (Fig. 7C and D), and insulin-dependent glucose uptake along with LD enlargement and unilocularization (Fig. 7E). Therefore, these data indicated that the LD enlargement and unilocularization that occur in obesity could impair insulin-dependent glucose uptake in hypertrophic adipocytes by downregulating the F/G-actin ratio and GLUT4 translocation to the PM.
FIG 6.
In WATs, obesity-induced LD enlargement suppress insulin-dependent GLUT4 translocation to the PM. Primary white adipocytes were isolated from eWATs of 8-week-old male C57BL/6J mice fed the HFD for 1 week. (A) F-actin (phalloidin-TRITC, red) and PM-anchored GLUT4 (cyan) of primary white adipocytes were assessed by immunohistochemistry in the absence or presence of insulin (100 nM, 30 min). Scale bar, 50 μm. (B) The diameters of isolated primary white adipocytes were quantified using ImageJ. (C and D) Size-dependent fluorescent intensities of PM-anchored GLUT4 (C) and F-actin (D). (E) Total GLUT4 fluorescence intensities were measured in primary adipocytes after permeabilization. (F) F/G-actin ratios. WCL, whole-cell lysates. (G) Fluorescence intensities of F-actin and PM-anchored GLUT4. r, correlation coefficient. Data represent means ± the SD. *, P < 0.05 and ***, P < 0.001 versus NCD (Student t test).
FIG 7.
In ATs, obesity-induced LD enlargement and unilocularization suppress insulin-dependent GLUT4 translocation to the PM. eWATs and BATs from short-term (1 week) HFD-fed male C57BL/6J mice were ex vivo cultured. (A) F-actin structure (phalloidin-TRITC, red) of eWAT. Scale bars, 50 μm. (B) Ex vivo GB-Cy3 (5 μM, red) uptake assay with or without insulin (1 μM, 30 min). LDs (blue) were visualized by TCS SP8 CARS microscopy. Scale bar, 50 μm. (C) F-actin structure (phalloidin-TRITC, red) of BAT. Scale bar, 50 μm. (D) F/G-actin ratios in isolated primary brown adipocytes. WCL, whole-cell lysates. Data represent means ± the SD. **, P < 0.01 versus NCD (Student t test). (E) Ex vivo GB-Cy3 (5 μM, red) uptake assay with or without insulin (1 μM, 30 min). LDs (blue) were visualized by TCS SP8 CARS microscopy. Scale bar, 50 μm.
Impairment of F-actin formation in adipose tissue induces systemic insulin resistance.
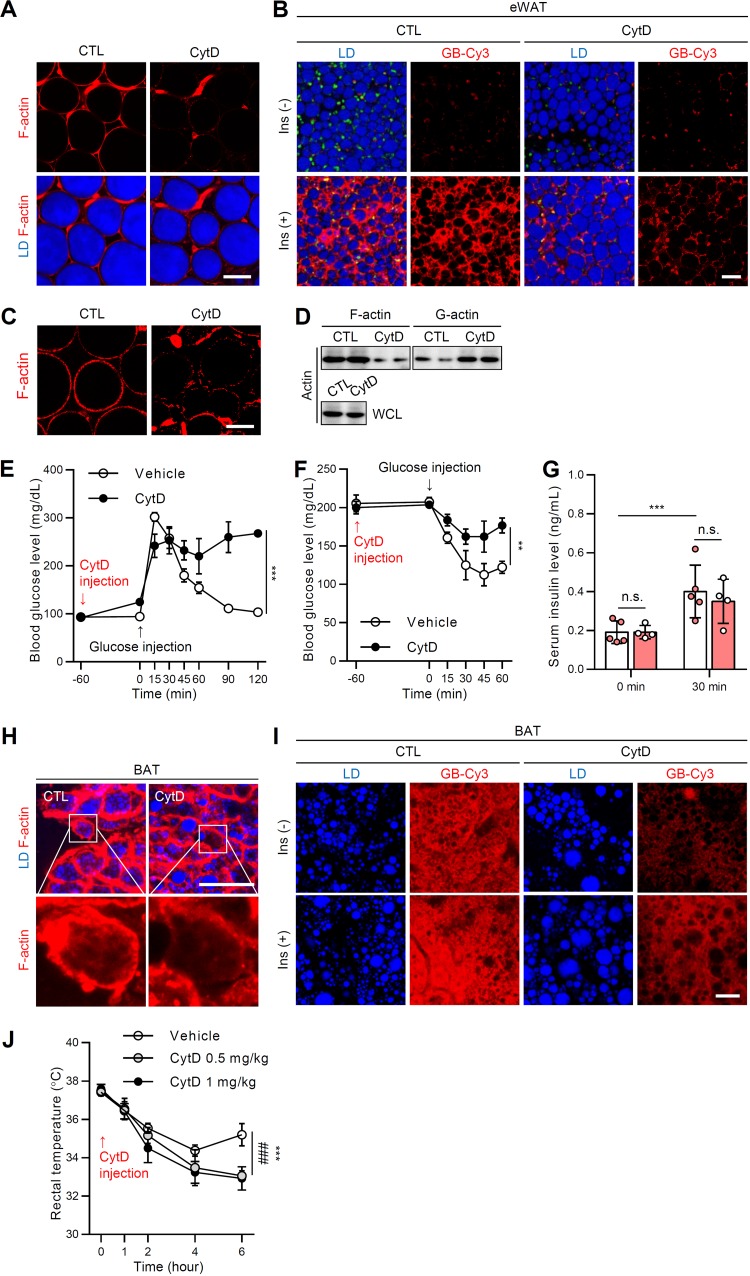
The preceding in vivo and in vitro results supported the view that insulin-dependent glucose uptake in adipocytes were attributable to actin dynamics during adipocyte remodeling under various pathophysiological conditions. To further validate the role of F/G-actin dynamics in the regulation of insulin-dependent glucose uptake in adipocytes, we disrupted F/G-actin dynamics in ex vivo-cultured WAT by treatment with cytochalasin D (CytD), which inhibits actin polymerization and actin-dependent GLUT4 trafficking (33). In the presence of CytD, the formation of F-actin in WAT was greatly downregulated (Fig. 8A). Furthermore, the degree of insulin-dependent glucose uptake in ex vivo-cultured WAT was markedly diminished by CytD (Fig. 8B). To examine the effects of F/G-actin dynamics on insulin sensitivity in vivo, CytD was administered to mice. As shown in Fig. 8C and D, CytD clearly decreased F-actin formation and the F/G-actin ratio in WAT. More importantly, CytD-treated mice exhibited glucose intolerance (Fig. 8E) and insulin intolerance (Fig. 8F), indicating that disruption of F/G-actin dynamics in WAT could downregulate insulin-dependent glucose uptake. In parallel, to test whether acute treatment of CytD might influence insulin secretion in β cells, we measured glucose-stimulated insulin secretion. As shown in Fig. 8G, serum insulin levels of insulin were not significantly altered in CytD-treated mice. Notably, BAT also exhibited significant reduction of F-actin organization after treatment with CytD (Fig. 8H), resulting in alleviated insulin-dependent glucose uptake (Fig. 8I). Moreover, mice exposed to CytD displayed severe hypothermia after cold exposure, which was likely due to the insufficient uptake of energy sources such as glucose for heat generation (Fig. 8J). The collective ex vivo and in vivo data implicated F/G-actin dynamics in adipocytes as a key factor to decide systemic insulin sensitivity.
FIG 8.
F-actin disruption in AT induces systemic insulin resistance. Eight-week-old male C57BL/6J mice were not (CTL) or were challenged with CytD (1 mg/kg) via intraperitoneal injection. (A) F-actin structure (phalloidin-TRITC, red) of eWATs with or without CytD (200 nM). Scale bar, 50 μm. Lipid droplets (LDs, blue) were visualized by TCS SP8 CARS microscopy. (B) Ex vivo GB-Cy3 (2 μM, red) uptake assay with or without insulin (1 μM, 30 min). LDs (blue) were visualized by TCS SP8 CARS microscopy. Scale bar, 50 μm. (C to F) Eight-week-old male C57BL/6J mice were administered or not administered CytD (1 mg/kg, 1 h) via intraperitoneal injection. (C) F-actin structures of eWAT. Scale bar, 50 μm. (D) F/G-actin ratio. WCL, whole-cell lysates. (E) Glucose tolerance test. (F) Insulin tolerance test. (G) Glucose-stimulated insulin secretion. (H) F-actin structure (phalloidin-TRITC, red) of BAT with or without CytD (200 nM). LDs (blue) were visualized by TCS SP8 CARS microscopy. Scale bar, 50 μm. Insets show ×4 magnifications of the indicated areas. (I) Ex vivo GB-Cy3 (5 μM, red) uptake assay with or without insulin (1 μM, 30 min). LDs (blue) were visualized by TCS SP8 CARS microscopy. Scale bar, 25 μm. (J) Eight-week-old male C57BL/6J mice were exposed to cold (4°C) with or without CytD (0.5 or 1 mg/kg) injection, and the rectal temperature was measured. Data represent means ± the SD. **, P < 0.01; ***, P < 0.001; n.s., not significant (versus CytD [1 mg/kg]); and ###, P < 0.001 (versus CytD [0.5 mg/kg]), as determined by two-way ANOVA with a Bonferroni post hoc test.
Actin-associated genes are altered during adipocyte remodeling by pathophysiological conditions.
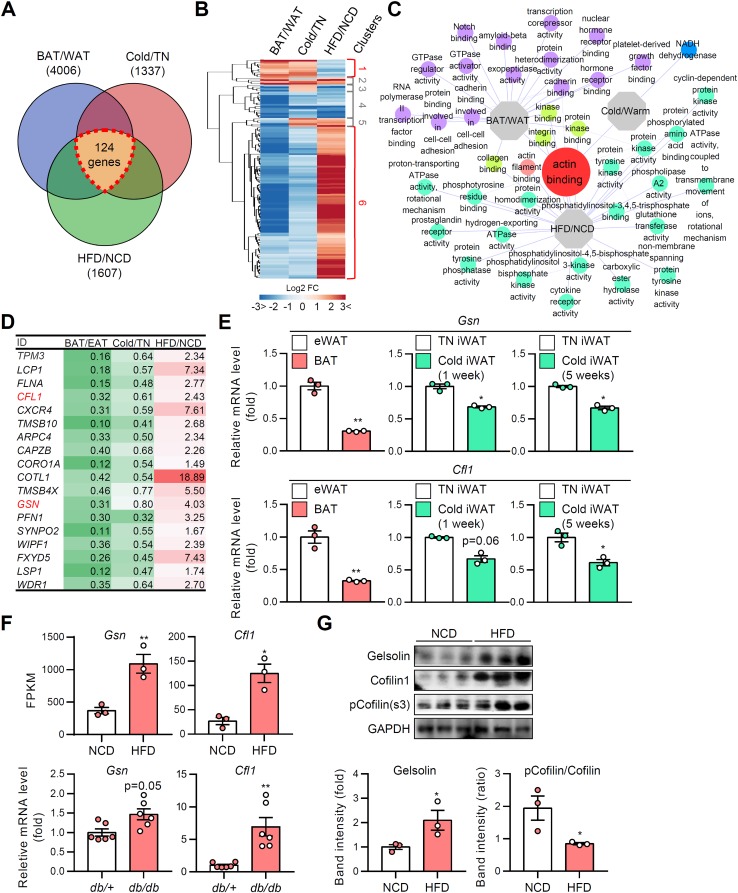
The close association of adipocyte morphology and insulin-dependent glucose uptake ability (Table 1 ) prompted us to hypothesize that F/G-actin dynamics would be induced by reversible changes of LD configuration and mediate insulin-dependent GLUT4 trafficking. To verify this, we took advantage of transcriptomic analysis approaches to find the key modulator(s) for actin dynamics. Public microarray and our RNA-sequencing data sets, which could reflect genetic reprogramming of adipocytes exposed to several physiological and pathological conditions, were scrutinized by following criteria (Fig. 9A). First, for the analysis of the intrinsic differences of adipocytes, the transcriptomes of white and brown adipocytes from epididymal white adipose tissue (eWAT) and BAT were compared. Second, for the analysis of distinct features during adipocyte remodeling in the physiological conditions, adipocytes from thermoneutral and cold-exposed iWAT were compared. Third, for the analysis of the differences resulting from pathological stimulus-induced adipocyte remodeling, adipocytes from eWAT of normal chow diet (NCD)- and HFD-fed mice were compared. As shown in Fig. 9A, 124 intersectional differentially expressed genes (DEGs) were identified. The expression patterns of DEGs were further analyzed and classified into distinct clusters (Fig. 9B). Among them, evidently distinct gene sets from clusters 1 and 6 were used for gene ontology (GO) enrichment analysis. Actin binding GO (GO:0003779) was distinctively downregulated in multilocular brown adipocytes and beige adipocytes, while being upregulated in enlarged unilocular white adipocytes (Fig. 9C). The findings implied that direct actin-associated factors might have important roles in adipocyte remodeling under various pathophysiological conditions. The genes identified in actin binding GO included gelsolin, cofilin 1, and Arpc4, which are enzymes that participate in F-actin breakdown and branching (Fig. 9D) (36). Consistent with these transcriptomic analyses, the mRNA levels of gelsolin and cofilin 1 were downregulated in BAT and iWAT under cold conditions (Fig. 9E). In contrast, the mRNA and protein levels of gelsolin and cofilin 1 were elevated and the inhibitory phosphorylation of cofilin 1 was decreased in obese eWAT (Fig. 9F and G). Together, these data imply that transcriptional and posttranslational modifications of actin severing genes might be responsible for different F/G-actin dynamics in adipocyte remodeling.
TABLE 1.
Characteristics of adipocytes with distinct LD locularity upon different pathophysiological conditions
| Variable | Adipocyte | Findings for various pathophysiological conditionsa |
|||
|---|---|---|---|---|---|
| Cold | Lean/RT | TN | Obese | ||
| LD configuration | eWAT | Uni/small | Uni/small | Uni/small | Uni/large |
| iWAT | Multi-like/small | Uni/small | Uni/small | Uni/large | |
| BAT | Multi/small | Multi/small | Uni-like/small | Uni-like/large | |
| F/G-actin ratio | eWAT | – | – | – | ↓ |
| iWAT | ↑ | – | – | ↓ | |
| BAT | ↑↑ | ↑ | – | – | |
| Insulin-dependent GLUT4 translocation | eWAT | ↑ | ↑ | ↑ | ↓ |
| iWAT | ↑↑ | ↑ | ↑ | ↓ | |
| BAT | ↑↑↑ | ↑↑ | ↑ | ↓ | |
| Insulin-dependent glucose uptake | eWAT | ↑ | ↑ | ↑ | ↓ |
| iWAT | ↑↑ | ↑ | ↑ | ↓ | |
| BAT | ↑↑↑ | ↑↑ | ↑ | ↓ | |
Uni, unilocular LD; multi, multilocular LD; RT, room temperature; TN, thermoneutral. Symbols indicate the relative levels of variables as follows: ↑↑↑ to ↑, highest to high; –, moderate; ↓, low.
FIG 9.
Actin-associated genes are altered during adipocyte remodeling. Gene ontologies were analyzed from microarray and RNA-sequencing data. (A) Venn diagram of the number of differentially expressed genes (DEGs). (B) Heat map of clustered DEGs. (C) Network of gene ontologies (GOs). (D) List of screened actin-modulating genes (the values indicate the fold changes of gene expression). (E) mRNA levels of actin severing genes in ATs. (F) mRNA levels of actin severing genes in ATs from NCD and HFD (1-week)-fed mice. Data represent means ± the SD. *, P < 0.05; **, P < 0.01 (Student t test). (G) Immunoblot analysis of actin severing proteins. Data represent means ± the SD. *, P < 0.05 versus NCD (Student t test).
In adipocytes, actin severing protein regulates insulin-dependent GLUT4 translocation through dynamic remodeling of actin.
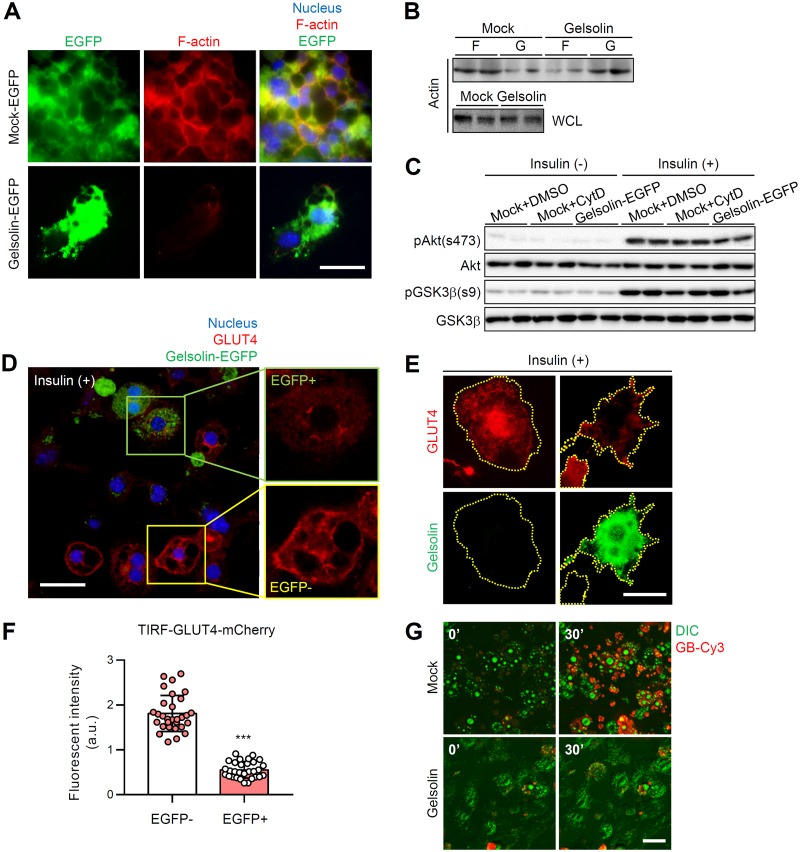
It has been reported that ectopic overexpression of gelsolin but not cofilin 1 markedly accelerates F-actin dissociation (37). To explore whether modulation of actin dynamics affects insulin-dependent glucose uptake, we overexpressed gelsolin in differentiated 3T3-L1 adipocytes. As shown in Fig. 10A, gelsolin overexpression disrupted the cortical structure of F-actin in adipocytes. Consistent with the imaging data, gelsolin overexpression decreased the level of F-actin and increased the level of G-actin, resulting in a reduced F/G-actin ratio in adipocytes (Fig. 10B). Next, to test whether gelsolin-induced F-actin disruption might affect GLUT4 trafficking and glucose uptake capacity in the presence of insulin, we tested GLUT4-mCherry-expressing 3T3-L1 adipocytes. Although insulin-dependent phosphorylation levels of Akt and GSK3β were not significantly altered by gelsolin overexpression (Fig. 10C), insulin-dependent GLUT4 translocation to the PM was decreased in enhanced green fluorescent protein (EGFP)-positive gelsolin-overexpressing adipocytes (green box) compared to EGFP-negative adipocytes (Fig. 10D, yellow box). When the effect of gelsolin on insulin-stimulated GLUT4 translocation was tested by TIRFM, we found that the levels of PM-translocated GLUT4 were significantly downregulated in gelsolin-EGFP-expressing adipocytes (Fig. 10E and F). Furthermore, live real-time imaging of GB-Cy3 uptake revealed significantly decreased insulin-dependent glucose uptake in gelsolin-overexpressing adipocytes (Fig. 10G). Together, these data suggested that actin modulation in adipocytes could alter insulin-dependent glucose uptake ability.
FIG 10.
In adipocytes, actin severing protein regulates insulin-dependent GLUT4 translocation through dynamic remodeling of actin. EGFP-N1-gelsolin plasmid vector was transfected to differentiated 3T3-L1 adipocytes. (A) F-actin structure (phalloidin-TRITC, red) of gelsolin-EGFP-overexpressing adipocytes. The nucleus (Hoechst, blue) and EGFP (EGFP only or gelsolin-EGFP, green) are evident. Scale bar, 50 μm. (B and C) Immunoblot analyses of F/G-actin (B) and insulin signaling with or without insulin (10 nM) (C). WCL, whole-cell lysates. (D to F) mCherry-GLUT4 (red)-expressing 3T3-L1 adipocytes were transfected with gelsolin-EGFP (green). Insulin-dependent GLUT4 translocation to the PM in both gelsolin-EGFP-negative and gelsolin-EGFP-positive adipocytes was examined. Insulin treatment: 100 nM for 30 min. (D) Confocal microscopy images. Scale bar, 50 μm. Insets show ×2 magnifications of the indicated areas. The nucleus is indicated by Hoechst (blue) staining. (E and F) TIRF microscopy images (E) and PM GLUT4 intensity (F). Scale bar, 20 μm. (G) Insulin-dependent GB-Cy3 (red) uptake assay. Green, differential interference contrast (DIC). Insulin treatment: 100 nM for 30 min. Scale bar, 50 μm. Data represent means ± the SD. ***, P < 0.001 versus EGFP negative (Student t test).
DISCUSSION
Adipocytes are flexible and morphologically dynamic according to their anatomical locations, nutritional states, and environmental conditions. For energy homeostasis, adipocytes can efficiently assimilate and store circulating glucose in response to insulin (38, 39). Despite accumulating evidence that adipocytes with different shapes have distinct insulin sensitivities (40, 41), the physiological significance of adipocyte remodeling remains unclear. In this study, we show that LD configurations in adipocytes play crucial roles in modulating insulin sensitivity. Different physiological stimuli, such as cold or thermoneutral conditions, induced reversible adipocyte remodeling accompanied with the change of LD configuration and F/G-actin dynamics. In adipocytes, LD multilocularization upregulated F-actin organization with increased insulin-dependent GLUT4 trafficking to the PM, whereas unilocularization and/or enlargement of LD downregulated F-actin organization with decreased insulin-dependent GLUT4 trafficking to the PM. These data suggest that adipocyte remodeling with different LD configurations is crucial in determining insulin sensitivity through F/G-actin dynamics.
It has been reported that the insulin-dependent glucose uptake ability of brown adipocytes is significantly higher than that of white adipocytes, even though the levels of GLUT4 protein in brown and white adipocytes are comparable at room temperature (41–43). In this regard, it is conceivable that different LD configurations in white and brown adipocytes might be closely involved in the ability of insulin-dependent GLUT4 trafficking. We investigated this idea in several in vivo and ex vivo experiments. As shown in Fig. 4A, LD unilocularization in brown adipocytes upon thermoneutral stimulus reduced insulin-dependent GLUT4 trafficking to the PM. Conversely, β-adrenergic receptor agonist- or cold-induced LD multilocularization in white adipocytes was associated with elevated insulin-stimulated GLUT4 trafficking without significant changes in the total amounts of GLUT4 protein (Fig. 3, 5, and 6E). Thus, it is likely that differences in LD locularity between white and brown/beige adipocytes would affect insulin-dependent GLUT4 trafficking.
In adipocytes, the activation of phosphatidylinositol 3-kinase (PI3K)–Akt axis stimulates GLUT4 translocation to the PM, and the cytoskeleton plays an important role as a molecular railroad for GSVs during this process (44, 45). A recent study reported that acute (4-h) cold exposure or treatment with β-3 adrenergic agonist CL316,243 promoted glucose uptake and phosphorylation of Akt in WAT and BAT, due in part to the acute increase of plasma insulin (46). In contrast, we found that in cold-induced beige adipocytes with multilocular LDs, insulin-dependent glucose uptake was markedly elevated without significant alterations of the insulin signaling pathway (Fig. 1). Thus, it seems that there might be another mechanism(s), which could detour canonical insulin signaling to modulate insulin-dependent glucose uptake in adipocytes. As insulin sensitivity describes the degree of responsiveness of target cells or tissues to insulin (47, 48), adipocyte insulin sensitivity can be determined, at least partly, by the extent of absorbed glucose upon insulin. Thus, the translocation of GLUT4, a key glucose transporter in adipocytes, to the PM is important to determine insulin sensitivity in adipocytes. Given that not only the insulin signaling pathway but also the actin cytoskeleton is indispensable for insulin-dependent trafficking of GSVs in adipocytes (32, 33), actin dynamics would also contribute to determine insulin sensitivity. In this study, chemical inhibition of actin polymerization by CytD treatment downregulated the ratio of F/G-actin and decreased insulin-dependent glucose uptake in adipocytes (Fig. 8). Furthermore, the reduction of F/G-actin ratio by overexpression of gelsolin, which catalyzes actin disruption, impaired insulin-dependent GLUT4 trafficking and glucose uptake in adipocytes (Fig. 10). Hence, our data are consistent with the idea that actin dynamics, regulated by the F/G-actin ratio, are crucial in regulating insulin-stimulated trafficking of GSVs in adipocytes, which might be independent of the canonical insulin signaling cascade.
The concept that adipocyte remodeling modulates insulin sensitivity via F/G-actin dynamics could be at least partially explained by the kinetics of GSVs and cytoskeletal tracks. Theoretically, if there were no differences in the overall amounts of GSVs, it is feasible to speculate that greater access to the cytoskeletal tracks will enable increased trafficking of GSVs. In agreement with this suggestion, multilocular LD-containing adipocytes exhibited higher glucose uptake capacity, accompanied by potentiated insulin-stimulated trafficking of GSVs, compared to unilocular LD-containing adipocytes (Fig. 2 and 3). More importantly, analysis of primary adipocytes from lean and obese ATs indicated that the level of PM localized GLUT4 upon insulin was strongly and positively correlated with cortical F-actin structure (Fig. 6). The collective findings suggest that proper actin cytoskeleton formation and remodeling might be crucial for insulin-stimulated GLUT4 trafficking to the PM according to the configurations of LDs in adipocytes.
The transcriptome analyses revealed the upregulation of the actin severing genes gelsolin and cofilin 1 in HFD-induced hypertrophic adipocytes and the downregulation of these genes in brown/beige adipocytes. It has been reported that cofilin 1 knockout mice are embryonic lethal and that gelsolin knockout mice are viable with severe defects in platelet, leukocyte, and fibroblast functions due to uncontrolled F/G-actin dynamics (49, 50). Considering the enzymatic activity of gelsolin and cofilin 1, it appears that upregulation of actin severing activity in hypertrophic adipocytes might be responsible for the downregulation of the F/G-actin ratio and subsequent attenuation of insulin-dependent glucose uptake ability. Conversely, it is possible that the downregulation of actin-severing enzymes in brown/beige adipocytes results in the intrinsic features of well-organized F-actin and potentiation of insulin-dependent glucose uptake ability compared to white adipocytes. Thus, it seems that distinct F/G-actin profiles in white and brown/beige adipocytes might result from different levels of expression of the genes involved in the severing of F-actin. Although the mRNA and protein levels of actin severing genes in adipocytes were altered by LD configurations upon different pathophysiological stimuli, further studies are necessary to definitively determine whether LDs directly modulate actin cytoskeleton dynamics in adipocytes.
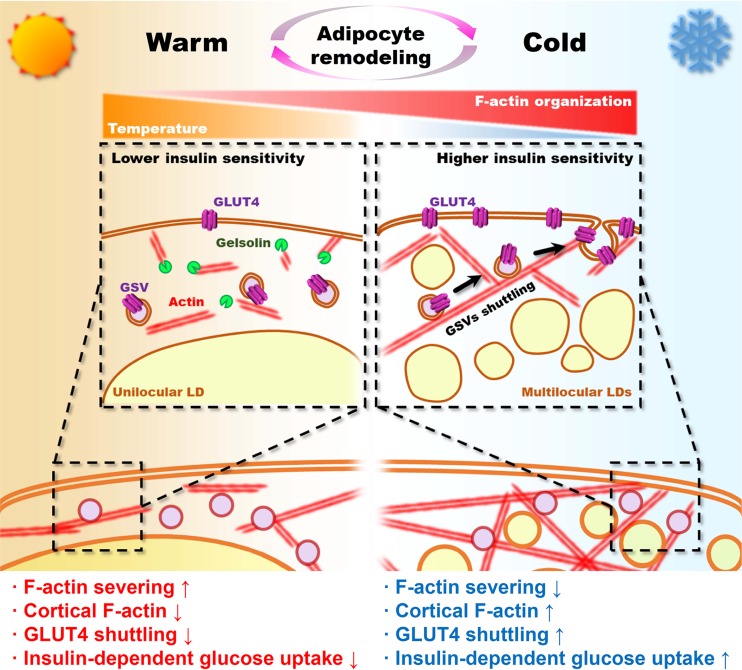
Here, we propose a unique role of LD configuration in adipocytes in determining the capacity of insulin-dependent glucose uptake. In adipocytes, LD size and locularity are variable and reversible depending on the adipocyte type and pathophysiological conditions. Differences in LD configuration could affect adipocyte morphology and F/G-actin dynamics, leading to the control of insulin-stimulated GLUT4 trafficking and glucose uptake in adipocytes. Consequently, in adipocytes, LD multilocularization would increase insulin-dependent glucose uptake, whereas LD unilocularization would decrease it (Fig. 11). Collectively, these data provide a novel insight to understand how adipocyte shape with different LD configurations could govern the insulin-dependent glucose utilization by modulating actin dynamics.
FIG 11.
Graphical abstract.
MATERIALS AND METHODS
Animals and treatments.
Seven- to eight-week-old male C57BL/6J, db/+, and db/db mice were obtained from Central Lab Animal, Inc. (Seoul, South Korea). All mice were maintained under specific-pathogen-free conditions and housed in solid-bottom cages with wood shavings for bedding in a room maintained at 25°C and with alternating 12-h cycles of light and dark (lights on at 07:00). After a stabilization period of at least 1 week, 8-week-old mice were initially fed a normal chow diet (NCD) and then a 60% high-fat diet (HFD) for the indicated times (Research Diets, Inc., New Brunswick, NJ). HFD-fed mice were compared to age-matched NCD-fed mice. The average initial body weights in each group of mice were not different. For the glucose tolerance test and glucose-stimulated insulin secretion, the mice were fasted for 12 h, basal blood samples were taken, and glucose was administered by intraperitoneal injection (2 g/kg). Blood samples were collected at 15, 30, 45, 60, 90, and 120 min after injection. For treatment with cytochalasin D (CytD), 8-week-old C57BL/6J mice were intraperitoneally injected with CytD (0.5 or 1 mg/kg; Sigma-Aldrich, St. Louis, MO) for 1 h. All animal procedures were performed in accordance with Seoul National University research guidelines for the use of laboratory animals.
Cell culture.
3T3-L1 preadipocytes were grown to confluence in Dulbecco modified Eagle medium (DMEM; Invitrogen Life Technologies, Carlsbad, CA) supplemented with 10% bovine calf serum (BCS; Invitrogen Life Technologies). Two days after the cells reached confluence (day 0), cell differentiation was induced for 48 h in DMEM containing 10% fetal bovine serum (FBS; Invitrogen Life Technologies), methylisobutylxanthine (520 μM), dexamethasone (1 μM), and insulin (167 nM). The culture medium was replaced on alternate days with DMEM containing 10% FBS and 167 nM insulin.
Oleic acid treatment.
Oleic acids (OAs; 500 μM; Sigma-Aldrich) were conjugated with bovine serum albumin (BSA) in the absence of free fatty acid and administered to cells. This was done by dissolving OAs in ethanol and diluting the solution in DMEM containing 1% FBS and 2% (wt/vol) BSA for 10 min at 55°C. Adipocytes were cultured in the medium containing the BSA-conjugated OAs for 6 to 7 days.
Cell sorting from adipose tissue.
Adipocytes and stromal vascular cells (SVCs) in epididymal white adipose tissues (eWATs), inguinal white adipose tissues (iWATs), or BAT from C57BL/6J mice (n = 3 to 5) were isolated as described previously (51). The fractions were pooled, and SVC pellets were prepared.
F/G-actin fractionation.
Adipocytes from differentiated 3T3-L1 cells or fractionated ATs were lysed in actin stabilizing lysis buffer [50 mM piperazine-N,N′-bis(2-ethanesulfonic acid) (PIPES; pH 6.9), 50 mM NaCl, 5 mM MgCl2, 5 mM EGTA (pH 8), 5% (vol/vol) glycerol, 0.1% (vol/vol) Nonidet P-40, 0.1% (vol/vol) Triton X-100, 0.1% (vol/vol) Tween 20, 1 mM ATP, and protease inhibitor cocktail (product code P8340); Sigma-Aldrich]. Volumes (200 μl) of lysates were centrifuged at 350 × g and room temperature for 5 min to pellet unbroken cells. Supernatants were centrifuged at 100,000 × g and 37°C for 1 h. Supernatants of the G-actin-containing extracts were then collected. F-actin-containing pellets were resuspended in 200 μl of ice-cold lysis buffer containing 10 μM CytD and then incubated on ice for 1 h to depolymerize F-actin. The resuspended pellets were gently mixed every 15 min. Then, 10-μl portions of pellet (F-actin) and supernatant (G-actin) fractions were subjected to immunoblot analysis. The F-actin and G-actin ratios were determined by densitometry by using ImageJ (National Institutes of Health, Bethesda, MD). The measurement of [F-actin in the pellet]/[actin in the whole-cell lysates] was divided by [G-actin in the supernatant]/[actin in the whole-cell lysates].
Quantitative RT-PCR.
Quantitative reverse transcription-PCR (qRT-PCR) was performed as previously described (52). Briefly, total RNA was extracted from 3T3-L1 adipocytes and primary adipocytes were isolated from eWAT, iWAT, and BAT. cDNA was synthesized using an Moloney murine leukemia virus reverse transcriptase kit according to the manufacturers’ instructions (Thermo Fisher Scientific, Waltham, MA). The primers used for quantitative real-time PCR were obtained from Bioneer (South Korea).
Immunoblot analysis.
3T3-L1 adipocytes or primary adipocytes isolated from eWATs, iWATs, and BATs were lysed with NETN buffer (20 mM Tris [pH 7.9], 1 mM EDTA, 100 mM NaCl, 0.5% NP-40, 1 mM Na3VO4, 100 mM NaF, and protease inhibitor cocktail tablets [Roche Diagnostics, Basel, Switzerland]). Total cell lysates were centrifuged at 12,000 rpm at 4°C for 15 min to remove fat debris. The protein concentration was determined using a BCA assay kit (Pierce, Rockford, IL). Immunoblot analyses were conducted as previously described (53). Akt (9272S), phospho-Akt/PKB (4051S), phospho-GSK3β (9336S), cofilin 1 (5175S), phospho-cofilin 1 (3311S), and panactin (4968S) antibodies were purchased from Cell Signaling Technology. GSK3β (610201) antibody was purchased from BD Bioscience. GAPDH (glyceraldehyde-3-phosphate dehydrogenase; G8795) antibody was obtained from Sigma-Aldrich (San Jose, CA).
Glucose uptake assay.
3T3-L1 adipocytes or primary adipocytes isolated from eWATs, iWATs, and BATs were incubated in low-glucose DMEM containing 0.1% BSA for 4 to 16 h at 37°C. Cells were stimulated with 100 nM insulin for 20 min at 37°C or not stimulated. Glucose uptake was initiated by the addition of [14C]deoxyglucose at a final concentration of 3 mol/liter for 10 min in HEPES-buffered saline (140 mM NaCl, 5 mM KCl, 2.5 mM MgCl2, 1 mM CaCl2, and 20 mM HEPES [pH 7.4]). The reaction was terminated by separating the cells from HEPES-buffered saline and [14C]deoxyglucose. After washes with ice-cold PBS, the cells were extracted using 0.1% sodium dodecyl sulfate, and scintillation counting was used to measure the 14C radioactivity. The protein concentration was determined, and the radioactivity was normalized to the protein concentration.
Lentivirus packaging and infection.
The lentiviral shuttle vectors containing the GLUT4-EGFP, myc-GLUT4-mCherry, or HA-GLUT4 constructs and three helper plasmids (encoding HIV-1 Gag-Pol, HIV-1 Rev, and vesicular stomatitis virus protein G [VSV-G] envelope protein) were cotransfected into HEK-293T cells by using the calcium phosphate coprecipitation method. The medium was removed and replaced with fresh medium 12 h after transfection. The medium containing the viral particles was harvested 48 h later and filtered through 0.45-μm-pore size filters. The virus-containing medium, along with 8 mg/ml of Polybrene (Sigma-Aldrich), was added to 3T3-L1 cells for overnight infection, and the medium was replaced with fresh 10% BCS–DMEM the following day.
GLUT4 translocation.
3T3-L1 adipocytes stably expressing HA-GLUT4 were fixed without permeabilization, stained with GFP-conjugated secondary anti-HA antibody, and imaged using TIRFM in the presence or absence of insulin (100 nM, 30 min).
Gelsolin overexpression.
The gelsolin-EGFP-N1 or gelsolin-PCDNA3.1 plasmid (1 μg of DNA per 105 cells) was transfected into fully differentiated 3T3-L1 adipocytes (7 to 8 days after differentiation induction) by electroporation (1,100-V single pulse for 30 ms). Fresh medium was chased 15 h after transfection. Experimental assays were conducted 24 h after a medium chase (∼40 h after transfection).
Immunocytochemistry.
3T3-L1 adipocytes were fixed with 4% formaldehyde in Dulbecco PBS (DPBS). The adipocytes were stained with primary antiperilipin antibody (20R-PP004; Fitzgerald, Acton, MA), anti-GLUT4 antibody (N-20; Santa Cruz Biotechnology, Dallas, TX), followed by cyanine 5-conjugated anti-goat antibody and fluorescein isothiocyanate-conjugated anti-goat antibody, and Hoechst 33342 (H3570; Life Technologies), respectively. The stained adipocytes were mounted with Vectashield solution (H-1000; Vector Laboratories, Inc., Burlingame, CA) and images were obtained using an LSM700 confocal microscope (Carl Zeiss, Oberkochen, Germany).
Total internal reflection fluorescence microscopy (TIRFM).
TIRFM imaging was performed using an inverted microscope system equipped with a 60 × 1.49 NA (numerical aperture) lens objective (Olympus, Tokyo, Japan). Images were collected using the DeltaVision OMX SR imaging system (GE Healthcare, Buckinghamshire, UK). All experiments were performed at 36°C.
CARS imaging.
ATs were mounted with DPBS after vascular perfusion of DPBS. LDs in adipocytes were visualized by coherent anti-Stokes Raman scattering (CARS) imaging using a model TCS SP8 CARS microscope (Leica Microsystems, Wetzlar, Germany). Pump and Stokes lasers were tuned to 14,140 cm−1 (or 707 nm) and 11,300 cm−1 (or 885 nm), respectively, to be in resonance with the CH2 symmetric stretch vibration at 2,840 cm−1.
In vitro glucose bioprobe uptake assay.
3T3-L1 adipocytes were cultured in Lab-Tek II 8-well chamber plates (Thermo Fisher Scientific). After differentiation, the culture medium was removed and replaced with a low-glucose FBS-free medium. The cells were maintained in this medium for 4 h and then incubated for 1 h in glucose-deficient FBS-free DMEM. For continuous monitoring of cellular glucose uptake using the DeltaVision imaging system (GE Healthcare), each eight-well chamber plate was loaded on the stage of the microscope and cotreated with GB-Cy3 (5 μM) (31) and insulin (100 nM). The temperature of the chamber was maintained at 37°C. Fluorescence images were recorded every 2 min. The images were digitized and saved on a computer for further analysis. The region of interest was drawn along the cell surface in optical images.
Ex vivo glucose bioprobe uptake assay.
eWATs, iWATs, and BATs were removed and sliced into sections measuring 5 by 5 by 2 mm. The sections were incubated in glucose-deficient DMEM (11966-025; Life Technologies) containing 0.1% BSA for 30 min at 37°C, followed by incubation with GB-Cy3 (5 μM) for 30 min in the absence or presence (1 μM) of insulin. After several washes with DPBS, the ATs were stained with Hoechst33342 (H3570; Life Technologies) and observed using the aforementioned LSM 700 or TCS SP8 CARS microscopes.
Statistical analysis.
Results represent data from multiple (three or more) independent experiments. Error bars represent standard deviation and P values were calculated using Student t test or analysis of variance (ANOVA).
Data availability.
Public microarray data were analyzed for gene ontology study. RNA-sequencing data sets used are available under Gene Expression Omnibus (GEO) accession numbers GSE8044 (6), GSE84860 (54), GSE74899 (55), and GSE13432 (56) (https://www.ncbi.nlm.nih.gov/geo).
Supplementary Material
ACKNOWLEDGMENTS
Fluorescent glucose bioprobe (GB-Cy3) was kindly provided by Seung-Bum Park, Department of Chemistry, Seoul National University, Seoul, South Korea. EGFP-N1-gelsolin vector was kindly provided by Jung-Woong Kim, Department of Life Science, Chung Ang University, Seoul, South Korea. Lentiviral vectors (myc-GLUT4-mCherry, HA-GLUT4, and GLUT4-EGFP) were kindly provided by Weiping Han, Singapore BioImaging Consortium, A*STAR, Singapore.
This study was supported by the National Creative Research Initiative Program (2011-0018312), funded by the Ministry of Education, Science, and Technology.
We have no conflicts of interest to declare.
Footnotes
Supplemental material for this article may be found at https://doi.org/10.1128/MCB.00210-19.
REFERENCES
- 1.Cannon B, Nedergaard J. 2004. Brown adipose tissue: function and physiological significance. Physiol Rev 84:277–359. doi: 10.1152/physrev.00015.2003. [DOI] [PubMed] [Google Scholar]
- 2.van Marken Lichtenbelt WD, Vanhommerig JW, Smulders NM, Drossaerts JM, Kemerink GJ, Bouvy ND, Schrauwen P, Teule GJ. 2009. Cold-activated brown adipose tissue in healthy men. N Engl J Med 360:1500–1508. doi: 10.1056/NEJMoa0808718. [DOI] [PubMed] [Google Scholar]
- 3.Cypess AM, Lehman S, Williams G, Tal I, Rodman D, Goldfine AB, Kuo FC, Palmer EL, Tseng YH, Doria A, Kolodny GM, Kahn CR. 2009. Identification and importance of brown adipose tissue in adult humans. N Engl J Med 360:1509–1517. doi: 10.1056/NEJMoa0810780. [DOI] [PMC free article] [PubMed] [Google Scholar]
- 4.Harms M, Seale P. 2013. Brown and beige fat: development, function and therapeutic potential. Nat Med 19:1252–1263. doi: 10.1038/nm.3361. [DOI] [PubMed] [Google Scholar]
- 5.Sohn JH, Kim JI, Jeon YG, Park J, Kim JB. 2018. Effects of three thiazolidinediones on metabolic regulation and cold-induced thermogenesis. Mol Cells 41:900–908. doi: 10.14348/molcells.2018.0294. [DOI] [PMC free article] [PubMed] [Google Scholar]
- 6.Seale P, Kajimura S, Yang W, Chin S, Rohas LM, Uldry M, Tavernier G, Langin D, Spiegelman BM. 2007. Transcriptional control of brown fat determination by PRDM16. Cell Metab 6:38–54. doi: 10.1016/j.cmet.2007.06.001. [DOI] [PMC free article] [PubMed] [Google Scholar]
- 7.Kajimura S, Spiegelman BM, Seale P. 2015. Brown and beige fat: physiological roles beyond heat generation. Cell Metab 22:546–559. doi: 10.1016/j.cmet.2015.09.007. [DOI] [PMC free article] [PubMed] [Google Scholar]
- 8.Schwartz MW, Kahn SE. 1999. Insulin resistance and obesity. Nature 402:860–861. doi: 10.1038/47209. [DOI] [PubMed] [Google Scholar]
- 9.Roberts-Toler C, O’Neill BT, Cypess AM. 2015. Diet-induced obesity causes insulin resistance in mouse brown adipose tissue. Obesity (Silver Spring) 23:1765–1770. doi: 10.1002/oby.21134. [DOI] [PMC free article] [PubMed] [Google Scholar]
- 10.Cui X, Nguyen NL, Zarebidaki E, Cao Q, Li F, Zha L, Bartness T, Shi H, Xue B. 2016. Thermoneutrality decreases thermogenic program and promotes adiposity in high-fat diet-fed mice. Physiol Rep 4:e12799. doi: 10.14814/phy2.12799. [DOI] [PMC free article] [PubMed] [Google Scholar]
- 11.Wallberg-Henriksson H, Zierath JR. 2015. Metabolism: exercise remodels subcutaneous fat tissue and improves metabolism. Nat Rev Endocrinol 11:198–200. doi: 10.1038/nrendo.2015.24. [DOI] [PubMed] [Google Scholar]
- 12.Bartelt A, Heeren J. 2014. Adipose tissue browning and metabolic health. Nat Rev Endocrinol 10:24–36. doi: 10.1038/nrendo.2013.204. [DOI] [PubMed] [Google Scholar]
- 13.Kanzaki M, Furukawa M, Raab W, Pessin JE. 2004. Phosphatidylinositol 4,5-bisphosphate regulates adipocyte actin dynamics and GLUT4 vesicle recycling. J Biol Chem 279:30622–30633. doi: 10.1074/jbc.M401443200. [DOI] [PubMed] [Google Scholar]
- 14.Kanzaki M, Watson RT, Khan AH, Pessin JE. 2001. Insulin stimulates actin comet tails on intracellular GLUT4-containing compartments in differentiated 3T3L1 adipocytes. J Biol Chem 276:49331–49336. doi: 10.1074/jbc.M109657200. [DOI] [PubMed] [Google Scholar]
- 15.Leto D, Saltiel AR. 2012. Regulation of glucose transport by insulin: traffic control of GLUT4. Nat Rev Mol Cell Biol 13:383–396. doi: 10.1038/nrm3351. [DOI] [PubMed] [Google Scholar]
- 16.Ng Y, Ramm G, Lopez JA, James DE. 2008. Rapid activation of Akt2 is sufficient to stimulate GLUT4 translocation in 3T3-L1 adipocytes. Cell Metab 7:348–356. doi: 10.1016/j.cmet.2008.02.008. [DOI] [PubMed] [Google Scholar]
- 17.Sano H, Kane S, Sano E, Miinea CP, Asara JM, Lane WS, Garner CW, Lienhard GE. 2003. Insulin-stimulated phosphorylation of a Rab GTPase-activating protein regulates GLUT4 translocation. J Biol Chem 278:14599–14602. doi: 10.1074/jbc.C300063200. [DOI] [PubMed] [Google Scholar]
- 18.Abel ED, Peroni O, Kim JK, Kim YB, Boss O, Hadro E, Minnemann T, Shulman GI, Kahn BB. 2001. Adipose-selective targeting of the GLUT4 gene impairs insulin action in muscle and liver. Nature 409:729–733. doi: 10.1038/35055575. [DOI] [PubMed] [Google Scholar]
- 19.Brozinick JT Jr, McCoid SC, Reynolds TH, Nardone NA, Hargrove DM, Stevenson RW, Cushman SW, Gibbs EM. 2001. GLUT4 overexpression in db/db mice dose-dependently ameliorates diabetes but is not a lifelong cure. Diabetes 50:593–600. doi: 10.2337/diabetes.50.3.593. [DOI] [PubMed] [Google Scholar]
- 20.Treadway JL, Hargrove DM, Nardone NA, McPherson RK, Russo JF, Milici AJ, Stukenbrok HA, Gibbs EM, Stevenson RW, Pessin JE. 1994. Enhanced peripheral glucose utilization in transgenic mice expressing the human GLUT4 gene. J Biol Chem 269:29956–29961. [PubMed] [Google Scholar]
- 21.Erickson HP. 2001. Cytoskeleton: evolution in bacteria. Nature 413:30. doi: 10.1038/35092655. [DOI] [PubMed] [Google Scholar]
- 22.Gunning PW, Ghoshdastider U, Whitaker S, Popp D, Robinson RC. 2015. The evolution of compositionally and functionally distinct actin filaments. J Cell Sci 128:2009–2019. doi: 10.1242/jcs.165563. [DOI] [PubMed] [Google Scholar]
- 23.Schmidt A, Hall MN. 1998. Signaling to the actin cytoskeleton. Annu Rev Cell Dev Biol 14:305–338. doi: 10.1146/annurev.cellbio.14.1.305. [DOI] [PubMed] [Google Scholar]
- 24.Spiegelman BM, Farmer SR. 1982. Decreases in tubulin and actin gene expression prior to morphological differentiation of 3T3 adipocytes. Cell 29:53–60. doi: 10.1016/0092-8674(82)90089-7. [DOI] [PubMed] [Google Scholar]
- 25.McDonald ME, Li C, Bian H, Smith BD, Layne MD, Farmer SR. 2015. Myocardin-related transcription factor A regulates conversion of progenitors to beige adipocytes. Cell 160:105–118. doi: 10.1016/j.cell.2014.12.005. [DOI] [PMC free article] [PubMed] [Google Scholar]
- 26.Yang W, Thein S, Lim CY, Ericksen RE, Sugii S, Xu F, Robinson RC, Kim JB, Han W. 2014. Arp2/3 complex regulates adipogenesis by controlling cortical actin remodelling. Biochem J 464:179–192. doi: 10.1042/BJ20140805. [DOI] [PubMed] [Google Scholar]
- 27.Spiegelman BM, Ginty CA. 1983. Fibronectin modulation of cell shape and lipogenic gene expression in 3T3-adipocytes. Cell 35:657–666. doi: 10.1016/0092-8674(83)90098-3. [DOI] [PubMed] [Google Scholar]
- 28.Lim CY, Bi X, Wu D, Kim JB, Gunning PW, Hong W, Han W. 2015. Tropomodulin3 is a novel Akt2 effector regulating insulin-stimulated GLUT4 exocytosis through cortical actin remodeling. Nat Commun 6:5951. doi: 10.1038/ncomms6951. [DOI] [PMC free article] [PubMed] [Google Scholar]
- 29.Nedergaard J, Cannon B. 2014. The browning of white adipose tissue: some burning issues. Cell Metab 20:396–407. doi: 10.1016/j.cmet.2014.07.005. [DOI] [PubMed] [Google Scholar]
- 30.Wu J, Bostrom P, Sparks LM, Ye L, Choi JH, Giang AH, Khandekar M, Virtanen KA, Nuutila P, Schaart G, Huang K, Tu H, van Marken Lichtenbelt WD, Hoeks J, Enerback S, Schrauwen P, Spiegelman BM. 2012. Beige adipocytes are a distinct type of thermogenic fat cell in mouse and human. Cell 150:366–376. doi: 10.1016/j.cell.2012.05.016. [DOI] [PMC free article] [PubMed] [Google Scholar]
- 31.Park J, Lee HY, Cho MH, Park SB. 2007. Development of a cy3-labeled glucose bioprobe and its application in bioimaging and screening for anticancer agents. Angew Chem Int ed Engl 46:2018–2022. doi: 10.1002/anie.200604364. [DOI] [PubMed] [Google Scholar]
- 32.Kim JI, Huh JY, Sohn JH, Choe SS, Lee YS, Lim CY, Jo A, Park SB, Han W, Kim JB. 2015. Lipid-overloaded enlarged adipocytes provoke insulin resistance independent of inflammation. Mol Cell Biol 35:1686–1699. doi: 10.1128/MCB.01321-14. [DOI] [PMC free article] [PubMed] [Google Scholar]
- 33.Kanzaki M, Pessin JE. 2001. Insulin-stimulated GLUT4 translocation in adipocytes is dependent upon cortical actin remodeling. J Biol Chem 276:42436–42444. doi: 10.1074/jbc.M108297200. [DOI] [PubMed] [Google Scholar]
- 34.Kusminski CM, Holland WL, Sun K, Park J, Spurgin SB, Lin Y, Askew GR, Simcox JA, McClain DA, Li C, Scherer PE. 2012. MitoNEET-driven alterations in adipocyte mitochondrial activity reveal a crucial adaptive process that preserves insulin sensitivity in obesity. Nat Med 18:1539–1549. doi: 10.1038/nm.2899. [DOI] [PMC free article] [PubMed] [Google Scholar]
- 35.Lee YS, Li P, Huh JY, Hwang IJ, Lu M, Kim JI, Ham M, Talukdar S, Chen A, Lu WJ, Bandyopadhyay GK, Schwendener R, Olefsky J, Kim JB. 2011. Inflammation is necessary for long-term but not short-term high-fat diet-induced insulin resistance. Diabetes 60:2474–2483. doi: 10.2337/db11-0194. [DOI] [PMC free article] [PubMed] [Google Scholar]
- 36.Southwick FS. 2000. Gelsolin and ADF/cofilin enhance the actin dynamics of motile cells. Proc Natl Acad Sci U S A 97:6936–6938. doi: 10.1073/pnas.97.13.6936. [DOI] [PMC free article] [PubMed] [Google Scholar]
- 37.Harterink M, da Silva ME, Will L, Turan J, Ibrahim A, Lang AE, van Battum EY, Pasterkamp RJ, Kapitein LC, Kudryashov D, Barres BA, Hoogenraad CC, Zuchero JB. 2017. DeActs: genetically encoded tools for perturbing the actin cytoskeleton in single cells. Nat Methods 14:479–482. doi: 10.1038/nmeth.4257. [DOI] [PMC free article] [PubMed] [Google Scholar]
- 38.Waki H, Tontonoz P. 2007. Endocrine functions of adipose tissue. Annu Rev Pathol 2:31–56. doi: 10.1146/annurev.pathol.2.010506.091859. [DOI] [PubMed] [Google Scholar]
- 39.Azeez OI, Meintjes R, Chamunorwa JP. 2014. Fat body, fat pad and adipose tissues in invertebrates and vertebrates: the nexus. Lipids Health Dis 13:71. doi: 10.1186/1476-511X-13-71. [DOI] [PMC free article] [PubMed] [Google Scholar]
- 40.Orava J, Nuutila P, Lidell ME, Oikonen V, Noponen T, Viljanen T, Scheinin M, Taittonen M, Niemi T, Enerback S, Virtanen KA. 2011. Different metabolic responses of human brown adipose tissue to activation by cold and insulin. Cell Metab 14:272–279. doi: 10.1016/j.cmet.2011.06.012. [DOI] [PubMed] [Google Scholar]
- 41.Daikoku T, Shinohara Y, Shima A, Yamazaki N, Terada H. 2000. Specific elevation of transcript levels of particular protein subtypes induced in brown adipose tissue by cold exposure. Biochim Biophys Acta 1457:263–272. doi: 10.1016/s0005-2728(00)00107-9. [DOI] [PubMed] [Google Scholar]
- 42.Nikami H, Shimizu Y, Endoh D, Yano H, Saito M. 1992. Cold exposure increases glucose utilization and glucose transporter expression in brown adipose tissue. Biochem Biophys Res Commun 185:1078–1082. doi: 10.1016/0006-291x(92)91736-a. [DOI] [PubMed] [Google Scholar]
- 43.Shimizu Y, Nikami H, Tsukazaki K, Machado UF, Yano H, Seino Y, Saito M. 1993. Increased expression of glucose transporter GLUT-4 in brown adipose tissue of fasted rats after cold exposure. Am J Physiol 264:E890–E895. doi: 10.1152/ajpendo.1993.264.6.E890. [DOI] [PubMed] [Google Scholar]
- 44.Miinea CP, Sano H, Kane S, Sano E, Fukuda M, Peranen J, Lane WS, Lienhard GE. 2005. AS160, the Akt substrate regulating GLUT4 translocation, has a functional Rab GTPase-activating protein domain. Biochem J 391:87–93. doi: 10.1042/BJ20050887. [DOI] [PMC free article] [PubMed] [Google Scholar]
- 45.Stockli J, Fazakerley DJ, James DE. 2011. GLUT4 exocytosis. J Cell Sci 124:4147–4159. doi: 10.1242/jcs.097063. [DOI] [PMC free article] [PubMed] [Google Scholar]
- 46.Heine M, Fischer AW, Schlein C, Jung C, Straub LG, Gottschling K, Mangels N, Yuan Y, Nilsson SK, Liebscher G, Chen O, Schreiber R, Zechner R, Scheja L, Heeren J. 2018. Lipolysis triggers a systemic insulin response essential for efficient energy replenishment of activated brown adipose tissue in mice. Cell Metab 28:644–655 e644. doi: 10.1016/j.cmet.2018.06.020. [DOI] [PubMed] [Google Scholar]
- 47.Olefsky JM. 1976. The insulin receptor: its role in insulin resistance of obesity and diabetes. Diabetes 25:1154–1162. doi: 10.2337/diab.25.12.1154. [DOI] [PubMed] [Google Scholar]
- 48.Czech MP. 2017. Insulin action and resistance in obesity and type 2 diabetes. Nat Med 23:804–814. doi: 10.1038/nm.4350. [DOI] [PMC free article] [PubMed] [Google Scholar]
- 49.Gurniak CB, Perlas E, Witke W. 2005. The actin depolymerizing factor n-cofilin is essential for neural tube morphogenesis and neural crest cell migration. Dev Biol 278:231–241. doi: 10.1016/j.ydbio.2004.11.010. [DOI] [PubMed] [Google Scholar]
- 50.Witke W, Sharpe AH, Hartwig JH, Azuma T, Stossel TP, Kwiatkowski DJ. 1995. Hemostatic, inflammatory, and fibroblast responses are blunted in mice lacking gelsolin. Cell 81:41–51. doi: 10.1016/0092-8674(95)90369-0. [DOI] [PubMed] [Google Scholar]
- 51.Sohn JH, Lee YK, Han JS, Jeon YG, Kim JI, Choe SS, Kim SJ, Yoo HJ, Kim JB. 2018. Perilipin 1 (Plin1) deficiency promotes inflammatory responses in lean adipose tissue through lipid dysregulation. J Biol Chem 293:13974–13988. doi: 10.1074/jbc.RA118.003541. [DOI] [PMC free article] [PubMed] [Google Scholar]
- 52.Lee G, Jang H, Kim YY, Choe SS, Kong J, Hwang I, Park J, Im SS, Kim JB. 2019. SREBP1c-PAX4 axis mediates pancreatic beta-cell compensatory responses upon metabolic stress. Diabetes 68:81–94. doi: 10.2337/db18-0556. [DOI] [PubMed] [Google Scholar]
- 53.Shin KC, Hwang I, Choe SS, Park J, Ji Y, Kim JI, Lee GY, Choi SH, Ching J, Kovalik JP, Kim JB. 2017. Macrophage VLDLR mediates obesity-induced insulin resistance with adipose tissue inflammation. Nat Commun 8:1087. doi: 10.1038/s41467-017-01232-w. [DOI] [PMC free article] [PubMed] [Google Scholar]
- 54.Zhu Y, Gao Y, Tao C, Shao M, Zhao S, Huang W, Yao T, Johnson JA, Liu T, Cypess AM, Gupta O, Holland WL, Gupta RK, Spray DC, Tanowitz HB, Cao L, Lynes MD, Tseng YH, Elmquist JK, Williams KW, Lin HV, Scherer PE. 2016. Connexin 43 mediates white adipose tissue beiging by facilitating the propagation of sympathetic neuronal signals. Cell Metab 24:420–433. doi: 10.1016/j.cmet.2016.08.005. [DOI] [PMC free article] [PubMed] [Google Scholar]
- 55.Shao M, Ishibashi J, Kusminski CM, Wang QA, Hepler C, Vishvanath L, MacPherson KA, Spurgin SB, Sun K, Holland WL, Seale P, Gupta RK. 2016. Zfp423 maintains white adipocyte identity through suppression of the beige cell thermogenic gene program. Cell Metab 23:1167–1184. doi: 10.1016/j.cmet.2016.04.023. [DOI] [PMC free article] [PubMed] [Google Scholar]
- 56.Xue Y, Petrovic N, Cao R, Larsson O, Lim S, Chen S, Feldmann HM, Liang Z, Zhu Z, Nedergaard J, Cannon B, Cao Y. 2009. Hypoxia-independent angiogenesis in adipose tissues during cold acclimation. Cell Metab 9:99–109. doi: 10.1016/j.cmet.2008.11.009. [DOI] [PubMed] [Google Scholar]
Associated Data
This section collects any data citations, data availability statements, or supplementary materials included in this article.
Supplementary Materials
Data Availability Statement
Public microarray data were analyzed for gene ontology study. RNA-sequencing data sets used are available under Gene Expression Omnibus (GEO) accession numbers GSE8044 (6), GSE84860 (54), GSE74899 (55), and GSE13432 (56) (https://www.ncbi.nlm.nih.gov/geo).


