

Abstract
Strong inherited predisposition to breast cancer is estimated to cause about 5–10% of all breast cancer cases. As the known susceptibility genes, such as BRCA1 and BRCA2, explain only a fraction of this, additional predisposing genes and related biological mechanisms are actively being searched for. We have recently identified a recurrent MCPH1 germline mutation, p.Arg304ValfsTer3, as a breast cancer susceptibility allele. MCPH1 encodes a multifunctional protein involved in maintenance of genomic integrity and it is also somatically altered in various cancer types, including breast cancer. Additionally, biallelic MCPH1 mutations are causative for microcephaly and at cellular level premature chromosome condensation. To study the molecular mechanisms leading to cancer predisposition and malignant conversion, here we have modeled the effect of MCPH1 p.Arg304ValfsTer3 mutation using gene‐edited MCF10A breast epithelial cells. As a complementary approach, we also sought for additional potential cancer driver mutations in MCPH1 p.Arg304ValfsTer3 carrier breast tumors. We show that mutated MCPH1 de‐regulates transcriptional programs related to invasion and metastasis and leads to downregulation of histone genes. These global transcriptional changes are mirrored by significantly increased migration and invasion potential of the cells as well as abnormal chromosomal condensation both before and after mitosis. These findings provide novel molecular insights to MCPH1 tumor suppressor functions and establish a role in regulation of transcriptional programs related to malignant conversion and chromosomal assembly. The MCPH1 p.Arg304ValfsTer3 carrier breast tumors showed recurrent tumor suppressor gene TP53 mutations, which were also significantly over‐represented in breast tumors with somatically inactivated MCPH1.
Keywords: MCPH1, tumor suppression, breast cancer susceptibility, transcriptome sequencing, cancer genetics
Short abstract
What's new?
Even though several breast cancer susceptibility genes have been identified, additional molecular mechanisms behind predisposition and the promotion of malignant conversion remain obscure. Here, the authors show that a previously‐identified breast cancer predisposing allele in tumor suppressor MCPH1 deregulates transcriptional programs related to invasion and metastasis and leads to down‐regulation of histone genes. These global transcriptional changes are mirrored by increased cell migration and invasion potential and abnormal chromosomal condensation. The findings provide novel molecular insights into MCPH1 tumor suppressor functions and establish a role in the regulation of transcriptional programs related to malignant conversion and chromosomal assembly.
Abbreviations
- B‐H
Benjamini‐Hochberg correction
- CNA
copy number alteration
- DDR
DNA damage response
- DMEM
Dulbecco's Modified Eagle's Medium
- EdU
5‐ethynyl‐2′‐deoxyuridine
- EGF
epidermal growth factor
- FACS
fluorescence‐activated cell sorting
- FFPE
formalin‐fixed paraffin‐embedded
- GO
gene ontology
- IPA
ingenuity pathway analysis
- MAF
minor allele frequency
- MCPH1
microcephalin
- PBS
phosphate‐buffered saline
- PCC
premature chromosome condensation
- PFA
paraformaldehyde
- RNA‐Seq
RNA‐sequencing
- TCGA
The Cancer Genome Atlas
- WES
whole‐exome sequencing
Introduction
Inherited mutations are well‐recognized risk factors for breast cancer1 and new susceptibility genes and related biological mechanisms are constantly being searched for. Recently, we identified an inherited breast cancer predisposing mutation in MCPH1 gene. This Northern Finnish founder mutation (c.904_916del), observed using massive parallel sequencing of DNA damage response (DDR) genes, causes a protein truncation (p.Arg304ValfsTer3) and abolishes two out of three BRCT domains of MCPH1. This mutation showed significant enrichment in both familial and unselected breast cancer cases compared to healthy controls and 40% of the studied carrier tumors showed a lack of the wild type allele in the classical loss of heterozygosity analysis. Besides breast cancer, one‐third of the 21 identified mutation‐positive families exhibited also brain tumors and/or sarcomas.2 The tumor suppressor function of MCPH1 has also been indicated by other studies. MCPH1 has been identified in a genetic screen as a transcriptional repressor of hTERT, the catalytic subunit of human telomerase that is frequently activated in cancers,3 and it also shows somatic downregulation and alterations in various cancer types, including breast tumors and breast cancer cell lines. Furthermore, low MCPH1 expression has been correlated with an increased likelihood of breast cancer metastasis.4, 5, 6
MCPH1 encodes 835 amino‐acid protein with reported roles at least in DDR, cell cycle control and maintenance of chromosomal integrity.5, 7 Curiously, MCPH1 has also been identified as causative gene for primary microcephaly (OMIM #251200), a neurodevelopmental disorder defined by marked reduction in brain size, mental retardation and short stature.8, 9 At cellular level, the key phenotype seen in these patients is premature chromosome condensation (PCC).10, 11 During DDR, MCPH1 is also involved in the regulation of chromatin condensation status, as it is required to recruit and maintain ATP‐dependent chromatin remodeling complex SWI/SNF at the sites of DNA lesion.5 The chromatin relaxation in turn facilitates the recruitment of other DNA repair proteins, including ATM, BRCA2 and RAD51, to the damage site.5, 12 Although the interaction between MCPH1 and chromatin remodeling complex is enhanced during DDR, the basal level of interaction exists irrespective of damage.13 Besides DDR, SWI/SNF complex plays a key role in regulation of gene expression and is considered as a major contributor to tumorigenesis and malignancy, and many gene loci encoding its subunits are either mutated or deleted in cancers.14, 15, 16
To gain better understanding of the molecular mechanisms leading to hereditary breast cancer predisposition and malignant conversion, here we have modeled the effect of the previously identified cancer predisposing mutation, MCPH1 p.Arg304ValfsTer3, using CRISPR/Cas9 gene‐edited MCF10A breast epithelial cells. Since MCPH1 associates with chromatin remodeling SWI/SNF complex, the effect of the MCPH1 mutation on gene expression programs was studied using transcriptome sequencing (RNA‐Seq) followed by in vitro characterization. In addition, to explore more details of the molecular mechanisms required for malignant conversion in MCPH1 p.Arg304ValfsTer3 mutation background, we have sought for additional genetic changes, potential cancer drivers, in breast tumors of MCPH1 p.Arg304ValfsTer3 carriers using whole‐exome sequencing. Obtained results were compared to breast tumors with somatically inactivated MCPH1. As a result, this study provides novel molecular insights to the multifunctional MCPH1 and establishes a role in regulation of transcriptional programs related to cancer development and maintenance of chromosomal high‐order structures. The MCPH1 p.Arg304ValfsTer3 carrier breast tumors had recurrent tumor suppressor gene TP53 mutations, which were also significantly over‐represented in breast tumors with somatically inactivated MCPH1.
Materials and Methods
Creating MCPH1 mutations to MCF10A cells using CRISPR/Cas9 system
Guide oligos for creating MCPH1 mutation in the proximity of c.904_916del mutation site with CRISPR/Cas9N system17 were designed by using the CRISPR design web tool (http://crispr.mit.edu). Annealed guide pairs were subcloned18 into px461 [pSpCas9n(BB)‐2A‐GFP] vector (Addgene)17 and chemically competent Stbl3 E. coli cells were transformed with the all‐in‐one guide plasmids. Plasmid DNA was extracted using Endofree Plasmid Maxi kit (Qiagen) and concentrated with UltraClean GelSpin DNA Extraction kit (MoBio). Proper subcloning was confirmed by Sanger sequencing the plasmids using U6 F primer (ABI3500xL).
Non‐tumorigenic breast epithelial MCF10A cells were cultured in 37°C with 5% CO2 using growth media containing DMEM/F12, 5% horse serum, 20 ng/mL EGF, 0.5 mg/mL hydrocortisone, 100 ng/mL choleratoxin, 10 μg/mL insulin and 1× pen/strep (100× containing 10,000 U penicillin and 10 mg/mL streptomycin).19 Transfection of parental MCF10A cells with guide plasmids was performed using Amaxa Cell Line Nucleofector Kit L (Lonza) and Nucleofector with program X005 (Lonza). The control MCF10A cell line was transfected with an empty px461 plasmid vector. Transfected cells were sorted after 2 days by fluorescence‐activated cell sorting (FACS) to a 96‐well plate and cultured cell clones were screened for mutations using heteroduplex analysis with Bioanalyzer (Agilent). Mutations were confirmed by Sanger sequencing.
Immunoblotting analysis of MCPH1
To determine the effect at protein level, control and gene‐edited cells were lysed in NETN‐300 buffer containing protease inhibitor tablets (Complete Mini EDTA‐free, Roche Diagnostics) and phosphatase inhibitor cocktail (Set V, Merck). Freshly prepared cell lysates were denatured in Laemmli buffer and separated by SDS‐PAGE using 4–15% Mini‐PROTEAN TGX gels (Bio‐Rad). Proteins were transferred onto Immobilon‐P PVDF membrane (Millipore) and the membranes were blocked with buffer containing 1% BSA and 1% milk powder. Primary MCPH1 antibody (R&D systems, AF3998) was a goat polyclonal antibody raised against the amino acids 1–250 mapping to the N‐terminus of MCPH1 of human origin. Anti‐β‐Actin antibody AC15 (Abcam) was used as a loading control. Secondary antibodies were HRP‐conjugated AffiniPure Rabbit anti‐Goat and Goat anti‐Mouse IgG (H + L) antibodies (Jackson ImmunoResearch). The signal was detected using SuperSignal West Pico chemiluminescent substrate (Thermo Scientific) and Fujifilm LAS‐3000 system.
Immunocytochemistry
MCPH1 mutant and control MCF10A cells were grown overnight in 8‐chamber slides (Lab‐Tek II) coated with poly‐l‐lysine (Sigma‐Aldrich) and fixed with 4% paraformaldehyde (PFA) for 15 min. The cells were permeabilized with 0.25% Triton X‐100 for 10 min, blocked with buffer containing 1% BSA for 30 min and labeled with anti‐tubulin beta primary antibody (clone KMX1, monoclonal, MAB3408 LOT:2452493, mouse) in +4°C overnight. Goat anti‐mouse (IgG H + L, superclonal, alexafluor 555 conjugate, A28180, Thermo Scientific) was used as the secondary antibody. Samples were co‐stained with DAPI (Ab104139 fluoroshield mounting medium with DAPI, LOT:GR201489‐2) and images were captured with Plan‐Apochromat 40×/1.4 objective with Zeiss LSM 780 confocal microscope (Carl Zeiss).
Library preparation and RNA‐Seq
Total RNA of early passage (passage <10 after transfection) MCPH1 mutant and control MCF10A cell lines was extracted using RNeasy plus Mini Kit (Qiagen). Both cell lines were grown in 6‐well plates to 50% confluency and subjected to RNA isolation in triplicates. The quality and quantity of total RNA was assessed using Agilent Bioanalyzer 2100 (Agilent Technologies) with Eukaryote Total RNA Nano Kit (Agilent) and Qubit RNA Broad Range kit (Life Technologies). RNA integrity number (RIN) of the samples ranged from 9.5 to 10. A total of 500 ng of RNA was used for library preparation using TruSeq® Stranded Total RNA LT (with Ribo‐Zero™ Gold) Library preparation kit (Illumina) following the manufacturer's instructions. Quantification and quality assessment of the libraries were performed using Bioanalyzer 2100 with DNA 1000 Kit (Agilent), Qubit Broad Range DNA‐kit (Life Technologies) and qPCR KAPA Library quantification kit (KAPABiosystems). Libraries were sequenced using Illumina NextSeq550 platform in high‐output, pair‐ended 2 × 76 cycle mode, followed by FASTQ generation within BaseSpace (Illumina). This resulted in minimum 50 million reads per sample with average Q30 values of 95.44%.
RNA‐Seq analysis
RNA‐Seq data was analyzed in BaseSpace computing environment (Illumina). The FASTQ files were aligned to the human genome (GRCh38/hg38) using TopHat2 (version 2.1.0) together with Bowtie2 (version 2.2.6) and differential gene expression analysis was performed using DESeq2 (version 1.1.0). The obtained results were confirmed with Chipster software platform, CSC.20 Significantly differentially expressed genes (with adjusted p‐value [q] <0.05 and log2 fold change >0.5 or <−0.5) were further analyzed by Ingenuity Pathway Analysis (IPA, Qiagen). In IPA, significant enrichment of the genes in diseases or pathways was estimated by bias‐corrected z‐score (>2 for increased activity and <−2 for decreased activity of the pathway) and Benjamini‐Hochberg (B‐H) multiple testing corrected p‐value to monitor the false discovery rate (<0.05). Enrichments were confirmed using the DAVID functional annotation tool (https://david.ncifcrf.gov/) as a complementary approach.
RT‐PCR for confirmation of differentially expressed genes
For RT‐PCR experiments, RNA was converted to cDNA (iScript Reverse Transcription Supermix for RT‐qPCR kit, Bio‐Rad) and RT‐PCR reactions were performed using iQ Supermix (Bio‐Rad) and CFX96 instrument (Bio‐Rad). The results were analyzed with CFX Manager™ Software (Bio‐Rad). Analyzed genes included both up‐ and down‐regulated genes identified in RNA‐Seq (CHAF1B, CLIC2, FN1, MCAM, MSLN and SPARC). CLK2 and GUSB were used as reference genes. Primer sequences are presented in Supporting Information Table S1.
Live‐cell imaging
Cells (40,000 per well) were seeded into a glass bottom dish coated with poly‐l‐lysine. 0.2 μg/mL Hoechst 33342 stain (Thermo Fisher) was added into MCF10A culture media and cells were incubated in 37°C with 5% CO2 for 24 h. Images were captured at multiple points with 5‐min intervals using Zeiss Cell Observer fluorescence microscope (Carl Zeiss) with LD LCI Plan‐Apochromat 25×/0.8 objective, equipped with an on‐stage CO2 and temperature controlled incubator (Pecon). Chromosome condensation time before mitosis was calculated for 40 mutant and control cells from live‐cell data. Online video 1 (Supporting Information) was created using alpha Plan‐Apochromat 63×/1.46 objective with 10‐min imaging intervals and Zen 2011 Black edition software (Carl Zeiss).
Cell cycle analysis
Cell cycle distribution was analyzed by flow cytometry. The cells were labeled with 10 μM thymidine analogue 5‐ethynyl‐2′‐deoxyuridine (EdU, Invitrogen) for 15 min, then trypsinized and fixed in suspension with 4% paraformaldehyde (PFA). Cells were permeabilized using 0.25% Triton X‐100 and blocked with 5% donkey serum. EdU detection was performed according to the protocol of Click‐iT® EdU Alexa Fluor® 647 Flow Cytometry Assay Kit (Invitrogen). Alexa 488‐conjugated anti‐phospho H3 (Ser10) antibody (clone 3H10, Merck) was used to detect mitotic cells. DNA content was determined with DAPI. The samples were measured with LSR Fortessa flow cytometer and analyzed using the FlowJo software (both BD Biosciences).
3D cell culturing
Eighteen thousand cells were plated on 200 μL of growth factor‐reduced extracellular matrix hydrogel (Cultrex, Reduced growth factor Type 2, Amsbio) in 35 mm glass‐bottom μ‐dish (Ibidi). Culturing media was MCF10A media with exceptions of 2% horse serum, 5 ng/μL EGF and 2.5% Cultrex.19 Cells were cultured for 7 days in triplicate plates. Imaging was performed with Zeiss Cell observer Spinning Disc Confocal Microscope (Carl Zeiss) using Plan NeoFluar 10×/0.30 Ph objective. The area (μm2) of 300 spheroids of both mutants and controls was analyzed with ImageJ. Lumen structure was studied by staining the spheroids with 5 μg/mL Hoechst 33342 and imaged with Plan‐Apochromat 20×/0.8 objective.
Transwell migration and invasion assays
For the migration assay, 100,000 cells in MCF10A assay media (with 2% horse serum and no EGF) were plated as triplicates in uncoated transwell inserts (pore size 8.0 μm, #3464, Corning) and incubated for 24 h with normal MCF10A media in lower chambers as chemoattractant. Remaining cells were removed from top of the membrane with cotton tip applicators and inserts were washed with PBS, fixed with 4% PFA and stained with 1 μg/mL Hoechst 33342. Each membrane was imaged in multiple points using Spinning disc microscope with LD LCI Plan‐Apochromat 25×/0.8 objective. The invasion assay was performed similarly as the migration assay, but cells were plated as quadruplicates in ready matrigel‐coated transwell inserts (pore size 8.0 μm, BioCoat™ Matrigel® Invasion Chambers, #354578, Corning) and fixed with 70% ethanol.
Whole‐exome sequencing of MCPH1 p.Arg304ValfsTer3 carrier breast tumors
DNA was extracted from formalin‐fixed paraffin‐embedded (FFPE) breast tumor tissue samples of ten MCPH1 p.Arg304ValfsTer3 mutation carriers using GeneRead DNA FFPE Kit (Qiagen). Matched DNA samples isolated from blood were used to exclude the germline origin of the observed mutations. Both tumor and normal samples were whole‐exome sequenced (WES) using the Nextera Rapid Capture Enrichment kit (Illumina) according to the manufacturer's instructions. Sequencing was performed using NextSeq550 platform in high‐output, pair‐ended 2 × 76 cycle mode, followed by FASTQ generation within BaseSpace (Illumina). FASTQ files were aligned to the reference genome Hg19 using BWA Enrichment (BaseSpace, Illumina). Somatic SNPs and indels were called using MuTect221 in taito.csc.fi platform (https://research.csc.fi). To reduce germline variants and sequencing artifacts, a panel of matched normal (germline) WES samples (n = 10) was created and used as a filter during MuTect2 analysis. dbSNP database (https://www.ncbi.nlm.nih.gov/variation/docs/human_variation_vcf/) was used to filter out all variants with minor allele frequency (MAF) >1% to confirm exclusion of germline events especially in regions with low coverage in the sequenced normal samples. Further filtering of variants was performed in VariantStudio (Illumina) by including only variants with 1) total read depth of ≥10×, 2) minimum alternative allele frequency of 10% and 3) alternative allele being present at least in five reads. To exclude FFPE‐induced artifacts, more stringent criteria was set for C > T/G > A substitutions as suggested by Wong et al. 2014: 1) the alternative allele had to be present in at least 6 reads and 2) threshold for minimum alternative variant frequency was set to 15%.22 In the end, nine FFPE tumor samples were used for the analysis, as one sample was excluded due to suspected high amount of normal cell contamination. Subsequent mutational signature analysis was performed with deconstructSigs package in R23 for six of the samples (three tumors did not reach the mutation rate threshold required for the analysis). The signatures were identified by grouping the mutations into 96 classes according to the nucleotide changes and adjacent bases.24
The obtained somatic driver mutation results from MCPH1 p.Arg304ValfsTer3 carrier tumors were compared to public data from tumors with somatic MCPH1 deficiency. For this, mutational data from TCGA provisional dataset of invasive breast cancer (963 samples with sequencing and copy number alteration [CNA] data) was retrieved from cBioPortal.6 Breast tumors with MCPH1 deficiency were selected from all the samples based on the presence of deep‐deletion affecting the MCPH1 locus. The prevalence of recurrently mutated driver genes found in MCPH1 p.Arg304ValfsTer3 mutation carrier tumors was investigated in the TCGA dataset. Results were confirmed using a METABRIC dataset, consisting of 2051 samples with sequencing and CNA data.
Statistical analyses
χ2‐test was used to compare PCC phenotype frequency between mutant and control cells and to compare the frequency of somatic TP53 and PIK3CA mutations in somatically MCPH1‐depleted and wild type breast tumors. Independent samples two‐tailed t‐test was used for comparison of means of 3D spheroid sizes, number of G1 phase cells in flow cytometry, number of migrated and invaded cells in transwell assays and chromosome condensation times in live‐cell imaging. Statistical analyses were performed using IBM SPSS Statistics 22.0 for Windows (IBM Corp.) and p‐values <0.05 were considered significant.
Results
MCPH1 gene‐edited breast epithelial cells show premature chromosome condensation phenotype
CRISPR/Cas9 editing of MCF10A breast epithelial cell line resulted in biallelic protein‐truncating MCPH1 mutations and created premature stop codons (p.Gln303ProfsTer7 and p.Leu302PhefsTer4, respectively) in the very close proximity of the Finnish founder mutation (p.Arg304ValfsTer3). Analogous to the founder mutation,2 both alleles were stable at mRNA level. Immunoblotting analysis showed absence of wild type (~110 kDa) and presence of truncated (~35 kDa) MCPH1 protein in the edited cells (Supporting Information Fig. S1). The PCC cellular phenotype, a hallmark of biallelic MCPH1 deficiency, was confirmed from fixed DAPI‐stained cells. MCPH1 mutant cells displayed a significantly larger proportion of PCC phenotype cells (185/1301, 14.2%) when compared to the control line (12/1632, 0.7%), OR = 22.4, 95% CI = 12.4–40.3, p = 1.97 × 10−53 (Fig. 1).
Figure 1.
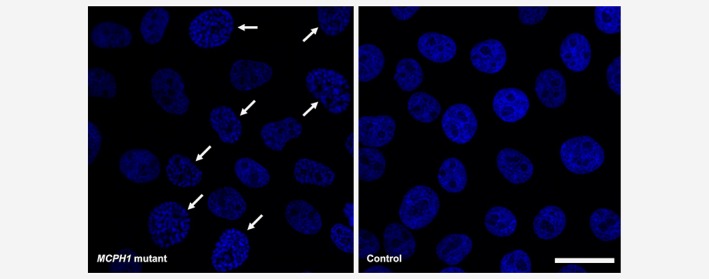
MCPH1‐mutated MCF10A cells display the PCC phenotype. A significantly larger proportion of PCC phenotype cells (indicated with arrows) is seen in MCPH1 mutants compared to controls in Hoechst 33342‐stained fixed cells. Scale bar 25 μm. [Color figure can be viewed at wileyonlinelibrary.com]
MCPH1 mutated cells show alteration in gene expression profiles
Based on the association of MCPH1 with SWI/SNF complex with a key role in regulation of gene expression,13 we explored the effect of MCPH1 mutation in transcriptional programs, potentially involved in regulation of growth and/or other networks critical for the development of mammary epithelial cells. Total RNA‐Seq was performed for the MCPH1 mutant and control cell lines, with minimum of 50 million reads per sample. DESeq2 and principal component analysis (PCA) showed the mutant and control cell lines being distinct from each other (Supporting Information Fig. S2A) and having clearly differential gene expression patterns, as 2,530 differentially expressed genes were observed with significant p‐adjusted values (q‐value) (heatmap, Supporting Information Fig. S2B). The differentially expressed genes were further sorted according to the largest positive and negative log2 fold changes (log2FC) (Supporting Information Table S2), and selected genes were confirmed with RT‐PCR (Supporting Information Fig. S3).
Three most significantly downregulated genes were COCH (log2FC = −3.1, q = 3.7 × 10−146) encoding a highly conserved protein with GO (Gene Ontology) annotated molecular functions in collagen binding, NLGN4X (log2FC = −2.9, q = 5.2 × 10−83), a cell adhesion molecule with function in protein–protein interactions at synapses25 but also with altered expression in breast cancer,26 and KIF7 (log2FC = −2.0, q = 3.0 × 10−37), involved in regulation of microtubular dynamics and essential for hedgehog signaling27 (Supporting Information Table S2). Other downregulated genes included DENND2D, guanine nucleotide exchange factor (GEF) previously linked to suppression of non‐small cell lung cancer proliferation and tumorigenicity, and SPARC, involved in extracellular matrix synthesis and promotion of changes to cell shape that can enhance tumor cell invasion. A notable downregulation was also observed for a group of genes encoding histones, as a total of 38 histone genes showed significantly decreased expression in MCPH1 mutated cells. In addition, other nucleosome structure affecting factors were significantly downregulated, including histone chaperone ASF1B and chromatin assembly factor CHAF1B.
The most up‐regulated genes in MCPH1‐mutated cells were CLIC2 (log2FC = 3.3, q = 3.4 × 10−142), SLC27A6 (log2FC = 2.9, q = 1.6 × 10−101) and GLDC (log2FC = 2.5, q = 1.3 × 10−148). CLIC2 encodes chloride intracellular channel protein, which modulates the activity of RYR2 receptor and inhibits the calcium influx. It is also causative for one form of X‐linked syndromic mental retardation.28 SLC27A6 is involved in translocation of long‐chain fatty acids across the plasma membrane, and GLDC in the glycine cleavage system catalyzing the degradation of glycine. Multiple components of the glycine/serine pathway have been proposed to act as metabolic oncogenes.29 Other up‐regulated genes included MSLN, a cell adhesion protein overexpressed in epithelial mesotheliomas and ovarian cancers,30 and FRMD3, a cytoskeletal binding protein that acts as a putative tumor suppressor in lung cancer.31
Pathway analysis of differentially expressed genes
Enrichment in diseases, functions and pathways for the differentially expressed genes (391 genes with log2FC >0.5 or <−0.5) was assessed by using the IPA classification system. Of the canonical pathways, two with most significant overrepresentation were “DNA methylation and transcriptional repression signaling” (Benjamini‐Hochberg (B‐H) multiple testing correction p‐value = 0.0003) and “Acute phase response signaling “(p = 0.0003), the latter being defined as a rapid inflammatory response that can also be triggered by neoplastic growth besides infection (Table 1). DNA methylation and transcriptional signaling was driven by decreased expression of histone class H4, whereas acute phase response signaling involved various genes, all up‐regulated. These genes included complement complex genes (C1R, C1S and CFB) and serum amyloids (SAA2 and SAA1) that are potential biomarkers for certain tumors, and also several kinases (serine/threonine kinase AKT3, mitogen‐activated kinase MAPK13 and phosphoinositide 3‐kinases PIK3R3 and PIK3CD). These gene enrichment results were supported by DAVID functional annotation tool analysis. Genes under‐expressed in MCPH1 mutant cells exhibited the most significant clustering in “Nucleosome core” class (p = 4.5 × 10−52) together with other DNA‐binding categories and methylation, all mainly driven by histone genes. Genes with positive log2FC were most enriched in “Innate immunity” pathway (p = 1.4 × 10⁻⁶) and other immune response‐related functions comprising partly the same genes, such as complement factors, as in the acute phase response signaling class obtained from IPA.
Table 1.
Enrichment of differentially expressed genes in diseases, functions and pathways analyzed with IPA
| Canonical Pathways | p‐value1 | #Molecules | z‐score2 | Example molecules |
|---|---|---|---|---|
| DNA methylation and transcriptional repression signaling | 3.00E‐04 | 7 | NA | HIST1H4 class |
| Acute phase response signaling | 3.00E‐04 | 14 | 1.73 | AKT3, C1R, C1S, CFB, FN1, IL1B, MAPK13, PIK3CD, SAA1, SAA2 |
| Diseases and functions | p‐value1 | #Molecules | z‐score2 | Example molecules4 |
|---|---|---|---|---|
| Cancer | 1.03E‐25–3.69E‐3 | 216 | ||
| Metastasis | 1.41E‐07 | 54 | 2.9 | AKT3, F2R, FGFR2, FN1, IGFBP2, IL1B, MCAM, SERPINA1, TNC |
| Advanced malignant tumor | 1.85E‐07 | 58 | 2.9 | AKR1C2, CFH, DPYSL3, MCAM, MFAP5, MSLN, RAB31, TNC |
| Invasion of mammary tumor cells | 5.23E‐04 | 7 | 2.6 | CSF1, F2R, FN1, MCAM, NOTCH1, S100A7, S100A8 |
| Cellular Movement | 5.75E‐15–3.39E‐03 | 127 | ||
| Homing of cells | 1.03E‐05 | 37 | 3.9 | CCL28, FN1, GNAZ, IGFBP3, IL1B, LCP1, LPAR3, SAA1, SEMA3B |
| Invasion of cells | 1.69E‐14 | 70 | 3.8 | AZGP1, CDH4, DCN, EYA2, LCP1, MCAM, PLA2G16, SPARC |
| Chemotaxis | 8.17E‐06 | 36 | 3.6 | CCL28, FN1, GNAZ, ILB1, LCP1, LPAR3, SAA1, SEMA3B, SERPINA1 |
| Cellular Assembly and Organization | 3.11E‐04–2.61E‐15 | 117 | ||
| Organization of cytoskeleton | 6.41E‐05 | 67 | 2.4 | CDH4, DOCK10, DPYSL3, IL1B, KRT13, LCP1, SPARC, TACC2, TNC |
| Organization of cytoplasm | 2.83E‐04 | 69 | 2.4 | CDH4, DOCK10, DPYSL3, FN1, KRT13, LCP1, RAB31, S100A8, SPARC |
| Microtubule dynamics | 8.11E‐04 | 55 | 2.1 | CDH4, DOCK10, DPYSL3, ILB1, LCP1, RAB31, SPARC, TNC, UCHL1 |
| DNA Replication, Recombination, and Repair | 8.69E‐07–2.61E‐15 | 48 | ||
| Formation of nucleosomes | 5.27E‐14 | 17 | NA | ASF1B, HIST1H3 class, HIST1H4 class, HIST2H3D |
Benjamini‐Hochberg‐corrected p‐value.
Bias‐corrected z‐score.
Value below 2 after bias correction.
Expanded list of molecules in Table S3, Supporting Information.
For the “diseases” category in IPA, cancer pathways showed significant enrichment (p = 1.0 × 10⁻²⁵–3.69 × 10⁻³) and involved 55.2% (216/391) of the analyzed genes. The most significant activated functions under the cancer category were “metastasis” (p = 1.4 × 10⁻⁷) and “advanced malignant tumor” (p = 1.9 × 10⁻⁷), both driven mainly by the same genes, along with “invasion of mammary tumor cells” (p = 5.2 × 10⁻⁴) (Table 1, Supporting Information Table S3). These genes included MCAM, a developmentally regulated cell adhesion protein involved in tumor spread in melanoma,32 and fibronectin FN1, which shows overexpression in breast cancer cell lines and luminal B breast cancer, and knockdown of which has been reported to inhibit cell migration and invasion.33, 34 Both genes showed upregulation in MCPH1 mutant cell line (Supporting Information Table S2, Fig. S3). Of the molecular and cellular functions, “cellular movement, cellular assembly and organization” were significantly enriched, together with “DNA replication, recombination and repair”. These functions included microtubule dynamics (p = 8.1 × 10⁻⁴) and formation of nucleosomes (p = 5.3 × 10⁻¹⁴). Altogether, histone‐related functions, inflammatory responses and malignant behavior are among the main pathways showing altered activity in MCPH1 mutant cells.
MCPH1 mutant cells show aberrant chromosome condensation timing and have invasive properties
The chromosomal condensation status of MCPH1‐mutated MCF10A cells were studied further using live‐cell imaging. By measuring the time from visible chromosome condensation to the breakdown of nuclear envelope, MCPH1 mutated cells were shown to have significantly prolonged condensation time in the G2 phase of the cell cycle (mean = 3 h 16 min) compared to controls (mean = 7 min), p = 9.64 × 10⁻¹⁹ (Fig. 2, Online video 1, Supporting Information). Moreover, the chromosome decondensation time was on average 1 h 6 min in mutant cells, while it was under 5 min in the control lines (with the 5 min imaging interval chromosome condensation did not visibly continue after telophase) (Online video 1, Supporting Information). Prolonged chromatin condensation during telophase and cytokinesis in mitotic MCPH1 mutant cells was also confirmed using immunofluorescence imaging of fixed cells (Supporting Information Fig. S4). When investigating the cell cycle distribution, MCPH1 mutants had overrepresentation of cells in G1 cell cycle phase compared to controls (Supporting Information Fig. S5).
Figure 2.
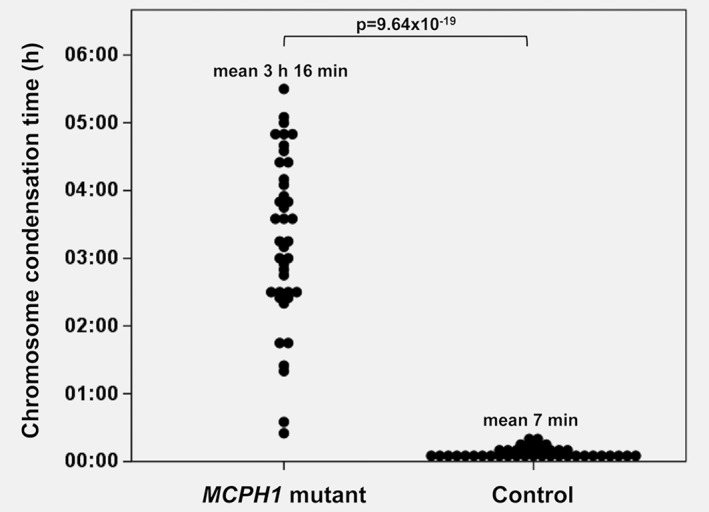
MCPH1‐mutated cells show significantly prolonged chromosome condensation time in live‐cell imaging. Mean condensation time in G2 phase of the cell cycle was 3 h 16 min (SD = 1 h 14 min) for the mutant cells and 7 min (SD = 4 min) for the controls (p = 9.64 × 10⁻¹⁹, Student's t‐test).
According to the transcriptional profiling, differentially expressed genes in MCPH1 mutated cells were significantly enriched in functions related to invasion in tumorigenesis. To study whether this was reflected at cellular level, migration and invasion assays were performed. Using both uncoated and matrigel‐coated transwell inserts, MCPH1‐mutated cells exhibited a higher ability to transfer through the membrane in both migration (p = 0.026) and invasion (p = 0.00043) assays when compared to controls (Fig. 3). We also cultured the cells in 3D for 7 days. In 3D culture, MCF10A cell line forms regular circular spheroids with lumen inside, mimicking the cellular architecture of mammary gland. Typically, cancerous cells form larger spheroids, loose the hollow lumen or form complex multiacinar structures.19 The shape of MCPH1 mutant spheroids did not differ from the control ones, but the cross‐sectional area of MCPH1 mutant spheroids was 46% larger (mean = 2,473 μm2) than that in controls (mean = 1,695 μm2), p = 8.72 × 10⁻¹⁸ (Fig. 4).
Figure 3.
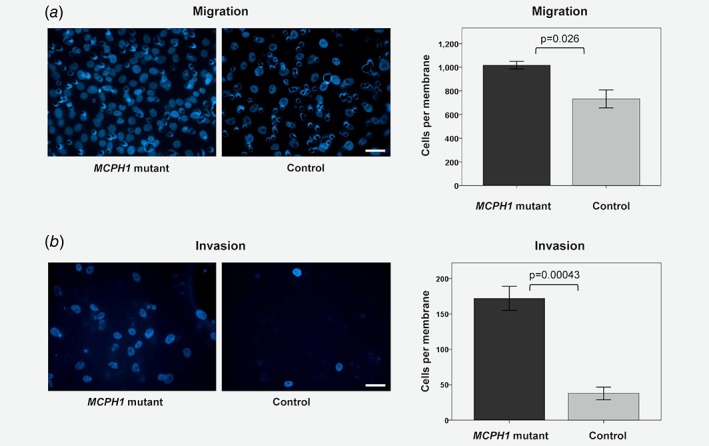
MCPH1 mutated cells show a higher level of migration and invasion. (a) In the migration assay (with uncoated transwell inserts) the mean number of migrated cells counted per membrane was 1,018 for the mutants and 732 for the controls (p = 0.026). (b) In the invasion assay (with matrigel‐coated transwell inserts) the mean number of invaded cells counted per membrane was 172 for the mutants and 38 for the controls (p = 0.00043). On the left panel are representative images of Hoechst 33342‐stained membranes (scale bar 40 μm) and on the right mean (±SE) number of cells counted per membrane, compared with Student's t‐test. [Color figure can be viewed at wileyonlinelibrary.com]
Figure 4.
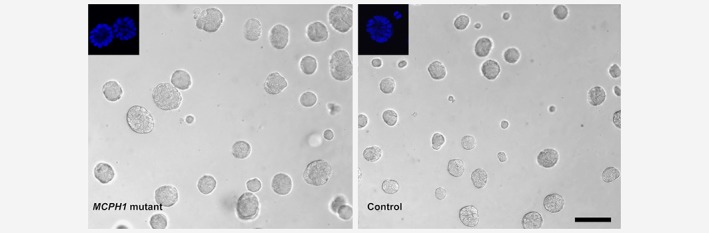
MCPH1 mutant cells form larger spheroids in 3D culture. Mean cross‐sectional area of the spheroids was 2,473 μm2 (SD = 1,164 μm2) for MCPH1 mutant cells and 1,695 μm2 (SD = 979 μm2) for controls (p = 8.72 × 10⁻¹⁸, Student's t‐test). Lumen structures of Hoechst 33342‐stained spheroids are shown in upper left corners. Scale bar 100 μm. [Color figure can be viewed at wileyonlinelibrary.com]
Breast tumors of germline MCPH1 p.Arg304ValfsTer3 carriers have recurrent somatic TP53 and PIK3CA driver mutations
To gain more details about the molecular mechanisms required for malignant conversion in MCPH1 p.Arg304ValfsTer3 mutation background, we have sought for additional genetic changes, i.e. potential cancer drivers, in MCPH1 p.Arg304ValfsTer3 carrier breast tumors as a complementary approach. Samples from previously identified2 p.Arg304ValfsTer3 mutation carriers were subjected to whole‐exome sequencing, and altogether nine samples were used in the analysis. The average mutation rate, defined as number of mutations per Mb, in MCPH1 carrier tumors (1.32 per Mb, range 0.67–2.22) was equivalent to that previously reported for whole‐exome sequenced breast tumors (1.66 per Mb, range 0.47–10.5).35 Mutational signature analysis of six samples revealed three tumors exhibiting signature 5 and one tumor signature 1, respectively, both of these signatures being possibly related to age at diagnosis (Table 2). The remaining two samples showed signature 3, which has been linked to homologous recombination repair deficiency and associated with BRCA1/2 mutations.24 Fourteen potential somatic driver gene mutations in the nine studied tumors were identified (Table 2). Recurrent mutations were observed in TP53 (3/9, 33%) and PIK3CA genes (4/9, 44%), these being mutually exclusive. Two of the analyzed tumor samples had no somatic mutations in known putative breast cancer driver genes according to the classifications by Nik‐Zainal et al.24
Table 2.
Histology, hormonal receptor status, mutational signature class and identified putative breast cancer driver gene mutations in MCPH1 p.Arg304ValfsTer3 carrier tumors
| Patient | Histology | ER/PR/HER2 | MCPH1 status | Mutational signature1 | Putative driver gene mutation1 |
|---|---|---|---|---|---|
| 1 | Ductal inv. | +/+/− | LOH of wt | 5 | TP53 p.K132 N SF3B1 p.R315X |
| 2 | Ductal inv. | +/+/− | No LOH | 5 | PIK3CA p.N345K |
| 3 | Intracys. pap. | +/+/− | No LOH | 3 | PIK3CA p.E545K TBX3 p.L207PfsX20 |
| 4 | Ductal inv. | +/+/− | LOH of wt | 5 | Not detected |
| 5 | Ductal inv. | −/−/− | No LOH | 3 | TP53 p.M246K |
| 6 | Ductal inv. | −/−/− | LOH of wt | 1 | TP53 p.R342P SMARCA4 p.R1633Q FGFR1 p.P189QfsX17 |
| 7 | Lobular inv. | +/+/− | LOH of mut | NA | PIK3CA p.E542K CDH1 p.R598X CBFB p.Q133X |
| 8 | Ductal inv. | −/−/− | No LOH | NA | Not detected |
| 9 | Ductal inv. | −/−/− | No LOH | NA | PIK3CA p.H1047L PREX2 p.K838 N |
According to Nik‐Zainal et al.24
Abbreviations: ER, estrogen receptor; HER2, human epidermal growth factor receptor 2; intracys, intracystic; inv, invasive; LOH, loss of heterozygosity; mut, mutation; NA, not available; pap, papillary carcinoma; PR, progesterone receptor; wt, wild type.
To study whether TP53 and PIK3CA mutations are common also in somatically MCPH1‐depleted tumors, the provisional TCGA breast cancer dataset using the cBioPortal6 was explored. In total, 54 samples out of 963 (6%) harbored deep deletions affecting the MCPH1 locus. Analysis of the mutation prevalence revealed that tumors with MCPH1 alterations show strong enrichment of TP53 mutations (57% in MCPH1 altered vs. 29% in MCPH1 non‐altered, p = 2.9 × 10⁻⁵, OR = 3.26) (Supporting Information Table S4), but not PIK3CA mutations (39% in MCPH1 altered vs. 32% in MCPH1 non‐altered, p = 0.382, OR = 1.32). The over‐representation of TP53 mutations was further replicated in the METABRIC breast cancer dataset where TP53 was mutated in 73% of the MCPH1 altered tumors while only in 36% of the non‐altered tumors (p = 1.27 × 10⁻⁴, OR = 4.9).
Discussion
In this study, we examined the role of MCPH1 tumor suppressor in regulation of transcriptional profiles and malignant conversion using massive parallel sequencing and in vitro characterization of gene‐edited MCF10A breast epithelial cells. The cells had biallelic premature stop codons at exon 8, where also the Finnish breast cancer predisposing founder mutation is located, thereby abolishing the two C‐terminal BRCT domains of full‐length MCPH1. Current results show that (i) mutated MCPH1 alters transcriptional profiles of breast epithelial cells, (ii) most of the downregulated genes were encoding histones, building blocks of nucleosomes that play a crucial role in chromatin condensation status, (iii) MCPH1 mutated cells exhibited prolonged chromatin condensation both before and after mitosis, (iv) differentially expressed genes were also highly enriched in known cancer‐related functions, indicating that MCPH1 mutation promotes malignant conversion, (v) MCPH1 mutant cells exhibited higher levels of migration and invasion and (vi) breast tumors with inactivated MCPH1 show over‐representation of TP53 mutations.
The transcriptomic analysis showed clear differential gene expression pattern in MCPH1 mutated cells compared to controls. Significantly decreased expression of histone genes was the most drastic single finding. Although not previously reported, this is in coherence with the hallmark of biallelic MCPH1 deficiency, the cellular PCC phenotype, which is mechanistically resulting from abnormal chromatin compaction. Altogether 38 histone encoding genes, including various subtypes of the core histones H2A, H2B, H3 and H4, and also the linker histone H1,36 were downregulated along with other factors, such as histone chaperone ASF1B and chromatin assembly factor CHAF1B, affecting nucleosome assembly.37, 38 Defects in various histone subtypes has been reported to have distinct effect on cells. For instance, H1.2 depletion causes cell cycle G1‐phase arrest and reduced expression of several cell cycle genes, whereas H1.4 knockdown in a breast cancer cell line leads to cell death.39 Interestingly, monoallelic missense germline mutations affecting the histone H4 tail lysine 91 were recently reported in three patients with a syndrome featuring microcephaly, intellectual disability and growth delay. The patient‐derived fibroblasts showed lowered expression of several other histone genes as well,40 which together with the current results strongly suggests a link between histone depletion and the microcephaly phenotype. Live‐cell imaging revealed that the chromosome condensation time is significantly prolonged in MCPH1 mutant cells and markedly uncoupled from mitosis, covering also part of the G2 and G1 phases. However, the cell cycle division of the cells appeared to be otherwise unaffected, although there was an excess of G1 cells compared to controls. Supporting results have also been obtained in a very recent study concluding that the chromosome condensation phenotype of MCPH1 deficient cells is uncoupled from cell cycle progression.41
Besides nucleosome involved functions, the pathway analysis of differentially expressed genes showed significant enrichment in various other functions related to cancer, including invasion of cells, organization of cytoskeleton and cytoplasm as well as various microtubule dynamics. Indeed, whereas the cytoskeleton is important in normal cellular function, it can be subverted in cancer cells, which can contribute to changes in cell growth, stiffness, movement and invasiveness.42 Many of the upregulated genes have a role in cell connections, including MSLN, a cell adhesion protein overexpressed in several cancers, MCAM, a cell adhesion protein involved in tumor spread in melanoma and enhanced motility in breast cancer cell lines,43 and FN1, an extracellular matrix component regulating cellular behavior.44 Although alteration of these functions is important for malignant conversion, cell adhesion properties are critical in different developmental stages as well, including the brain development during the embryogenesis.45, 46 Furthermore, although not overrepresented in the pathway analysis, it is interesting that the third most upregulated gene encodes a mitochondrial metabolic glycine cleavage system enzyme, GLDC. One of the main functions of this cleavage system is required in maintenance of normal glycine levels in the brain and its defects are causative for nonketotic hyperglycinemia. Curiously, a link between glycine metabolism and tumorigenesis has also been reported, although there might be several metabolic changes that can support cell growth.29
The observed transcriptional profile changes were mirrored by higher levels of cell migration and invasion potential of MCPH1 mutant cells. Moreover, in 3D culture, MCPH1 mutants formed larger spheroids than controls. This is similar to what has been observed in previous studies utilizing an MCF10A model, where the cells expressing human papillomavirus HPV E7 oncoprotein formed 30% larger spheroids than the parental cells.19 Although multipotent, the currently used MCF10A cells are defined as non‐cancerous breast epithelial cells, thus their full‐blown malignant conversion could require additional mutations in specific proto‐oncogenes or tumor suppressors along with the currently modeled MCPH1 mutation.
More details about the molecular mechanisms required for malignant conversion in MCPH1 mutation background were obtained from exome‐sequencing of breast tumors of MCPH1 p.Arg304ValfsTer3 germline carriers. Since these tumors exhibited a similar mutation frequency that has generally been observed in breast cancer and as these were characterized by mutually exclusive TP53 and PIK3CA mutations, the MCPH1 germline mutation carrier tumors did not show any notable differences to breast cancer in general. Further investigations revealed a statistically significant enrichment of TP53 mutations among the MCPH1‐deficient sporadic breast tumors. These findings indicate that MCPH1 deficiency and TP53 mutations might have a co‐effect on promotion of tumorigenesis. MCPH1 mutations can cause genomic instability, thus increasing the probability for TP53 mutations to arise. The combined effect is also supported by a previous study by Liang et al. 2015, where MCPH1 and TP53 double mutants developed tumors significantly earlier than mice lacking TP53 or MCPH1 alone.47
In conclusion, this study provides novel molecular insights to tumor suppressor functions of MCPH1, and expands its role from a simply defined player in DDR to much broader context (Fig. 5). The transcriptome analysis of early‐passage MCPH1 mutated MCF10A cells exhibited significant transcriptional changes in numerous genes involved in known cancer‐related functions, thus providing additional explanation for the multifunctionality of MCPH1 and how its mutations can promote malignant conversion. Moreover, multiple histone encoding genes had lower expression in MCPH1 mutant cells, thereby expanding the list of potential mechanistic causes for changes in chromatin remodeling and the PCC phenotype. Altogether, the current results support MCPH1 being an important regulator of chromatin structure and indicate that along with the members of SWI/SNF chromatin remodeling complex, MCPH1 plays a key role in regulation of gene expression and, as such, controls diverse cellular processes, including those associated with cancer development.
Figure 5.
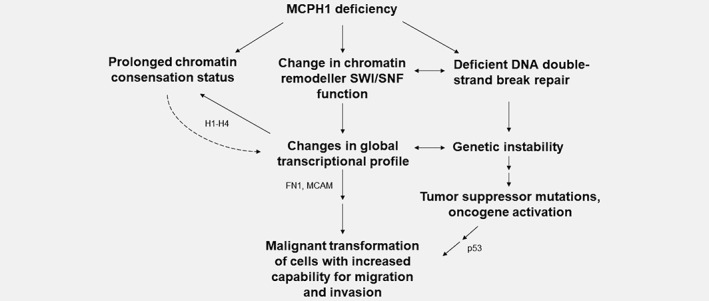
A model illustrating connections between MCPH1 deficiency and tumorigenesis. Putative contributing molecules based on current results are shown.
Data availability statement
The data that support the findings of this study are openly available in ftp://ftp‐trace.ncbi.nlm.nih.gov/sra/review/SRP168203_20181113_100053_2726e05d1c01c63b0742fdbb3d89c0bc.
Author contributions
K.P. and A.T. conceived the study. A.T, H.P., H.T., S.K, and R.D. participated in cell line creation and cell phenotype experiments. N.L. performed western blot and FACS analysis. A.T. and V‐P.R. carried out microscopy imaging. T.M. and L.E. analyzed WES and TCGA data. A.T., T.M., L.E. and K.P. performed RNA‐Seq bioinformatics and statistical analysis. K.P and A.T. wrote the manuscript and all the authors read and approved the final manuscript.
Supporting information
Fig. S1 Immunoblot of CRISPR/Cas9‐edited MCPH1 mutant and control MCF10A cell lines. Mutant cell line shows absence of wild type (~110 kDa) and presence of truncated (~35 kDa) MCPH1 protein.
Figure S2. MCPH1 mutant and control cells have distinct gene expression profiles. a) Principal component analysis (PCA) shows gene expression patterns of MCPH1 mutant and control cell lines being distinct from each other, principal component 1 explaining 93% of the variation between the samples. b) Differential gene expression patterns presented as a heatmap based on DESeq2 results. Red indicates decreased gene expression and green increased expression.
Figure S3. Six of the differentially expressed genes in RNA‐Seq were analyzed with RT‐PCR. a) CLIC2 and MCAM, b) CHAF1B and c) MSLN, FN1 and SPARC. All analyzed genes showed similar differential expression in the cell lines with both methods. Results are mean (±SE) expression of 3 replicates.
Figure S4. Representative images of mitotic phases of MCPH1 mutated and control MCF10 cells. Mutant cells show PCC phenotype and prolonged chromatin condensation during telophase and cytokinesis. Fixed cells were stained with DAPI (blue) and anti‐tubulin (red). Scale bar 25 μm.
Figure S5. MCPH1 mutant cells have larger proportion of G1 phase cells. Cell cycle distribution analysis by flow cytometry shows MCPH1 mutant cell line having more cells in G1 phase (43.7%) than controls (33.4%), p = 0.036. Means of three independent experiments (±SD), Student's t‐test.
Table S1 RT‐PCR primers used for confirming differentially expressed genes in RNA‐Seq
Table S2. Differentially expressed genes (log2 fold change >0.5 or <−0.5) between the MCPH1 mutant and control cell lines in the RNA‐Seq, analyzed with DESeq2
Table S3. The expanded list of molecules enriched in cancer and invasion‐related pathways in IPA
Table S4. TP53 mutation frequency in MCPH1altered and non‐altered breast tumors
Online video 1. MCPH1 mutant MCF10A cells show prolonged chromosome condensation. Live‐cell imaging of Hoechst 33342‐stained cells shows significantly prolonged chromosome condensation in MCPH1 mutant cells both before and after mitosis when compared to controls. Time hh:mm.
Acknowledgements
We thank Meeri Otsukka, Leena Keskitalo and Annika Väntänen for technical assistance, and Professor Winqvist for support. Biocenter Oulu sequencing center and Light Microscopy Core Facility are acknowledged for their services.
Conflict of interest: The authors declare that they have no competing interests.
References
- 1. Couch FJ, Nathanson KL, Offit K. Two decades after BRCA: setting paradigms in personalized cancer care and prevention. Science 2014;343:1466–70. [DOI] [PMC free article] [PubMed] [Google Scholar]
- 2. Mantere T, Winqvist R, Kauppila S, et al. Targeted next‐generation sequencing identifies a recurrent mutation in MCPH1 associating with hereditary breast cancer susceptibility. PLoS Genet 2016;12:e1005816. [DOI] [PMC free article] [PubMed] [Google Scholar]
- 3. Lin SY, Elledge SJ. Multiple tumor suppressor pathways negatively regulate telomerase. Cell 2003;113:881–9. [DOI] [PubMed] [Google Scholar]
- 4. Richardson J, Shaaban AM, Kamal M, et al. Microcephalin is a new novel prognostic indicator in breast cancer associated with BRCA1 inactivation. Breast Cancer Res Treat 2011;127:639–48. [DOI] [PubMed] [Google Scholar]
- 5. Rai R, Dai H, Multani AS, et al. BRIT1 regulates early DNA damage response, chromosomal integrity, and cancer. Cancer Cell 2006;10:145–57. [DOI] [PMC free article] [PubMed] [Google Scholar]
- 6. Gao J, Aksoy BA, Dogrusoz U, et al. Integrative analysis of complex cancer genomics and clinical profiles using the cBioPortal. Sci Signal 2013;6:pl1. [DOI] [PMC free article] [PubMed] [Google Scholar]
- 7. Lin SY, Rai R, Li K, et al. BRIT1/MCPH1 is a DNA damage responsive protein that regulates the Brca1‐Chk1 pathway, implicating checkpoint dysfunction in microcephaly. Proc Natl Acad Sci USA 2005;102:15105–9. [DOI] [PMC free article] [PubMed] [Google Scholar]
- 8. Woods CG, Bond J, Enard W. Autosomal recessive primary microcephaly (MCPH): a review of clinical, molecular, and evolutionary findings. Am J Hum Genet 2005;76:717–28. [DOI] [PMC free article] [PubMed] [Google Scholar]
- 9. Moawia A, Shaheen R, Rasool S, et al. Mutations of KIF14 cause primary microcephaly by impairing cytokinesis. Ann Neurol 2017;82:562–77. [DOI] [PubMed] [Google Scholar]
- 10. Trimborn M, Bell SM, Felix C, et al. Mutations in microcephalin cause aberrant regulation of chromosome condensation. Am J Hum Genet 2004;75:261–6. [DOI] [PMC free article] [PubMed] [Google Scholar]
- 11. Neitzel H, Neumann LM, Schindler D, et al. Premature chromosome condensation in humans associated with microcephaly and mental retardation: a novel autosomal recessive condition. Am J Hum Genet 2002;70:1015–22. [DOI] [PMC free article] [PubMed] [Google Scholar]
- 12. Wu X, Mondal G, Wang X, et al. Microcephalin regulates BRCA2 and Rad51‐associated DNA double‐strand break repair. Cancer Res 2009;69:5531–6. [DOI] [PMC free article] [PubMed] [Google Scholar]
- 13. Peng G, Yim EK, Dai H, et al. BRIT1/MCPH1 links chromatin remodelling to DNA damage response. Nat Cell Biol 2009;11:865–72. [DOI] [PMC free article] [PubMed] [Google Scholar]
- 14. Roberts CW, Orkin SH. The SWI/SNF complex–chromatin and cancer. Nat Rev Cancer 2004;4:133–42. [DOI] [PubMed] [Google Scholar]
- 15. Reisman D, Glaros S, Thompson EA. The SWI/SNF complex and cancer. Oncogene 2009;28:1653–68. [DOI] [PubMed] [Google Scholar]
- 16. Decristofaro MF, Betz BL, Rorie CJ, et al. Characterization of SWI/SNF protein expression in human breast cancer cell lines and other malignancies. J Cell Physiol 2001;186:136–45. [DOI] [PubMed] [Google Scholar]
- 17. Ran FA, Hsu PD, Wright J, et al. Genome engineering using the CRISPR‐Cas9 system. Nat Protoc 2013;8:2281–308. [DOI] [PMC free article] [PubMed] [Google Scholar]
- 18. Cong L, Ran FA, Cox D, et al. Multiplex genome engineering using CRISPR/Cas systems. Science 2013;339:819–23. [DOI] [PMC free article] [PubMed] [Google Scholar]
- 19. Debnath J, Muthuswamy SK, Brugge JS. Morphogenesis and oncogenesis of MCF‐10A mammary epithelial acini grown in three‐dimensional basement membrane cultures. Methods 2003;30:256–68. [DOI] [PubMed] [Google Scholar]
- 20. Kallio MA, Tuimala JT, Hupponen T, et al. Chipster: user‐friendly analysis software for microarray and other high‐throughput data. BMC Genomics 2011;12:507. [DOI] [PMC free article] [PubMed] [Google Scholar]
- 21. Cibulskis K, Lawrence MS, Carter SL, et al. Sensitive detection of somatic point mutations in impure and heterogeneous cancer samples. Nat Biotechnol 2013;31:213–9. [DOI] [PMC free article] [PubMed] [Google Scholar]
- 22. Wong SQ, Li J, Tan AY, et al. Sequence artefacts in a prospective series of formalin‐fixed tumours tested for mutations in hotspot regions by massively parallel sequencing. BMC Med Genomics 2014;7:23. [DOI] [PMC free article] [PubMed] [Google Scholar]
- 23. Rosenthal R, McGranahan N, Herrero J, et al. DeconstructSigs: delineating mutational processes in single tumors distinguishes DNA repair deficiencies and patterns of carcinoma evolution. Genome Biol 2016;17:31. [DOI] [PMC free article] [PubMed] [Google Scholar]
- 24. Nik‐Zainal S, Davies H, Staaf J, et al. Landscape of somatic mutations in 560 breast cancer whole‐genome sequences. Nature 2016;534:47–54. [DOI] [PMC free article] [PubMed] [Google Scholar]
- 25. Ichtchenko K, Hata Y, Nguyen T, et al. Neuroligin 1: a splice site‐specific ligand for beta‐neurexins. Cell 1995;81:435–43. [DOI] [PubMed] [Google Scholar]
- 26. Henderson HJ, Karanam B, Samant R, et al. Neuroligin 4X overexpression in human breast cancer is associated with poor relapse‐free survival. PLoS One 2017;12:e0189662. [DOI] [PMC free article] [PubMed] [Google Scholar]
- 27. Dafinger C, Liebau MC, Elsayed SM, et al. Mutations in KIF7 link Joubert syndrome with sonic hedgehog signaling and microtubule dynamics. J Clin Invest 2011;121:2662–7. [DOI] [PMC free article] [PubMed] [Google Scholar]
- 28. Takano K, Liu D, Tarpey P, et al. An X‐linked channelopathy with cardiomegaly due to a CLIC2 mutation enhancing ryanodine receptor channel activity. Hum Mol Genet 2012;21:4497–507. [DOI] [PMC free article] [PubMed] [Google Scholar]
- 29. Zhang WC, Shyh‐Chang N, Yang H, et al. Glycine decarboxylase activity drives non‐small cell lung cancer tumor‐initiating cells and tumorigenesis. Cell 2012;148:259–72. [DOI] [PubMed] [Google Scholar]
- 30. Chang K, Pastan I. Molecular cloning of mesothelin, a differentiation antigen present on mesothelium, mesotheliomas, and ovarian cancers. Proc Natl Acad Sci USA 1996;93:136–40. [DOI] [PMC free article] [PubMed] [Google Scholar]
- 31. Haase D, Meister M, Muley T, et al. FRMD3, a novel putative tumour suppressor in NSCLC. Oncogene 2007;26:4464–8. [DOI] [PubMed] [Google Scholar]
- 32. Lehmann JM, Riethmuller G, Johnson JP. MUC18, a marker of tumor progression in human melanoma, shows sequence similarity to the neural cell adhesion molecules of the immunoglobulin superfamily. Proc Natl Acad Sci USA 1989;86:9891–5. [DOI] [PMC free article] [PubMed] [Google Scholar]
- 33. Wang J, Du Q, Li C. Bioinformatics analysis of gene expression profiles to identify causal genes in luminal B2 breast cancer. Oncol Lett 2017;14:7880–8. [DOI] [PMC free article] [PubMed] [Google Scholar]
- 34. Yang X, Hu Q, Hu LX, et al. miR‐200b regulates epithelial‐mesenchymal transition of chemo‐resistant breast cancer cells by targeting FN1. Discov Med 2017;24:75–85. [PubMed] [Google Scholar]
- 35. Banerji S, Cibulskis K, Rangel‐Escareno C, et al. Sequence analysis of mutations and translocations across breast cancer subtypes. Nature 2012;486:405–9. [DOI] [PMC free article] [PubMed] [Google Scholar]
- 36. Ramakrishnan V. Histone structure and the organization of the nucleosome. Annu Rev Biophys Biomol Struct 1997;26:83–112. [DOI] [PubMed] [Google Scholar]
- 37. Mello JA, Sillje HH, Roche DM, et al. Human Asf1 and CAF‐1 interact and synergize in a repair‐coupled nucleosome assembly pathway. EMBO Rep 2002;3:329–34. [DOI] [PMC free article] [PubMed] [Google Scholar]
- 38. Marheineke K, Krude T. Nucleosome assembly activity and intracellular localization of human CAF‐1 changes during the cell division cycle. J Biol Chem 1998;273:15279–86. [DOI] [PubMed] [Google Scholar]
- 39. Sancho M, Diani E, Beato M, et al. Depletion of human histone H1 variants uncovers specific roles in gene expression and cell growth. PLoS Genet 2008;4:e1000227. [DOI] [PMC free article] [PubMed] [Google Scholar]
- 40. Tessadori F, Giltay JC, Hurst JA, et al. Germline mutations affecting the histone H4 core cause a developmental syndrome by altering DNA damage response and cell cycle control. Nat Genet 2017;49:1642–6. [DOI] [PubMed] [Google Scholar]
- 41. Arroyo M, Kuriyama R, Trimborn M, et al. MCPH1, mutated in primary microcephaly, is required for efficient chromosome alignment during mitosis. Sci Rep 2017;7:13019. [DOI] [PMC free article] [PubMed] [Google Scholar]
- 42. Stevenson RP, Veltman D, Machesky LM. Actin‐bundling proteins in cancer progression at a glance. J Cell Sci 2012;125:1073–9. [DOI] [PubMed] [Google Scholar]
- 43. Zabouo G, Imbert AM, Jacquemier J, et al. CD146 expression is associated with a poor prognosis in human breast tumors and with enhanced motility in breast cancer cell lines. Breast Cancer Res 2009;11:R1. [DOI] [PMC free article] [PubMed] [Google Scholar]
- 44. Wang K, Wu F, Seo BR, et al. Breast cancer cells alter the dynamics of stromal fibronectin‐collagen interactions. Matrix Biol 2017;60‐61:86–95. [DOI] [PMC free article] [PubMed] [Google Scholar]
- 45. Xiang B, Liu K, Yu M, et al. Systematic genetic analyses of genome‐wide association study data reveal an association between the key nucleosome remodeling and deacetylase complex and bipolar disorder development. Bipolar Disord 2018;20:370–380. [DOI] [PubMed] [Google Scholar]
- 46. Hertel N, Redies C. Absence of layer‐specific cadherin expression profiles in the neocortex of the reeler mutant mouse. Cereb Cortex 2011;21:1105–17. [DOI] [PubMed] [Google Scholar]
- 47. Liang Y, Gao H, Lin SY, et al. Mcph1/Brit1 deficiency promotes genomic instability and tumor formation in a mouse model. Oncogene 2015;34:4368–78. [DOI] [PMC free article] [PubMed] [Google Scholar]
Associated Data
This section collects any data citations, data availability statements, or supplementary materials included in this article.
Supplementary Materials
Fig. S1 Immunoblot of CRISPR/Cas9‐edited MCPH1 mutant and control MCF10A cell lines. Mutant cell line shows absence of wild type (~110 kDa) and presence of truncated (~35 kDa) MCPH1 protein.
Figure S2. MCPH1 mutant and control cells have distinct gene expression profiles. a) Principal component analysis (PCA) shows gene expression patterns of MCPH1 mutant and control cell lines being distinct from each other, principal component 1 explaining 93% of the variation between the samples. b) Differential gene expression patterns presented as a heatmap based on DESeq2 results. Red indicates decreased gene expression and green increased expression.
Figure S3. Six of the differentially expressed genes in RNA‐Seq were analyzed with RT‐PCR. a) CLIC2 and MCAM, b) CHAF1B and c) MSLN, FN1 and SPARC. All analyzed genes showed similar differential expression in the cell lines with both methods. Results are mean (±SE) expression of 3 replicates.
Figure S4. Representative images of mitotic phases of MCPH1 mutated and control MCF10 cells. Mutant cells show PCC phenotype and prolonged chromatin condensation during telophase and cytokinesis. Fixed cells were stained with DAPI (blue) and anti‐tubulin (red). Scale bar 25 μm.
Figure S5. MCPH1 mutant cells have larger proportion of G1 phase cells. Cell cycle distribution analysis by flow cytometry shows MCPH1 mutant cell line having more cells in G1 phase (43.7%) than controls (33.4%), p = 0.036. Means of three independent experiments (±SD), Student's t‐test.
Table S1 RT‐PCR primers used for confirming differentially expressed genes in RNA‐Seq
Table S2. Differentially expressed genes (log2 fold change >0.5 or <−0.5) between the MCPH1 mutant and control cell lines in the RNA‐Seq, analyzed with DESeq2
Table S3. The expanded list of molecules enriched in cancer and invasion‐related pathways in IPA
Table S4. TP53 mutation frequency in MCPH1altered and non‐altered breast tumors
Online video 1. MCPH1 mutant MCF10A cells show prolonged chromosome condensation. Live‐cell imaging of Hoechst 33342‐stained cells shows significantly prolonged chromosome condensation in MCPH1 mutant cells both before and after mitosis when compared to controls. Time hh:mm.
Data Availability Statement
The data that support the findings of this study are openly available in ftp://ftp‐trace.ncbi.nlm.nih.gov/sra/review/SRP168203_20181113_100053_2726e05d1c01c63b0742fdbb3d89c0bc.