

Abstract
Minimization of metabolic energy is considered a fundamental principle of human locomotion, as demonstrated by an alignment between the preferred walking speed (PWS) and the speed incurring the lowest metabolic cost of transport. We aimed to (i) simultaneously disrupt metabolic cost and an alternate acute task requirement, namely speed error regulation, and (ii) assess whether the PWS could be explained on the basis of either optimality criterion in this new performance and energetic landscape. Healthy adults (N = 21) walked on an instrumented treadmill under normal conditions and, while negotiating a continuous gait perturbation, imposed leg-length asymmetry. Oxygen consumption, motion capture data and ground reaction forces were continuously recorded for each condition at speeds ranging from 0.6 to 1.8 m s−1, including the PWS. Both metabolic and speed regulation measures were disrupted by the perturbation (p < 0.05). Perturbed PWS selection did not exhibit energetic prioritization (although we find some indication of energy minimization after motor adaptation). Similarly, PWS selection did not support prioritization of speed error regulation, which was found to be independent of speed in both conditions. It appears that, during acute exposure to a mechanical gait perturbation of imposed leg-length asymmetry, humans minimize neither energetic cost nor speed regulation errors. Despite the abundance of evidence pointing to energy minimization during normal, steady-state gait, this may not extend acutely to perturbed gait. Understanding how the nervous system acutely controls gait perturbations requires further research that embraces multi-objective control paradigms.
Keywords: energetics, locomotion, multi-objective control, prioritization, motor regulation
1. Introduction
Energy minimization is regarded by many to be a determining principle of human gait. Classic locomotion experiments have shown that humans select a preferred walking speed (PWS) and stride frequency that minimize the energetic cost of transport (COT; energy expenditure per unit distance travelled; [1–8]). Moreover, it has been shown that, if provided with the opportunity for motor learning, humans often discover ways to improve gait energetics even after disrupting their normal gait patterns ([9–11]; although see [12]).
It is unlikely, however, that the control objectives of locomotion are limited to only minimizing metabolic demands. Locomotor behaviour must be regulated to meet multiple simultaneous (and possibly competing) objectives [13]. For example, treadmill walking provides a model with a clearly defined task objective: regulate stride-to-stride speed variability (via stride lengths and times) to match the belt speed. This motor regulation is essential because, if left uncorrected, stride-to-stride speed errors will result in the subject falling off the front or back end of the treadmill.
In non-perturbed environments, it has been shown that younger and older adults regulate speed errors well [14–16], and their ability to do this is not influenced by treadmill speed [14,17]. However, the resilience of this relationship to gait perturbations that impede gait mechanics and energetics has not yet been assessed. Furthermore, the relationship between energy minimization and speed error minimization remains poorly understood. Confounding such studies is the different character of the control objectives; one being based on the minimization of a fundamental physiological quantity (energy), while the other is based on neuromechanics at the level of task performance (speed error minimization). We might, therefore, expect the time scales over which these two costs are minimized to be different, since they are likely to be governed by distinct (separate) adaptation processes.
In this paper, we take a first look at how both energy minimization and speed error regulation together are affected in normal and perturbed treadmill walking. Specifically, we aimed to determine how a continuous mechanical gait perturbation, imposed through asymmetrical leg lengths, acutely impacts gait energetics and speed error regulatory performance. This perturbation was chosen as it had the potential to disrupt both energetics and speed error regulation [18], and, as such, observed behaviours could provide insight into acute multi-factor control strategies. Given that matching the treadmill's speed is a critical requirement to mitigate an immediate task-level failure, we hypothesized that the PWS in the disrupted condition would be the speed at which stride-to-stride speed errors would be most successfully regulated; therefore, speed error would be minimized by acute PWS selection in the perturbed condition as opposed to COT.
2. Methods
2.1. Participants
Healthy young adults (N = 21, 11 F, 10 M; age 27.4 ± 5.7 years; mass 71.6 ± 10.0 kg; height 1.75 ± 0.06 m; mean ± s.d. (convention continued throughout)) provided their informed consent before participating in this study, which was approved by the University of Western Australia's Human Research Ethics Committee (RA/4/1/7336). They were required to have suffered no serious lower limb injuries in the previous year, and to be free of medically diagnosed conditions that may impair their coordination or walking stability. They were also required to be within the shoe size range of US 7–11 (8.6 ± 1.2) to accommodate the custom-made platform footwear (described below).
2.2. Experimental protocol
Participants completed six walking trials, each of 5 min duration, wearing normal footwear (the ‘normal’ condition; Volley, Brand Collective, Australia). They also completed a further six trials, also of 5 min duration, wearing one normal shoe and one custom-made platform-shoe with an additional foam sole attachment equal to 10.5 ± 0.5% of the participant's lower limb length (the ‘perturbed’ condition; modified Volley, Brand Collective, Australia; figure 1). This perturbation has previously been shown to disrupt lower limb kinematics and kinetics [18]. The total mass of the normal footwear was standardized to the platform shoe using packages of small lead weights secured to the shoe's canvas upper. The platform shoe was randomly assigned to the left or right lower limb of participants.
Figure 1.
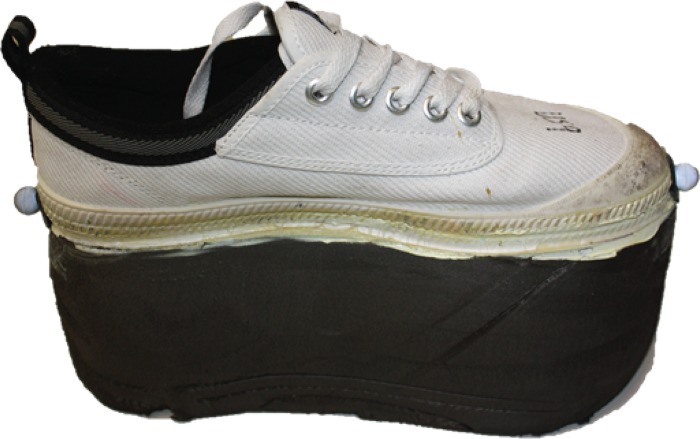
Custom-made platform shoe with an approximately 100 mm additional foam sole. The width of the base was reinforced for safety, providing an additional 20 mm around the middle third of the shoe, with a natural gradient progressing to the most anterior and posterior aspects in a manner such that no additional length was added. (Online version in colour.)
For the treadmill trials, speeds were set to 0.6, 0.9, 1.2, 1.5 and 1.8 m s−1, with an additional trial collected at the participant's self-selected PWS (footwear specific). Prior to commencing each condition, this PWS value was determined using the method outlined by Dingwell & Marin [16]. At the conclusion of the perturbed condition (after approx. 30 min), the perturbed PWS was retested in a subset of participants (N = 14) in order to assess the effect of familiarization, although adaptation effects were not a primary focus of this study.
The order of conditions (i.e. normal and perturbed) was alternated for each consecutive participant, and trials within each condition (i.e. at the PWS and five additional speeds) were performed in a randomized order. All trials took place on a split-belt force plate instrumented treadmill (2000 Hz; Bertec Corp., Columbus, OH, USA). Preceding data collection, a retro-reflective marker was placed centrally on the lower heel counter of the normal shoe that would remain consistent between conditions. The marker trajectory, captured by a 10-camera Vicon MX system (250 Hz; Oxford Metrics, Oxford, UK), was used in conjunction with ground reaction force (GRF) data to determine stride lengths and times (approx. 150–200 strides were collected per trial). Measures of oxygen consumption were also collected simultaneously via a portable Cosmed K5 device (Cosmed, Rome, Italy), which was calibrated prior to each use in accordance with the manufacturer's specifications.
2.3. Data processing
Steady-state oxygen consumption values were extracted from the final minute of recorded data. Gross metabolic COT for each trial was then quantified by considering the volume of oxygen consumed, per kilogram of body mass, per metre travelled. Second-order polynomials were fitted to each participant's COT data (normal and perturbed), from which a minimum COT was extracted. These values were then compared with the COT measured at the PWS for each condition. The 95% confidence interval bands for the group minimum COT values were determined.
Linear interpolation was applied to the marker trajectory and GRF data (two frames surrounding heel strike). This method was used to increase the fidelity of stride length and corresponding time values [14]. Of the 252 potential trials, 19 were eliminated from speed error analyses because of a hardware malfunction that resulted in incomplete data collection. Final stride lengths and times were input to a custom Matlab function to compute fluctuation dynamics (MathWorks, Inc., Natick, MA, USA).
We assessed the inter-stride speed error regulation using a previously developed method based on the analysis of fluctuations in motor performance. During motorized treadmill walking, foot placements result in a series of stride lengths and times, and one can quantify the regulation of walking speed by studying the temporal variation in these quantities [14]. Specifically, to maintain a given stride speed (v) (the ratio of stride length (L) and stride time (T)), the stride lengths and times must lie on a straight line in the (T, L) plane, L = vT (figure 2). This constant-speed line is the goal-equivalent manifold (GEM) for the walking task [14,15,17,19,20]. Fluctuations in stride length and time away from this line (that is, perpendicular to the GEM) are goal relevant, in that they change the stride speed, whereas fluctuations along the line are goal equivalent, in that they do not change the stride speed. Thus, for speed regulation during treadmill walking, one expects that goal-relevant speed errors (normal to the GEM) will be strongly corrected from one stride to the next, because they directly impact the speed-maintenance goal. By contrast, we expect goal-equivalent speed errors (along the GEM) to be only weakly corrected. These expectations have been confirmed in prior studies [14,15,17].
Figure 2.
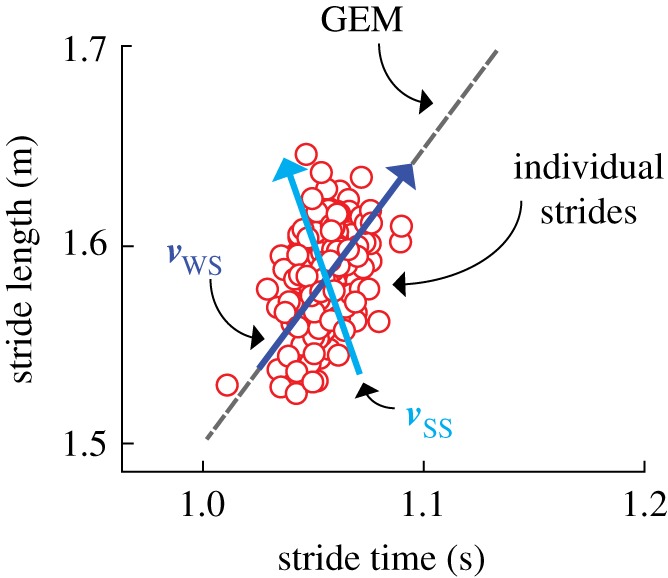
Components of a GEM analysis. Combinations of stride lengths (L) and times (T) that achieve the desired speed fall directly on the GEM (grey dashed line; L = vT, where v is the treadmill speed). Values fluctuating tangential to the GEM are considered to be deviating in the goal-equivalent direction and do not affect the task goal (i.e. maintaining constant speed). Values fluctuating perpendicular to the GEM are considered to be deviating in the goal-relevant direction and are responsible for poorer performance in relation to the speed-maintenance goal. The eigenvectors of a linear map fitted to the sequence of stride lengths and stride times give the direction of strong stability (light (blue) arrow; ) and weak stability (dark (blue) arrow; ). Whereas the weakly stable direction is expected to be nearly tangent to the GEM, and hence is not important to speed regulation, the strongly stable direction can drive fluctuations onto the GEM, and hence is an indication of the strength of motor regulation during walking. (Online version in colour.)
The data from each trial, consisting of a series of points (T, L), were plotted. The mean value of (T, L), i.e. the ‘operating point’, was determined and deviations (δT, δL) from this mean were computed. Regression analysis was used to create a discrete linear map acting on deviations between consecutive strides, providing a simple model of how fluctuations about the mean were regulated from one stride to the next. The eigenvalues and eigenvectors for the map were determined in each case.
The magnitudes of the eigenvalues indicate the strength of regulation, that is, how strongly deviations from the mean were corrected at the next stride: magnitudes close to zero indicate strong regulation, while values with magnitudes approaching 1 (from below) represent weak regulation. Eigenvalue magnitudes greater than 1 indicate instability, and thus are not observed experimentally. We therefore ordered the two eigenvalues according to |λSS| < |λWS|, where the subscript SS indicates strongly stable and the subscript WS indicates weakly stable (figure 2).
The directionality of the eigenvectors was specified by the smallest angle between each eigenvector and a unit vector tangential to the GEM (figure 2). Following the assumption of speed error regulation organized around the GEM, the weakly stable eigendirection [20] was expected to produce an angle in close proximity to zero (that is, to be nearly tangent to the GEM), while the strongly stable direction was expected to produce a significantly non-zero value [20]. Note, however, that these orientations, while predicted under the hypothesis of ‘GEM aware’ speed regulation, are not in any way predetermined by the eigenanalysis itself.
The significance of these directions in terms of speed regulation is as follows: given that one expects the weakly stable direction to be aligned with the GEM, only fluctuations in the strongly stable direction will affect stride speed, and hence task performance. In this context, we can interpret the magnitude of λSS as representing the proportion of speed error that would remain from one stride to the next were the next stride to be free from physiological noise. Thus, λSS is a measure of the strength of speed error regulation, with values closer to zero indicating stronger regulation. By contrast, because they do not impact the stride speed, we expect fluctuations along the GEM to be weakly controlled, so that λWS ≈ 1 [14,17].
Positive eigenvalues indicate that a fluctuation on one side of the mean, along a given eigendirection, is followed by a smaller fluctuation on the same side. By contrast, negative eigenvalues indicate ‘over-correction’, that is, fluctuations along an eigendirection change their sign at the next step. Thus, in particular, more negative values of λSS indicate a greater degree of speed error over-correction as the motor system attempts to regulate stride speed. Optimum speed regulation would, on average, completely eliminate errors, corresponding to λSS = 0. Thus, values of λSS away from zero, whether positive or negative, indicate less optimal speed regulation. We confirmed the strongly and weakly stable eigenvalue categorization by assessing the angle of both eigenvectors with respect to the GEM (electronic supplementary material, table S1).
2.4. Statistical analyses
Two-way repeated-measures analysis of variance (ANOVA) with post hoc tests (Bonferroni correction) were conducted to assess the effect of condition and speed. Repeated measures t-tests and one-way ANOVAs were conducted to follow up an interaction effect. A further series of repeated-measures statistics were employed to detect differences in PWSs and their associated COT values. All analyses were performed on the complete sample (N = 21), with the exception of the following tests, for which only subsample (described above (N = 14)) data were used: (i) t-test comparing the original perturbed PWS with the retested perturbed PWS and (ii) t-test comparing perturbed COT values obtained from the original PWS (empirical) with perturbed COT values obtained from the retested PWS (values extracted from subject-specific curves fitted to the perturbed COT data). The p-value for statistical analyses was set at p < 0.05. The statistics software package SPSS v. 21.0 (Chicago, IL, USA) was used to perform all statistical analyses.
3. Results
3.1. Preferred walking speed
The normal PWS of participants was 1.30 ± 0.15 m s−1. When walking in the perturbed condition, this value decreased significantly to 1.04 ± 0.12 m s−1 (p < 0.001). The retested perturbed PWS was found to have increased significantly by the end of the data collection period (‘retest’; 1.21 ± 0.19 m s−1; p = 0.003).
3.2. Metabolic cost
When all experimental speeds were compared, the perturbed condition resulted in significantly higher gross COT values than normal walking (p < 0.001 main effect collapsed across all comparisons; figure 3). An interaction effect was detected between condition and speed for metabolic COT (p = 0.001). Intra-condition analyses found mirroring trends for both the normal and perturbed conditions at the two slowest speeds: 0.6 m s−1 significantly increased metabolic demands relative to all faster speeds (p < 0.001), while 0.9 m s−1 significantly increased metabolic demands above all faster speeds (p < 0.001) except 1.8 m s−1 (p > 0.999), for both normal and perturbed walking.
Figure 3.
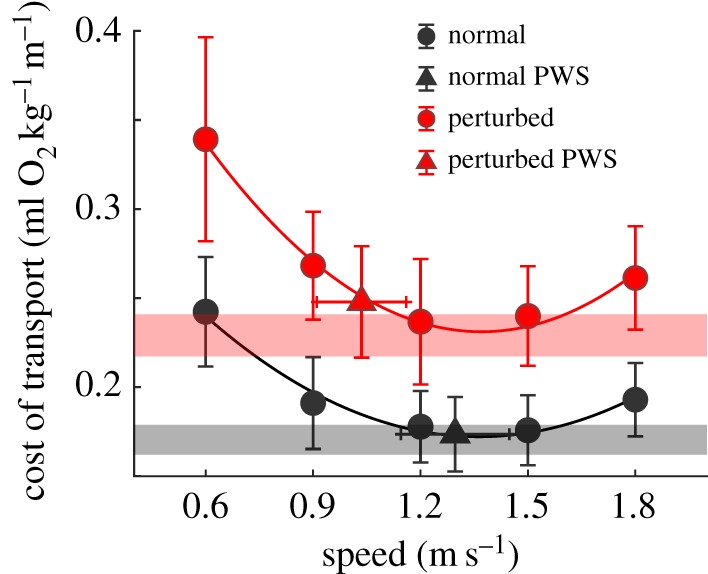
Group (mean; N = 21) speed versus COT during normal (dark/black), and perturbed walking (leg-length asymmetry; light/red). The PWS from each condition is denoted by a triangle. Error bars represent speed (horizontal) and COT (vertical) standard deviations. 95% confidence intervals for the quadratic curve minimums are displayed (transparent red and black bars). (Online version in colour.)
For normal and perturbed walking, COT at 1.2 m s−1 was not significantly different from that at 1.5 m s−1 (p > 0.999). However, the COT in normal and perturbed walking at 1.2 m s−1 (p = 0.004 and p = 0.014, respectively) and 1.5 m s−1 (p ≤ 0.001 and p = 0.002, respectively) was significantly lower than that at 1.8 m s−1. Normal COT at the PWS was also significantly lower than at 1.8 m s−1 (p = 0.002); however, it was statistically equivalent to values observed at 1.2 and 1.5 m s−1 (p > 0.999). PWS COT in the perturbed condition was significantly higher than that at 1.2 m s−1 (p = 0.026) and not significantly different from the COT at both 1.5 and 1.8 m s−1 (p = 0.735 and p = 0.364, respectively).
Through residual analyses, it was determined that second-order polynomials provided an appropriate fit for each participant's normal and perturbed COT data (group data illustrated in figure 3). Minimum COT values extracted from the normal condition curve (0.170 ± 0.02 ml O2 kg−1 m−1) were not different from the PWS COT (0.174 ± 0.02 ml O2 kg−1 m−1; p = 0.153). However, the perturbed curve minimum (0.229 ± 0.03 ml O2 kg−1 m−1) was significantly lower than the PWS COT (0.248 ± 0.03 ml O2 kg−1 m−1; p < 0.001). Furthermore, while the mean PWS COT of the normal condition was found to fall within the 95% confidence interval bands of the minimum (0.162–0.179 ml O2 kg−1 m−1), this was not the case for the perturbed condition (0.217–0.241 ml O2 kg−1 m−1; figure 3).
The initial COT obtained at the perturbed PWS and the predicted COT from the retest perturbed PWS (0.246 ± 0.02 ml O2 kg−1 m−1) were not significantly different from one another (p = 0.211). However, when the 95% confidence interval bands were adjusted for the subsampled retest population (N = 14), the mean retest COT value did fall within the upper 95% confidence band (0.216–0.250 ml O2 kg−1 m−1).
3.3. Speed error regulation
In the strongly stable direction, there was a main effect of condition only, with the perturbation producing greater speed error over-correction (values of λSS were more negative) and weaker (and therefore less optimal) speed regulation (the magnitudes of λSS were further from 0 and closer to 1) than normal walking at all speeds less than 1.8 m s−1 (for which p = 0.240). Perturbed values were, however, similar across all speeds (figure 4; electronic supplementary material, table S2). While an interaction effect was determined in the weakly stable direction, further analysis was not pursued because of the weak regulation indicated by values close to 1 (group mean across both conditions and six speeds: 0.9995 ± 0.001).
Figure 4.

Group (mean; N = 21) speed versus strength of speed error correction, as quantified by the strongly stable eigenvalue (λSS) of inter-stride fluctuations for normal walking (dark/black), and perturbed walking (leg-length asymmetry; light/red). The PWS from each condition is denoted by a triangle. Error bars represent speed (horizontal) and COT (vertical) standard deviations. Values closer to zero represent stronger regulation, while increasingly negative values indicate greater over-correction. For comparison, optimal regulation corresponds to values that are exactly zero. (Online version in colour.)
The geometry of speed error regulation was found to be as predicted by the general theory of fluctuation dynamics near a GEM [20,21]. In particular, across all subjects and conditions, the weakly stable eigenvector was directionally very close to the GEM (less than 0.05°; electronic supplementary material, table S1). This is consistent with speed error regulation: relatively little effort is exerted to correct fluctuations in stride length and time that have no effect on stride speed. At the same time, the strongly stable eigenvector directions were found to be between 46° and 95° of the GEM (group averages), indicating the regulation of goal-relevant speed errors that actually change the walking speed. The results of this fluctuation analysis for a typical subject, along with the corresponding GEMs for both the normal and perturbed conditions, are displayed in figure 5.
Figure 5.
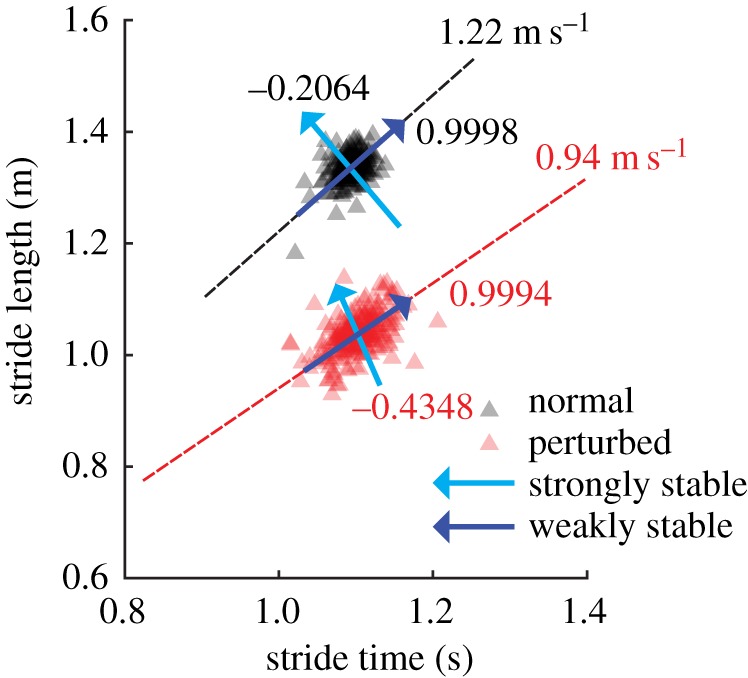
A typical illustration of the GEM and fluctuation eigenstructure produced for a single subject (N = 1) walking at their preferred walking speed during both normal (dark/black; 1.22 m s−1) and perturbed walking (one flat, one platform shoe; light/red; 0.94 m s−1). The direction of strongly stable eigenvectors is indicated by a light (blue) arrow, while the direction of weakly stable eigenvectors is indicated by a dark (blue) arrow. Eigenvalues (λSS, λWS) are presented near their associated eigenvector. (Online version in colour.)
4. Discussion
4.1. Neither cost of transport nor speed error regulation explain adjustments in acute preferred walking speed during leg-length asymmetry walking
Our results confirm that mechanical gait perturbation in the form of asymmetrical leg lengths substantially degrades both energetics and the regulation of inter-stride speed errors (figures 3 and 4). The acute PWS in the perturbed condition could not, however, be explained on the basis of energy or speed error minimization. The acute PWS was significantly slower than the energetic-minimum speed (which remained unchanged from normal walking) and it did not confer any advantage in the regulation of speed. In short, our participants' initial response to a perturbation that simultaneously degraded energetics and speed regulation did not indicate either metabolic or speed error prioritization.
Despite COT being consistently regarded as a key criterion dictating locomotor behaviour, it can be interpreted to be deprioritized (as evidenced by PWS selection) when an acute perturbation was applied during walking. Our data, together with those of other studies, indicate that acute PWS is not simply governed by COT in novel or perturbed gait conditions. In particular, a growing body of work details suboptimal energetic responses to various locomotor tasks over short time scales [9,11]. A handful of studies have also observed a lack of longer term energetic prioritization [12,22–25].
Contrary to our hypothesis, a marked deterioration in speed error regulation was also observed at all testing speeds less than 1.8 m s−1, including the PWS, and, therefore, speed regulation accuracy also did not explain acute PWS selection. It is worth pointing out that the observed level of speed error over-corrections in the goal-relevant direction is the highest reported for walking to date, and is considerably poorer than those of unperturbed walking in both young and older adults [17].
One interpretation of the observed results is that the degradation in stride-to-stride speed error regulation does not impair walking to an extent that affects its overall control scheme. That is to say, even a twofold increase in stride-to-stride speed error over-correction does not present a substantial cost (e.g. risk of drifting off the treadmill). Alternatively, because the degradation in speed regulation is uniform across target walking speeds (electronic supplementary material, table S2), it is possible that the PWS is not influenced by errors in speed regulation because they impair gait similarly across each speed. Therefore, there is no speed that provides an advantage (or disadvantage) to one's ability to correct speed errors.
Previous studies on unperturbed gait [14,17] similarly found the strength of speed error regulation to be minimally affected across target treadmill speeds, raising the prospect that speed regulation is itself independent of the target speed. This is a trait not shared with metabolic cost, which is heavily influenced by speed [1,2,4,26], step frequency [6–8] and step width [27]. Attaining optimal values of any walking parameter over a very narrow portion of its operational range is exceptionally limiting within real-world scenarios. From this perspective, the robust speed independence of stride-to-stride motor regulation might reflect a high-order control priority. Notwithstanding, it is clear that further investigation is required to probe the limits of speed error regulation.
4.2. Cost of transport is not an acute priority but a longer term objective
This study was not specifically designed to examine motor adaptation over longer time periods. Prior work has demonstrated that, if provided time to acclimatize to certain perturbations (including walking with asymmetrical treadmill split-belt speeds and imposed shifts in optimal stride frequency), humans can attain COT values approaching pre-perturbation levels [9,11]. The return to energetically preferred states has been found to occur via adjustments in a limited number of key gait parameters (e.g. speed, step frequency), both at a gross level over shorter time scales (fast processes) and through finer adjustments over larger time scales (slow processes; [28,29]). Together, these processes typically combine to recover walking speed and/or step frequency after imposed disruption to preferred values in under 90 s [28,29]. More challenging gait perturbations have, on the other hand, been shown to require longer adaptive time frames as well as guided assistance in exploring the energy landscape [11]. We suspect the unfamiliarity of asymmetric leg-length gait (i.e. lack of prior exposure to all possible gait solutions) similarly challenged the time frame for energetic adaptation. Although we cannot be certain of the temporal stage of energetic adaptation, it was evident from the subset of participants (N = 14) retested at the conclusion of the perturbed condition (approx. 30 min later; PWS ‘retest’) that PWS increased to a more energetically favourable state (COT value extracted from the fitted curve fell within the 95% confidence interval bands for the subsampled population COT minimum). Here, it appears the slow processes acted over a longer time scale than observed in prior literature [28,29] to optimize metabolic values. We also conclude that the drift to faster PWS is not influenced by stride-to-stride speed error regulation, because this parameter of motor regulation is independent of target speed.
5. Conclusion
We found that energetics and speed error regulation are simultaneously disrupted in the acute response to leg-length asymmetry gait, and that PWS is initially reduced to a non-energetically optimal speed. Our findings contribute to the view that energy minimization is limited to normal unperturbed gait, or requires considerable time (at least in the range of minutes) to allow motor/sensory adaptation to a continuous perturbation. These are important considerations because habitual gait is often characterized as non-steady state and often involves perturbations. Thus, while COT undoubtedly influences steady-state gait behaviour, it is unclear whether it is also the dominant optimality criterion controlled for in many ‘real-world’ gait scenarios. We also demonstrate that the acute reduction in PWS observed during perturbed walking is not necessarily dictated by minimizing speed errors. This is true even when the regulation accuracy, in this case stride-to-stride speed regulation, is markedly impaired. Because many falls and injuries occur under novel, perturbed gait conditions, understanding how the nervous system acutely controls gait adjustments under these conditions is an important area requiring further attention.
A systematic examination of energetic and error regulation over longer time periods is a logical next step in elucidating the links between gait behaviour and longer term prioritization goals. Such work should consider the temporal nature of (i) adaptation, i.e. the order in which criteria are addressed by the central nervous system during the learning phase of a novel gait task, and (ii) optimization, i.e. the order in which criteria achieve their predicted optimum values. While speed regulation must adapt almost instantaneously (to avoid falling off the treadmill), it may optimize slowly, quickly or not at all.
Supplementary Material
Supplementary Material
Acknowledgements
The authors would like to thank two anonymous reviewers for their thoughtful feedback.
Data accessibility
Data are available at https://doi.org/10.5281/zenodo.2612647.
Competing interests
We declare we have no competing interests.
Funding
We received no funding for this study.
References
- 1.Abe D, Fukuoka Y, Horiuchi M. 2015. Economical speed and energetically optimal transition speed evaluated by gross and net oxygen cost of transport at different gradients. PLoS ONE 10, e0138154 ( 10.1371/journal.pone.0138154) [DOI] [PMC free article] [PubMed] [Google Scholar]
- 2.Browning RC, Baker EA, Herron JA, Kram R, Browning R. 2006. Effects of obesity and sex on the energetic cost and preferred speed of walking. J. Appl. Physiol. 100, 390–398. ( 10.1152/japplphysiol.00767.2005) [DOI] [PubMed] [Google Scholar]
- 3.Raffalt PC, Guul MK, Nielsen AN, Puthusserypady S, Alkjaer T. 2017. Economy, movement dynamics, and muscle activity of human walking at different speeds. Sci. Rep. 7, 43986 ( 10.1038/srep43986) [DOI] [PMC free article] [PubMed] [Google Scholar]
- 4.Ralston HJ. 1958. Energy-speed relation and optimal speed during level walking. Eur. J. Appl. Physiol. Occup. Physiol. 17, 277–283. ( 10.1007/BF00698754) [DOI] [PubMed] [Google Scholar]
- 5.Willis WT, Ganley KJ, Herman RM. 2005. Fuel oxidation during human walking. Metabolism 54, 793–799. ( 10.1016/j.metabol.2005.01.024) [DOI] [PubMed] [Google Scholar]
- 6.Cavagna GA, Franzetti P. 1986. The determinants of the step frequency in walking humans. J. Physiol. 373, 235–242. ( 10.1113/jphysiol.1986.sp016044) [DOI] [PMC free article] [PubMed] [Google Scholar]
- 7.Minetti AE, Capelli C, Zamparo P, Di Prampero PE, Saibene F. 1995. Effects of stride frequency on mechanical power and energy expenditure of walking. Med. Sci. Sport Exerc. 27, 1194–1202. ( 10.1249/00005768-199508000-00014) [DOI] [PubMed] [Google Scholar]
- 8.Zarrugh MY, Radcliffe CW. 1978. Predicting metabolic cost of level walking. Eur. J. Appl. Physiol. Occup. Physiol. 38, 215–223. ( 10.1007/BF00430080) [DOI] [PubMed] [Google Scholar]
- 9.Finley JM, Bastian AJ, Gottschall JS. 2013. Learning to be economical: the energy cost of walking tracks motor adaptation. J. Physiol. 591, 1081–1095. ( 10.1113/jphysiol.2012.245506) [DOI] [PMC free article] [PubMed] [Google Scholar]
- 10.Sánchez N, Park S, Finley JM. 2017. Evidence of energetic optimization during adaptation differs for metabolic, mechanical, and perceptual estimates of energetic cost. Sci. Rep. 7, 7682 ( 10.1038/s41598-017-08147-y) [DOI] [PMC free article] [PubMed] [Google Scholar]
- 11.Selinger JC, O'Connor SM, Wong JD, Donelan JM. 2015. Humans can continuously optimize energetic cost during walking. Curr. Biol. 25, 2452–2456. ( 10.1016/j.cub.2015.08.016) [DOI] [PubMed] [Google Scholar]
- 12.Wong JD, Selinger JC, Donelan JM. 2019. Is natural variability in gait sufficient to initiate spontaneous energy optimization in human walking? J. Neurophysiol. 121, 1848–1855. ( 10.1152/jn.00417.2018) [DOI] [PMC free article] [PubMed] [Google Scholar]
- 13.Summerside EM, Kram R, Ahmed AA. 2018. Contributions of metabolic and temporal costs to human gait selection. J. R Soc. Interface 15, 20180197 ( 10.1098/rsif.2018.0197) [DOI] [PMC free article] [PubMed] [Google Scholar]
- 14.Dingwell JB, John JJ, Cusumano JP. 2010. Do humans optimally exploit redundancy to control step variability in walking? PLoS Comput. Biol. 6, e1000856 ( 10.1371/journal.pcbi.1000856) [DOI] [PMC free article] [PubMed] [Google Scholar]
- 15.Dingwell JB, Cusumano JP. 2015. Identifying stride-to-stride control strategies in human treadmill walking. PLoS ONE 10, e0124879 ( 10.1371/journal.pone.0124879) [DOI] [PMC free article] [PubMed] [Google Scholar]
- 16.Dingwell JB, Marin LC. 2006. Kinematic variability and local dynamic stability of upper body motions when walking at different speeds. J. Biomech. 39, 444–452. ( 10.1016/j.jbiomech.2004.12.014) [DOI] [PubMed] [Google Scholar]
- 17.Dingwell JB, Salinas MM, Cusumano JP. 2017. Increased gait variability may not imply impaired stride-to-stride control of walking in healthy older adults. Gait Posture 55, 131–137. ( 10.1016/j.gaitpost.2017.03.018) [DOI] [PMC free article] [PubMed] [Google Scholar]
- 18.McDonald KA, Devaprakash D, Rubenson J. 2019. Is conservation of center of mass mechanics a priority in human walking? Insights from leg-length asymmetry experiments. J. Exp. Biol. 222, jeb195172 ( 10.1242/jeb.195172) [DOI] [PubMed] [Google Scholar]
- 19.Cusumano JP, Cesari P. 2006. Body-goal variability mapping in an aiming task. Biol. Cybern. 94, 367–379. ( 10.1007/s00422-006-0052-1) [DOI] [PubMed] [Google Scholar]
- 20.Cusumano JP, Dingwell JB. 2013. Movement variability near goal equivalent manifolds: fluctuations, control, and model-based analysis. Hum. Mov. Sci. 32, 899–923. ( 10.1016/j.humov.2013.07.019) [DOI] [PMC free article] [PubMed] [Google Scholar]
- 21.John J, Dingwell JB, Cusumano JP. 2016. Error correction and the structure of inter-trial fluctuations in a redundant movement task. PLoS Comput. Biol. 12, e1005118 ( 10.1371/journal.pcbi.1005118) [DOI] [PMC free article] [PubMed] [Google Scholar]
- 22.Ackermann M, van den Bogert AJ. 2010. Optimality principles for model-based prediction of human gait. J. Biomech. 43, 1055–1060. ( 10.1016/j.jbiomech.2009.12.012) [DOI] [PMC free article] [PubMed] [Google Scholar]
- 23.Hunter LC, Hendrix EC, Dean JC. 2010. The cost of walking downhill: is the preferred gait energetically optimal? J. Biomech. 43, 1910–1915. ( 10.1016/j.jbiomech.2010.03.030) [DOI] [PubMed] [Google Scholar]
- 24.Miller RH, Umberger BR, Hamill J, Caldwell GE. 2012. Evaluation of the minimum energy hypothesis and other potential optimality criteria for human running. Proc. R. Soc. B 279, 1498–1505. ( 10.1098/rspb.2011.2015) [DOI] [PMC free article] [PubMed] [Google Scholar]
- 25.Morgan D, Martin P, Craib M, Caruso C, Clifton R, Hopewell R. 1994. Effect of step length optimization on the aerobic demand of running. J. Appl. Physiol. 77, 245–251. ( 10.1152/jappl.1994.77.1.245) [DOI] [PubMed] [Google Scholar]
- 26.Martin PE, Rothstein DE, Larish DD. 1992. Effects of age and physical activity status on the speed-aerobic demand relationship of walking. J. Appl. Physiol. 73, 200–206. ( 10.1152/jappl.1992.73.1.200) [DOI] [PubMed] [Google Scholar]
- 27.Donelan JM, Kram R, Kuo AD. 2001. Mechanical and metabolic determinants of the preferred step width in human walking. Proc. R. Soc. Lond. B 268, 1985–1992. ( 10.1098/rspb.2001.1761) [DOI] [PMC free article] [PubMed] [Google Scholar]
- 28.Pagliara R, Snaterse M, Donelan JM. 2014. Fast and slow processes underlie the selection of both step frequency and walking speed. J. Exp. Biol. 217, 2939–2946. ( 10.1242/jeb.105270) [DOI] [PubMed] [Google Scholar]
- 29.Snaterse M, Ton R, Kuo AD, Donelan JM. 2011. Distinct fast and slow processes contribute to the selection of preferred step frequency during human walking. J. Appl. Physiol. 110, 1682–1690. ( 10.1152/japplphysiol.00536.2010) [DOI] [PMC free article] [PubMed] [Google Scholar]
Associated Data
This section collects any data citations, data availability statements, or supplementary materials included in this article.
Supplementary Materials
Data Availability Statement
Data are available at https://doi.org/10.5281/zenodo.2612647.