

Abstract
Background
Prostate cancer (PCa) is a leading cause of cancer morbidity and mortality in men worldwide; however, PCa incidence and mortality rates vary widely across geographic regions and ethnic groups. The current study was designed to elucidate the pivotal factors involved in PCa occurrence and development.
Methods
We performed RNA sequencing on the prostate tumor and adjacent normal tissues from Chinese PCa patients. Genes identified via genome‐wide expression profile analysis were validated by quantitative reverse‐transcription polymerase chain reaction and immunohistochemistry. Hypermethylation of CpG islands was assessed by nested methylation‐specific PCR. Whole genome microarray analysis was performed using an Affymetrix GeneChip.
Results
We identified nine possible abnormally expressed genes (P < .05) and then revealed TWIST2 as having strikingly lower expression in tumors than in control tissues (P < .01). Low messenger RNA expression levels of TWIST2 were associated with hypermethylation of CpG islands in its promoter region. In accordance with these findings, PCa tumor tissues showed markedly decreased TWIST2 protein expression compared to that in both normal and prostatic intraepithelial neoplasia tissues by immunohistochemical staining. Ectopic expression of TWIST2 in LNCap cells not only inhibited cell proliferation and colony formation in vitro and tumor growth in vivo but also induced transcriptional repression of a cell proliferation‐related gene cohort, including androgen receptor signaling mediators, cyclins, homeobox genes, forkhead box genes, and SOX2.
Conclusions
Our results suggest that TWIST2 could function as a tumor suppressor involved in the pathogenesis of PCa by influencing the expression of target genes and that hypermethylation of the TWIST2 promoter in prostate tumors may be an underlying mechanism for TWIST2 transcriptional silencing.
Keywords: hypermethylation, prostate cancer, RNA sequencing, tumor suppressor, TWIST2
1. INTRODUCTION
Prostate cancer (PCa) is the most common malignancy in men and the second leading cause of cancer‐related death in Western countries.1 PCa incidence and mortality rates vary widely across geographic regions and ethnic groups. In particular, Asian populations have a substantially lower incidence of PCa than Caucasians or African‐Americans, suggesting a genetic contribution to PCa susceptibility.2, 3, 4
The genetic etiology and pathogenesis of PCa remain unclear. Advances in genomic technology over the last two decades have revealed some clues. The androgen/androgen receptor (AR) signaling pathway plays a central role in PCa development and progression, and PCa growth is usually androgen‐dependent. Changes in AR‐related genes can increase the risk of PCa.5 TMPRSS2‐ERG fusion, which rearranges two genes—the androgen‐regulated gene TMPRSS2 and the E26 transformation‐specific (ETS) transcription factor ERG—is discovered quite specific in PCa.6 PTEN loss or point mutation is frequently observed in advanced PCa. Heterozygous loss of NKX3.1 occurs in PCa and this gene functions as a tumor suppressor.7, 8 However, precise causal lesions have yet to be identified. The paucity of published data is particularly acute in China, where the aging population presents an increasingly heavy medical burden.9 We therefore designed a study of patients with PCa from China to identify characteristic molecular lesions associated with PCa pathogenesis and development that may have potential clinical application.
We conducted RNA sequencing (RNA‐seq) and analyzed genome‐wide expression data from tumor and adjacent normal tissues from Chinese PCa patients. We subsequently found that TWIST2 showed strikingly reduced expression in tumor tissues and confirmed this finding by quantitative reverse‐transcription polymerase chain reaction (RT‐qPCR) in an additional cohort of paired tumor and normal tissues. Low basal expression levels of TWIST2 were accompanied by hypermethylation of CpG islands. In accordance with these findings, immunohistochemical staining showed lower expression of the TWIST2 protein in PCa tissues than in normal and prostatic intraepithelial neoplasia (PIN) tissues.
TWIST2, a basic helix‐loop‐helix transcription factor, plays a crucial regulatory role in the progression of bone development, tumorigenesis, tumor progression, and epithelial‐mesenchymal transition (EMT). TWIST2 has a dual role in tumorigenesis. This protein is highly expressed in a variety of human tumors, playing an oncogenic role, while its expression is decreased in some tumors, indicating a tumor‐suppressive role. A high level of TWIST2 messenger RNA (mRNA) was found in melanoma, renal cancer, and esophageal squamous cell carcinoma tissues and corresponding cell lines.10 However, no expression was observed in lung cancer,10, 11 and significantly decreased expression was observed in osteosarcoma, with the expression level negatively correlated with tumorigenesis. TWIST2 is selectively silenced in chronic lymphocytic leukemia,12 and is epigenetically inactivated in acute lymphoblastic leukemia.13 There are few reports on the functions of TWIST2 in PCa.
When we overexpressed TWIST2 in LNCap cells, cell proliferation and colony formation in vitro were reduced, and tumor formation in vivo in nude mice was inhibited. We performed whole genome microarray analysis of dysregulated genes in LNCap‐TWIST2, LNCap‐vector, and LNCap cells. Some important genes involved in proliferation were regulated by TWIST2, including the androgen receptor (AR), cyclins, transcription factors, homeobox genes, forkhead box genes, SNAI2, and SOX2.
Our results suggest that the TWIST2 gene could be a key tumor suppressor involved in the pathogenesis of PCa by influencing the regulation of its downstream genes. Epigenetic modification of the TWIST2 gene in prostate tumors may be an underlying mechanism for its decreased expression.
2. MATERIALS AND METHODS
2.1. Collection and processing of tissues
This study was approved by the ethics committees at the two participating hospitals, namely, the Department of Urology, Beijing Hospital, and the Tianjin Urology Institute, Second Hospital of Tianjin Medical University. Informed consent was obtained from all study subjects.
All cases were histologically confirmed PCa. Prostate samples were obtained from patients undergoing radical prostatectomy at one of the two hospitals. After negative surgical margin was achieved, adjacent normal tissue was collected from the prostate. All tissues were snap frozen in liquid nitrogen for storage. Samples were evaluated by frozen sectioning with a fresh blade and preparation of hematoxylin‐eosin slides. A pathologist confirmed the presence or absence of tumor tissue in the slides for each sample. For tumor sections, the presentation of the overall tumor composition was also assessed, with samples exhibiting greater than 70% neoplastic cells considered optimal for subsequent RNA‐seq analysis.
Clinical data, including age at diagnosis, Gleason score, tumor stage, and serum prostate specific antigen (PSA) levels, were obtained by a review of medical records. Patients with PSA more than 20 ng/mL, Gleason score ≥8, and/or pathological stage III or higher classification were defined as having aggressive PCa.
2.2. RNA extraction
Total RNA was extracted with TRIzol (Ambion) reagent. Extracted RNA was quantified using a NanoDrop 2000 (Thermo Fisher Scientific) and 1% agarose gel electrophoresis.
2.3. RNA sequencing and data analysis
RNA‐seq libraries were constructed and sequenced on the Illumina HiSeq. 2000 sequencing platform (BGI, Shenzhen, China) as previously described by Laborde et al.6 A whole transcriptome analysis approach was applied to assess the gene expression of all known genes. Raw sequencing reads from tumor and adjacent normal tissues were aligned to the human genome reference build 38 using the Geospiza GeneSifter Analysis Edition pipeline as previously described.14 From the aligned data, expression values for annotated genes were calculated by adding the number of reads mapping to all exons and dividing that value by the total number of mapped million reads per sample (reads per kilo bases per million mapped reads, RPKM). We calculated the fold changes in the RPKM values for all genes between each tumor and its matched normal sample to select genes with expression alterations of greater than two‐fold or less than 0.5‐fold.
2.4. Quantitative reverse‐transcription polymerase chain reaction analysis
Total RNA from each sample was primed with oligo‐dT and reverse‐transcribed with complementary DNA (cDNA) synthesis kits (Promega, Madison, WI). Then, cDNA was used as the template for RT‐qPCR (SYBR Green; Takara, Dalian, China), which was performed using an iQ5 system (Bio‐Rad) according to the manufacturer's instructions. The ΔCt values were calculated using GAPDH as the internal control, and the ΔΔCt values were calculated by comparing the ΔCt in the tumors with the ΔCt in their matched normal control tissues. Primers were designed within the last exon of each gene, relatively close to the 3′ end. The PCR primer sequences used are shown in Table S1.
2.5. Nested bisulfite‐specific PCR and genomic sequencing of bisulfite‐modified DNA
Genomic DNA was purified from lysed tissues with phenol‐chloroform extraction and precipitated with isopropanol. Two micrograms of DNA was modified by sodium bisulfite and purified with an EpiTect Bisulfite kit (Qiagen, Shanghai, China). Genomic sequencing analysis of CpG islands in the genes of interest in the tumor and adjacent normal tissues was performed by nested methylation‐specific PCR. Primers were created for each gene using Meth Primer Express Software v1.0. All primer sequences are listed in Table S2. For the steps, refer to the supporting information.
2.6. Immunohistochemistry
Prostate tissues were fixed in formalin and embedded in paraffin. First, 6 × 8 tissue blocks were created, and 4‐μm thick tissue sections were then cut and placed on glass slides. After blocking, slides were incubated at 4°C in a humidified chamber overnight with a monoclonal anti‐TWIST2 antibody (cat# WHO11758M1; Sigma‐Aldrich, Shanghai, China) at a 1:500 dilution. A biotinylated secondary antibody and horseradish peroxidase‐labeled avidin were subsequently applied. The diaminobenzidine method was used for visualization. Expression levels of proteins in the PCa and adjacent normal tissue sections were scored according to the staining pattern. The intensity of staining was designated as absent (0) or present (1+, 2+, or 3+) by two independent investigators who were blinded to the tissue type. When the nucleus was also stained, 1 point was added to the score.15, 16
2.7. Cell culture and generation of cell lines
LNCap cells were cultured in Roswell Park Memorial Institute 1640 medium supplemented with 10% fetal bovine serum (FBS). Cell lines were authenticated by GTB (Genetic Testing Biotechnology Corporation, Suzhou), using short tandem repeat analysis as described in 2012 in ANSI Standard (ASN‐0002) by the ATCC Standards Development Organization. The microbiological culture method was used to detect mycoplasma contamination in cell culture.17
Human TWIST2‐FLAG cDNA was cloned into the pWPI vector containing a GFP sequence. Cell lines expressing either TWIST2‐FLAG (LNCap‐TWIST2) or empty vector (LNCap‐vector) were generated by infection. Briefly, 293T packaging cells were cotransfected with pWPI or pWPI‐TWIST2‐FLAG, as well as with pSPAX2 and pMD2.G, using VigoFect (Vigorous Biotechnology, Beijing, China). LNCap cells were infected and then selected for GFP expression via flow cytometry. Cells that constitutively expressed either FLAG‐tagged TWIST2 or empty vector were confirmed by RT‐qPCR and Western blot analysis with specific antibodies against TWIST2 and FLAG.
2.8. Western blot analysis
Western blot analysis was performed as described previously.18 Cell lysates were subjected to sodium dodecyl sulfate‐polyacrylamide gel electrophoresis and immunoblot analysis with antibodies against TWIST2, FLAG, and GAPDH (Sigma Aldrich, Shanghai, China).
2.9. Cell proliferation assay
LNCap‐TWIST2, LNCap‐vector, and LNCap cells were cultured at a density of 2000 cells per well in 96‐well plates. Cell viability was measured at 24, 48, and 72 hours with a Cell Counting Kit‐8 (CCK‐8; Applygen, Beijing, China) at 450 nm. Complete culture medium was used as the blank control. Three independent replicates were tested for each cell line.
2.10. Colony formation assay
Soft agar at a concentration of 0.5% and 0.25% was used as the base and upper layers, respectively. One thousand cells were seeded in 60‐mm dishes and maintained in complete medium for 28 days. After most of the colonies had expanded to more than 50 cells, the dishes were imaged, and the colonies were counted. At least three independent replicates were used in each assay.
2.11. Tumor growth assay
To measure tumorigenicity in vivo, an LNCap‐TWIST2 or LNCap‐vector cell suspension (1 × 10⁶ cells/75 μL) was mixed with an equal volume of Matrigel (Yeasen Biosciences, China) and subcutaneously injected (150 μL total) into 6‐ to 8‐week‐old male BALB/c nude mice. Mice were weighed twice weekly, and the volume of subcutaneous tumors was measured from the time of detection. Mice were killed 4 weeks after injection, and the weights of the subcutaneous tumors were recorded. All animals were used in accordance with institutional guidelines, and these experiments were approved by the Animal Care and Use Committee and performed in the Department of Laboratory Animal Science, Peking University Health Science Center, China.
2.12. Whole genome microarray analysis
cDNA was synthesized using an Affymetrix GeneChip® 3′IVT Express Kit (Affymetrix, Santa Clara, CA) according to the manufacturer's instructions. Further analysis was performed using Affymetrix® GeneChip® Command Console® (AGCC) software. After significance analysis of microarray was performed, genes were ranked based on their fold change differences between LNCap‐TWIST2 and LNCap‐vector, LNCap cells. Using the rank product test,19 a combined list was created with genes exhibiting a q‐value of ≤5% and a fold change of ≥2 or ≤0.5. The false discovery rate was used to correct for multiple testing.
2.13. Statistical analysis
Box plots were generated and statistical analyses were conducted using SPSS 17.0 software (SPSS, IBM). Data were compared between groups with the Wilcoxon W test. Correlation analysis of the methylation status was conducted by using Pearson correlation, and correlation analysis of The Cancer Genome Atlas (TCGA) program data was conducted by using Spearman correlation. P‐values less than .05 were considered statistically significant. The Bonferroni correction was calculated as 0.05/m (m refers to the number of individual tests).
3. RESULTS
3.1. Baseline clinical characteristics
Table S3 shows the demographic characteristics of the participants in this study. The cases used for RNA‐seq (case group 1) and for validation (case group 2) had a similar mean patient age and tumor aggressiveness. Missing data were not included when proportions were calculated.
3.2. RNA‐seq reveals that a selected group of genes is aberrantly expressed in prostate cancer samples
To gain an insight into the molecular pathogenesis of prostate cancer in the Chinese population, we assessed samples for genetic alterations using RNA‐seq in 10 prostate cancer samples and their matched, adjacent normal tissues.
Overall, we selected 21 downregulated and 21 upregulated potential candidate genes that were significantly differentially expressed and with a greater than two‐fold change within the 10 tumor and normal tissue pairs; 22 of these genes had at least one report related to PCa, but the other 20 genes were previously unreported as being related to PCa (Figure 1A and Table S4).
Figure 1.
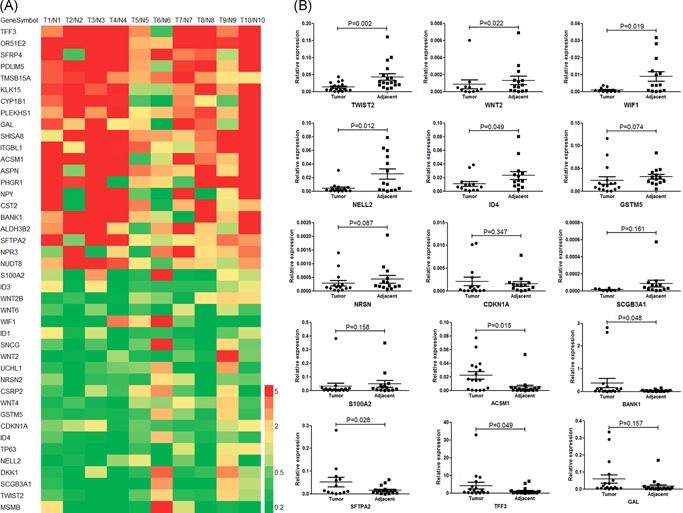
Heatmap of 42 selected genes and confirmation of selected genes by reverse‐transcription polymerase chain reaction (RT‐PCR). A, Fold‐changes in expression between the tumor and adjacent normal samples in the 10 pairs of samples. B, RT‐qPCR confirmed five genes with downregulated expression and four with upregulated expression in 18 pairs of tumor and normal tissues. The Wilcoxon W test was used to determine significance [Color figure can be viewed at wileyonlinelibrary.com]
The downregulated genes in the 10 prostate tumors included known drivers of prostate carcinogenesis, such as TP63 and CDKN1A; the PCa‐specific gene MSMB; and genes previously reported as abnormally regulated in PCa, such as WNT2, WIF1, and S100A2. We also found downregulated genes that had not been previously reported to be associated with PCa but that had been related to benign prostatic hyperplasia, including NELL2 20 and GSTM5,21 suggesting that these genes might play a role in the early stages of tumorigenesis in the prostate. The expression of several genes that are well established in other cancers, such as SCGB3A1 (an excellent marker for early detection of breast cancer)22 and NRSN2 (a candidate biomarker for hepatocellular carcinoma, HCC),23 was also significantly decreased.
3.3. The expression of nine genes was confirmed in additional PCa samples
Of these 42 genes, 10 with decreased expression (TWIST2, WNT2, WIF1, NELL2, ID4, GSTM5, NRSN2, CDKN1A, SCGB3A1, and S100A2) and five with increased expression (ACSM1, BANK1, SFTPA2, TFF3, and GAL; with fold changes ranging from 2.26 to 93.91) were present in more than 50% of tumors (Figure 1A, Table S4).
Further validation of the expression of these 15 candidate genes in an additional 18 tumor and normal tissue pairs revealed five genes as the most frequently downregulated in PCa and four as the most frequently upregulated. In particular, we found a striking difference in the expression of TWIST2 (3.26‐fold, P = .002; Figure 1B). Moreover, only TWIST2 remained after Bonferroni correction at α = .05 (0.05/15 = .0033).
We found a similar 2.61‐fold decrease in TWIST2 levels in PCa samples (P = 5.94 × 10−38) when investigating the RPKM of TWIST2 in 494 PCa pathological tissues from the TCGA Prad provisional database and 106 human postmortem tissues from the GTExPortal (portal for the Genotype‐Tissue Expression project; Figure 2A). The mRNA levels of TWIST2 were associated with the previously unreported tumor‐related genes WNT2 and NELL2, as well as with the previously reported WIF1 (Table S5).
Figure 2.
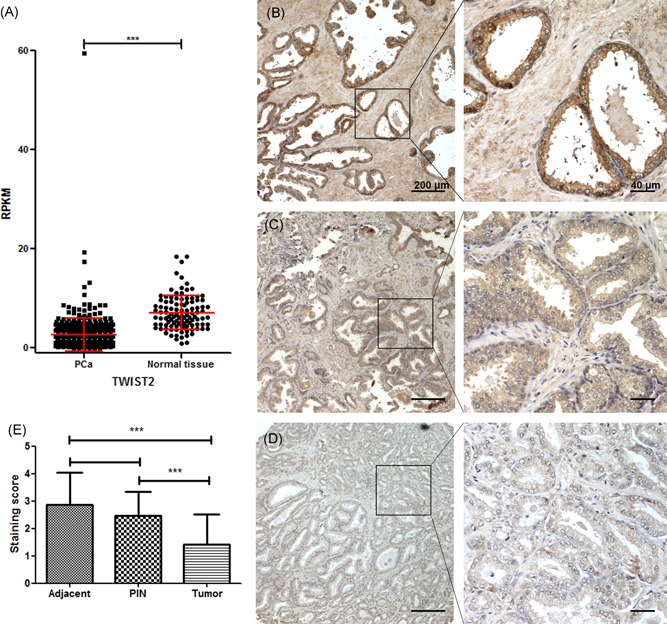
Reduced TWIST2 expression in human prostate tumors. A, Reads per kilo bases per million mapped reads levels of TWIST2 in 494 prostate cancer (PCa) pathological tissues from The Cancer Genome Atlas and 106 human normal postmortem prostate tissues from GTEx. The Wilcoxon W test was used to determine significance. Immunostaining of the TWIST2 protein in human PCa tissue microarrays. B, Adjacent normal tissue. C, Prostatic intraepithelial neoplasia (PIN) tissue. D, Tumor tissue. E, Statistical plots of the immunoreactive intensity of TWIST2 staining in 67 pairs of PCa samples and adjacent normal tissues. The Fisher exact χ 2 test was used to analyze the staining scores of adjacent normal tissues, PIN tissues, and tumor tissues. The data are shown as mean ± SD (***P < .001) [Color figure can be viewed at wileyonlinelibrary.com]
3.4. Decreased TWIST2 protein expression in human prostate tumors
Tissue microarrays from 67 pairs of patient samples containing prostate carcinoma and adjacent normal tissue were immunohistochemically stained for TWIST2 protein. The expression level of TWIST2 was graded from 0 to 3 based on the overall staining intensity (Figure 2B‐E). This analysis revealed low expression of the TWIST2 protein within PCa tumor tissues compared to that in both control and PIN tissues. Approximately one‐third of cases had negligible TWIST2 staining. However, in the PCa samples, there was no apparent correlation between TWIST2 immunostaining and tumor stage or Gleason score. These data suggest that TWIST2 expression is generally decreased early in PCa.
3.5. The TWIST2 gene promoter is hypermethylated in PCa specimens
Analysis of the genomic architecture of TWIST2 showed a dense CpG island (Figure S1). Thus, we first characterized the methylation status of CpG dinucleotides within the TWIST2 promoter in 18 tumor and normal tissue pairs. Bisulfite‐specific PCR and Sanger sequencing revealed higher methylation of the TWIST2 promoter in tumor tissues than in adjacent normal tissues (Figure 3). The methylation status of eight CpG sites (+108, +111, +118, +137, +143, +151, +175, and +183) was significantly correlated with the TWIST2 mRNA levels (all P < .05; Table S6). These data indicate that TWIST2 promoter methylation might account for the downregulation of gene expression.
Figure 3.
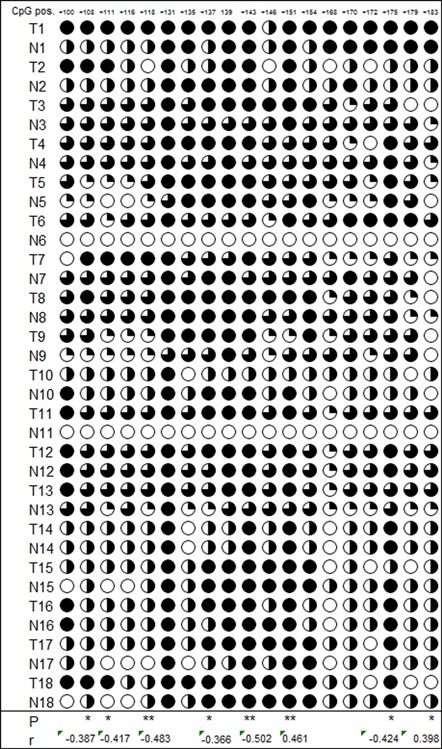
The TWIST2 gene promoter is hypermethylated in PCa specimens. Methylation patterns of CpG islands in TWIST2 in tumor and matched adjacent normal tissues. The CpG positions +100 ~ +183 are indicated relative to the transcription start codon. Each circle in the figure represents a single CpG site. For each DNA sample, the percentage of demethylation at a single CpG site reflects the methylation degree from the sequencing results. The results show methylated TWIST2 in tumors (T1‐T18) and demethylated TWIST2 in matched adjacent normal tissues (N1‐N18). Pearson correlation was used to analyze the degree of methylation at each CpG site with TWIST2 messenger RNA levels (*P < .05, **P < .01). PCa, prostate cancer
3.6. Overexpression of TWIST2 inhibits LNCap cell proliferation and colony formation in vitro
We examined the expression of TWIST2 in four cell lines: LNCap, VCap, PC3, and RWPE‐1. We found that TWIST2 expression was relatively high in the RWPE‐1, cell line a human normal prostate epithelial cell line, compared with that in the other three prostate cancer cell lines, and that its expression was lowest in the LNCap cell line, an androgen‐sensitive human prostate adenocarcinoma cell line (Figure S2).
To assess the effect of TWIST2 on the tumorigenic ability, we overexpressed TWIST2 in LNCap cells, which exhibited decreased protein expression, by gene transfer. We then determined the effect of TWIST2 on the growth of PCa cells in vitro and in vivo. Overexpression of TWIST2 in LNCap cells (Figure 4A) decreased their proliferation (Figure 4B). TWIST2‐expressing LNCap cells formed fewer and smaller colonies than vector cells in 60 mm dishes after 28 days of incubation (Figure 4C‐F). These data suggest that TWIST2 inhibits the growth of PCa tumor cells.
Figure 4.
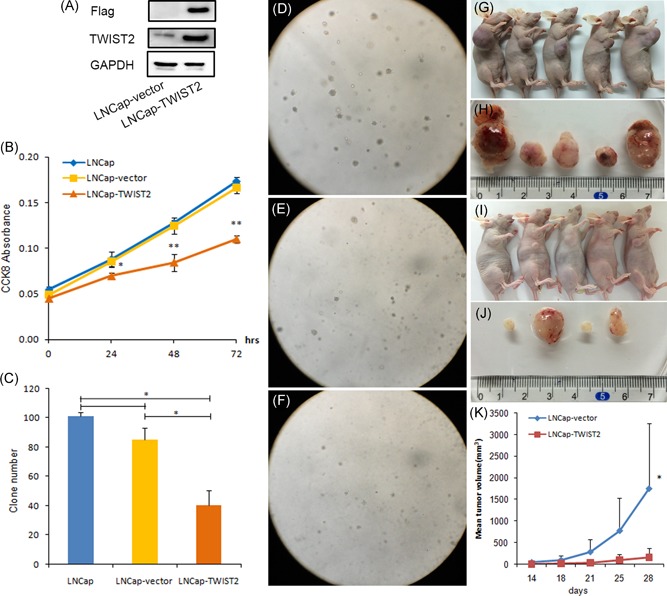
TWIST2 inhibits LNCap cell proliferation and colony formation in vitro, and growth of LNCap tumors in vivo. A, Western blot analysis of FLAG, TWIST2, and GAPDH. B, Cell counting kit‐8 assays of the cell proliferation of LNCap, LNCap‐vector, and LNCap‐TWIST2 cells. C, Number of colonies formed by the three cell lines. D‐F, Colony formation assay of LNCap, LNCap‐vector, and LNCap‐TWIST2 cells. G, I, Ten male BALB/c nude mice aged 6 to 8 weeks were randomly divided into two groups. Vector‐ or TWIST2‐expressing LNCap cells (1 × 10⁶) were subcutaneously injected into the BALB/c nude mice. H, J, Solid tumors isolated from each mouse subcutaneously injected with vector‐ or TWIST2‐expressing LNCap cells. K, Growth of tumors derived from nude mice 14 days after injection. Student t test (two‐sided) was used to determine significance. The data are shown as the mean ± SD (*P < .05) [Color figure can be viewed at wileyonlinelibrary.com]
3.7. Overexpression of TWIST2 attenuates tumorigenic potential in vivo
LNCap cells were implanted subcutaneously into BALB/c nude mice, and overexpression of TWIST2 resulted in marked inhibition of tumor growth (Figure 4G‐K). Collectively, our results indicate that TWIST2 possesses tumor suppressive activity and functions to repress tumor growth both in vitro and in vivo.
3.8. Genes important for proliferation are regulated by TWIST2
Whole genome microarray analysis was conducted with the Affymetrix GeneChip®. Genes were filtered by a scatter plot (Figure 5A and 5B), and genes upregulated or downregulated by more than two‐fold were considered in preparation of the gene list. Overexpression of TWIST2 in LNCap cells resulted in marked upregulation of 1076 genes and downregulation of 837 genes. Kyoto Encyclopedia of Genes and Genomes enrichment analysis of LNCap‐TWIST2 vs LNCap‐vector cells showed that differentially expressed genes were included in pathways such as cell cycle, cancer, DNA repair, and Wnt signaling pathway (Figure S3).
Figure 5.
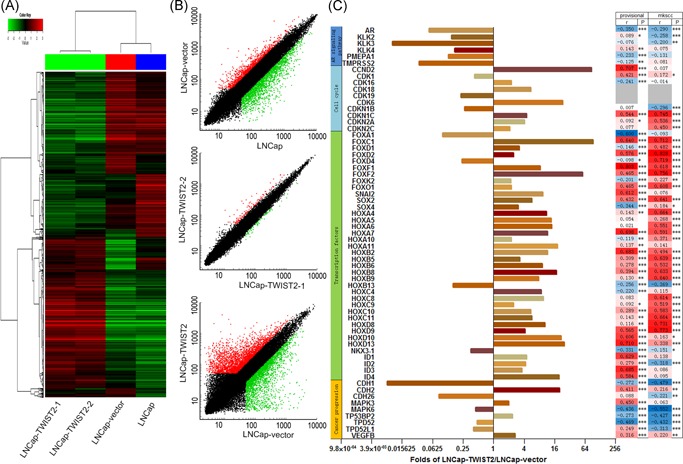
Multiple gene transcription changes occur in response to overexpression of TWIST2 in LNCap cells. A, Cluster of genes upregulated/downregulated in LNCap‐TWIST2, LNCap‐vector, and LNCap cells. Two LNCap‐TWIST2 cell lines have almost the same expression pattern, while those in the LNCap‐vector and LNCap wild‐type cell lines are similar. B, Scatter plot displays two‐fold upregulated/downregulated (green and red dots, respectively) genes in the LNCap‐TWIST2 cell line with respect to the LNCap‐vector cell line. The plot filters genes with a fold change value between 0.5 and 2 (black dots). C, Selected genes disregulated by overexpression of TWIST2 in LNCap‐TWIST2 vs LNCap‐vector cells. The RSEM levels of TWIST2 and selected genes from the TCGA Prad provisional database and Z‐scores from the TCGA Prad mkscc database in 61 PCa pathological tissues. Spearman correlations were analyzed of each selected gene with TWIST2 in the two databases (*P < .05, **P < .01, ***P < .001). PCa, prostate cancer [Color figure can be viewed at wileyonlinelibrary.com]
Some genes important for proliferation were selected, including six genes in the AR signaling pathway, 10 in the cell cycle pathway, 38 transcription factors, and nine in the cancer progression pathway (Figure 5C). The mRNA expression levels of six selected genes were measured in the three LNCap cell lines by RT‐qPCR, with similar results as in the GeneChip analysis (Figure S4).
We examined the RSEM levels of TWIST2 and these 63 selected genes from the TCGA Prad provisional database and the Z‐score from the TCGA Prad mkscc database in 61 PCa pathological tissues and calculated their Spearman correlations with TWIST2. The results from these two databases were quite consistent. We found that most selected genes were positively or negatively correlated with TWIST2. The relationships of 43 of 53 genes from the TCGA Prad provisional database and 44 of 47 from the TCGA Prad mkscc database were the same as those observed in our GeneChip results.
4. DISCUSSION
Following a series of investigations on samples from Chinese PCa patients, we present the first reported evidence that the TWIST2 gene could be a key tumor suppressor involved in the occurrence of PCa.
TWIST2 has previously been implicated in the pathogenesis of a range of cancers. Its role in the initiation and metastasis of various solid tumors is well established, and a tumor‐suppressor function in murine osteosarcoma cells and human acute myeloid leukemia (AML) has recently been reported.24, 25 The involvement of TWIST2 in both osteosarcoma and PCa suggests at a potential role in bone metastasis.26
TWIST2 showed evidence of disease‐specific methylation in our patients. Aberrant DNA methylation, which leads to inappropriate gene expression, has been extensively investigated in PCa, and it is believed to play an important role in the initiation and development of this disease. Tumor suppressor genes reported to be hypermethylated in PCa include WIF1,27 PCDH10,28 and ID4. 29 In addition to TWIST2, four other genes exhibited highly frequent downregulation in our PCa samples, namely, WNT2, WIF1, NELL2, and ID4. Wnt signaling plays a central role in osteoblast development and bone formation.30 Wnts directly stimulate tumor cell growth and survival via autocrine regulation in several types of human cancer, including PCa.31
In PCa, the roles of androgen and AR have been well described. AR signaling plays a decisive role in regulating the growth and differentiation of both normal and cancerous prostate cells by triggering the regulation of target genes.32 AR and some well‐known AR target genes (KLK2, KLK3, KLK4, and TMPRSS2), as well as PMEPA1 (an androgen induced prostate transmembrane protein), were downregulated by overexpression of TWIST2. Clusters of cyclin‐dependent kinases (CDKs) and CDK inhibitors in cell‐cycle progression, forkhead box (FOX), homeobox (HOX), and ID genes were all also regulated by TWIST2. These genes co‐operate to regulate the proliferation of PCa cells.
5. CONCLUSIONS
In summary, our analysis of the mRNA and protein levels of selected genes in clinical specimens of human PCa revealed that TWIST2 expression is frequently downregulated in this cancer and that hypermethylation of the TWIST2 promoter may account for this decrease. Therefore, TWIST2 warrants further investigation as a possible tumor suppressor in PCa pathogenesis with potential clinical application.
AUTHOR CONTRIBUTION
Chengxiao Zhao conceived the design of the study, performed the experiments, and drafted the manuscript. Wei Zhang carried out the immunohistochemical assay. Xiaoquan Zhu conceived the design of the study and performed statistical analysis. Yong Xu and Kuo Yang participated in the design of the study, and provided samples and information on patients from Tianjin. Dong Wei participated in the design of the study and provided information on patients from Beijing. Fan Zhao carried out the methylation assay. Siying Liang, Yaoguang Zhang, Xin Wang, and Xin Chen collected samples from Beijing. Liang Sun, Huiping Yuan, and Xiaohong Shi helped to draft the manuscript and manage the data. Ming Liu and Fan Yang collected samples from Tianjin. Jianye Wang and Ze Yang conceived the design of the study and modified the manuscript. All authors read and approved the final manuscript.
FUNDING INFORMATION
This study was funded by the National Natural Science Foundation of China (81400790, 91849118, 3176029, and 81460203), National Key Research and Development Program of China (2018YFC2000401), Natural Science Foundation of Guangxi (2014GXNSFDA118028), Startup Foundation for Doctors of Shanxi Medical University (03201531), and Science Foundation for Youths of Shanxi Province (201701D221161). Sponsored by the Fund for Shanxi Key Subjects Construction.
CONFLICT OF INTERESTS
The authors declare that there are no conflict of interests.
Supporting information
Supporting information
ACKNOWLEDGMENTS
The authors thank P. J. Wu and all the nurses in the Department of Urology, Beijing Hospital, and S. Zhang from the Tianjin Institute of Urology at the Second Hospital of Tianjin Medical University for collecting specimens and clinical information.
Zhao C, Zhang W, Zhu X, et al. TWIST2: A new candidate tumor suppressor in prostate cancer. The Prostate. 2019;79:1647‐1657. 10.1002/pros.23889
Chengxiao Zhao and Wei Zhang contributed equally to this study.
Contributor Information
Chengxiao Zhao, Email: zhaocx6@163.com.
Jianye Wang, Email: wangjy@bjhmoh.com.
Ze Yang, Email: yang_ze@sina.com.
References
REFERENCES
- 1. Siegel RL, Miller KD, Jemal A. Cancer statistics, 2018. CA Cancer J Clin. 2018;68(1):7‐30. [DOI] [PubMed] [Google Scholar]
- 2. Grönberg H. Prostate cancer epidemiology. Lancet. 2003;361(9360):859‐864. [DOI] [PubMed] [Google Scholar]
- 3. Schaid DJ. The complex genetic epidemiology of prostate cancer. Hum Mol Genet. 2004;13(Spec No 1):R103‐R121. [DOI] [PubMed] [Google Scholar]
- 4. Nakagawa H, Akamatsu S, Takata R, Takahashi A, Kubo M, Nakamura Y. Prostate cancer genomics, biology, and risk assessment through genome‐wide association studies. Cancer Sci. 2012;103(4):607‐613. [DOI] [PMC free article] [PubMed] [Google Scholar]
- 5. Scher HI, Sawyers CL. Biology of progressive, castration‐resistant prostate cancer: directed therapies targeting the androgen‐receptor signaling axis. J Clin Oncol. 2005;23:8253‐8261. [DOI] [PubMed] [Google Scholar]
- 6. Tomlins SA, Rhodes DR, Perner S, et al. Recurrent fusion of TMPRSS2 and ETS transcription factor genes in prostate cancer. Science. 2005;310(5748):644‐648. [DOI] [PubMed] [Google Scholar]
- 7. Bova GS, Carter BS, Bussemakers MJ, et al. Homozygous deletion and frequent allelic loss of chromosome 8p22 loci in human prostate cancer. Cancer Res. 1993;53:3869‐3873. [PubMed] [Google Scholar]
- 8. Geybels MS, Fang M, Wright JL, et al. PTEN loss is associated with prostate cancer recurrence and alterations in tumor DNA methylation profiles. Oncotarget. 2017;8(48):84338‐84348. [DOI] [PMC free article] [PubMed] [Google Scholar]
- 9. Shao Q, Ouyang J, Fan Y, et al. Prostate cancer in the senior men from rural areas in east district of China: contemporary management and 5‐year outcomes at multi‐institutional collaboration. Cancer Lett. 2012;315(2):170‐177. [DOI] [PubMed] [Google Scholar]
- 10. Ansieau S, Bastid J, Doreau A, et al. Induction of EMT by twist proteins as a collateral effect of tumor‐promoting inactivation of premature senescence. Cancer Cell. 2008;14:79‐89. [DOI] [PubMed] [Google Scholar]
- 11. Liu Y, Qian W, Zhang J, et al. The indicative function of Twist2 and E‐cadherin in HPV oncogene‐induced epithelial‐mesenchymal transition of cervical cancer cells. Oncol Rep. 2015;33(2):639‐650. [DOI] [PubMed] [Google Scholar]
- 12. Raval A, Lucas DM, Matkovic JJ, et al. TWIST2 demonstrates differential methylation in immunoglobulin variable heavy chain mutated and unmutated chronic lymphocytic leukemia. J Clin Oncol. 2005;23(17):3877‐3885. [DOI] [PubMed] [Google Scholar]
- 13. Thathia SH, Ferguson S, Gautrey HE, et al. Epigenetic inactivation of TWIST2 in acute lymphoblastic leukemia modulates proliferation, cell survival and chemosensitivity. Haematologica. 2012;97(3):371‐378. [DOI] [PMC free article] [PubMed] [Google Scholar]
- 14. Laborde RR, Wang VW, Smith TM, et al. Transcriptional profiling by sequencing of oropharyngeal cancer. Mayo Clin Proc. 2012;87(3):226‐232. [DOI] [PMC free article] [PubMed] [Google Scholar]
- 15. Morgan J, Hoekstra AV, Chapman‐Davis E, Hardt JL, Kim JJ, Buttin BM. Synuclein‐γ (SNCG) may be a novel prognostic biomarker in uterine papillary serous carcinoma. Gynecol Oncol. 2009;114(2):293‐298. [DOI] [PubMed] [Google Scholar]
- 16. Hu H, Sun L, Guo C, et al. Tumor cell‐microenvironment interaction models coupled with clinical validation reveal CCL2 and SNCG as two predictors of colorectal cancer hepatic metastasis. Clin Cancer Res. 2009;15(17):5485‐5493. [DOI] [PubMed] [Google Scholar]
- 17. European Pharmacopeia . Biological Tests ‐ Mycoplasmas. 4th ed Strasbourg, France: Council of Europe Publishing; 2002:128‐131. [Google Scholar]
- 18. Dilella AG, Toner TJ, Austin CP, Connolly BM. Identification of genes differentially expressed in benign prostatic hyperplasia. J Histochem Cytochem. 2001;49(5):669‐670. [DOI] [PubMed] [Google Scholar]
- 19. Tusher VG, Tibshirani R, Chu G. Significance analysis of microarrays applied to the ionizing radiation response. PNAS. 2001;98(9):5116‐5121. [DOI] [PMC free article] [PubMed] [Google Scholar]
- 20. Luo J, Dunn TA, Ewing CM, Walsh PC, Isaacs WB. Decreased gene expression of steroid 5 alpha‐reductase 2 in human prostate cancer: implications for finasteride therapy of prostate carcinoma. Prostate. 2003;57(2):134‐139. [DOI] [PubMed] [Google Scholar]
- 21. Luo J, Dunn T, Ewing C, et al. Gene expression signature of benign prostatic hyperplasia revealed by cDNA microarray analysis. Prostate. 2002;51(3):189‐200. [DOI] [PubMed] [Google Scholar]
- 22. Krop IE, Sgroi D, Porter DA, et al. HIN‐1, a putative cytokine highly expressed in normal but not cancerous mammary epithelial cells. PNAS. 2001;98(17):9796‐9801. [DOI] [PMC free article] [PubMed] [Google Scholar]
- 23. Ma HQ, Liang XT, Zhao JJ, et al. Decreased expression of neurensin‐2 correlates with poor prognosis in hepatocellular carcinoma. World J Gastroenterol. 2009;15(38):4844‐4848. [DOI] [PMC free article] [PubMed] [Google Scholar]
- 24. Ishikawa T, Shimizu T, Ueki A, et al. Twist2 functions as a tumor suppressor in murine osteosarcoma cells. Cancer Sci. 2013;104(7):880‐888. [DOI] [PMC free article] [PubMed] [Google Scholar]
- 25. Zhang X, Ma W, Cui J, et al. Regulation of p21 by TWIST2 contributes to its tumor‐suppressor function in human acute myeloid leukemia. Oncogene. 2014;34(23):3000‐3010. [DOI] [PubMed] [Google Scholar]
- 26. Huang Y, Meng T, Wang S, et al. Twist1‐ and Twist2‐haploinsufficiency results in reduced bone formation. PLoS One. 2014;9(6):e99331. [DOI] [PMC free article] [PubMed] [Google Scholar]
- 27. Enokida H, Shiina H, Urakami S, et al. Ethnic group‐related differences in CpG hypermethylation of the GSTP1 gene promoter among African‐American, Caucasian and Asian patients with prostate cancer. Int J Cancer. 2005;116(2):174‐181. [DOI] [PubMed] [Google Scholar]
- 28. Li Z, Li W, Xie J, et al. Epigenetic inactivation of PCDH10 in human prostate cancer cell lines. Cell Biol Int. 2011;35(7):671‐676. [DOI] [PubMed] [Google Scholar]
- 29. Vinarskaja A, Goering W, Ingenwerth M, Schulz WA. ID4 is frequently downregulated and partially hypermethylated in prostate cancer. World J Urol. 2012;30(3):319‐325. [DOI] [PubMed] [Google Scholar]
- 30. Manolagas SC. Wnt signaling and osteoporosis. Maturitas. 2014;78(3):233‐237. [DOI] [PMC free article] [PubMed] [Google Scholar]
- 31. Verras M, Brown J, Li X, Nusse R, Sun Z. Wnt3a growth factor induces androgen receptor‐mediated transcription and enhances cell growth in human prostate cancer cells. Cancer Res. 2004;64(24):8860‐8866. [DOI] [PubMed] [Google Scholar]
- 32. Li R, Wheeler T, Dai H, Frolov A, Thompson T, Ayala G. High level of androgen receptor is associated with aggressive clinicopathologic features and decreased biochemical recurrence‐free survival in prostate: cancer patients treated with radical prostatectomy. Am J Surg Pathol. 2004;28(7):928‐934. [DOI] [PubMed] [Google Scholar]
Associated Data
This section collects any data citations, data availability statements, or supplementary materials included in this article.
Supplementary Materials
Supporting information