Abstract
Nitrogenase enzymes catalyze the reduction of atmospheric dinitrogen to ammonia utilizing a Mo‐7Fe‐9S‐C active site, the so‐called FeMoco cluster. FeMoco and an analogous small‐molecule (Et4N)[(Tp)MoFe3S4Cl3] cubane have both been proposed to contain unusual spin‐coupled MoIII sites with an S(Mo)=1/2 non‐Hund configuration at the Mo atom. Herein, we present Fe and Mo L3‐edge X‐ray magnetic circular dichroism (XMCD) spectroscopy of the (Et4N)[(Tp)MoFe3S4Cl3] cubane and Fe L2,3‐edge XMCD spectroscopy of the MoFe protein (containing both FeMoco and the 8Fe‐7S P‐cluster active sites). As the P‐clusters of MoFe protein have an S=0 total spin, these are effectively XMCD‐silent at low temperature and high magnetic field, allowing for FeMoco to be selectively probed by Fe L2,3‐edge XMCD within the intact MoFe protein. Further, Mo L3‐edge XMCD spectroscopy of the cubane model has provided experimental support for a local S(Mo)=1/2 configuration, demonstrating the power and selectivity of XMCD.
Keywords: FeMo cofactor, nitrogen fixation, nitrogenase, spin coupling, X-ray magnetic circular dichroism spectroscopy
The nitrogenase family of enzymes enables the reduction of dinitrogen (N2) to ammonia (NH3) at ambient temperature and pressure.1 By far the most widely studied nitrogenases are the Mo‐dependent forms, which consist of two component proteins, the iron protein and the MoFe protein.2 The latter contains two unique cofactors, the 8Fe‐7S P‐cluster3 and the Mo‐7Fe‐9S‐C FeMoco active site, which are S=0 and S=3/2 systems in the resting form of the enzyme. FeMoco is the catalytic site for the conversion of N2 into NH3, and as such has been the subject of considerable efforts directed towards understanding its structure and function.4 In recent years, advanced EPR studies have contributed greatly towards our understanding of nitrogenase function, in large part because of the unique spin selectivity of this method.5 While X‐ray spectroscopic studies have contributed to identification of the central carbide in FeMoco6 and were also key in establishing the presence of MoIII in the FeMoco resting state,7 such studies are intrinsically limited by the fact that all absorbers of a given type are probed simultaneously,4a, 8 even when applied in a high‐energy resolution manner.9 This is a particular challenge for the MoFe protein, where the presence of both the P‐clusters and FeMoco greatly limits the ability to selectively probe the FeMoco active site. We note that selectivity for specific iron atoms may be achieved in a spatially resolved anomalous dispersion refinement (SpReAD) experiment,4m which combines Fe K‐edge X‐ray absorption spectroscopy (XAS) with X‐ray diffraction. However, the requirement for single crystals can also limit the broad applicability of this approach.
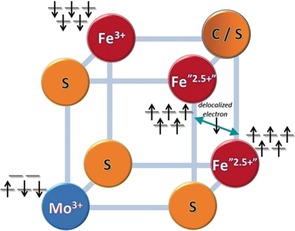
In contrast to Fe, X‐ray spectroscopic studies at Mo are far more informative for nitrogenase because of the presence of a unique Mo site. In the hard X‐ray regime, however, these studies are limited by the large core hole lifetime broadenings of the Mo 1s core hole.10 These challenges have been in part overcome by high‐resolution fluorescence detected X‐ray absorption studies (HERFD XAS) at the Mo K‐edge.7, 11 These studies were key in establishing that the FeMoco active site contains a MoIII atom, the only example known thus far in biology. Based on density functional theory (DFT) studies, the MoIII electronic structure is proposed to be in a quasi‐non‐Hund (↑↓↓) configuration (Figure 1).7 Parallel studies on an (Et4N)[(Tp)MoFe3S4Cl3] cubane show that the molecular FeMoco analogue also adopts the same electronic configuration at Mo, which is thought to arise from spin coupling (or perhaps spin canting) between the open‐shell metal ions comprising FeMoco and the [MoIIIFe3S4]3+ cubane.4a, 7, 12 However, to date, there is no spectroscopic support for this unusual electronic configuration.
Figure 1.

Spin coupling diagram for the Mo‐nitrogenase cofactor and the synthetic [MoIIIFe3S4]3+ model cubane for half of the FeMoco as proposed based on computational methods in Ref. 7.
This raises two important questions. Can we establish more selective X‐ray spectroscopic probes at iron in order to uniquely probe the FeMoco active site despite the presence of the P‐clusters? And can we experimentally determine the local spin state at Mo?
To this end, we report here the first Fe L2,3‐edge X‐ray magnetic circular dichroism (XMCD) spectroscopic measurements on MoFe protein. In Fe L2,3‐edge XMCD, one probes the difference in the 2p to 3d transition intensity using circularly left (CL) and right (CR) polarized X‐rays. In a simple picture, circularly right polarized photons will excite primarily spin up electrons, while circularly left polarized photons will excite primarily spin down electrons. Hence, for an S=0 spin system, the possible spin up and spin down transitions will be equal, and no XMCD intensity will result. Meanwhile, all systems with S>0 will have a difference between the CL and CR absorption process and result in XMCD intensity.13 We have shown in our previous study based on a set of molecular iron compounds that Fe L2,3‐edge XMCD serves as a spin‐sensitive technique even in highly covalent systems, and thus allows insight regarding iron electronic spin distribution.14 XMCD experiments thus provide a means to selectively probe the S=3/2 FeMoco in the presence of S=0 P‐clusters. We note that while XMCD intensity can still theoretically arise for S=0 systems through the Faraday effect, these contributions are expected to be very minor at low temperatures relative to those arising from S>0 systems. This has been demonstrated by measurements of S=0 iron sulfur model complexes, which show no appreciable XMCD intensity14 (see also Figure S1 in the Supporting Information). Furthermore, we have also utilized the element (and spin) selectivity of XMCD to measure both the Mo L3‐edge and Fe L2,3‐edge XMCD of a [MoIIIFe3S4]3+ cubane. These experiments allow us to very selectively probe the local Mo electronic structure and determine the nature of the coupling between the Fe and Mo sites.
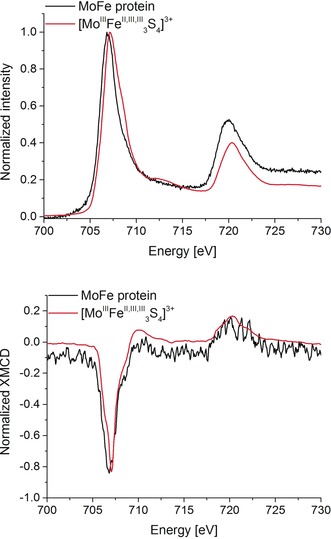
Figure 2 (top) depicts the normalized Fe L2,3‐edge XAS spectra of lyophilized MoFe protein in its S=3/2 resting state (as confirmed by EPR spectroscopy, see the Supporting Information), compared to the [MoIIIFe3S4]3+ cubane. The first moment of the MoFe protein Fe L3‐edge occurs about 0.4 eV to lower energy than that of the cubane. This is consistent with the fact that the MoFe protein (containing the all ferrous P‐cluster and the 4 FeIII:3 FeII FeMoco site) is generally more reduced than the cubane. Specifically, 27 % of iron in MoFe is in the ferric form, while the cubane contains 67 % ferric iron. Interestingly, the Fe L2,3‐edge XMCD data (Figure 2, bottom) shows a smaller difference in the first moment of the Fe L3 feature, with MoFe only about 0.2 eV lower in energy than the cubane. This is consistent with the fact that the S=0 P‐clusters will be XMCD‐silent at low temperature and high magnetic field,15 thus reducing the ferrous contribution to the XMCD signal. In both the protein and the cubane data, the Fe L3‐edge XMCD has a negative sign, indicating that the iron sites comprise the majority spin contribution to the S=3/2 spin state in both FeMoco and the cubane model.14, 16 This observation was first made by Cramer and co‐workers in Ref. 17, and has been subsequently observed in our studies on iron–sulfur and iron–heterometallic systems.14
Figure 2.

Top: Normalized Fe L2,3‐edge XAS spectra of MoFe protein and the [MoIIIFe3S4]3+ model cubane. Bottom: Corresponding normalized Fe L2,3‐edge XMCD spectra obtained at 4 K and ±6 T magnetic field. [MoIIIFe3S4]3+ data, adapted from Ref. 14. The MoFe protein Fe L2,3‐edge XMCD spectrum was smoothed using the Savitzky–Golay algorithm (2nd order polynomial with 9 points window) in order to obtain better peak definition.
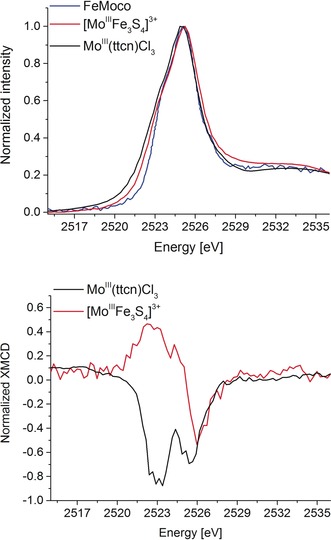
From Figure 2, it can also be seen that the MoFe protein Fe L2,3‐edge XMCD data are noisy, highlighting the challenges of measuring a dilute metalloprotein. Moving to the Mo L3‐edge XMCD, the relative concentration of the absorber is decreased by a factor of about 15, making the experiments prohibitively challenging. Mo L3‐edge XMCD measurements are further complicated by the large number of sulfur atoms in the protein (72 in total).12 Here it is important to note that the S K‐emission lines are not resolvable from the Mo L‐emission lines within the resolution of the present setup. In the present study, we were able to measure the Mo L3‐edge XAS of the MoFe protein consistent with the previously published Mo L3‐edge XAS data of FeMoco (Figure S4 in the Supporting Information). However, because of the issues noted above, we were not able to obtain a satisfactory Mo XMCD signal‐to‐noise ratio for the MoFe protein. We were, however, able to measure Mo L3‐edge XAS and XMCD spectra for the [MoIIIFe3S4]3+ cubane, which was previously shown to be a good electronic structural analogue of half of the FeMoco.7, 12, 18 Figure 3 shows the Mo L3‐edge XAS and XMCD spectra of [MoIIIFe3S4]3+ and MoIII(ttcn)Cl3 and the previously published Mo L3‐edge XAS of isolated FeMoco.19 We note that the synthesis of MoIII(ttcn)Cl3 has not been previously reported, and full details of the synthesis and characterization are provided in the Supporting Information. All three samples exhibit very similar Mo L3‐edge spectra with similar L3‐edge maxima, consistent with a MoIII oxidation state assignment.7 MoIII(ttcn)Cl3 serves as a mononuclear high‐spin MoIII reference, with an S=3/2 spin state as confirmed by SQUID (Figure S2 in the Supporting Information). Structural, oxidation state, and spin state information of the compounds used in this study are provided in Table S1. The Mo L3‐edge XMCD of MoIII(ttcn)Cl3 exhibits two negative features separated in energy by approximately 2.4 eV. In contrast, the Mo L3‐edge XMCD spectrum of the [MoIIIFe3S4]3+ cubane is distinctly different from that of the high‐spin reference model, showing a lower‐energy positive feature and a negative peak at higher energies. Here it is remarkable to note that despite the very similar Mo L3‐edges, the XMCD spectra are distinct and provide clear experimental evidence for a difference in the local electronic structure of the Mo in the cubane relative to the monomer.
Figure 3.

Top: Normalized Mo L3‐edge XAS spectra of MoIII(ttcn)Cl3 (black) and [MoIIIFe3S4]3+ (red) complexes and FeMoco (blue, adapted with permission from Ref. 19. Bottom: Normalized Mo L3‐edge XMCD spectra of MoIII(ttcn)Cl3 (black) and [MoIIIFe3S4]3+ (red) complexes obtained at 4 K and ±6 T magnetic field.
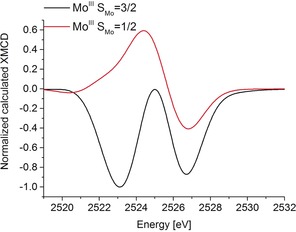
In order to more quantitatively understand these differences, we have performed ligand field multiplet simulations of the Mo L3‐edge XMCD spectra. An Oh local site symmetry was initially assumed. The best agreement with the MoIII(ttcn)Cl3 spectrum was obtained when the ligand field splitting (10 Dq) was set to 2.5 eV. However, for all reasonable values of 10 Dq, two negative features were calculated in the spectrum, with the separation between the two peaks increasing as 10 Dq is increased (Figures S10 and S11). This indicates that the two negative XMCD features are a signature of an S(Mo)=3/2 spin system. As it is not possible to reach an S(Mo)=1/2 spin at Mo in Oh symmetry, simulations were performed in which a tetragonal distortion was introduced by modulating Ds and Dt. For small tetragonal distortions, where an S(Mo)=3/2 ground state is retained, two negative features remain in the XMCD. However, when the splitting in the t2 set of orbitals is large enough to favor spin pairing (for Ds>0.7 eV), positive XMCD intensity is observed (see Figures S10 and S11 for simulations). We note that these simulations only indicate that a derivative shaped XMCD should be observed when the Mo has an S(Mo)=1/2 spin (Figures 4 and S10 and S11). Whether the XMCD signal is positive–negative or negative–positive depends on the nature of the tetragonal distortion. Hence, such simple multiplet calculations do not fully capture the complex magnetic coupling within the [MoIIIFe3S4]3+ cubane and limit our ability to more quantitatively interpret these spectra. They nonetheless provide compelling evidence that the Mo site in the [MoIIIFe3S4]3+ cubane is not a typical S(Mo)=3/2 Mo and further support a local non‐Hund S(Mo)=1/2 configuration.
Figure 4.

Multiplet calculations of Mo L3‐edge XMCD spectra of a high‐spin Mo site (S=3/2, black) and a low‐spin Mo site (S=1/2, red) corresponding to the local Mo spin states in MoIII(ttcn)Cl3 and [MoIIIFe3S4]3+ complexes, respectively. The spectra were normalized to match with the experiment.
In summary, we have demonstrated the ability of Fe L2,3‐edge XMCD to selectively probe the S=3/2 FeMoco component of the MoFe protein. Further, we have shown that the local Mo electronic structure in the [MoIIIFe3S4]3+ cubane is distinct from the standard S(Mo)=3/2 high‐spin configuration that would be expected for MoIII in an approximately Oh ligand field. These data provide the first experimental evidence for a spin‐coupled non‐Hund configuration at the Mo site, as initially proposed based on computational studies.7 The present data demonstrate the in‐depth information regarding electronic structure that can be achieved by combining XMCD at two different metal L‐edges, forming a foundation for future selective XMCD studies of nitrogenase and other biological catalysts.
Conflict of interest
The authors declare no conflict of interest.
Supporting information
As a service to our authors and readers, this journal provides supporting information supplied by the authors. Such materials are peer reviewed and may be re‐organized for online delivery, but are not copy‐edited or typeset. Technical support issues arising from supporting information (other than missing files) should be addressed to the authors.
Supplementary
Acknowledgements
The Max Planck Society, the European Research Council under the European Union's Seventh Framework Programme (FP/2007‐2013; ERC Grant Agreement No. 615414 (S.D.) and No. 310656 (O.E.)), the DFG projects DE 1877/1‐1 (S.D.) and EI 520/10 (O.E.) within the SPP 1927 “Iron‐Sulfur for Life”, as well as DFG RTG 1976 “Functional Diversity of Cofactors” are acknowledged for funding. This research used resources of the Advanced Photon Source, a U.S. Department of Energy (DOE) Office of Science User Facility operated for the DOE Office of Science by Argonne National Laboratory under Contract No. DE‐AC02‐06CH11357. We acknowledge SOLEIL for provision of synchrotron radiation facilities and thank Dr. Edwige Otero for assistance in using the DEIMOS beamline. We would also like to thank Julius Bauer and Fabian Strunk for assistance during beamtimes. We thank Tabea Mußfeldt for providing the [MoIIIFe3S4]3+ sample. J.T.H. acknowledges funding from the Alexander von Humboldt Foundation. C.S. acknowledges the international Max Planck School, Recharge, for a doctoral fellowship.
J. K. Kowalska, J. T. Henthorn, C. Van Stappen, C. Trncik, O. Einsle, D. Keavney, S. DeBeer, Angew. Chem. Int. Ed. 2019, 58, 9373.
References
- 1.
- 1a. Howard J. B., Rees D. C., Chem. Rev. 1996, 96, 2965–2982; [DOI] [PubMed] [Google Scholar]
- 1b. Burgess B. K., Lowe D. J., Chem. Rev. 1996, 96, 2983–3011; [DOI] [PubMed] [Google Scholar]
- 1c. Hu Y. L., Ribbe M. W., Acc. Chem. Res. 2010, 43, 475–484. [DOI] [PMC free article] [PubMed] [Google Scholar]
- 2. Burgess B. K., Chem. Rev. 1990, 90, 1377–1406. [Google Scholar]
- 3. Hu Y., Fay A. W., Lee C. C., Ribbe M. W., Proc. Natl. Acad. Sci. USA 2007, 104, 10424–10429. [DOI] [PMC free article] [PubMed] [Google Scholar]
- 4.
- 4a. Kowalska J., DeBeer S., Biochim. Biophys. Acta Mol. Cell Res. 2015, 1853, 1406–1415; [DOI] [PubMed] [Google Scholar]
- 4b. Hoffman B. M., Lukoyanov D., Yang Z. Y., Dean D. R., Seefeldt L. C., Chem. Rev. 2014, 114, 4041–4062; [DOI] [PMC free article] [PubMed] [Google Scholar]
- 4c. Smith B. E., Science 2002, 297, 1654–1655; [DOI] [PubMed] [Google Scholar]
- 4d. Kim J. S., Rees D. C., Nature 1992, 360, 553–560; [DOI] [PubMed] [Google Scholar]
- 4e. Eady R. R., Chem. Rev. 1996, 96, 3013–3030; [DOI] [PubMed] [Google Scholar]
- 4f. Cramer S. P., Gillum W. O., Hodgson K. O., Mortenson L. E., Stiefel E. I., Chisnell J. R., Brill W. J., Shah V. K., J. Am. Chem. Soc. 1978, 100, 3814–3819; [Google Scholar]
- 4g. Cramer S. P., Hodgson K. O., Gillum W. O., Mortenson L. E., J. Am. Chem. Soc. 1978, 100, 3398–3407; [Google Scholar]
- 4h. Hoffman B., Lukoyanov D., Seefeldt L., Dean D., J. Biol. Inorg. Chem. 2014, 19, S85-S85;24271273 [Google Scholar]
- 4i. Hoffman B. M., Lukoyanov D., Dean D. R., Seefeldt L. C., Abstr. Pap. Am. Chem. Soc. 2014, 247, 0; [Google Scholar]
- 4j. Hu Y. L., Ribbe M. W., J. Biol. Inorg. Chem. 2015, 20, 435–445; [DOI] [PMC free article] [PubMed] [Google Scholar]
- 4k. Kim J. S., Rees D. C., Science 1992, 257, 1677–1682; [DOI] [PubMed] [Google Scholar]
- 4l. Spatzal T., Aksoyoglu M., Zhang L. M., Andrade S. L. A., Schleicher E., Weber S., Rees D. C., Einsle O., Science 2011, 334, 940–940; [DOI] [PMC free article] [PubMed] [Google Scholar]
- 4m. Spatzal T., Schlesier J., Burger E. M., Sippel D., Zhang L. M., Andrade S. L. A., Rees D. C., Einsle O., Nat. Commun. 2016, 7, 10902; [DOI] [PMC free article] [PubMed] [Google Scholar]
- 4n. Spatzal T., Perez K. A., Howard J. B., Rees D. C., eLife 2015, 4, e11620. [DOI] [PMC free article] [PubMed] [Google Scholar]
- 5.
- 5a. Barney B. M., Lukoyanov D., Igarashi R. Y., Laryukhin M., Yang T. C., Dean D. R., Hoffman B. M., Seefeldt L. C., Biochemistry 2009, 48, 9094–9102; [DOI] [PMC free article] [PubMed] [Google Scholar]
- 5b. Christie P. D., Lee H. I., Cameron L. M., Hales B. J., Orme-Johnson W. H., Hoffman B. M., J. Am. Chem. Soc. 1996, 118, 8707–8709; [Google Scholar]
- 5c. Davis L. C., Henzl M. T., Burris R. H., Orme-Johnson W. H., Biochemistry 1979, 18, 4860–4869; [DOI] [PubMed] [Google Scholar]
- 5d. Davydov R., Khadka N., Yang Z. Y., Fielding A. J., Lukoyanov D., Dean D. R., Seefeldt L. C., Hoffman B. M., Isr. J. Chem. 2016, 56, 841–851; [DOI] [PMC free article] [PubMed] [Google Scholar]
- 5e. Dos Santos P. C., Igarashi R. Y., Lee H. I., Hoffman B. M., Seefeldt L. C., Dean D. R., Acc. Chem. Res. 2005, 38, 208–214; [DOI] [PubMed] [Google Scholar]
- 5f. Hagen W. R., Eady R. R., Dunham W. R., Haaker H., FEBS Lett. 1985, 189, 250–254; [DOI] [PubMed] [Google Scholar]
- 5g. Lee H. I., Thrasher K. S., Dean D. R., Newton W. E., Hoffman B. M., Biochemistry 1998, 37, 13370–13378; [DOI] [PubMed] [Google Scholar]
- 5h. Lee H. I., Hales B. J., Hoffman B. M., J. Am. Chem. Soc. 1997, 119, 11395–11400; [Google Scholar]
- 5i. Lukoyanov D., Khadka N., Yang Z. Y., Dean D. R., Seefeldt L. C., Hoffman B. M., J. Am. Chem. Soc. 2016, 138, 10674–10683; [DOI] [PMC free article] [PubMed] [Google Scholar]
- 5j. Lukoyanov D., Pelmenschikov V., Maeser N., Laryukhin M., Yang T. C., Noodleman L., Dean D. R., Case D. A., Seefeldt L. C., Hoffman B. M., Inorg. Chem. 2007, 46, 11437–11449; [DOI] [PubMed] [Google Scholar]
- 5k. Lukoyanov D., Yang Z. Y., Duval S., Danyal K., Dean D. R., Seefeldt L. C., Hoffman B. M., Inorg. Chem. 2014, 53, 3688–3693; [DOI] [PMC free article] [PubMed] [Google Scholar]
- 5l. Münck E., Rhodes H., Orme-Johnson W. H., Davis L. C., Brill W. J., Shah V. K., Biochim. Biophys. Acta Protein Struct. 1975, 400, 32–53; [DOI] [PubMed] [Google Scholar]
- 5m. Orme-Johnson W. H., Hamilton W. D., Jones T. L., Tso M. Y., Burris R. H., Shah V. K., Brill W. J., Proc. Natl. Acad. Sci. USA 1972, 69, 3142–3145; [DOI] [PMC free article] [PubMed] [Google Scholar]
- 5n. Pollock R. C., Lee H.-I., Cameron L. M., DeRose V. J., Hales B. J., Orme-Johnson W. H., Hoffman B. M., J. Am. Chem. Soc. 1995, 117, 8686–8687; [Google Scholar]
- 5o. Tittsworth R. C., Hales B. J., J. Am. Chem. Soc. 1993, 115, 9763–9767; [Google Scholar]
- 5p. Venters R. A., Nelson M. J., McLean P. A., True A. E., Levy M. A., Hoffman B. M., Orme-Johnson W. H., J. Am. Chem. Soc. 1986, 108, 3487–3498. [Google Scholar]
- 6. Lancaster K. M., Roemelt M., Ettenhuber P., Hu Y. L., Ribbe M. W., Neese F., Bergmann U., DeBeer S., Science 2011, 334, 974–977. [DOI] [PMC free article] [PubMed] [Google Scholar]
- 7. Bjornsson R., Lima F. A., Spatzal T., Weyhermuller T., Glatzel P., Bill E., Einsle O., Neese F., DeBeer S., Chem. Sci. 2014, 5, 3096. [Google Scholar]
- 8.
- 8a. Fay A. W., Blank M. A., Lee C. C., Hu Y. L., Hodgson K. O., Hedman B., Ribbe M. W., J. Am. Chem. Soc. 2010, 132, 12612–12618; [DOI] [PMC free article] [PubMed] [Google Scholar]
- 8b. Musgrave K. B., Liu H. I., Ma L., Burgess B. K., Watt G., Hedman B., Hodgson K. O., J. Biol. Inorg. Chem. 1998, 3, 344–352; [Google Scholar]
- 8c. Corbett M. C., Hu Y. L., Fay A. W., Ribbe M. W., Hedman B., Hodgson K. O., Proc. Natl. Acad. Sci. USA 2006, 103, 1238–1243; [DOI] [PMC free article] [PubMed] [Google Scholar]
- 8d. Kowalska J. K., Hahn A. W., Albers A., Schiewer C. E., Bjornsson R., Lima F. A., Meyer F., DeBeer S., Inorg. Chem. 2016, 55, 4485–4497. [DOI] [PMC free article] [PubMed] [Google Scholar]
- 9.
- 9a. Kowalska J. K., Lima F. A., Pollock C. J., Rees J. A., DeBeer S., Isr. J. Chem. 2016, 56, 803–815; [Google Scholar]
- 9b. Rees J. A., Bjornsson R., Kowalska J. K., Lima F. A., Schlesier J., Sippel D., Weyhermuller T., Einsle O., Kovacs J. A., DeBeer S., Dalton Trans. 2017, 46, 2445–2455. [DOI] [PMC free article] [PubMed] [Google Scholar]
- 10. Krause M. O., Oliver J. H., J. Phys. Chem. Ref. Data 1979, 8, 329–338. [Google Scholar]
- 11. Lima F. A., Bjornsson R., Weyhermuller T., Chandrasekaran P., Glatzel P., Neese F., DeBeer S., Phys. Chem. Chem. Phys. 2013, 15, 20911–20920. [DOI] [PubMed] [Google Scholar]
- 12. Bjornsson R., Delgado-Jaime M. U., Lima F. A., Sippel D., Schlesier J., Weyhermuller T., Einsle O., Neese F., DeBeer S., Z. Anorg. Allg. Chem. 2015, 641, 65–71. [DOI] [PMC free article] [PubMed] [Google Scholar]
- 13. de Groot F. M. F., Kotani A., Core Level Spectroscopy of Solids. Introduction, CRC Press, Boca Raton, FL, 2008. [Google Scholar]
- 14. Kowalska J. K., Nayyar B., Rees J. A., Schiewer C. E., Lee S. C., Kovacs J. A., Meyer F., Weyhermuller T., Otero E., DeBeer S., Inorg. Chem. 2017, 56, 8147–8158. [DOI] [PMC free article] [PubMed] [Google Scholar]
- 15. Morningstar J. E., Johnson M. K., Case E. E., Hales B. J., Biochemistry 1987, 26, 1795–1800. [DOI] [PubMed] [Google Scholar]
- 16. Cramer S. P., Peng G., Christiansen J., Chen J., van Elp J., George S. J., Young A. T., J. Electron Spectrosc. Relat. Phenom. 1996, 78, 225–229. [Google Scholar]
- 17. Funk T., Deb A., George S. J., Wang H. X., Cramer S. P., Coord. Chem. Rev. 2005, 249, 3–30. [Google Scholar]
- 18. Fomitchev D. V., McLauchlan C. C., Holm R. H., Inorg. Chem. 2002, 41, 958–966. [DOI] [PubMed] [Google Scholar]
- 19. Hedman B., Frank P., Gheller S. F., Roe A. L., Newton W. E., Hodgson K. O., J. Am. Chem. Soc. 1988, 110, 3798–3805. [Google Scholar]
Associated Data
This section collects any data citations, data availability statements, or supplementary materials included in this article.
Supplementary Materials
As a service to our authors and readers, this journal provides supporting information supplied by the authors. Such materials are peer reviewed and may be re‐organized for online delivery, but are not copy‐edited or typeset. Technical support issues arising from supporting information (other than missing files) should be addressed to the authors.
Supplementary


