

Abstract
Many animal species show flexible behavioral responses to environmental and social changes. Such responses typically require changes in the neural substrate responsible for particular behavioral states. We have shown previously in the African cichlid fish,Haplochromis burtoni, that changes in social status, including events such as losing or winning a territorial encounter, result in changes in somatic growth rate. Here we demonstrate for the first time that changes in social status cause changes in the size of neurons involved in the control of growth. Specifically, somatostatin-containing neurons in the hypothalamus of H. burtoni increase up to threefold in volume in dominant and socially descending animals compared with cell sizes in subordinate and socially ascending fish. Because somatostatin is known to be an inhibitor of growth hormone release, the differences in cell size suggest a possible mechanism to account for the more rapid growth rates of subordinate and socially ascending animals compared with those of dominant or socially descending fish. These results reveal possible mechanisms responsible for socially induced physiological plasticity that allow animals to shift resources from reproduction to growth or vice versa depending on the social context.
Keywords: cichlid fish, dominance, life history, somatostatin, neuron size, social status, phenotypic plasticity
Distinct behavioral tactics used by individuals of the same species under different social and environmental conditions often reflect changes in reproductive opportunity (Williams, 1966; Lott, 1982). For example, individuals may delay reproduction if they cannot compete with currently superior animals. In species with indeterminate growth, such as fish, dominance status may affect the life-history strategies of individuals by regulating growth rate (Metcalfe et al., 1989; Warner, 1991;Hofmann et al., 1999a). How animals adjust to the diverse physiological requirements of such different strategies is unknown.
To understand the neural and endocrine modifications produced by social change, we induced changes in dominance among African cichlid fish,Haplochromis burtoni, and measured the effects. H. burtoni is a nonseasonal breeder and lives in shore pools of Lake Tanganyika in tropical East Africa (Fernald and Hirata, 1977a,b). The behavior of this species has been carefully described in both the laboratory (Fernald, 1977) and the field (Fernald and Hirata, 1977a). At any time, ∼30% of the adult male population show bright body coloration, perform 17 distinct behavioral acts, maintain territories, and have mature testes [territorial fish (T)]. Only Ts are reproductively active. The remaining males [nonterritorial fish (NT)] school with females, are cryptically colored, and sexually regressed. We have demonstrated previously that a change in social status leads to a change in the size of gonadotropin-releasing hormone (GnRH)-containing neurons of the hypothalamus. In Ts, GnRH-containing neurons are eight times larger than those in NTs (Francis et al., 1993). These differences between T and NT males have been studied in stable social situations or after individuals were moved to new tanks (Francis et al., 1993). However, the natural conditions under which these fish live are much less stable than those in the laboratory (Fernald and Hirata, 1977b). For example, strong winds often produce significant interruption of the three dimensional layout of the shallow habitats. Moreover, Fernald and Hirata (1977b)reported that hippopotami (Hippopotamus amphibius) traversed their study sites and disrupted the territorial structures occupied by T males. In addition to changes in the physical environment, the social system may also change because T males are more likely to be targets of predation because of their conspicuously bright coloration (Fernald and Hirata, 1977b). This instability forces individuals to adjust their behavior and physiology quickly as reproductive opportunities come and go.
We have shown previously (Hofmann et al., 1999a) that NTs and males ascending in social rank (NT→T) show an increased growth rate, whereas Ts and socially descending animals (T→NT) slow their growth rate or even shrink. Because of the pronounced growth reduction in those social categories (Hofmann et al., 1999a), we hypothesized that somatostatin is the most likely mediator of this effect. This neuroendocrine signaling peptide inhibits the release of growth hormone (GH) from the pituitary to regulate somatic growth (Brazeau et al., 1973). To examine whether neurons containing this neuropeptide might play a role in the socially mediated control of growth inH. burtoni, we measured the size of somatostatin-containing neurons in the preoptic area (POA) of the hypothalamus as a function of social status. Many signaling neuropeptides that control the release of pituitary hormones are produced in the POA, which is known for its importance in both growth and reproduction (Palkovits, 1988).
MATERIALS AND METHODS
To induce social change, we subjected animals to a fluctuating environment (Hofmann et al., 1999a), simulating alterations in the natural environment caused by hippopotamus visits, winds, predation, etc. (Fernald and Hirata, 1977a). Animals were observed and their growth was measured before they were killed, after which changes in the preoptic brain area were measured.
Animal care. Fish derived from a wild-caught stock population were kept in aquaria under conditions similar to those of their natural environment (Fernald and Hirata, 1977b): pH 8, 28°C water temperature, and 12 hr light/dark cycle with full-spectrum illumination. Gravel covered the floor of the aquaria, and flowerpots on the substrate facilitated the establishment and maintenance of territories necessary for successful reproduction (Fernald and Hirata, 1977a). Fish were fed every morning ad libitum with cichlid pellets and flakes (AquaDine, Healdsburg, CA). All work was in compliance with the Animal Care and Use Guidelines at Stanford University and approved by the local Administrative Panel on Laboratory Animal Care committee.
Experimental design. Males that were individually identified via colored tags (7–10 fish per tank) from different age cohorts were placed in 100 l aquaria (91 × 45 × 25 cm) with approximately the same number of females. The standard lengths (SL) and weights of each fish were measured weekly or biweekly. Because fish typically display their normal behaviors <1 hr after being measured, the interval between times of handling was long enough for the fish to recover from this stressor. We defined the growth rate as the relative change in SL over a 7 d period (Hofmann et al., 1999a). Growth rates were independent of standard length (Fig.1), as was shown by linear regression analysis (regression ANOVA; F(1,19) = 0.7975; r2 = 0.04;p = 0.383).
Fig. 1.

Growth rate shown as a function of standard lengths, illustrating that these are independent for the range of fish sizes in this study (linear regression ANOVA;F(1,19) = 0.7975;r2 = 0.04; p= 0.383).
We induced changes in social status by altering the habitat through rearrangement of the number and location of territorial shelters. Five days after an environmental change, we measured the standard length and weight of each animal and recorded their social status. The three possible outcomes are that animals (1) maintained their status as T or NT; (2) ascended in status (NT→T); or (3) descended in status (T→NT). After these manipulations, the fish often showed dramatic changes in growth; NTs and NT→Ts grew faster than Ts and T→NTs, which either grew slightly or even shrank (Hofmann et al., 1999a).
Behavioral observations. Before being killed, all animals were observed at least three times per week for ∼20 min between 10:00 A.M. and 1:00 P.M. Ts and NTs were categorized based on their characteristic coloration and behavioral patterns (Fernald, 1977). Brightly colored T males display a black lachrymal stripe across the eyes and are aggressive, as seen by their chasing, biting, exhibiting threat displays, and border conflicts with other Ts. These males are reproductively active, as shown by digging spawning pits in the gravel and courting and spawning with females. In contrast, the sandy gray NTs tend to form schools and flee from chasing Ts. The location of the territories within each tank was also recorded.
Gonadal analysis. Five days after a habitat disruption, animals were anesthetized and quickly killed by rapid cervical transection. Gonads were removed and weighed, and the gonadosomatic index (GSI) was calculated: GSI = (organ weight [g]/body weight [g]) × 100.
Immunocytochemistry. After the animals were killed, brains were rapidly removed and immersion-fixed overnight (4% paraformaldehyde in phosphate buffer, 4°C). The tissue was cryoprotected overnight (4°C in 30% sucrose), frozen at −20°C, and then sagittally sectioned at 30 μm on a microtome cryostat (Microm, Heidelberg, Germany). Tissue was collected on slides (Colorfrost/Plus; Fisher Scientific, Pittsburgh, PA) and kept at −20°C until further processing. To identify somatostatin-immunoreactive (IR) cells, sections were incubated overnight at 4°C with a primary polyclonal antiserum raised in rabbit against somatostatin (Peninsula Laboratories, Belmont, CA), previously used successfully on teleost fish neurons (Stroh and Zupanc, 1996). To locate the antibody binding site, avidin–biotin amplification was used (Vector Laboratories, Burlingame, CA) and visualized using nickel-enhanced 3,3′-diaminobenzidine as chromogen. After dehydration in an ascending alcohol series and clearing in xylene, sections were mounted in Permount (Fisher Scientific) under coverslips. Four brains (one of each social category) were processed as a group.
In teleosts, neuropeptide-producing hypothalamic neurons project to their respective target cells in the pituitary directly, because there is no portal system (Peter et al., 1990). Grau et al. (1985) have shown that, in a closely related cichlid species, the Tilapia, preoptic somatostatin-IR neurons project to the pituitary. In theH. burtoni pituitary, somatostatin immunoreactivity is most prevalent where the proximal pars distalis interdigitates with the central and posterior neurohypophysis (H. A. Hofmann and R. D. Fernald, unpublished observations). This is also the location in which the growth hormone-producing somatotrophs are located in cichlids (Melamed et al., 1999).
In addition to the neuron population in the POA, the somatostatin antiserum consistently stained cells in the ventrolateral telencephalon, the optic tectum, the caudal hypothalamus, the medulla oblongata, and occasionally in other areas, consistent with previous reports in fish (Grau et al., 1985; Margolis-Nunno et al., 1987; Batten et al., 1990; Stroh and Zupanc, 1996; Vallarino et al., 1997).
Cell size measurements. The soma sizes of neurons immunoreactive to somatostatin in the POA were measured using computer-aided analysis of video images (NIH Image 1.61; Wayne Rasband, National Institutes of Health, Gaithersburg, MD) viewed via microscope (Axioskop; Zeiss, Oberkochen, Germany). For a minimum of 50 neurons per animal, the cross-sectional area was measured for neurons with the nucleus in the plane of section. The measuring error was <7%, as estimated by repeatedly measuring cells of the same sections in some fish. Measurements of stained cells in the ventral telencephalon of some individuals did not yield any evidence for soma size differences.
We tested whether body size differences contributed to differences in somatostatin-IR soma size for the range of fish we used (4.30 cm/2.48; 7.85 cm/15.79). The size of somatostatin-containing cells is not a function of animal size (Spearman rank correlation;rs = 0.1709; p = 0.4590; n = 18). Nonetheless, to eliminate any possible variation introduced by body size differences, cell size measurements were corrected with the following procedure (White and Fernald, 1993): corrected soma sizes SSc = SSu + {[(SSu * SLx/SL) − SSu] *K}, where SSu is the uncorrected mean soma size of an individual fish, SL its standard length, and SLx is the mean standard length for the whole subject pool of this study. K is a constant for the contribution of SL to SSu as determined by the Spearman rank test for that sample. This correction was 5.2% or less.
Statistics. All values are presented as means ± SE. Soma sizes and growth rates of different social categories were compared by means of ANOVA with post hoc group comparisons after Tukey–Kramer using GB-Stat software (Dynamic Microsystems, Silver Spring, MD).
RESULTS
Five days after a habitat disruption, changes were observed in social status of some animals. In individuals that changed status, we found changes in rate of growth, gonad size, and size of somatostatin-containing neurons in the POA. Thus, an environmental manipulation produced substantial changes in the behavior, body, and brain of individual males.
Growth
In the 5 d after an environmental change was induced, NTs and NT→T males grew significantly faster than Ts and T→NTs (Fig.2). This result is consistent with our previous findings (Hofmann et al., 1999a). Growth rates of NTs and NT→Ts were combined, as were growth rates of Ts and T→NTs, because their respective growth rates were not significantly different.
Fig. 2.

Average ± SE growth rates calculated as the relative change in standard length for four distinct social classes of males shown 5 d after a habitat disruption. NT and NT→T males grew significantly faster than T and T→NT animals (ANOVA;F(3,14) = 8.4407; p< 0.002).
Gonad size
NT fish had relatively smaller gonads than did NT→T, T, and T→NT males (Fig. 3). Thus, within 5 d after habitat disruption, NT→Ts increased gonad size to nearly T levels, whereas T→NTs did not show a significant decrease.
Fig. 3.

Mean ± SE GSIs presented for each of the four social categories of NT, NT→T, T, and T→NT 5 d after habitat disruption. Differences between NTs and Ts are significant (Mann–Whitney U test; U = 31;n1 = 5;n2 = 7; p < 0.02), whereas differences between NTs and NT→Ts (U = 30; n1 = 5;n2 = 8; p = 0.11) and T→NTs (U = 32;n1 = 5;n2 = 8; p = 0.06), respectively, are only nearly significant. Interestingly, NT→T animals display T-sized gonads only 5 d after they became territorial (U = 39;n1 = 8;n2 = 7; p = 0.17). Correspondingly, the gonads of T→NT males had not regressed compared with Ts after the same time interval (U = 40;n1 = 8;n2 = 7; p = 0.73).
Somatostatin-IR soma sizes
The size of somatostatin-IR somata depended on social status. NTs and NT→Ts had substantially smaller somatostatin-containing neurons than did T→NTs and Ts, as can be seen from the representative examples in Figure 4. Statistical analysis confirmed that the soma size differences are significant (for details, see Fig. 5a). Somatostatin cell size is significantly correlated with overall growth rate (Fig. 5b). The resulting inverse relationship between cell sizes and growth rates was fitted by a linear regression analysis (regression ANOVA; F(1,16) = 11.4133;r2 = 0.42; p < 0.001). Interestingly, staining intensity as an indicator of antigen amount appeared to vary as well between the groups. The somatostatin-IR cells of NTs and NT→Ts generally exhibited lighter staining compared with T→NTs and Ts (Fig. 4). Although these differences were qualitatively consistent, they are difficult to quantify.
Fig. 4.

Photomicrographs of neurons in the preoptic area of H. burtoni of four different social categories, stained to reveal presence of somatostatin. Five days after social change was induced, brains were dissected and immunolabeled (see Materials and Methods). Note that NT and NT→T males have smaller somatostatin-immunoreactive somata than do T and T→NT animals. Scale bar, 10 μm.
Fig. 5.
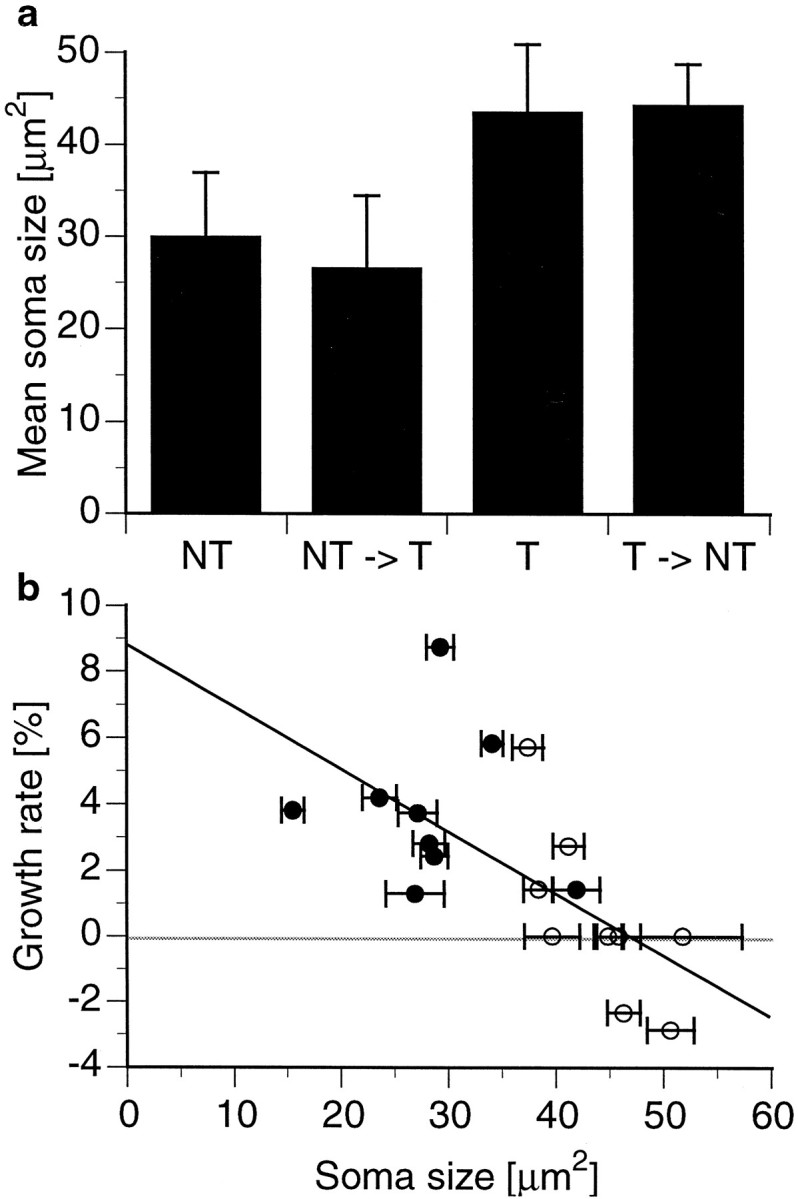
Relationship among social status, somatostatin cell size, and growth rate. a, Somatostatin-immunoreactive neuronal soma size (mean ± SE) shown for each of the four social categories. Cross-sectional soma areas (n ≥ 50 cells for each individual) differ significantly depending on social status (ANOVA;F(3,14) = 8.7834; p < 0.002). NT (n = 5) and NT→T (n = 4) males have smaller soma sizes than do T→NT (n = 6) fish (p< 0.05 and p < 0.01, respectively; Tukey–Kramerpost hoc comparisons). Soma sizes of NTs and NT→Ts are also different from those in Ts (n = 3) (p < 0.05 for both comparisons).b, Growth rates plotted as a function of the somatostatin-IR soma size. NTs and NT→Ts males (filled circles) have smaller soma cross-sectional areas and grow faster than Ts and T→NTs (open circles). Data are fitted (dark line) with y = 0.19 *x + 8.95 using linear regression analysis (regression ANOVA; F(1,16) = 11.4133;r2 = 0.42; p< 0.001).
DISCUSSION
The goal of these experiments was to discover the neuroendocrine mechanisms responsible for differential growth rates after changes in social status. How is growth rate modified in males that change social status? Animals must recognize a change in reproductive opportunity, change social status, and adjust their physiological and neural state appropriately. The differential regulation of somatostatin release is a likely mechanism for this control, because this neurohormone is known to inhibit the release of GH from the pituitary (Brazeau et al., 1973). Our findings suggest that, if somatostatin cell size is correlated with its release, either positively or negatively, the levels of GH may change appropriately to allow the observed changes in growth.
We do not yet know how social status regulates somatostatin expression and release into the pituitary. Fox et al. (1997) recently showed in this species that socially descending fish (T→NT) consistently exhibited high levels of cortisol. This change in cortisol level may be part of an endocrine mechanism for growth control because glucocorticoids are known to inhibit somatic growth (humans: Blodgett et al., 1956; rats: Loeb, 1976; Mosier et al., 1976; teleosts:Pickering, 1990). In a closely related tilapia species,Oreochromis mossambicus, chronic administration of cortisol leads to a reduction in body weight and reproductive indicators, such as gamete size and levels of sex steroids (Foo and Lam, 1993). However, the interactions between somatostatin, GH, and cortisol are notoriously complex (for review, see Thakore and Dinan, 1994; van Weerd and Komen, 1998), so there may be additional factors involved in the socially mediated growth regulation of H. burtoni.
Our discovery that growth rates are inversely correlated with somatostatin neuron size suggests that, at least in descending animals with high levels of cortisol (Fox et al., 1997), social signals mediate cell size via a cortisol-mediated pathway. In addition, because Ts spend less time feeding (Fernald and Hirata, 1977a; Munthali, 1996), they may be comparable with fasting fish in which growth hormone levels are increased despite a reduction in growth (Sumpter et al., 1991). Interestingly, measurements of circulating GH in H. burtonisuggest that GH levels may indeed be increased in Ts and T→NTs (Hofmann et al., 1999b). Although it is not completely clear what role somatostatin plays in fasting fish (Holloway et al., 1994), one possibility is that, in this state, somatostatin release is inhibited, possibly resulting in peptide accumulation in the cells.
Whether larger somatostatin-IR neurons reflect increased accumulation or production is unknown. Interestingly, in rodents, hypothalamic somatostatin expression and peptide content are sexually dimorphic and dependent on gonadal steroids (Murray et al., 1999; Nurhidayat et al., 1999). These differences are inversely correlated to secretory capacity (Murray et al., 1999). Several factors are known to affect hypothalamic somatostatin secretion. In vitro experiments in rats showed that the food intake-controlling hormone leptin (Quintela et al., 1997a), transforming growth factor-β (Quintela et al., 1997b), and the inhibitory transmitter GABA in concert with estrogen (Arancibia et al., 1997) each inhibit somatostatin secretion. In addition, somatostatin can inhibit its own release via a negative autofeedback (Aguila, 1998). In rainbow trouts, the sex steroid estradiol decreases plasma somatostatin levels and makes pituitary somatotrophs less sensitive to somatostatin-mediated GH inhibition (Holloway et al., 1997). Somatostatin secretion is stimulated by NMDA and l-glutamate (Joanny et al., 1997) and nitric oxide (Aguila, 1994). Together, there are clearly numerous possible regulatory factors associated with the control of somatostatin neuron size in H. burtoni.
When social opportunities change, animals must exhibit quick behavioral and physiological responses. For example, defeated H. burtoni males slow their growth but maintain their reproductive capabilities as long as possible (Nguyen et al., in preparation). In our study, such descending males still exhibited T-size gonads 5 d after the loss of their territory. Later, they show what might be called “environmental optimism” by allocating resources again toward growth. When they finally become territorial again, their gonads mature extremely rapidly. However, the broader question of how social information is transduced into cellular and physiological changes remains a mystery. Socially induced responses that occur only under pathological conditions, such as psychosocial dwarfism in humans (Sänger et al., 1977; Green et al., 1984), may reflect adaptive mechanisms that evolved under less severe circumstances, such as changes in social status exhibited by H. burtoni. Because the social environment clearly regulates many aspects of physiology in humans and other animals, understanding the mechanisms responsible may allow us to understand the evolution and control of this important feature of social interactions.
Footnotes
This work was supported by a postdoctoral fellowship from the Deutsche Forschungsgemeinschaft (H.A.H.) and National Institutes of Health Grant NS 34950 (R.D.F.). We thank A. Ettinger, A. Greenwood, R. Henderson, K. Hoke, W. Loher, R. Robison, and C. Zygar for comments on earlier versions of this manuscript, and E. Bennett and S. Stonington for the help with some of the experiments.
Correspondence should be addressed to Hans A. Hofmann, Neuroscience Program, Stanford University, Jordan Hall, Building 420, Stanford, CA 94305. E-mail: hans@psych.stanford.edu.
REFERENCES
- 1.Aguila MC. Growth hormone-releasing factor increases somatostatin release and mRNA levels in the rat periventricular nucleus via nitric oxide by activation of guanylate cyclase. Proc Natl Acad Sci USA. 1994;91:782–786. doi: 10.1073/pnas.91.2.782. [DOI] [PMC free article] [PubMed] [Google Scholar]
- 2.Aguila MC. Somatostatin decreases somatostatin messenger ribonucleic acid levels in the rat periventricular nucleus. Peptides. 1998;19:1573–1579. doi: 10.1016/s0196-9781(98)00109-0. [DOI] [PubMed] [Google Scholar]
- 3.Arancibia S, Estupina C, Pesco J, Belmar J, Tapia-Arancibia L. Responsiveness to depolarization of hypothalamic neurons secreting somatostatin under stress and estrous cycle conditions: involvement of GABAergic and steroidal interactions. J Neurosci Res. 1997;50:575–584. doi: 10.1002/(SICI)1097-4547(19971115)50:4<575::AID-JNR8>3.0.CO;2-B. [DOI] [PubMed] [Google Scholar]
- 4.Batten TFC, Cambre ML, Moons L, Vandesande F. Comparative distribution of neuropeptide-immunoreactive systems in the brain of the green molly, Poecilia latipinna. J Comp Neurol. 1990;302:893–919. doi: 10.1002/cne.903020416. [DOI] [PubMed] [Google Scholar]
- 5.Blodgett FM, Burgin L, Iezzoni D, Grobetz D, Talbot ND. Effects of prolonged cortisone therapy on the statural growth, skeletal maturation and metabolic status of children. N Engl J Med. 1956;254:636–641. doi: 10.1056/NEJM195604052541402. [DOI] [PubMed] [Google Scholar]
- 6.Brazeau P, Vale W, Burgus R, Ling N, Butcher M, Rivier J, Guillemin R. Hypothalamic polypeptide that inhibits the secretion of immunoreactive pituitary growth hormone. Science. 1973;179:77–79. doi: 10.1126/science.179.4068.77. [DOI] [PubMed] [Google Scholar]
- 7.Fernald RD. Quantitative observations of Haplochromis burtoni under semi-natural conditions. Anim Behav. 1977;25:643–653. [Google Scholar]
- 8.Fernald RD, Hirata NR. Field study of Haplochromis burtoni: quantitative behavioural observations. Anim Behav. 1977a;25:964–975. [Google Scholar]
- 9.Fernald RD, Hirata NR. Field study of Haplochromis burtoni: habitats and co-habitants. Environ Biol Fishes. 1977b;2:299–308. [Google Scholar]
- 10.Foo JTW, Lam TJ. Retardation of ovarian growth and depression of serum steroid levels in the tilapia Oreochromis mossambicus by cortisol implantation. Aquaculture. 1993;115:133–143. [Google Scholar]
- 11.Fox HE, White SA, Kao MHF, Fernald RD. Stress and dominance in a social fish. J Neurosci. 1997;17:6463–6469. doi: 10.1523/JNEUROSCI.17-16-06463.1997. [DOI] [PMC free article] [PubMed] [Google Scholar]
- 12.Francis RC, Soma K, Fernald RD. Social regulation of the brain-pituitary-gonadal axis. Proc Natl Acad Sci USA. 1993;90:7794–7798. doi: 10.1073/pnas.90.16.7794. [DOI] [PMC free article] [PubMed] [Google Scholar]
- 13.Grau EG, Nishioka RS, Young G, Bern HA. Somatostatin-like immunoreactivity in the pituitary and brain of three teleost fish species: somatostatin as a potential regulator of prolactin cell function. Gen Comp Endocrinol. 1985;59:350–357. doi: 10.1016/0016-6480(85)90391-0. [DOI] [PubMed] [Google Scholar]
- 14.Green WH, Campbell M, David R. Psychosocial dwarfism: a critical review of the evidence. J Am Acad Child Psychiatry. 1984;23:39–48. doi: 10.1097/00004583-198401000-00006. [DOI] [PubMed] [Google Scholar]
- 15.Hofmann HA, Benson ME, Fernald RD. Social status regulates growth rate: consequences for life-history strategies. Proc Natl Acad Sci USA. 1999a;96:14171–14176. doi: 10.1073/pnas.96.24.14171. [DOI] [PMC free article] [PubMed] [Google Scholar]
- 16.Hofmann HA, Le Bail PY, Fernald RD. Social control of growth and growth hormone levels in African cichlid fish. Soc Neurosci Abstr. 1999b;25:866. [Google Scholar]
- 17.Holloway AC, Reddy PK, Sheridan MA, Leatherland JF. Diurnal rhythms of plasma growth hormone, somatostatin, thyroid hormones, cortisol and glucose concentrations in rainbow trout, Oncorhynchus mykiss, during progressive food deprivation. Biol Rhythm Res. 1994;25:415–432. [Google Scholar]
- 18.Holloway AC, Sheridan MA, Leatherland JF. Estradiol inhibits plasma somatostatin 14 (SRIF-14) levels and inhibits the response of somatotrophic cells to SRIF-14 challenge in vitro in rainbow trout, Oncorhynchus mykiss. Gen Comp Endocrinol. 1997;106:407–414. doi: 10.1006/gcen.1997.6881. [DOI] [PubMed] [Google Scholar]
- 19.Joanny P, Steinberg J, Oliver C, Grino M. Effect of excitatory amino acids on rat hypothalamic somatostatin secretion in vitro. Peptides. 1997;18:1039–1043. doi: 10.1016/s0196-9781(97)00033-8. [DOI] [PubMed] [Google Scholar]
- 20.Loeb JN. Corticosteroids and growth. N Engl J Med. 1976;295:547–552. doi: 10.1056/NEJM197609022951007. [DOI] [PubMed] [Google Scholar]
- 21.Lott DF. Intraspecific variation in the social systems of wild vertebrates. Cambridge Studies in Behavioural Biology. Cambridge UP; Cambridge, UK: 1982. [Google Scholar]
- 22.Margolis-Nunno H, Schreibman MP, Halpern-Seibold L. Sexually dimorphic age-related differences in the immunocytochemical distribution of somatostatin in the platyfish. Mech Ageing Dev. 1987;41:139–148. doi: 10.1016/0047-6374(87)90058-3. [DOI] [PubMed] [Google Scholar]
- 23.Melamed P, Gur G, Rosenfeld H, Elizur A, Yaron Z. Possible interactions between gonadotrophs and somatotrophs in the pituitary of tilapia: apparent roles for insulin-like growth facto I and estradiol. Endocrinology. 1999;140:1183–1191. doi: 10.1210/endo.140.3.6571. [DOI] [PubMed] [Google Scholar]
- 24.Metcalfe NB, Huntingford FA, Graham WD, Thorpe JE. Early social status and the development of life-history strategies in Atlantic salmon. Proc R Soc Lond B Biol Sci. 1989;236:7–19. doi: 10.1098/rspb.1989.0009. [DOI] [PubMed] [Google Scholar]
- 25.Mosier HD, Jr, Jansons RA, Hill RR, Dearden LC. Cartilage sulfation and serum somatomedin in rats during and after cortisone-induced growth arrest. Endocrinology. 1976;99:580–589. doi: 10.1210/endo-99-2-580. [DOI] [PubMed] [Google Scholar]
- 26.Munthali SM. Territoriality and nutritional condition in Cynotilapia afra (Günther) and Pseudotropheus zebra (Boulenger), Cichlidae, in Lake Malawi National Park, Malawi. J Appl Ichthyol. 1996;12:131–134. [Google Scholar]
- 27.Murray HE, Simonian SX, Herbison AE, Gillies GE. Correlation of hypothalamic somatostatin mRNA expression and peptide content with secretion: sexual dimorphism and differential regulation by gonadal factors. J Neuroendocrinol. 1999;11:27–33. doi: 10.1046/j.1365-2826.1999.00286.x. [DOI] [PubMed] [Google Scholar]
- 28.Nurhidayat, Tsukamoto Y, Sigit K, Sasaki F. Sex differentiation of growth hormone-releasing hormone and somatostatin neurons in the mouse hypothalamus: an immunohistochemical and morphological study. Brain Res. 1999;821:309–321. doi: 10.1016/s0006-8993(99)01081-1. [DOI] [PubMed] [Google Scholar]
- 29.Palkovits M. Neuropeptides in the brain. In: Martini L, Ganong WF, editors. Frontiers in neuroendocrinology, Vol 10. Raven; New York: 1988. pp. 1–44. [Google Scholar]
- 30.Peter RE, Yu KL, Marchant TA, Rosenblum PM. Direct neural regulation of the teleost adenohypophysis. J Exp Zool. 1990;4:84–89. [Google Scholar]
- 31.Pickering AD. Stress and the suppression of somatic growth in teleost fish. In: Epple A, Scanes CG, Stetson MH, editors. Progress in clinical and biological research, Vol 342, Progress in comparative endocrinology. Wiley-Liss; New York: 1990. pp. 473–479. [PubMed] [Google Scholar]
- 32.Quintela M, Senaris R, Dieguez C. Transforming growth factor-betas inhibit somatostatin messenger ribonucleic acid levels and somatostatin secretion in hypothalamic cell culture. Endocrinology. 1997a;138:4401–4409. doi: 10.1210/endo.138.10.5467. [DOI] [PubMed] [Google Scholar]
- 33.Quintela M, Senaris R, Heiman ML, Casanueva FF, Dieguez C. Leptin inhibits in vitro hypothalamic somatostatin secretion and somatostatin mRNA levels. Endocrinology. 1997b;138:5641–5644. doi: 10.1210/endo.138.12.5713. [DOI] [PubMed] [Google Scholar]
- 34.Sänger P, Levine LS, Wiedemann E, Schwartz E, Korth-Schutz S, Pareira J, Heinig B, New MI. Somatomedin and growth hormone in psychosocial dwarfism. Pädiatr Pädol Suppl. 1977;5:1–12. doi: 10.1007/978-3-7091-8491-2_1. [DOI] [PubMed] [Google Scholar]
- 35.Stroh T, Zupanc KH. The postembryonic development of somatostatin immunoreactivity in the central posterior/prepacemaker nucleus of weakly electric fish, Apteronotus lepthorhynchus: a double-labeling study. Dev Brain Res. 1996;93:76–87. doi: 10.1016/0165-3806(96)00003-x. [DOI] [PubMed] [Google Scholar]
- 36.Sumpter JP, Le Bail PY, Pickering AD, Pottinger TG, Carragher JF. The effect of starvation on growth and plasma growth hormone concentrations of rainbow trout, Oncorhynchus mykiss. Gen Comp Endocrinol. 1991;83:94–102. doi: 10.1016/0016-6480(91)90109-j. [DOI] [PubMed] [Google Scholar]
- 37.Thakore JH, Dinan TG. Growth hormone secretion: the role of glucocorticoids. Life Sci. 1994;55:1083–1099. doi: 10.1016/0024-3205(94)00237-1. [DOI] [PubMed] [Google Scholar]
- 38.Vallarino M, Trabucchi M, Masini MA, Chartrel N, Vaudry H. Immunocytochemical localization of somatostatin and autoradiographic distribution of somatostatin binding sites in the brain of the African lungfish, Protopterus annectens. J Comp Neurol. 1997;388:337–353. doi: 10.1002/(sici)1096-9861(19971124)388:3<337::aid-cne1>3.0.co;2-1. [DOI] [PubMed] [Google Scholar]
- 39.van Weerd JH, Komen J. The effects of chronic stress on growth in fish: a critical appraisal. Comp Biochem Physiol. 1998;120:107–112. [Google Scholar]
- 40.Warner RR. The use of phenotypic plasticity in coral reef fishes as tests of theory in evolutionary biology. in: The ecology of fishes on coral reefs (Sale PF, ed), pp 387–398. Academic; San Diego: 1991. [Google Scholar]
- 41.White SA, Fernald RD. Gonadotropin-releasing hormone-containing neurons change size with reproductive state in female Haplochromis burtoni. J Neurosci. 1993;13:434–441. doi: 10.1523/JNEUROSCI.13-02-00434.1993. [DOI] [PMC free article] [PubMed] [Google Scholar]
- 42.Williams GC. Adaptation and natural selection. Princeton UP; Princeton: 1966. [Google Scholar]