

Abstract
Neuronal–glial interactions play an important role in information processing in the CNS. Previous studies have indicated that electrotonic coupling between locus ceruleus (LC) neurons is involved in synchronizing the spontaneous activity. The results of the present study extend the functional electrotonic coupling to interactions between neurons and glia. Spontaneous oscillations in the membrane potential were observed in a subset of glia. These oscillations were synchronous with the firing of neurons, insensitive to transmitter receptor antagonists and disrupted by carbenoxolone, a gap junction blocker. Hyperpolarization of neurons with [Met]5enkephalin blocked the oscillations in glia. Selective depolarization of glia with a glutamate transporter substrate (l-α-aminoadipic acid) increased the neuronal firing rate, suggesting that changes in the membrane potential of glia can modulate neuronal excitability through heterocellular coupling. Dye-coupling experiments further confirmed that small molecules could be transferred through gap junctions between these distinct cell types. No dye transfer was observed between neurons and oligodendrocytes or between astrocytes and oligodendrocytes, suggesting that the junctional communication was specific for astrocytes and neurons. Finally, immunoelectron microscopy studies established that connexins, the proteins that form gap junctions, were present on portions of the plasmalemma, bridging the cytoplasm of neurons and glia in LC. This heterocellular coupling extends the mechanisms by which glia participate in the network properties of the LC in which the degree of coupling is thought to influence cognitive performance.
Keywords: electrotonic coupling, gap junction, neuronal–glial interactions, membrane potential oscillations, noradrenergic neurons, connexins
Neuronal–glial interactions typically require chemical signaling through the extracellular space (Parpura et al., 1994; Coles and Abbott, 1996; Theodosis and MacVicar, 1996; Bezzi et al., 1998). For example, exogenous application or synaptically released neurotransmitters activate receptors on glia to affect their membrane potential, evoke second messenger signals, and induce calcium waves (Dani et al., 1992; Duffy and MacVicar, 1995;Verkhratsky and Kettenmann, 1996; Chen et al., 1997; Pasti et al., 1997). In turn, glia remove neurotransmitters from the extracellular space and maintain proper ionic balance (Jendelova and Sykova, 1991;Bergles et al., 1999). Moreover, glutamate released from glia has been shown to modulate evoked and spontaneous synaptic transmission in neurons (Araque et al., 1998). Together, these bidirectional interactions mediate neuronal–glial communication and indicate that glia play an active role in influencing neuronal activity.
Direct coupling through gap junctions has been suggested previously to mediate communication between neurons and glia. In cultures from embryonic brain, stimulation of calcium waves in astrocytes was shown to induce propagated waves in neurons (Nedergaard, 1994). Heterocellular electrotonic coupling was the proposed mechanism (but see Parpura et al., 1994); however, electrical coupling was not tested and dye transfer was not observed. A recent report has now demonstrated that, in embryonic neuronal cultures, neurons were coupled to astrocytes but that coupling declined progressively with maturation and was rarely detectable in cultures from postnatal neurons (Froes et al., 1999).
The purpose of the present study was to test the hypothesis that heterocellular coupling exists in brain slices taken from postnatal animals. The combination of immunoelectron microscopy and electrophysiology was used to evaluate neuronal–glial interactions and its functional consequences in the noradrenergic brain nucleus locus ceruleus (LC). Electrotonic coupling between neurons in the LC is known to regulate neuronal activity (Christie et al., 1989; Christie and Jelinek, 1993). In the present report, neurons and glia were found to be coupled as demonstrated by the presence of gap junction proteins and both electrical and dye transfer between the two cell types. Moreover, activation of glutamate transporters selectively depolarized glia and indirectly increased neuronal excitability.
MATERIALS AND METHODS
Electrophysiology
Horizontal brainstem slices (250 μm) containing the LC were prepared from 4- to 10-d-old Sprague Dawley rats (Charles River, Wilmington, MA) as described previously (Eghbali et al., 1990). Whole-cell recordings were made using Nomarski optics and infrared visualization that allowed morphological discrimination of different cell types (Fig. 1A). Slices were perfused with artificial CSF (ACSF) containing (in mm):126 NaCl, 2.5 KCl, 2.4 CaCl2, 1.2 MgCl2, 1.2 NaH2PO4, 21.4 NaHCO3, and 11.1 glucose, equilibrated with 95%O2–5%CO2 at 34°C. Tetrodotoxin (1 μm) and 500 μmBaCl2 were added to ACSF during the recordings. Local application of glutamate was conducted by pressure ejection of a saline solution (140 mm NaCl and 10 mm HEPES) containing glutamate (1 mm). The pipettes used had a resistance of 1–2 MΩ, the duration of the pulses was 100 msec, and the pressure applied was 4 psi. In some experiments, sodium was replaced with lithium in the ACSF in the same concentration, 126 mm. 1,2,3,4-Tetrahydro-6-nitro-2,3-dioxo-benzo[f]quinoxaline-7-silfonamide (NBQX) and α-amino-4-carboxy-α-methyl-phenylacetic acid (MCPG) were obtained from Tocris Cookson (Ballwin, MO), picrotoxin, l-aminoadipic acid (l-AA), and carbenoxolone were from Sigma (St. Louis, MO), and 5-methyl-10,11-dihydro-5H-debenzo[a,d]cyclohepten-5,10-imine hydrogen meleate (MK-801) and 1-(4-aminophenyl)-4-methyl-7,8-methylenedioxy-5H-2,3-benzodiazepine (GYKI 52466) were from Research Biochemicals (Natick, MA). Pipettes (2–3 MΩ) were filled with internal solution containing (in mm): 115 MES(2-[morpholino]ethane-sulfonic acid) potassium salt, 20 KCl, 1.5 MgCl2, 1 BAPTA, 5 HEPES, 4 Mg-ATP, and 0.4 Na-GTP, pH 7.3. Recordings were made with an Axoclamp-2A amplifier (Axon Instruments, Foster City, CA) in current-clamp mode, and data were acquired at 100 Hz with Chart software, version 3.5 (MacLab System; ADInstruments, Castle Hill, Australia).
Fig. 1.

Rhythmic oscillations in membrane potential of neurons and glia in the LC. A, High-power view of the LC in a brainstem slice from 1-week-old rat using infrared illumination. The differences in size and morphology between LC neurons and glia allowed selective recordings from each cell type. Scale bar, 20 μm.B, Left, Representative recordings from a neuron and a glial cell made in the presence of tetrodotoxin (1 μm) and BaCl2 (500 μm).Right, Power spectrum analyses of the membrane potential. For the glia, the peak was 0.58 Hz; for the neuron, the peak was 0.51 Hz.
Experiments using acutely isolated LC neurons were done as described previously (Ingram et al., 1997). Drug administration was performed with a fast flow exchange consisting of a series of tubes driven by a piezoelectric device.
Immunocytochemistry
Rat pups were anesthetized with sodium pentobarbital and transcardially perfused through the ascending aorta with 10 ml of 1000 U/ml heparinized saline, 50 ml of 3.75% acrolein in 2% paraformaldehyde, and 100 ml of 2% paraformaldehyde in 0.1m phosphate buffer (PB) at a pH of 7.4. A pre-embedding double-labeling method was used (Chan et al., 1990). Tissue sections were post-fixed for 1 hr in 2% osmium tetroxide in 0.1 mPB, washed for 10 min in PB, dehydrated through a graded series of ethanols and propylene oxide, and then transferred to a 1:1 mixture of propylene oxide and Epon 812 overnight. Sections were then incubated in Epon 812 for 2 hr and flat embedded in Epon between plastic sheets for 12–18 hr at 60°C. Small pieces of tissue were sampled from the LC and re-embedded in Beem capsules. The avidin-biotin peroxidase technique was visualized using 3′-3′ diaminobenzidine as a chromogen and was used to identify connexin (Cx) proteins, tyrosine hydroxylase (TH), or glial fibrillary acidic protein (GFAP). Immunogold-silver labeling (Chan et al., 1990) was combined with immunoperoxidase to simultaneously localize two antigens. Gold-silver labeling of the Cx proteins was conducted to confirm the peroxidase localization because peroxidase markers are known to have a tendency to diffuse within the tissue. It should be noted, however, that minimum peroxidase diffusion was observed here. Sections of horizontal brain processed after primary antibody omission served as controls. Alternate horizontal sections were processed for all experiments in which the markers were reversed to confirm immunolabeling results with each technical approach.
Specificity of antisera. Two antibodies directed against Cx32 [a mouse monoclonal 2C2 from Zymed (San Francisco, CA) and MAB3069 from Chemicon, (Temecula, CA)] were tested for specificity in rat liver and positively identified gap junctions as described by others (Paul, 1986; Dermietzel et al., 1990). Both antibodies are raised against the cytoplasmic loop of rodent Cx32, and the monoclonal 2C2 antibody labeling was shown to have a comparable distribution with that seen with other noncommercially available antibodies (Li et al., 1997). The antibodies directed against Cx26 and Cx43 were also obtained from Zymed. A rabbit polyclonal antibody raised against TH (Protos Biotech, New York, NY) or a mouse monoclonal antibody directed against TH (Incstar, Stillwater, MN) was used to recognize noradrenergic neurons of the LC. Specificity of these antibodies has been confirmed (Van Bockstaele et al., 1995). A rabbit polyclonal antibody directed against GFAP was obtained from Incstar.
Quantification of immunoreactivity. Sections for ultrastructural analysis included the LC cell body region and LC dendritic zone. Quantitative evaluation of immunoreactive elements was applied only to the outer 1–3 μm of the Epon–tissue interface at which penetration of antisera is maximal. Examination of serial sections was used to determine specificity of immunogold labeling. The classification of identified cellular elements in the electron micrographs was as described by Peters et al. (1991). All profiles identified within randomly selected electron micrographs were tabulated with respect to immunoreactive versus nonimmunoreactive cellular profiles. These profiles were tallied for every 3500 μm2 of sampled area, and the data were expressed as percent values of relative frequency occurrence of a specific type of profile per unit area.
Dye-coupling experiments
A single glial cell was patched and filled with neurobiotin (0.2%; Vector Laboratories, Burlingame, CA) per slice. To reduce the background staining produced by neurobiotin being ejected from the pipette tip while approaching the cell under positive pressure, unconjugated streptavidin (0.1%; Jackson ImmunoResearch, West Grove, PA) was perfused in the bath. Immediately after the seal between the pipette and the cell was made, normal ACSF perfusion was restored. Recordings were made for 10–20 min, and then the slice was immediately fixed in Lana's solution (paraformaldehyde 4% and picric acid 14% in PBS, pH 6.9) overnight at 4°C. Tissue was washed in PBS, incubated for 24–48 hr with 1:3000 dilution Cy5-conjugated streptavidin (Jackson ImmunoResearch) in PBS–0.3%Triton X-100, at 4°C. Slices were thoroughly washed in PBS and mounted. For the triple-labeling experiments, the fixative solution was washed from the slices, and they were incubated with a mixture of antibodies against neuronal- and astrocytic-specific markers and Cy5-streptavidin for 48 hr at 4°C. The cocktail contained mouse anti-S100β (1:2000; Sigma), rabbit anti-TH (1:2000; Protos Biotech), and Cy-5-conjugated streptavidin 1:3000 in 0.1 m PB, pH 7.4, with 0.1% BSA and 0.3% Triton X-100. Slices were washed four times in 0.1 mPBS for 30 min and then incubated for 24 hr at 4°C with the secondary antibodies containing FITC-conjugated donkey anti-mouse (1:200) and Rhodamine Red-X-conjugated donkey anti-rabbit (1:200) (both from Jackson ImmunoResearch) in 0.1 m PBS. Slices were washed in 0.1 m PBS four times and mounted with Slow Fade (Molecular Probes, Eugene, OR). A series of images was taken with a confocal microscope [z-series; Bio-Rad, Hercules, CA and Nikon, Tokyo, Japan; and a Bio-Rad MCR10242P and an Olympus Optical (Tokyo, Japan) 1X70], and they were combined to reconstruct stained cells through the extent of the slice.
RESULTS
Neurons and glia are electrically coupled in the LC
It is known from previous studies that LC neurons are spontaneously active and fire action potentials in synchrony (Christie et al., 1989). This latter property was attributed to electrotonic coupling between LC neurons, which has been demonstrated by current and dye transfer between LC neurons (Christie et al., 1989; Christie and Jelinek, 1993). As a consequence of both electrotonic coupling and spontaneous activity, synchronous firing and rhythmic oscillations in the membrane potential were always present in slices from neonatal animals. The subthreshold rhythmic oscillations in the membrane potential have been used as a measure of electrotonic coupling in the LC (Christie et al., 1989; Ishimatsu and Williams, 1996).
Recordings from glial cells in brainstem slices from 1-week-old rats showed that the membrane potential of 27 of 52 (52%) cells exhibited rhythmic changes in membrane potential that were similar in frequency to neuronal oscillations (mean frequency in glia, 0.51 ± 0.04 Hz,n = 27; in neurons, 0.47 ± 0.05 Hz,n = 22) (Fig. 1). The mean amplitude of the oscillations observed in glia was 0.36 ± 0.03 mV (n = 27), 4–5% of the amplitude of the oscillations in neurons (7.8 ± 0.6 mV, n = 22). No oscillations were observed in small non-noradrenergic neurons found in close proximity to the cell body region of the LC. The oscillations in membrane potential recorded in glia suggested that these cells were electrically coupled to neurons and that they might participate in the LC network.
Glial cells were initially distinguished from neurons by their relative smaller size (∼10 μm diameter compared with 30–40 μm diameter for neurons). Once the patches were made, depolarizing current pulses were applied to confirm the absence of action potentials. In most cells, the membrane potential responded linearly to the current injection (n = 14 of 20) with some cells displaying inward rectification when depolarized beyond 0 mV. The average input resistance (Rin) was 46.7 ± 5.9 MΩ, and −82.8 ± 1.2 mV was the average resting membrane potential. Increasing the extracellular potassium concentration from 2.5 to 15 mm shifted the membrane potential to −46 ± 1 mV, without significant change inRin (43.5 ± 12 MΩ). This depolarization (35 mV) is in reasonable agreement with the value predicted by the Nernst equation for a potassium-selective dependence of the membrane potential (∼ 47 mV). A second group of glial cells displayed complex I–V curves and higherRin (147 ± 28 MΩ). A previous study on astrocytes from hippocampal slices described three similar subpopulations distinguished by electrophysiological properties, localization, and coupling properties (D'Ambrosio et al., 1998). Although the group of glial cells with lower resistance (presumed astrocytes) seemed to have oscillations in the membrane potential, correlation between electrophysiological properties and the occurrence of oscillations was equivocal.
Calculations based on the Rin of astrocytes and neurons (∼200 MΩ) established that 15 pA would produce a change in membrane potential that was similar to the oscillations in each cell type. This current was used to estimate the number of gap junction channels between neurons and glia. The driving force for the current transfer was calculated as the amplitude of the afterhyperpolarization after the action potential (∼ 20 mV) because this slow potential change is less sensitive to resistance capacitance filtering imposed by the neuronal–glial network. The conductance required to cause the observed change in membrane potential during a single oscillation was calculated to be ∼750 pS. By assuming the unitary conductance of gap junctional channels to be 120–150 pS (Eghbali et al., 1990), it was predicted that five to six gap junction channels would be present on each electrotonically coupled neuron and glia.
The rhythmic oscillations in glia persisted after perfusion of glutamate receptor antagonists (10 μm NBQX, 10 μm MK-801, and 1 mm MCPG), the GABA receptor antagonist bicuculline (10 μm), and tetrodotoxin (1 μm; n = 3; data not shown). Thus, glial oscillations were independent of synaptic activity as similarly described for LC neurons (Christie et al., 1989; Ishimatsu and Williams, 1996). Changes in extracellular K+ concentration are known to occur during neuronal activity and could change the membrane potential of glia (Orkand et al., 1966). By increasing the K+ concentration in the extracellular solution from 2.5 to 10 mm, only a slight reduction (10–15%) of the amplitude of the afterhyperpolarization was observed in neurons, without any clear effect on the firing frequency. In addition, neither the amplitude nor the frequency of the oscillations in glia were significantly affected by increasing the extracellular concentration, suggesting that oscillations in glia are not attributable to fluctuations of extracellular potassium concentration (control amplitude of 1.25 mV, control frequency of 0.4 Hz; in 10 mm KCl, amplitude of 1.76 mV, frequency of 0.3 Hz).
Two additional experiments were conducted to identify the source of oscillations in glia. First, [Met]5enkephalin (ME) (10 μm), an opioid agonist that hyperpolarizes neurons, abolished oscillations in both neurons and glia (Fig.2A). There was no clear effect of ME on glial membrane potential. This result suggested that the spontaneous activity of neurons was required to observe oscillations in the membrane potential of glia. Second, disruption of the coupling with carbenoxolone, a glycyrrhetinic acid analog that blocks gap junctional communication (Ishimatsu and Williams, 1996;Vaney et al., 1998), abolished the oscillations in both glia and neurons (Fig. 2B). Carbenoxolone did not block spontaneous neuronal action potentials but did desynchronize firing of LC (see also Travagli et al., 1995). This result further suggested that it is not the spontaneous firing but the synchronous firing of LC neurons that drives the rhythmic oscillations in glia.
Fig. 2.

Oscillations in glia depend on synchronized neuronal activity. A, Left, ME, a μ-opioid receptor agonist, hyperpolarizes the membrane potential of LC neurons and reversibly inhibits the subthreshold oscillations (n = 10). Right, ME reversibly abolishes membrane potential oscillations in glia (n = 6). Note that ME did not induce a change in the resting membrane potential of glia. B, Carbenoxolone (100 μm) disrupted oscillations in both glial and neuronal membrane potential. The effect of carbenoxolone reversed within 30 min of washout. All recordings were made in the presence of tetrodotoxin (1 μm) and BaCl2 (500 μm).
If the oscillations recorded from glia were a consequence of electrotonic coupling to neurons, then the oscillations should be synchronous in both cells. In paired recordings from neurons and glia, both the depolarizing and the hyperpolarizing phase of the oscillations in glia strongly correlated with the changes in neuronal membrane potential (cross-correlation, mean peak of 0.30 ± 0.05, mean phase shift of 11 ± 0.4 msec, n = 6) (Fig.3A). Moreover, oscillations in glia were observed in 6 of 10 neuronal–glial pairs and always in preparations in which oscillations in neurons were also recorded. As it has been shown previously (Christie et al., 1989), the subthreshold oscillations in LC neurons were also synchronized throughout the nucleus (cross correlation, mean peak of 0.86 ± 0.03, mean phase shift of 7.3 ± 1.9 msec, n = 11) (Fig.3B). Thus, paired recordings showed that the membrane potential of both LC neurons and LC glia oscillate rhythmically and synchronously.
Fig. 3.

Synchronized oscillations in neurons and glia.A, Left, A paired whole-cell recording shows that glial oscillations are synchronous with neuronal activity.Right, Cross-correlogram: peak of 0.29, phase shift of 10 msec. B, Left, A paired whole-cell recording from two LC neurons. Right, Cross-correlogram: peak of 0.94, phase shift of 10 msec.
Selective depolarization of glia increases neuronal excitability
To determine whether heterocellular coupling could have a functional effect on neurons, the effect of a glial-selective agent on neuronal excitability was examined. A glutamate analog that is a substrate for glutamate transporters, l-AA, has been used as a glial toxin (McBean, 1994). Superfusion with l-AA (1 mm) depolarized glial cells by 7–10 mV (Fig.4A). This depolarization persisted in the presence of the glutamate receptor antagonists NBQX and MK-801 but was completely blocked by substitution of sodium by lithium in the extracellular solution (Fig.4A). Local application of glutamate, by pressure ejection, also depolarized glial cells by a mechanism that was insensitive to glutamate receptor antagonists and was also blocked by replacing sodium with lithium in the extracellular solution. The sodium dependence and the resistance to glutamate receptor antagonists suggested that the depolarization of glia caused byl-AA was mediated by activation of electrogenic glutamate transporters.
Fig. 4.

Selective depolarization of glia increases neuronal firing. A, l-AA depolarized the membrane potential of glia through activation of glutamate transporters. Top trace, Recording from a glial cell in the presence of ionotropic glutamate receptor antagonists NBQX (5 μm) and MK-801 (5 μm). Bottom trace, In same cell, substitution of sodium for lithium in the extracellular solution completely blocks glial depolarization.B, The effect of l-AA on neuronal firing frequency. Right, Recordings from an LC neuron before (Control, top trace) and during (bottom trace) l-AA application in the presence of NBQX (5 μm) and MK-801 (5 μm).Left, Average change induced by l-AA on the firing frequency of LC neurons, expressed as percentage of the control firing rate. The mean firing frequency in control was 0.59 ± 0.21 Hz. Statistical differences were determined by the nonparametric Wilcoxon signed rank test. *p < 0.05 indicates significant difference.
When l-AA was tested in neurons, it caused a depolarization, an effect that was sensitive to glutamate receptor antagonists. Recordings made from acutely isolated LC neurons showed that l-AA induced an inward current that reversed polarity at 0 mV and was completely blocked by the ionotropic glutamate receptor antagonist NBQX (10 μm; n = 3; data not shown). When neurons in brain slices were tested withl-AA in the presence of glutamate receptor antagonists, it depolarized glial cells and increased the firing frequency by 60–90% (Fig. 4B). This increase of neuronal excitability was reversible upon washingl-AA, and it was present even in very high concentrations of receptor antagonists (Fig. 4B). Thus, activation of glutamate transporters selectively depolarized glial cells, and that depolarization increased the firing rate of neurons by a mechanism that was insensitive to glutamate receptor antagonists. This experiment suggests that the electrotonic coupling between neurons and glia can result in modulation of neuronal activity.
Locus ceruleus neurons and glia form a coupled network
Dye coupling
In experiments in which a single glial cell per slice was filled with neurobiotin, fluorescent localization of neurobiotin showed that, in 7 of 13 (54%) slices, neurons were also stained (Fig.5A,B). When a single neuron was filled, dye transfer to glia and/or other neurons was also observed, although less frequently (19%,n = 16). These results demonstrate that small molecules can be transferred between astrocytes and neurons through intercellular channels.
Fig. 5.

Dye coupling from glia to neurons.A, B, Representative pictures of dye transfer from glia to neurons in brain slices in which a single glial cell was filled with neurobiotin. LC neurons (large arrows) appeared stained together with several dozen smaller cells with astrocytic morphology (small arrows).C, Dye transfer between astrocytes was observed in all the slices in which an astrocyte was filled (n = 13). D, Oligodendrocytes were stained in 10 of 23 slices (43%) in which a single glial cell was filled. In all these cases, only the filled cell was stained. Scale bar, 20 μm.
In all the slices in which a single astrocyte was filled (13 of 23), several dozen astrocytes were also stained (Fig. 5C), making it impossible to distinguish the cell that was filled originally. In the other 10 slices, only a single cell was found and the morphology corresponded to oligodendroglia (Fig. 5D). This observation is in agreement with previous reports indicating low electrical coupling in oligodendrocytes (Kettenmann and Ransom, 1988). In addition, the proportion of glial cells that showed no dye coupling is similar to glial cells that did not have oscillations in the membrane potential (48%, see above). This suggests that a correlation between the degree of coupling and the morphology may exist.
Triple-labeling experiments confirmed the identity of the different cell types participating in the network. Slices were stained with antibodies against an astrocytic marker, S-100β (Fig.6, green), and TH to identify LC neurons (blue). The extent of diffusion of neurobiotin between cells is shown in red. In the experiment shown in Figure 6, a recording from a single glial cell was made. That cell had a linear I–V (Rin of 16.7 MΩ; resting membrane potential of −80 mV). When the extracellular potassium concentration was increased to 15 mm, the slope of the I–V curve was not significantly changed (13.8 MΩ), and the membrane potential was depolarized to −46 mV. Neurobiotin was found in tens of small cells (Fig. 6C), which colocalized with the green immunofluorescence of the astrocytic marker S-100β (Fig.6B, yellow). Two bigger cells were also stained with neurobiotin and colocalized TH (Fig. 6B,purple). Thus, in this slice, neurobiotin diffused between many astrocytes as well as neurons.
Fig. 6.
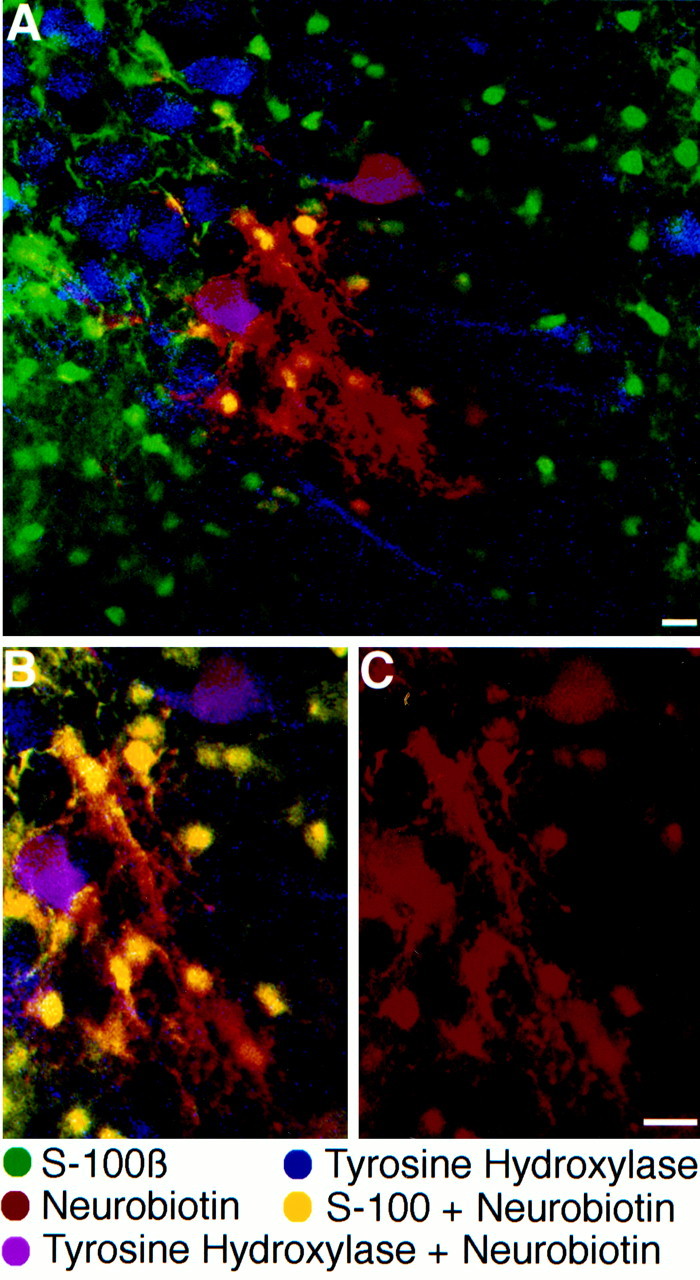
Cellular identity of dye-coupled cells in the LC.A, Triple staining with FITC-conjugated antibodies against the astrocytic marker S-100β (green), Rhodamine Red-X-conjugated antibodies against the neuronal marker tyrosine hydroxylase (blue), and Cy-5-conjugated streptavidin (red) to reveal neurobiotin localization.B, Higher magnification of the area surrounding the neurobiotin injection site. Multiple yellow cells indicate the colocalization of the astrocytic marker and neurobiotin. Two purple cells indicate colocalization of TH and neurobiotin. C shows the same field of view as inB with only the neurobiotin stain. Scale bar, 40 μm.
Presence of connexin immunoreactivity
Immunoelectron microscopy studies were conducted to further evaluate the anatomical substrate of gap junctional-mediated coupling between neurons and glia. Brainstem sections containing the LC of 1- to 3-week-old rats were processed for peroxidase labeling of connexins and combined with immunogold-silver identification of TH. Peroxidase labeling of Cx26 and Cx32 were identified at pairs of TH-immunoreactive dendritic processes (Fig. 7A). Similarly, when gold-silver labeling was used to identify Cx32 and immunoperoxidase was used to localize TH, connexin immunoreactivity was found along the plasmalemma of apposed TH dendrites (Fig.7B,C). Cx32 and Cx26 were localized to neuronal membranes in 19 and 12% of the profiles examined, respectively (Fig. 7G), and in both cases, the immunolabeling was consistently restricted to the dendrites. Thus, this structural data establishes the physical basis underlying neuronal coupling that has been demonstrated previously by electrophysiological studies in the LC.
Fig. 7.
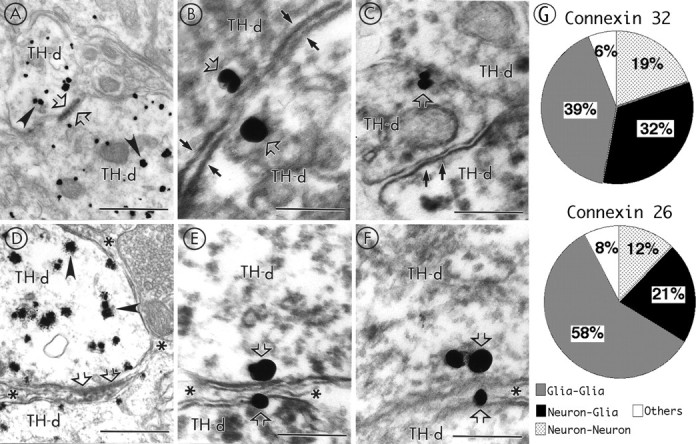
Electron micrographs showing the ultrastructural localization of Cx32 using peroxidase or gold-silver labeling in the LC. A, A pair of adjacent dendrites exhibiting gold-silver labeling for TH (arrowheads) also exhibits peroxidase labeling for Cx32 (straight open arrows) along portions of their apposed plasma membranes.B, Gold-silver labeling for Cx32 (straight open arrows) also reveals the presence of Cx32 on both sides of paired apposed peroxidase-labeled TH dendrites (TH-d) whose membranes (small filled arrows) tend to approach at the point at which the connexin proteins are localized.C, Gold-silver labeling for Cx32 (straight open arrow) can be detected along the plasma membrane of apposed peroxidase TH dendrites. One of the TH dendrites is also apposed to a third TH dendrite (small filled arrows), which lacks Cx immunolabeling. D, Two gold-silver (arrowheads) TH-positive dendrites are separated from one another by a glial process (asterisks) that exhibits peroxidase labeling for Cx32 (straight open ar-row). E, F, Serial sections in which gold-silver labeling for Cx32 (straight open arrows) was identified on the cytoplasmic surface of a peroxidase-labeled TH dendrite and in an apposed glial process (asterisks) that separates two TH-positive dendrites from one another. Scale bars: A, 0.86 μm;B, E, F, 0.2 μm;C, 0.37 μm; D, 0.62 μm.G, Pie charts illustrating the distribution of Cx32- and Cx26-immunoreactive profiles pooled from peroxidase and gold-silver stained tissue. For Cx32, 203 immunolabeled profiles were examined across three ultrathin sections from three animals. For Cx26, 89 profiles were analyzed across three ultrathin sections from two animals. The Cx immunoreactivity grouped in Otherscorresponds to Cx32 localized to apposed membranes of glia and axon terminals and Cx32 in association with myelinated axons. The 8% of immunoreactivity for Cx26 was identified between glia and axons terminals.
Cx43 immunostaining was most commonly identified in glial processes; however, immunostaining for Cx32 and Cx26 was also frequently observed (39% for Cx32 and 58% for Cx26) (Fig. 7G). Glial cells were identified by many of the features described for protoplasmic, fibrous astrocytes, and oligodendrocytes, including location in the gray matter and irregular perimeters conforming to the shape of neighboring neuronal processes. Sometimes the astrocytic processes contained bundles of microfilaments. These characteristics readily distinguished glial processes from neuronal processes exhibiting TH immunoreactivity.
Interestingly, Cx32 and Cx26 were immunocytochemically localized to the plasma membranes of pairs of glial and dendritic processes (32 and 21% for Cx32 and Cx26, respectively) (Fig. 7G). Peroxidase labeling of Cx32 was associated with extensions of protoplasmic astrocytes directly apposed to TH-labeled dendritic processes (Fig.7D). Gold-silver labeling for Cx32 established the localization of gap junction proteins to the cytoplasmic surface of TH-labeled dendrites, as well as to plasmalemmal surfaces of astrocytic processes. Figure 7, E and F, shows consecutive serial sections in which Cx32 was localized with gold-silver labeling to portions of apposed glial and neuronal plasma membranes. A previous report described a similar neuronal–glial interaction in neocortex (Nadarajah et al., 1996). Thus, the gap junction proteins were found at neuronal–glial pairs, further indicating the existence of a widespread network in the LC.
Finally, the immunostaining studies also revealed a peculiar distribution of astrocytic processes (Fig.8). Using immunostaining of GFAP, a protein present in astrocytic processes, it was possible to observe that astrocytic processes extended along a substantial portion of the perimeter of TH-labeled dendrites. These processes were not separated by any other cellular elements as determined from electron microscopic analysis (data not shown). A similar distribution was found when fluorescent immunostaining of another astrocytic marker, S-100β, was combined with fluorescent identification of TH (Fig.8B). The striking enrichment and distribution of astrocytes in this area constitutes another piece of evidence that supports the idea that astrocytes might play a distinctive role in the LC.
Fig. 8.
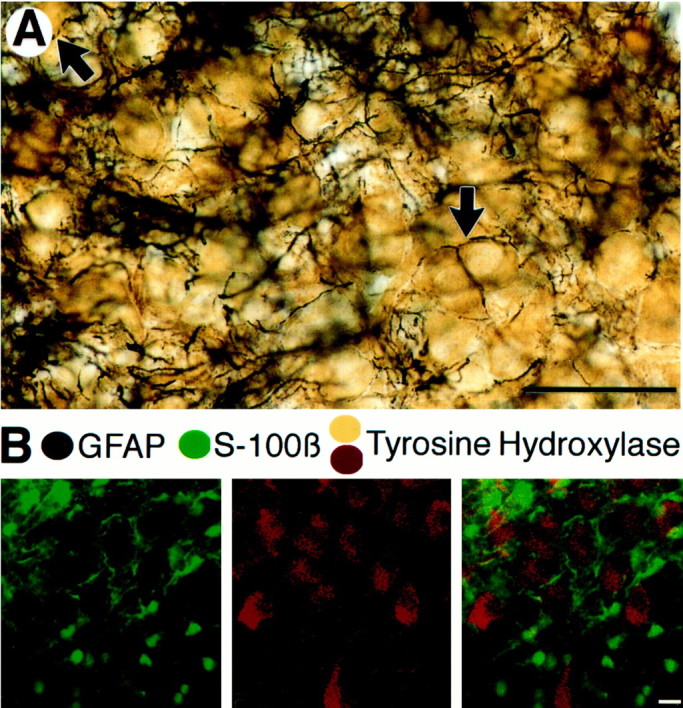
Distribution of astrocytic markers in the LC.A, Immunogold-silver labeling (black) for GFAP and peroxidase labeling for TH (brown) in the LC in a horizontal brain section. Note how GFAP-positive processes envelop TH-labeled cell bodies (black arrows). Scale bar, 160 μm. B, Immunofluorescent staining of S-100β (green, left) and TH (red, center) in the LC.Right, Superimposed image of both wavelengths showing the absence of colocalization and the enrichment of astrocytic processes surrounding LC neurons. Scale bar, 20 μm.
DISCUSSION
This study demonstrates gap junctional coupling between neurons and glia in a brainstem noradrenergic nucleus. The identification of connexin proteins and functional gap junctions by electrical and chemical coupling demonstrates heterocellular coupling in the brain. This novel mechanism for neuronal–glial communication adds a potential regulatory role for glia in information processing.
On one hand, heterocellular coupling constitutes a pathway whereby electrical signals can be transferred from neurons to glia. Although it is unlikely that the small oscillations in membrane potential of glia have an impact on glial cell physiology, the oscillations constitute a convenient measure of the electrical coupling to neurons. The electrical coupling between glia and neurons does, however, affect neuronal excitability. Activation of glutamate transporters selectively depolarized glial cells and increased the firing rate of LC neurons. Synaptically released glutamate could therefore have two different actions on LC neurons: one direct, through activation of postsynaptic receptors, and another indirect heterocellular action mediated by the activation of glutamate transporters on glia.
It is also probable that heterocellular coupling exerts an opposite influence on neuronal excitability. Given the negative membrane potential of glia (−80 mV), heterocellular coupling would constitute an electrical shunt and a steady hyperpolarizing current leak into neurons. The tonic hyperpolarization would modulate the firing frequency and facilitate the synchronization of the spontaneous activity. According to previous reports, electrical coupling is stronger in early stages of development (Peinado et al., 1993; Chang et al., 1999). In fact, during the first 3 weeks of life, the rate of spontaneous firing of LC neurons increased gradually from 0.3 to 3 Hz. This fact could be a consequence of decreased coupling to glia and then decreased shunt in adult animals.
Chemical signals are also transferred through gap junctions. It has been well established that inositol triphosphate (IP3)-dependent calcium waves propagate via gap junctions between glial cells (Charles et al., 1993). Potential chemical signaling through heterocellular coupling may involve molecules such as IP3 and calcium, which could effectively regulate neuronal excitability. Thus, receptor-mediated signaling in glia may have an important influence on neuronal activity. Finally, transfer of small molecules via gap junctions could also play an important role in support of the growth and development of the huge axonal arbors that stem from the highly divergent LC neurons. More recently, a correlation between the release of ATP into the extracellular space and the expression of connexins in cell lines has been demonstrated (Cotrina et al., 1998). These results suggested that ATP was released through connexin hemichannels. Propagating waves of calcium release in these cultures resulted from activation of purine receptors by ATP rather than through electrotonic coupling (Cotrina et al., 1998). This may be another mechanism by which astrocytic connexins modulate activity of LC neurons because both ATP (Harms et al., 1992;Shen and North, 1993) and adenosine (Shefner and Chiu, 1986; Regenold and Illes, 1990) receptors are functional in LC neurons.
Synchronous activity in the locus ceruleus is one mechanism by which the release of noradrenaline in the widespread projection areas can be augmented. A recent report showed that changes in LC activity pattern correlated with fluctuation in the performance of a visual discrimination task in waking monkeys (Usher et al., 1999). Periods of high performance in the behavioral task were associated with a reduction in the tonic discharge and an increase of the phasic discharge of LC neurons. Interestingly, the phasic activity was found to be synchronous in recordings made from pairs of cells. A computational model showed that modulation of the degree of electrotonic coupling of LC neurons was a potentially important factor in predicting the response of the animals. The present work expands the cellular network present in the LC to include heterocellular interactions with glia. Although the present work demonstrated heterocellular coupling in neonatal animals, qualitatively similar results were obtained in preliminary studies in slices from older animals. Thus, the regulation of activity through electrotonic coupling may extend into adulthood.
Footnotes
This work was supported by National Science Foundation Grant 9810524 and National Institutes of Health/National Institute on Drug Abuse Grant DA04523. We thank Spencer Watts and Dwight Bergles for the invaluable technical advice, and Olivier Manzoni, Linda Musil, Peregrine Osborne, Cecilia Lo, and Bruce Nicholson for the helpful comments on this manuscript.
Correspondence should be addressed to Elisabeth J. Van Bockstaele, Department of Pathology, Anatomy, and Cell Biology, Thomas Jefferson University, 1020 Locust Street, Room 520, Philadelphia, PA 19107. E-mail: elisabeth.vanbockstaele@mail.tju.edu.
REFERENCES
- 1.Araque A, Sanzgiri RP, Parpura V, Haydon PG. Calcium elevation in astrocytes causes an NMDA receptor-dependent increase in the frequency of miniature synaptic currents in cultured hippocampal neurons. J Neurosci. 1998;18:6822–6829. doi: 10.1523/JNEUROSCI.18-17-06822.1998. [DOI] [PMC free article] [PubMed] [Google Scholar]
- 2.Bergles DE, Diamond JS, Jahr CE. Clearance of glutamate inside the synapse and beyond. Curr Opin Neurobiol. 1999;9:293–298. doi: 10.1016/s0959-4388(99)80043-9. [DOI] [PubMed] [Google Scholar]
- 3.Bezzi P, Carmignoto G, Pasti L, Vesce S, Rossi D, Rizzini BL, Pozzan T, Volterra A. Prostaglandins stimulate calcium-dependent glutamate release in astrocytes. Nature. 1998;391:281–285. doi: 10.1038/34651. [DOI] [PubMed] [Google Scholar]
- 4.Chan J, Aoki C, Pickel VM. Optimization of differential immunogold-silver and peroxidase labeling with maintenance of ultrastructure in brain sections before plastic embedding. J Neurosci Methods. 1990;33:113–127. doi: 10.1016/0165-0270(90)90015-8. [DOI] [PMC free article] [PubMed] [Google Scholar]
- 5.Chang Q, Gonzalez M, Pinter MJ, Balice-Gordon RJ. Gap junctional coupling and patterns of connexin expression among neonatal rat lumbar spinal motor neurons. J Neurosci. 1999;19:10813–10828. doi: 10.1523/JNEUROSCI.19-24-10813.1999. [DOI] [PMC free article] [PubMed] [Google Scholar]
- 6.Charles AC, Dirksen ER, Merrill JE, Sanderson MJ. Mechanisms of intercellular calcium signaling in glial cells studied with dantrolene and thapsigargin. Glia. 1993;7:134–145. doi: 10.1002/glia.440070203. [DOI] [PubMed] [Google Scholar]
- 7.Chen J, Backus KH, Deitmer JW. Intracellular calcium transients and potassium current oscillations evoked by glutamate in cultured rat astrocytes. J Neurosci. 1997;17:7278–7287. doi: 10.1523/JNEUROSCI.17-19-07278.1997. [DOI] [PMC free article] [PubMed] [Google Scholar]
- 8.Christie MJ, Jelinek HF. Dye-coupling among neurons of the rat locus coeruleus during postnatal development. Neuroscience. 1993;56:129–137. doi: 10.1016/0306-4522(93)90568-z. [DOI] [PubMed] [Google Scholar]
- 9.Christie MJ, Williams JT, North RA. Electrical coupling synchronizes subthreshold activity in locus coeruleus neurons in vitro from neonatal rats. J Neurosci. 1989;9:3584–3589. doi: 10.1523/JNEUROSCI.09-10-03584.1989. [DOI] [PMC free article] [PubMed] [Google Scholar]
- 10.Coles JA, Abbott NJ. Signalling from neurones to glial cells in invertebrates. Trends Neurosci. 1996;19:358–362. doi: 10.1016/0166-2236(96)10042-4. [DOI] [PubMed] [Google Scholar]
- 11.Cotrina ML, Lin JHC, Alves-Rodrigues A, Liu S, Li J, Azmi-Ghadimi H, Kang J, Naus CCG, Nedergaard M. Connexins regulate calcium signaling by controlling ATP release. Proc Natl Acad Sci USA. 1998;95:15735–15740. doi: 10.1073/pnas.95.26.15735. [DOI] [PMC free article] [PubMed] [Google Scholar]
- 12.D'Ambrosio R, Wenzel J, Schwartzkroin PA, McKhann GM, Janigro D., II Functional specialization and topographic segregation of hippocampal astrocytes. J Neurosci. 1998;18:4425–4438. doi: 10.1523/JNEUROSCI.18-12-04425.1998. [DOI] [PMC free article] [PubMed] [Google Scholar]
- 13.Dani JW, Chernjavsky A, Smith SJ. Neuronal activity triggers calcium waves in hippocampal astrocyte networks. Neuron. 1992;8:429–440. doi: 10.1016/0896-6273(92)90271-e. [DOI] [PubMed] [Google Scholar]
- 14.Dermietzel R, Hwang TK, Spray DS. The gap junction family: structure, function and chemistry. Anat Embryol. 1990;182:517–528. doi: 10.1007/BF00186458. [DOI] [PubMed] [Google Scholar]
- 15.Duffy S, MacVicar BA. Adrenergic calcium signaling in astrocyte networks within the hippocampal slice. J Neurosci. 1995;15:5535–5550. doi: 10.1523/JNEUROSCI.15-08-05535.1995. [DOI] [PMC free article] [PubMed] [Google Scholar]
- 16.Eghbali B, Kessler JA, Spray DC. Expression of gap junction channels in communication-incompetent cells after stable transfection with cDNA encoding connexin 32. Proc Natl Acad Sci USA. 1990;87:1328–1331. doi: 10.1073/pnas.87.4.1328. [DOI] [PMC free article] [PubMed] [Google Scholar]
- 17.Froes MM, Correia AH, Garcia-Abreu J, Spray DC, Campos de Carvalho AC, Neto MV. Gap-junctional coupling between neurons and astrocytes in primary central nervous system cultures. Proc Natl Acad Sci USA. 1999;96:7541–7546. doi: 10.1073/pnas.96.13.7541. [DOI] [PMC free article] [PubMed] [Google Scholar]
- 18.Harms L, Finta EP, Tschopl M, Illes P. Depolarization of rat locus coeruleus neurons by adenosine 5′-triphosphate. Neuroscience. 1992;48:941–952. doi: 10.1016/0306-4522(92)90282-7. [DOI] [PubMed] [Google Scholar]
- 19.Ingram S, Wilding TJ, McCleskey EW, Williams JT. Efficacy and kinetics of opioid action on acutely dissociated neurons. Mol Pharmacol. 1997;52:136–143. doi: 10.1124/mol.52.1.136. [DOI] [PubMed] [Google Scholar]
- 20.Ishimatsu M, Williams JT. Synchronous activity in locus coeruleus results from dendritic interactions in pericoerulear regions. J Neurosci. 1996;16:5196–5204. doi: 10.1523/JNEUROSCI.16-16-05196.1996. [DOI] [PMC free article] [PubMed] [Google Scholar]
- 21.Jendelova P, Sykova E. Role of glia in K+ and pH homeostasis in the neonatal rat spinal cord. Glia. 1991;4:56–63. doi: 10.1002/glia.440040107. [DOI] [PubMed] [Google Scholar]
- 22.Kettenmann H, Ransom BR. Electrical coupling between astrocytes and between oligodendrocytes studied in mammalian cell cultures. Glia. 1988;1:64–73. doi: 10.1002/glia.440010108. [DOI] [PubMed] [Google Scholar]
- 23.Li J, Hertzberg EL, Nagy JI. Connexin32 in oligodendrocytes and association with myelinated fibers in mouse and rat brain. J Comp Neurol. 1997;379:571–591. doi: 10.1002/(sici)1096-9861(19970324)379:4<571::aid-cne8>3.0.co;2-#. [DOI] [PubMed] [Google Scholar]
- 24.McBean GJ. Inhibition of the glutamate transporter and glial enzymes in rat striatum by the gliotoxin, alpha aminoadipate. Br J Pharmacol. 1994;113:536–540. doi: 10.1111/j.1476-5381.1994.tb17022.x. [DOI] [PMC free article] [PubMed] [Google Scholar]
- 25.Nadarajah B, Thomaidou D, Evans WH, Parnavelas JG. Gap junctions in the adult cerebral cortex: regional differences in their distribution and cellular expression of connexins. J Comp Neurol. 1996;376:326–342. doi: 10.1002/(SICI)1096-9861(19961209)376:2<326::AID-CNE13>3.0.CO;2-J. [DOI] [PubMed] [Google Scholar]
- 26.Nedergaard M. Direct signaling from astrocytes to neurons in cultures of mammalian brain cells. Science. 1994;263:1768–1771. doi: 10.1126/science.8134839. [DOI] [PubMed] [Google Scholar]
- 27.Orkand RK, Nicholls JG, Kuffler SW. Effect of nerve impulses on the membrane potential of glial cells in the central nervous system of amphibia. J Neurophysiol. 1966;29:788–806. doi: 10.1152/jn.1966.29.4.788. [DOI] [PubMed] [Google Scholar]
- 28.Parpura V, Basarsky TA, Liu F, Jeftinija K, Jeftinija S, Haydon PG. Glutamate-mediated astrocyte-neuron signalling. Nature. 1994;369:744–747. doi: 10.1038/369744a0. [DOI] [PubMed] [Google Scholar]
- 29.Pasti L, Volterra A, Pozzan T, Carmignoto G. Intracellular calcium oscillations in astrocytes: a highly plastic, bidirectional form of communication between neurons and astrocytes in situ. J Neurosci. 1997;17:7817–7830. doi: 10.1523/JNEUROSCI.17-20-07817.1997. [DOI] [PMC free article] [PubMed] [Google Scholar]
- 30.Paul DL. Molecular cloning of cDNA for rat liver gap junction protein. J Cell Biol. 1986;103:123–134. doi: 10.1083/jcb.103.1.123. [DOI] [PMC free article] [PubMed] [Google Scholar]
- 31.Peinado A, Yuste R, Katz LC. Extensive dye coupling between rat neocortical neurons during the period of circuit formation. Neuron. 1993;10:103–114. doi: 10.1016/0896-6273(93)90246-n. [DOI] [PubMed] [Google Scholar]
- 32.Peters A, Josephson K, Vincent SL. Effects of aging on the neuroglial cells and pericytes within area 17 of the rhesus monkey cerebral cortex. Anat Rec. 1991;229:384–398. doi: 10.1002/ar.1092290311. [DOI] [PubMed] [Google Scholar]
- 33.Regenold JT, Illes P. Inhibitory adenosine A-1-receptors on rat locus coeruleus neurones: an intracellular electrophysiological study. Naunyn Schmiedebergs Arch Pharmacol. 1990;341:225–231. doi: 10.1007/BF00169735. [DOI] [PubMed] [Google Scholar]
- 34.Shefner SA, Chiu TH. Adenosine inhibits locus coeruleus neurons: an intracellular study in a rat brain slice preparation. Brain Res. 1986;366:364–368. doi: 10.1016/0006-8993(86)91320-x. [DOI] [PubMed] [Google Scholar]
- 35.Shen KZ, North RA. Excitation of rat locus coeruleus neurons by adenosine 5′-triphosphate: ionic mechanism and receptor characterization. J Neurosci. 1993;13:894–899. doi: 10.1523/JNEUROSCI.13-03-00894.1993. [DOI] [PMC free article] [PubMed] [Google Scholar]
- 36.Theodosis DT, MacVicar B. Neurone–glia interactions in the hypothalamus and pituitary. Trends Neurosci. 1996;19:363–367. doi: 10.1016/0166-2236(96)10055-2. [DOI] [PubMed] [Google Scholar]
- 37.Travagli RA, Dunwiddie TV, Williams JT. Opioid inhibition in locus coeruleus. J Neurophysiol. 1995;74:519–528. doi: 10.1152/jn.1995.74.2.519. [DOI] [PubMed] [Google Scholar]
- 38.Usher M, Cohen JD, Servan-Schreiber D, Rajkowski J, Aston-Jones G. The role of locus coeruleus in the regulation of cognitive performance. Science. 1999;283:549–554. doi: 10.1126/science.283.5401.549. [DOI] [PubMed] [Google Scholar]
- 39.Van Bockstaele EJ, Branchereau P, Pickel VM. Morphologically heterogeneous met-enkephalin terminals form synapses with tyrosine hydroxylase-containing dendrites in the rat nucleus locus coeruleus. J Comp Neurol. 1995;363:423–438. doi: 10.1002/cne.903630307. [DOI] [PubMed] [Google Scholar]
- 40.Vaney DI, Nelson JC, Pow DV. Neurotransmitter coupling through gap junctions in the retina. J Neurosci. 1998;18:10594–10602. doi: 10.1523/JNEUROSCI.18-24-10594.1998. [DOI] [PMC free article] [PubMed] [Google Scholar]
- 41.Verkhratsky A, Kettenmann H. Calcium signalling in glial cells. Trends Neurosci. 1996;19:346–352. doi: 10.1016/0166-2236(96)10048-5. [DOI] [PubMed] [Google Scholar]