Abstract
Background
3D-printed insoles are widely used. This study was conducted to test a customized three-dimensional (3D)-printed heel support insole based on arch lift and to investigate whether the pressure distribution on the sole was improved while maintaining foot function.
Material/Methods
The design was based on a 3D plantar contour scanning modeling technique. Thirty healthy male participants walked along a 10-m track under 3 self-controlled interventions. A customized 3D-printed heel support insole based on arch lift was inserted into the socks for the experimental condition A. For condition B, a customized 3D-printed heel-supporting insole was inserted into the socks, and a standardized pre-made heel-supporting insole was inserted into the socks as a control (condition C). We used the Footscan® pressure plate to measure the plantar parameters in the forefoot contact and foot flange phases in each condition.
Results
Compared with condition B and the control condition, the peak pressure under the heel was significantly lower in condition A (P<0.05), and the peak pressure in the midfoot region was not significantly increased (P>0.05).
Conclusions
The biomechanical properties of the customized 3D-printed heel support are better than those of the traditional heel support insole, especially when there is a need for an additional increase in heel height. Patients do not decrease midfoot motion function while using this customized insole.
MeSH Keywords: Foot Orthoses; Heel; Imaging, Three-Dimensional; Partial Pressure
Background
Heel support is used as a recovery method for patients with some lower-extremity diseases, such as Achilles tendinitis [1] and leg length difference [2]. The increased heel height from the lift reduces the distance between the calcaneus and the tibia, as well as wear on the plantar aponeurosis [3]. However, most heel supports do not provide arch lift, resulting in insufficient support for the midfoot area.
Each area of the sole has a corresponding biomechanical function, and the heel is primarily involved in absorbing shock [4]. Many studies have focused on the motor control of the heel [5,6] and forefoot load mitigation [7,8]. The midfoot, which connects the forefoot and the rearfoot, has received little attention compared to the heel and forefoot.
The midfoot includes the lateral and medial arches, and the midfoot arch acts as a spring during exercise, which allows the storage of energy and rebound to benefit gait efficiency [9]. Additionally, midfoot behavior is very important before the load is shifted to the forefoot. During normal foot movements, the side longitudinal arch is always touching the ground, which is important for stabilizing the movement from heel to toe [10]. Therefore, we hypothesized that decreased stability caused by lift of the heel is associated with reduced contact of the midfoot lateral arch with the ground.
The midfoot support has good biomechanical advantage in many aspects [11–14], and it can maintain the stability of motion and increase the contact area between the midfoot and the ground. To improve midfoot function when using the heel support, we designed and tested a custom three-dimensional (3D)-printed arch lift design. Arched supports have been widely used for midfoot improvement, with good biomechanical effects such as redistributing plantar pressure and reducing knee joint retraction torque [15]. Low-pressure areas can transfer the burden of high-pressure areas [16]. Therefore, to more effectively distribute the plantar pressure of patients with lower-limb diseases, we designed a heel support device based on an increase in the midfoot contact area.
We hypothesized that a customized 3D-printed heel support insole based on arch lift has the function of maintaining the midfoot. For example, it can reduce the peak pressure of the forefoot and midfoot, the reach and velocity of the medial-lateral center of pressure (COP) [17], and the negative impact of simply raising the heel. Considering the special nature of the 3D-printed insole, we also set up a set of 3D-printed heel support insoles without arch lift. The aim of this research was to study the effect of a customized 3D-printed heel support insole based on arch lift on foot pressure distribution and motion stability control. Our results may have implications for relevant orthopedic insole design.
Material and Methods
Subjects and ethics
Thirty healthy men, with a mean age of 20.52 years (standard deviation [SD]=1.50), participated in this study. Their average mass was 62.74 kg (SD=1.90), with an average height of 170.42 cm (SD=1.80). The subjects had no history of lower-limb injury within 1 year and all subjects’ arches were in the normal range, with arch index (AI) ranging from 0.23 to 0.29. The AI is based on the foot model data generated by Footscan® (RSscan International, Belgium) pressure plates. All participants provided written informed consent before the beginning of the study and the study was approved by the local ethics committee.
Evaluation equipment
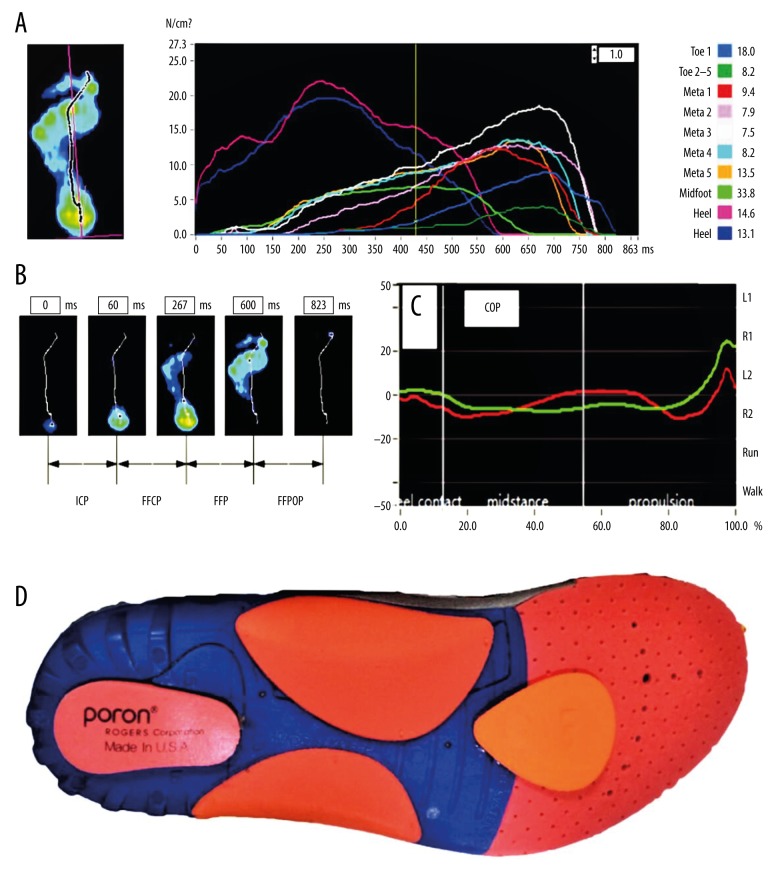
We used the Footscan® system (RSscan International, Belgium, 1×1 m Footscan® pressure plate with 8192 resistance sensors, 250 Hz frequency) to measure COP position changes, COP moving speed, peak pressure, and peak contact area. Figure 1A–1C show the area of the plantar, foot contact phases, and the range of the COP. The displacement of the center of pressure in the medial-lateral is relatively vertical to the x-axis of the longitudinal foot axis, which is set as the base line from the middle of the heel to the forefoot, between the 2nd and 3rd metatarsal heads. The Bodyarch® The Foot Scanning System (China) was used to measure the size of the foot.
Figure 1.
(A) The Footscan® plantar pressure system divides the sole into 10 areas: the big toe (T1), toes 2–5 (T2–T5), from the 1st to the 5th metatarsal (M1, M2, M3, M4, and M5), midfoot (MF), medial heel (H1), and lateral heel (H2). For the convenience of analysis, in addition to the toes, the sole was divided into 3 areas: the forefoot area (FF), the midfoot area (MF), and the rear foot (RF) area. (B) The plantar movement has 4 phases: initial contact phase (ICP), forefoot contact phase (FFCP), foot flange phase (FFP) and forefoot push-out phase (FFPOP). (C) The center of pressure (COP) varies and this range is shown on the x-axis. (D) Customized 3D printed heel support and midfoot lift insole for experimental condition A.
Design of the heel support
The traditional hand-drawn arched support structure based on the barefoot model may not conform to the ideal biomechanical structure when used for heel support [18]. By capturing the size of the foot with a 3D scanner, the heel support and arch lift structure can be more accurately designed. Based on previous research [5,18–21], a customized 3D-printed heel support insole was designed with the following parameters: (1) a height of 24 mm; (2) material with moderate hardness (using EVA with A30 hardness); and (3) an arched arch lift and a raised heel structure. The subject stood in the center of the scanning plate and raised the heel 24 mm to capture the contour of the foot through the Bodyarch® Foot Scanning System. The insole design for experimental conditions A and B was based on the Bodyarch Designer® software. The arch lift of experimental condition A was designed to achieve full support by adjusting the lateral longitudinal portion of the arch to make the insole fully contact the ground. Experimental condition B did not utilize the arch lift structure, and the control condition used a standardized pre-made heel support insole. The model was designed utilizing the Bodyarch X1 printer®. Figure 1D shows the customized 3D printed heel support insole based on arch lift.
Process
Subjects were asked to wear standardized socks to walk along a 10-m walkway, and self-control was performed according to the following 3 conditions: (1) insert customized 3D-printed heel supports and midfoot support insoles in the socks of experimental condition A subjects; (2) insert custom 3D-printed heel support insoles into the socks of subjects in experimental condition B; (3) standardized pre-made heel support insoles were inserted into the socks of the control condition. After walking for 10 min along the track, participants passed the Footscan® plantar pressure scan plate at a normal walking speed. The pressure was recorded by the Footscan® system and 4 successful walks under each condition were recorded for each participant.
Data analyses
To reduce error, all data analysis only considered the left foot. The foot data – force-time (s), peak pressure (Kpa), and maximum contact area (cm2) – were recorded by the Footscan® pressure test system, which included 10 areas of the sole: the big toe (T1), toes 2–5 (T2–T5), from the 1st to the 5th metatarsal (M1, M2, M3, M4, and M5), midfoot (MF), medial heel (H1), and the lateral heel (H2). To facilitate analysis, in addition to the toes, the sole was divided into 3 regions: the forefoot region (FF), the midfoot region (MF), and the heel (RF) region. Plantar motion has 4 phases: initial contact phase (ICP), forefoot contact phase (FFCP), foot flange phase (FFP), and forefoot push-out phase (FFPOP). We analyzed the COP data during the FFCP and the FFP because maintaining a dynamic stability is most critical at these stages [21–23]. The FFCP period starts with the first metatarsal contact with the floor and ends when all of the humeral head regions are in contact with the floor. The calculation range of the COP is the absolute value of the difference between the maximum and minimum x-coordinate values of the COP during the phases.
Statistical analyses
Data analyses were done using the Social Science Statistics Program (SPSS) 24.0th Edition (SPSS, Inc., Chicago, IL, USA). One-way analysis of variance (ANOVA) was used to analyze the difference in maximum plantar pressure and COP variables in condition A and B and the control condition. P<0.05 was considered statistically significant for the variables under each condition. In Figures 2–6, error bars: ±SD; * P<0.05.
Figure 2.
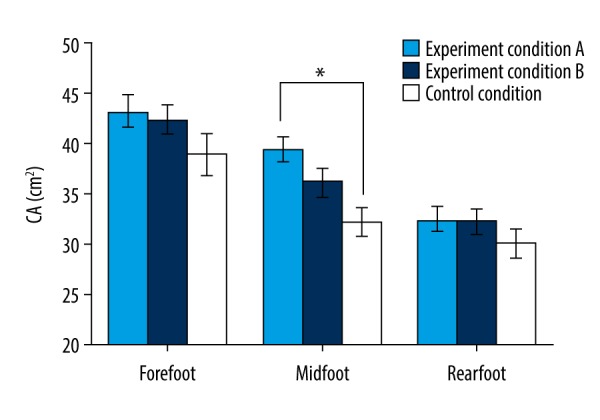
Contact area (CA) of the 3 plantar areas in experimental conditions A and B and the control condition.
Figure 3.
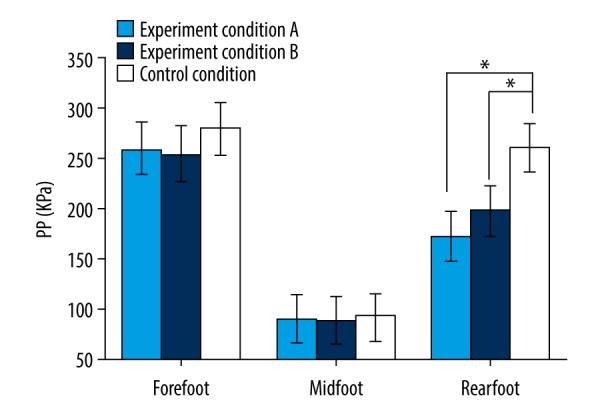
Peak pressure (PP) of the 3 plantar areas in experimental conditions A and B and the control condition.
Figure 4.
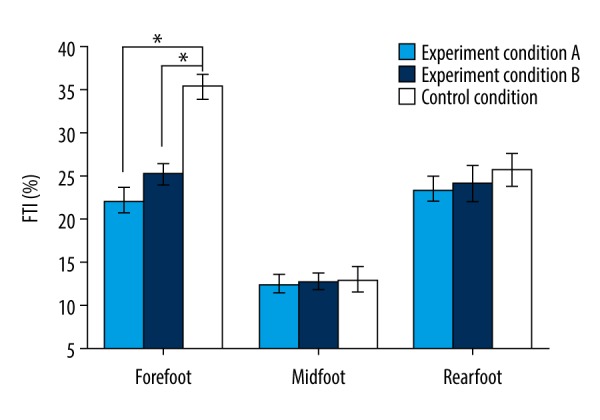
Percentage of force-time integral (FTI) in the 3 plantar areas in experimental conditions A and B and the control condition.
Figure 5.
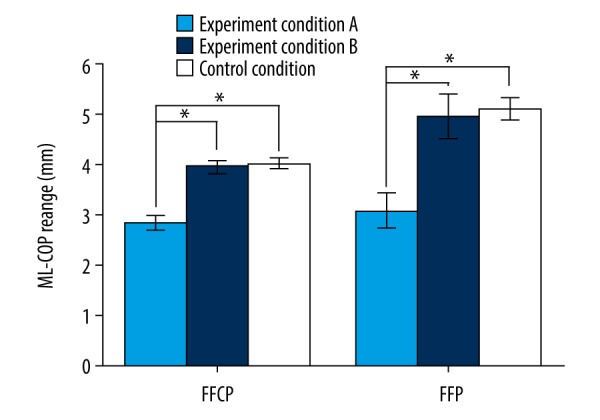
The range of medial-lateral center of pressure (ML-COP) during the forefoot contact phase (FFCP) and foot flange phase (FFP) in experimental conditions A and B and the control condition.
Figure 6.
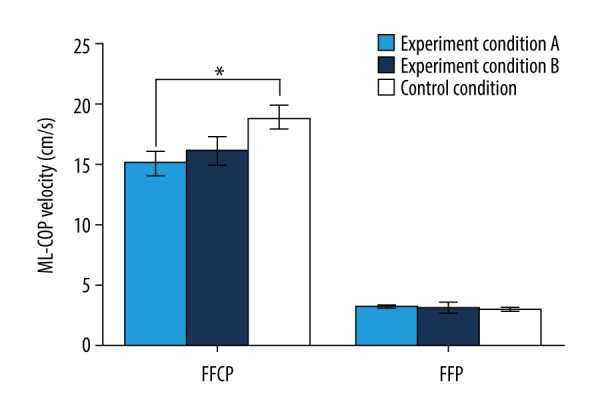
The velocity of the medial-lateral center of pressure (ML-COP) during forefoot contact phase (FFCP) and foot flange phase (FFP) in experimental conditions A and B and the control condition.
Results
In Figures 2 and 3, comparisons of the peak pressure (PP) and contact area (CA) of the forefoot, midfoot, and heel of experimental conditions A and B and the control condition are shown. The CA under the middle foot of experimental condition A was significantly increased compared with the control condition (P<0.05). Compared with the control condition, there was not a significant increase in the peak pressure of the forefoot and midfoot regions (P>0.05) in experimental conditions A and B. Conversely, in the heel region, the peak pressures in experimental conditions A and B were significantly lower than in the control condition (P<0.05).
Figure 4 shows the percentage of force-time integrals (FTI) for the 3 plantar regions of experimental condition A, experimental condition B, and the control condition. The FTIs of the forefoot areas of experimental condition A and experimental condition B were significantly smaller than those of the control condition (P<0.05). No significant differences were found in the percentage of FTIs between the 3 conditions (P>0.05).
Figures 5 and 6 show the extent and speed of the medial-lateral’s center of pressure in the forefoot contact phase (FFCP) and foot flange phase (FFP) in experimental conditions A and B and control condition, respectively. In the FFCP, the medial-lateral COP velocity and range of experimental condition A were significantly lower than those of experimental condition B and the control condition (P<0.05). In FFP, although the COP velocity of experimental condition A did not change significantly, the range of COP was significantly lower in experimental condition B and control condition than in condition A (P<0.05).
Discussion
Patients with foot disease need to wear a special insole to recover. Going barefoot only aggravates the disease, so the main purpose of this experiment was to compare the effects of different insoles on plantar pressure. The experimental results of healthy individuals are instructive for patients. In healthy people, the pressure distribution on the plantar area is balanced and no additional intervention is needed to change the pressure distribution. However, for the patient, the patient’s own plantar pressure distribution has changed and additional intervention is needed to improve the plantar pressure distribution. The result of wearing insoles for normal subjects can be used to indicate the change in pressure on the sole of the insole. Relevant experiments have been conducted to select normal people to participate and have produced many instructive results [5,11,21], so normal subjects can be used to conduct experiments to provide guidance for patients.
Heel elevation significantly increases midfoot contact area [5]. This is partly because the heel supports the foot–floor contact area to the metatarsophalangeal joint, leaving the midfoot and rearfoot off the ground, so the heel support insole does not support the midfoot well. The customized 3D-printed insole, which simply lifts the heel, also insufficiently stabilizes the midfoot when the heel is raised. In this study, compared with the control condition and experimental condition B, the COP velocity in experimental condition A was significantly lower. Conversely, experimental condition B and the control condition exhibited no significant difference in these 2 aspects, indicating that the designed arch lift structure was maintained and effective in terms of exercise stability. The customized insole based on the arch lift may be used to compensate for the adverse effects of reduced stability of the midfoot while raising the heel. Since the contact area of experimental condition A was significantly higher than that of the control condition, the hypothesis that the decreased stability is related to the decrease in contact between the midfoot lateral arch and the ground is supported.
Studies have shown that due to the high peak pressure under the forefoot, heel elevation may negatively affect the forefoot [5,24]. However, in this study, the peak pressure of the forefoot remained almost unchanged in the experimental condition A compared with experimental condition B and the control condition. This can be explained by the foot arch lift sharing a portion of the load. The 3D-printed heel section also helps protect the soft tissue of the heel and absorbs the impact on the heel [4,25,26].
The midfoot links the forefoot and the rearfoot, so in the load transfer phase, the midfoot keeps the balance of the sole [27,28]. Increasing the range of the COP in the medial-lateral direction shows a greater need for controlling stability in the lower limbs [29–31]. A larger range of changes in COP and faster speeds indicate that the stability of motion is lower. The results show that, compared with experimental condition B in the stability control phase [21,22,32] (i.e., the FFCP and the FFP), the range of the inner and outer COP of the experimental condition A was significantly lower than that of the experimental condition B and the control condition. The COP rate of experimental condition A was significantly lower than the control condition, indicating that the customized 3D-printed heel support insole based on arch lift improved control of balance in the contact and flange phases.
Although we demonstrated that a customized 3D-printed heel support insole based on arch lift improves foot pressure distribution and improves stability, there are some inevitable limitations in this study. First, we simply measured foot pressure data and COP variation range and speed to assess foot function without recording 3D motion data. As a result, we were unable to study the effects of the new insole on the biomechanics of lower-limb joints. Second, although the main purpose of our study was to compare the differences between wearing different insoles, it is still important to compare these with barefoot conditions, as manual intervention insoles may have some adverse effects. Since our sample size was small, the error was large when we made a comprehensive comparison. We will expand the sample in future experiments. In future research, we will further analyze the effects of customized 3D-printed heel support insoles based on arch lift on the wearer’s joint angle and torque, especially for patients with related lower-extremity diseases requiring rehabilitation.
Conclusions
Use of customized 3D-printed heel support insoles based on arch lift improves biomechanical performance in plantar pressure distribution and the stability of movement, while reducing peak pressure of the heel and midfoot and forefoot load. This new type of arch lift design method may have a positive impact on the related orthopedic insole design.
Acknowledgements
We sincerely thank Professor Wang Jincheng for his support of our experiment.
Footnotes
Source of support: Departmental sources
Conflicts of interest
None.
References
- 1.Caudell GM. Insertional achilles tendinopathy. Clin Podiatr Med Surg. 2017;34:195–205. doi: 10.1016/j.cpm.2016.10.007. [DOI] [PubMed] [Google Scholar]
- 2.Palmanovich E, Ayalon M, Sira DB, et al. The effect of eliminating leg length difference on plantar foot pressure distribution in patients wearing forefoot offloading shoe. Foot (Edinb) 2017;33:39–43. doi: 10.1016/j.foot.2017.10.003. [DOI] [PubMed] [Google Scholar]
- 3.Lui TH. Endoscopic decompression of the first branch of the lateral plantar nerve and release of the plantar aponeurosis for chronic heel pain. Arthrosc Tech. 2016;5:e589–94. doi: 10.1016/j.eats.2016.02.018. [DOI] [PMC free article] [PubMed] [Google Scholar]
- 4.Salvioli S, Guidi M, Marcotulli G. The effectiveness of conservative, non-pharmacological treatment, of plantar heel pain: A systematic review with meta-analysis. Foot (Edinb) 2017;33:57–67. doi: 10.1016/j.foot.2017.05.004. [DOI] [PubMed] [Google Scholar]
- 5.Zhang X, Li B, Hu K, et al. Adding an arch support to a heel lift improves stability and comfort during gait. Gait Posture. 2017;58:94–97. doi: 10.1016/j.gaitpost.2017.07.110. [DOI] [PubMed] [Google Scholar]
- 6.Reimann H, Fettrow TD, Thompson ED, et al. Complementary mechanisms for upright balance during walking. PLoS One. 2017;12:e0172215. doi: 10.1371/journal.pone.0172215. [DOI] [PMC free article] [PubMed] [Google Scholar]
- 7.Begg L, McLaughlin P, Vicaretti M, et al. Total contact cast wall load in patients with a plantar forefoot ulcer and diabetes. J Foot Ankle Res. 2016;9:2. doi: 10.1186/s13047-015-0119-0. [DOI] [PMC free article] [PubMed] [Google Scholar]
- 8.Boyer ER, Derrick TR. Lower extremity joint loads in habitual rearfoot and mid/forefoot strike runners with normal and shortened stride lengths. J Sports Sci. 2018;36:499–505. doi: 10.1080/02640414.2017.1321775. [DOI] [PubMed] [Google Scholar]
- 9.Wager JC, Challis JH. Elastic energy within the human plantar aponeurosis contributes to arch shortening during the push-off phase of running. J Biomech. 2016;49:704–9. doi: 10.1016/j.jbiomech.2016.02.023. [DOI] [PubMed] [Google Scholar]
- 10.Birinci T, Demirbas SB. Relationship between the mobility of medial longitudinal arch and postural control. Acta Orthop Traumatol Turc. 2017;51:233–37. doi: 10.1016/j.aott.2016.11.004. [DOI] [PMC free article] [PubMed] [Google Scholar]
- 11.Zhang X, Li B, Liang K, et al. An optimized design of in-shoe heel lifts reduces plantar pressure of healthy males. Gait Posture. 2016;47:43–47. doi: 10.1016/j.gaitpost.2016.04.003. [DOI] [PubMed] [Google Scholar]
- 12.Lohman EB, 3rd, Balan Sackiriyas KS, Swen RW. A comparison of the spatiotemporal parameters, kinematics, and biomechanics between shod, unshod, and minimally supported running as compared to walking. Phys Ther Sport. 2011;12:151–63. doi: 10.1016/j.ptsp.2011.09.004. [DOI] [PubMed] [Google Scholar]
- 13.Wegener C, Hunt AE, Vanwanseele B, et al. Effect of children’s shoes on gait: A systematic review and meta-analysis. J Foot Ankle Res. 2011;4:3. doi: 10.1186/1757-1146-4-3. [DOI] [PMC free article] [PubMed] [Google Scholar]
- 14.Tarrade T, Doucet F, Saint-Lo N, et al. Are custom-made foot orthoses of any interest on the treatment of foot pain for prolonged standing workers? Appl Ergon. 2019;80:130–35. doi: 10.1016/j.apergo.2019.05.013. [DOI] [PubMed] [Google Scholar]
- 15.Chen TH, Chou LW, Tsai MW, et al. Effectiveness of a heel cup with an arch support insole on the standing balance of the elderly. Clin Interv Aging. 2014;9:351–56. doi: 10.2147/CIA.S56268. [DOI] [PMC free article] [PubMed] [Google Scholar]
- 16.Bellato E, Fitzsimmons JS, Kim Y, et al. Articular contact area and pressure in posteromedial rotatory instability of the elbow. J Bone Joint Surg Am. 2018;100:e34. doi: 10.2106/JBJS.16.01321. [DOI] [PubMed] [Google Scholar]
- 17.Aldabe D, de Castro MP, Milosavljevic S, Bussey MD. Concurrent validity and reliability of using ground reaction force and center of pressure parameters in the determination of leg movement initiation during single leg lift. Gait Posture. 2016;49:346–52. doi: 10.1016/j.gaitpost.2016.07.181. [DOI] [PubMed] [Google Scholar]
- 18.Kutilek P, Svoboda Z, Viteckova S, et al. Evaluation of the effect of heel lift on postural stability and symmetry of muscle activity. J Back Musculoskelet Rehabil. 2017;30:1037–44. doi: 10.3233/BMR-169616. [DOI] [PubMed] [Google Scholar]
- 19.Xu R, Wang Z, Ma T, et al. Effect of 3D printing individualized ankle-foot orthosis on plantar biomechanics and pain in patients with plantar fasciitis: A randomized controlled trial. Med Sci Monit. 2019;25:1392–400. doi: 10.12659/MSM.915045. [DOI] [PMC free article] [PubMed] [Google Scholar]
- 20.Yoo WG. Effects of bridging plus exercises with heel lift on lower extremity muscles. J Phys Ther Sci. 2016;28:1582–83. doi: 10.1589/jpts.28.1582. [DOI] [PMC free article] [PubMed] [Google Scholar]
- 21.Zhang X, Li B. Influence of in-shoe heel lifts on plantar pressure and center of pressure in the medial-lateral direction during walking. Gait Posture. 2014;39:1012–16. doi: 10.1016/j.gaitpost.2013.12.025. [DOI] [PubMed] [Google Scholar]
- 22.Neamtu MC, Neamtu OM, Marin MI, Rusu L. Morphofunctional muscle changes influence on foot stability in multiple sclerosis during gait prediction: The rehabilitation potential. J Back Musculoskelet Rehabil. 2018;31:469–74. doi: 10.3233/BMR-170925. [DOI] [PubMed] [Google Scholar]
- 23.Allet L, Zumstein F, Eichelberger P, et al. Neuromuscular control mechanisms during single-leg jump landing in subacute ankle sprain patients: A case control study. PM R. 2017;9:241–50. doi: 10.1016/j.pmrj.2016.07.006. [DOI] [PubMed] [Google Scholar]
- 24.Rabusin CL, Menz HB, McClelland JA, et al. Effects of heel lifts on lower limb biomechanics and muscle function: A systematic review. Gait Posture. 2019;69:224–34. doi: 10.1016/j.gaitpost.2019.01.023. [DOI] [PubMed] [Google Scholar]
- 25.Perhamre S, Lundin F, Klassbo M, Norlin R. A heel cup improves the function of the heel pad in Sever’s injury: Effects on heel pad thickness, peak pressure and pain. Scand J Med Sci Sports. 2012;22:516–22. doi: 10.1111/j.1600-0838.2010.01266.x. [DOI] [PubMed] [Google Scholar]
- 26.Rosenbaum AJ, DiPreta JA, Misener D. Plantar heel pain. Med Clin North Am. 2014;98:339–52. doi: 10.1016/j.mcna.2013.10.009. [DOI] [PubMed] [Google Scholar]
- 27.Patel A, Rao S, Nawoczenski D, et al. Midfoot arthritis. J Am Acad Orthop Surg. 2010;18:417–25. doi: 10.5435/00124635-201007000-00004. [DOI] [PubMed] [Google Scholar]
- 28.Ma CZ, Zheng YP, Lee WC. Changes in gait and plantar foot loading upon using vibrotactile wearable biofeedback system in patients with stroke. Top Stroke Rehabil. 2018;25:20–27. doi: 10.1080/10749357.2017.1380339. [DOI] [PubMed] [Google Scholar]
- 29.Portnoy S, Hersch A, Sofer T, Tresser S. Comparison of path length and ranges of movement of the center of pressure and reaction time and between paired-play and solo-play of a virtual reality game. Games Health J. 2017;6:147–51. doi: 10.1089/g4h.2017.0017. [DOI] [PubMed] [Google Scholar]
- 30.Leong HF, Lam WK, Ng WX, Kong PW. Center of pressure and perceived stability in basketball shoes with soft and hard midsoles. J Appl Biomech. 2018;34:284–90. doi: 10.1123/jab.2017-0120. [DOI] [PubMed] [Google Scholar]
- 31.Sinitski EH, Herbert-Copley AG, Lemaire ED, Doyle SS, et al. Center of pressure and total force analyses for amputees walking with a backpack load over four surfaces. Appl Ergon. 2016;52:169–76. doi: 10.1016/j.apergo.2015.07.014. [DOI] [PubMed] [Google Scholar]
- 32.Riley PO, Benda BJ, Gill-Body KM, Krebs DE. Phase plane analysis of stability in quiet standing. J Rehabil Res Dev. 1995;32:227–35. [PubMed] [Google Scholar]


