

Abstract
Renal cell carcinoma (RCC) has an undisputed genetic component and a stable 2:1 male to female sex ratio in its incidence across populations, suggesting possible sexual dimorphism in its genetic susceptibility. We conducted the first sex-specific genome-wide association analysis of RCC for men (3227 cases, 4916 controls) and women (1992 cases, 3095 controls) of European ancestry from two RCC genome-wide scans and replicated the top findings using an additional series of men (2261 cases, 5852 controls) and women (1399 cases, 1575 controls) from two independent cohorts of European origin. Our study confirmed sex-specific associations for two known RCC risk loci at 14q24.2 (DPF3) and 2p21(EPAS1). We also identified two additional suggestive male-specific loci at 6q24.3 (SAMD5, male odds ratio (ORmale) = 0.83 [95% CI = 0.78-0.89], Pmale = 1.71 × 10⁻⁸ compared with female odds ratio (ORfemale) = 0.98 [95% CI = 0.90–1.07], Pfemale = 0.68) and 12q23.3 (intergenic, ORmale = 0.75 [95% CI = 0.68-0.83], Pmale = 1.59 × 10⁻⁸ compared with ORfemale = 0.93 [95% CI = 0.82–1.06], Pfemale = 0.21) that attained genome-wide significance in the joint meta-analysis. Herein, we provide evidence of sex-specific associations in RCC genetic susceptibility and advocate the necessity of larger genetic and genomic studies to unravel the endogenous causes of sex bias in sexually dimorphic traits and diseases like RCC.
Subject terms: Epidemiology, Cancer epidemiology
Introduction
Kidney cancer is the 12th most common malignancy in the world with estimated 337,860 new cases and 143,406 deaths in 2012 [1]. Renal cell carcinoma (RCC) accounts for ~90% of all kidney cancers [2]. The incidence differs significantly by sex, with two-fold higher rates for men than women. The 2:1 sex ratio has been consistent over time, across different age groups, geographical locations and ethnic backgrounds; and, hence, the male excess cannot be explained by differences in environmental or lifestyle exposures and hormonal factors alone [3, 4]. Although there is recent evidence of sexual dimorphism at the genomic level, sex chromosome differences have gained most attention [5]. The first comprehensive sex-specific somatic alteration analysis of 13 cancer types from The Cancer Genome Atlas (TCGA) revealed extensive sex differences in autosomal gene expression and methylation signatures of kidney cancer, although it did not consider germline variation between sexes [6]. A genetic contribution to RCC susceptibility is well documented. Besides the rare inherited germline variants implicated in some familial RCCs, e.g., VHL (von Hippel-Lindau disease), MET (hereditary papillary renal cancer), FLCN (Birt-Hogg-Dubé syndrome) and FH (hereditary leiomyomatosis and renal cell cancer) genes [7], large genome-wide association studies (GWAS) have identified 13 autosomal RCC susceptibility loci implicating several candidate genes (supplementary table 1) [8–13]. A role for sex in modifying genetic susceptibility to RCC is possible, but, unlike many other sexually dimorphic diseases and traits [14–16], no genome-wide, systematic effort to study possible sex specific genetic contributions to kidney cancer risk has been undertaken.
We conducted a sex-specific genome wide association analysis of kidney GWAS datasets consisting of 13,230 individuals (8193 men, 5087 women) using approximately 6 million genotyped and imputed SNPs in sex-stratified and sex interaction models and replicated the top findings using another 8113 men and 2974 women. To explore the possibility of sex-specific gene regulation of the top genotypic variants, we performed an expression quantitative trait loci (eQTL) analysis using paired genotyping and gene expression data from normal and kidney tumour tissues of a subset of the genetic discovery cohort.
Methods
Genetic association analysis
Discovery
The International Agency for Research on Cancer (IARC) kidney cancer GWAS have been previously described [12]. The dataset consisted of two IARC-Centre National de Genotypage (CNG) scans using 11 studies recruited from 18 countries and included a total of 5219 RCC cases (1992 women, 3227 men) and 8011 controls (3095 women, 4916 men) of European descent, the first being genotyped using HumanHap 317k, 550 or 610Q, and the second using Omni5 and OmniExpress arrays. Quality control (QC) assessments applied to the data have been previously described [8, 12]. Briefly, we used the following quality control measures at individual levels as exclusion criteria, genotype success rate of < 95%, discordant sex, duplication or relatedness based on IBD score > 0.185 and samples with < 80% European ancestry. SNP exclusion criteria included call rate < 90%, departure from Hardy Weinberg equilibrium in controls at P < 10−7, and MAF < 0.05. Imputation of genotypes was done by minimac version 3 using 1094 subjects from the 1000 Genomes Project (phase 1 release 3) as the reference panel and ~6 million SNPs were retained for the final analysis after post imputational QC steps (r2 > 0.3). Genome Reference Consortium Human Build 37 (GRCh37/hg19) was used to map variants. Population stratification analysis (implemented in EIGENSTRAT using EIGENSOFT software version 5.0.2) [17] on the pooled dataset identified 19 significant (P < 0.05) eigenvectors, showing significant association with the country of recruitment. Informed consent from the study participants and approval from the IARC Institutional Review Board (IARC Ethics Committee) was obtained.
SNP selection
Sexually dimorphic SNPs could have (i) a concordant effect direction (CED), if the association is present (i.e., significant after multiple testing correction) for one sex and nominally significant and directionally concordant for the other, (ii) single sex effect (SSE), if the association is present for one sex only, or (iii) opposite effect direction (OED), if the association is present for one sex, at least nominally significant and in opposite direction for the other sex [16]. Previous studies on sex-specific genetic associations indicated that sex-specific scans had a higher probability to select SNPs with CED or SSE signal, while sex-interaction scans had a higher probability to select SNPs with OED [16]. Therefore, in the discovery phase, we conducted both sex stratified and sex interaction scans. For the sex-stratified analysis, a log-additive model using unconditional logistic regression adjusted for age, study and the significant eigenvectors were used to identify associations. For the sex interaction analysis, a regression model including the main effects of the genotypes, sex, covariates and an interaction term for genotypes and sex was used to detect association. We applied a false-discovery-rate (FDR) approach separately for male and female datasets to account for multiple testing and the difference in sample size. This allows the stratified study design of the discovery stage to be less stringent in identifying hits, while keeping the stringency of conventional Bonferroni cutoff in the combined (discovery + replication) stage for the final interpretation of results. FDR q-value cut offs of 5 and 30% were used to detect significant and suggestive SNPs respectively in each of the datasets. Accordingly, p-value threshold of 1 × 10⁻⁶ and 4 × 10⁻⁶ was considered to be significant (5% FDR) and p-value threshold of 1.1 × 10⁻⁵ and 5 × 10⁻⁵ was considered suggestive (30% FDR) for female and male datasets respectively. In addition to the significant and suggestive sex-specific p-values, a nominally significant (P < 0.05) sex interaction p-value was taken into account in order to identify SNPs showing sex difference. The same FDR cut-offs were used to detect significant and suggestive signals in interaction tests (Supplementary figure S1). All association analyses were conducted using R statistical software version 3.3 implemented in high performance computing cluster. In addition, a clear LD cluster (atleast one correlated SNP with r2 > 0.5 within 1 Mb window) for the SNP was also considered as a criterion to avoid false positives. Among multiple SNPs in LD (r2 > 0.8, with LD-window of 1 Mb) showing an association, we choose the one with the lowest missing rate and p-value. All regional LD plots were generated in LocusZoom using genome build hg19 and 1000 Genomes EUR as LD population [18]. To focus on common SNPs and to avoid spurious association, as a QC step we removed the SNPs having MAF < 0.05 and without LD cluster (supplementary figure S2),
In-silico replication and joint meta-analysis
In-silico replication of the top hits from the discovery phase was conducted using 3660 cases (1399 women, 2261 men) and 7427 controls (1575 women, 5852 men) from two previously published National Cancer Institute (NCI, Bethesda, Maryland, USA) and one MD Anderson Cancer Center (MDA, Texas, USA) RCC GWAS scans genotyped using OmniExpress, Omni2.5, HumanHap 550, 610 and 660 W beadchip arrays. Quality control and genotype imputation was done as described previously [8, 9, 12]. For each study, sex-stratified and sex-interaction models for all significant and suggestive SNPs were tested assuming a log-additive model of genetic effects using unconditional logistic regression with adjustment for age, study centre, and significant eigenvectors. The odds ratios and 95% confidence intervals per SNP from each study were meta-analysed using fixed-effect models implemented in GWAMA [19], to get the combined estimates from the replication series. We also performed a joined meta-analysis of results from the discovery and replication series on 8061 women and 16,256 men to get the combined effect estimates of the tested SNPs. Heterogeneity in genetic effects across datasets was assessed using the I2 and Cochran’s Q statistics.
Expression QTL analysis of the selected SNPs
To identify gene regulatory effects of the 17 identified SNPs, we examined transcript expression near each of the SNPs in 101 tumour adjacent normal and 259 tumour kidney tissues in women and 178 tumour adjacent normal and 385 tumour kidney tissues in men. All of these kidney samples were part of the discovery GWAS study (112 from first IARC GWAS and 532 samples from second IARC GWAS) and the eQTL analysis was performed on matched gene expression and GWAS datasets. Expression analysis was conducted using Illumina HumanHT-12 v4 expression BeadChips (Illumina, Inc., San Diego), normalised using variance stabilising transformation (VST) and quantile normalisation. Out of the 17 transcripts, 12 transcripts in normal samples and 14 in tumours were expressed in <10% of the samples. Expression for MIR4472-1 was not available for both tumour and normal samples in our dataset. For the few transcripts showing sex-difference in expression in our dataset, we also downloaded raw counts of RNA-seq data from 60 normal and 459 tumours from TCGA kidney renal cell carcinoma (TCGA-KIRC) and used as a validation cohort. For eQTL analysis, additive linear models were used to test the association between each transcript and SNP with age, country, tumour stage and grade as covariates. All transcripts with expression in <10% of the samples were filtered out from eQTL analysis. All available transcripts mapping to each SNP were evaluated, and FDR adjusted p-value < 0.05 using Benjamini–Hochberg procedure was used as statistical significance threshold. All probes overlapping SNPs with European-ancestry having MAF > 0.01 were filtered out. Colocalization of GWAS and eQTL signals were analysed used eCAVIAR software [20].
Results
In the discovery phase, sex-specific analysis identified an excess of SNPs with association p-values <0.05. However, only a few loci could reach the significant (5% FDR) or suggestive (30% FDR) association thresholds, among which only 4 loci in women and 7 in men attained Bonferroni genome-wide significance threshold (P < 5E-08) (Fig. 1). The association quantile-quantile plots indicated little inflation for both the datasets (λfemale = 1.02, λmale = 1.04; supplementary figure S3a, b). Following MAF and LD based QC, a total of 17 sex-specific SNPs (6 significant and 11 suggestive) were selected for follow-up. Among the 17 SNPs, 15 were single sex-specific signals (SSE) and the 2 other SNPs namely, rs4903064 and rs6554676 showing CED were strongly associated in women and nominally in men (Supplementary table 2). Among the 15 single sex-specific signals, 7/15 associations were male-specific, whereas, 8/15 SNPs were female-specific (Supplementary table 3). The strongest association was observed for rs4903064 in females (ORfemale = 1.47 [95% CI = 1.33–1.62], Pfemale = 9 × 10⁻¹⁴ compared with ORmale = 1.09 [95% CI = 1.01–1.19], Pmale = 0.02; Pinteraction = 1.7 × 10⁻⁵, Table 1) at 14q24.2 mapping to an intronic region of DPF3 (Fig. 2). Other significant SNPs in discovery series, rs2121266 at 2p21, rs12930199 at 16p13.3 and rs1548141 at 3q11.2 mapped to the intronic regions of EPAS1, RBFOX1 and OR5H6, respectively. Significant SNPs rs10484683 and rs78971134 mapped to intergenic regions at 7p22.3 and 6q24.3, with the nearest genes being BTBD11 and SAMD5, respectively. For rs78971134 (SAMD5) the minor allele frequencies were similar for male and female cases. Regional LD plots for each of the loci are detailed in Supplementary Figure S4 (a) and (b). In contrast, the sex-interaction scan did not identify any SNP even at 30% FDR, except for the very rare variant rs141939233 (NC_000003.11:g.94783768 C > G, MAF = 0.001, P = 9.83 × 10⁻⁸) which did not meet the inclusion criteria for SNPs (MAF > 0.05) and hence, no SNP could be carried forward (Supplementary figure 5a, b). Overall, all putative variants showed either CED or SSE and no SNP with an OED could be identified from the analysis.
Fig. 1.

Sex stratified genome-wide association scan in renal cell carcinoma: Manhattan plots of male and female specific association P-values from the discovery series
Table 1.
Significant associations in the replication series and/or final joint meta-analysis
| SNP | HGVS Nomenclature (GRCh37) | Nearest gene | Reference Allele## | Alternate Allele | Effect Allele# | Discovery | Replication | Combined | |||||||||||
|---|---|---|---|---|---|---|---|---|---|---|---|---|---|---|---|---|---|---|---|
| Female (N = 5087) | Male (N = 8143) | Female (N = 2974) | Male (N = 8113) | Female (N = 8061) | Male (16,256) | ||||||||||||||
| OR (95% CI) | P | OR[95%CI] | P | OR[95%CI] | P | OR[95%CI] | P | OR [95% CI] | Meta P-value | Het Pvalue |
OR (95% CI) | Meta P-value | Het Pvalue |
||||||
| rs4903064 | NC_000014.8:g.73279420 T > C | DPF3** | T | C | C | 1.47 [1.33-1.62] | 9.0 × 10⁻¹⁴ | 1.09 [1.01–1.19] | 0.02 | 1.24 [1.07–1.42] | 0.003 | 1.09 [0.98–1.21] | 0.10 | 1.38 [1.27–1.50] | 1.5 × 10⁻¹⁴ | 0.10 | 1.09 [1.03–1.16] | 0.005 | 0.54 |
| rs2121266 | NC_000002.11:g.46535924 C > A | EPAS1** | C | A | C | 1.06 [0.97–1.15] | 0.20 | 1.2 [1.12–1.28] | 2.5 × 10⁻⁷ | 1.14 [1.00–1.30] | 0.03 | 1.15 [1.05–1.26] | 0.002 | 1.09 [1.01–1.17] | 0.02 | 0.001 | 1.18 [1.12–1.25] | 1.8 × 10⁻⁹ | 0.62 |
| rs147304092 | NC_000007.13:g.33442937 A > G | BBS9* | A | G | G | 0.62 [0.52–0.76] | 2.0 × 10⁻⁶ | 1.05 [0.91–1.22] | 0.49 | 0.97 [0.76–1.24] | 0.82 | 1.20 [1.00-1.43] | 0.05 | 0.72 [0.63-0.84] | 1.0 × 10⁻⁵ | 0.03 | 1.11 [0.99-1.24] | 0.08 | 0.54 |
| rs13027293 | NC_000002.11:g.120001118 G > T | STEAP3* | G | T | T | 1.23 [1.12–1.35] | 8.0 × 10⁻⁶ | 0.96 [0.89–1.03] | 0.28 | 0.87 [0.77–1.00] | 0.04 | 1.00 [0.91–1.10] | 0.95 | 1.10 [1.02–1.19] | 0.01 | 1.6 × 10⁻⁴ | 0.97 [0.92–1.03] | 0.37 | 0.52 |
| rs6554676 | NC_000005.9:g.1233350 A > T | SLC6A18* | A | T | A | 0.62 [0.51–0.77] | 6.0 × 10⁻⁶ | 0.81 [0.69–0.95] | 0.008 | 0.80 [0.61–1.05] | 0.11 | 0.81 [0.67–0.99] | 0.04 | 0.68 [0.58–0.81] | 6.1 × 10⁻⁶ | 0.07 | 0.81 [0.72–92] | 0.001 | 0.67 |
| rs10484683 | NC_000006.11:g.148152077 A > G | SAMD5** | A | G | G | 0.96 [0.87–1.07] | 0.48 | 0.8 [0.74–0.88] | 4.7 × 10⁻⁷ | 1.04 [0.89-1.21] | 0.63 | 0.93 [0.82-1.04] | 0.20 | 0.98 [0.90-1.07] | 0.68 | 2.9 × 10⁻⁴ | 0.83 [0.78-0.89] | 1.7 × 10⁻⁸ | 0.20 |
| rs78971134 | NC_000012.11:g.107652531 A > G | BTBD11** | A | G | G | 0.91 [0.78–1.06] | 0.23 | 0.69 [0.61–0.79] | 4.5 × 10⁻⁸ | 0.97 [0.78–1.20] | 0.78 | 0.87 [0.74–1.03] | 0.10 | 0.93 [0.82–1.06] | 0.26 | 0.21 | 0.75 [0.68–0.83] | 1.6 × 10⁻⁸ | 0.15 |
** indicates association identified at < 5% FDR and * indicates association identified at < 30% FDR in the discovery series;
OR [95% CI] Odds Ratio [95% confidence interval]; Meta P-Value Meta-analysis P-value; Het P-value heterogeneity P-value among studies, HGVS Human Genome Variation Society
## Reference and alternate alleles as given by dbSNP, # Allele for which the effect size was calculated
Fig. 2.

Regional plot of the most significant sex-specific loci: P-values and LD among SNPs at 14q24.2 mapping to the DPF3 gene in women and men
In the in-silico replication of the 17 selected SNPs, only rs4903064 (at DPF3) independently replicated with stronger and significant (p < 0.05) effect in women compared with men (ORfemale = 1.24 [95% CI = 1.07–1.42], Pfemale = 3 × 10⁻³ compared with ORmale = 1.09 [0.98–1.21], Pmale = 0.09). In addition rs147304092 (BBS9), rs13027293 (STEAP3), rs6554676 (SLC6A18) showed nominally significant association with RCC risk for either men or women in the follow-up series (Table 1).
In the joint meta-analysis of the discovery and replication series for the selected 17 SNPs, a total of 4 SNPs attained genome-wide significance (Table 1). In addition to the consistent findings for DPF3, we found a stronger association for males for EPAS1 but with significant study heterogeneity in the female dataset. Two additional SNPs that reached genome-wide significance in the joint meta-analysis were rs10484683 at SAMD5 and rs78971134 near BTBD11 showing an association with risk for men but not women (Table 1). The results of replication and final meta-analysis of all the 17 SNPs are listed in supplementary table 3.
We also examined sex-specific expression of genes corresponding to the selected SNPs using expression data in normal and tumour kidney tissues from a subset of the discovery cohort. Significant sex-difference in expression was detected for BTBD11 gene in normal tissues and also a higher expression of SAMD5 in tumour tissues of women (Supplementary table 4). We replicated the findings for sex difference in expression between men and women for SAMD5 in TCGA KIRC cohort and also observed significant differential expression between tumour and normal samples (Supplementary figure 6). We further tested the effect of the identified SNPs on expression of nearby genes by detecting cis expression quantitative trait loci (eQTL) in kidney tissues. No significant eQTL was identified for any of the 17 SNP-transcript pairs in normal tissues (supplementary table 5), but we identified rs4903064 as the lead cis-eQTL for DPF3 expression in tumours with highest colocation posterior probability with the GWAS signal (Supplementary figure S7). We further examined sex-specific cis-eQTLs and found a stronger association of rs4903064 on DPF3 for women compared with men (βwomen = 0.06, Pwomen = 2.69 × 10⁻⁶ vs βmen = 0.03, Pmen = 0.004, Psex_interaction = 0.03 Fig. 3). A borderline association was also observed for rs6554676 and SLC6A18 expression in male tumour tissues only (βmale = −0.21, Pmale = 0.05 vs βfemale = −0.01, Pfemale = 0.94).
Fig. 3.
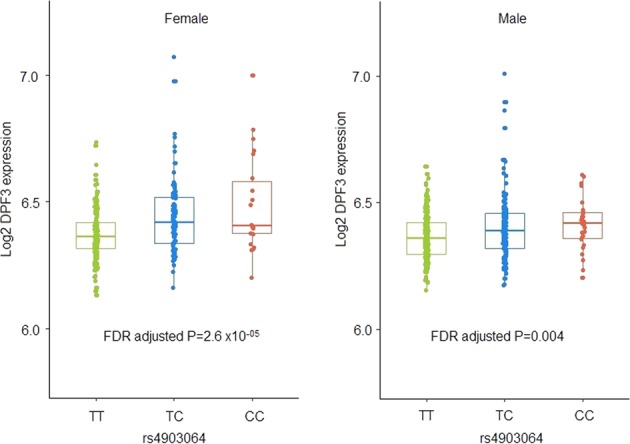
cis-eQTL: boxplot displaying expression levels of DPF3 gene stratified by the risk SNP rs4903064 in women and male kidney tumour tissues
Discussion
We conducted the first systematic sex-specific genome-wide association analysis of RCC and confirmed sexually dimorphic associations for two previously known risk SNPs on DPF3 and EPAS1 at 14q24 and 2p21, respectively. In a joint meta-analysis of top hits using 8,061 women and 16,256 men, we also identified two additional suggestive SNPs (rs10484683 at SAMD5 and rs78971134 near BTBD11) with possible sex-specific associations – both being associated with a risk for men, and with no strong evidence of association for women.
The SNP rs4903064 at DPF3 gene was previously reported to be associated with increased RCC risk in a large GWAS [12], and our analysis confirms the previous reports of its sex-specific association. We further provide evidence that the association might be mediated through expression of the gene, with the magnitude of the association between the SNP and expression being greater for women than men. Polymorphisms at intron 1 of DPF3 are also associated with increased risk of breast cancer for women of European origin, but the SNPs were not in linkage disequilibrium with rs4903064 [21]. DPF3 is a histone acetylation and methylation reader of the BAF and PBAF chromatin remodelling complexes. Other components of the complexes like BAP1 and PBRM1 are frequently mutated in RCC and show sex differences in their mutation frequency and association with survival [22]. Chromatin-remodelling complexes regulate gene expression and loss of these chromatin modifiers has been associated with characteristic gene expression signatures in RCC [23, 24]. Sexually dimorphic gene expression is frequent in both murine [25] and human [6, 26] kidney normal and tumour tissues, and is hypothesised to contribute to the mechanism underlying sex-difference in kidney diseases including cancer [5, 27]. Therefore, variants of chromatin remodelling complex associated genes might modify RCC risk differently for men and women through sex-specific gene expression but the exact mechanism remains speculative and requires detailed functional studies in vitro.
The SNP rs2121266 mapping to intron 1 of the EPAS1 gene is in strong linkage disequilibrium (r2 = 0.97, D′ = 1.00) to the previously described risk SNP rs11894252 at 2p21 [8]. Our finding of a stronger association for men is in agreement with previous findings of stronger associations for the proxy SNP rs11894252 for men (ORmale = 1.18 compared with ORfemale = 1.06, Pinteraction = 0.03) in RCC. Additionally, sexually dimorphic associations for EPAS1 variants were also observed for rs13419896 in lung squamous cell carcinoma [28] and rs4953354 in lung adenocarcinoma [29] in two independent reports from a Japanese population. EPAS1 (HIF2α) is a key gene in RCC and functions as a transcription factor in the VHL–HIF signalling axis [30, 31]. The intron 1 of EPAS1 contains oestrogen response elements (EREs) and oestrogen-dependent downregulation of EPAS1 occurs in invasive breast cancer cells [32]. RCC related polymorphisms near other important genes like CCND1, MYC/PVT1 have been found on enhancers at tissue-specific HIF-binding loci in renal tubular cells [33, 34], implying a role for HIF in transactivation of key oncogenic pathways in RCC. Although rs2121266 and rs11894252 were not eQTLs for EPAS1, it is possible that the role of these polymorphisms in sex hormone mediated regulation of EPAS1 and transactivation of downstream genes may result in sex-specific susceptibility to RCC.
Two other SNPs that reached genome-wide significance in the joint analysis of discovery and replication series, namely rs10484683 at SAMD5 and rs78971134 near BTBD11 have not been previously reported to be associated with risk of RCC. For rs10484683 (SAMD5), the sex-specific finding from the discovery stage was driven by MAF differences in the controls only. Hence, the result remains unclear and might be the reason that the apparent association did not replicate. The SNP rs10484683 was not a significant cis eQTL in normal or tumour kidney tissues in our series, but expression of SAMD5 varied significantly between tumour samples from men and women. Also, a significant overexpression of SAMD5 in tumours from current and TCGA datasets suggests its potential role in RCC pathogenesis. Although not previously implicated in RCC, SAMD5 overexpression has been found to be associated with bile duct and cholangiocarcinoma [35]. BTBD11 gene codes for an ankyrin repeat and BTB/POZ domain-containing protein involved in regulation of proteolysis and protein ubiquitination. Functional implications of this gene is not well known in RCC, but SNPs near the BTBD11 gene were previously reported to be associated with kidney function traits [36] and diabetic kidney diseases [37] by large genome-wide studies, however, these SNPs were not in LD with the current risk variant rs78971134.
We confirmed sex-specific genetic associations of known RCC risk SNPs and identified new suggestive associations for one sex or the other. No clear pattern of an increased risk for men or decreased risk for women could be observed in the top sexually dimorphic SNPs, as would be otherwise anticipated for explaining the 2:1 sex ratios. Therefore, these SNPs are not conclusive for untangling the sex-specific genetic susceptibility that might contribute to the sex ratio in incidence. Due to technical constraints we could not examine sex chromosomal associations in the current study. Even given its large sample size, a drawback of the study is its limited statistical power to detect subtle sex-specific associations (SSEs or CEDs), particularly when analysing men and women separately. A male-specific association may simply reflect the lack of power to detect association in women, owing to the smaller sample size for women compared with men. To increase the power to detect sex-specific associations, the combination of results from different GWAS in sex-stratified meta-analyses is warranted. In addition to large well powered sex-specific genetic studies, multi-omics approaches studying both autosomes and sex chromosomes and their interaction with sex hormones might help to unravel the endogenous causes of sex bias in sexually dimorphic traits and diseases like RCC.
Supplementary information
Acknowledgements
We thank all of the participants who took part in this research and the funders and support staff who made this study possible. Funding for the genome-wide genotyping was provided by the US National Institutes of Health (NIH), National Cancer Institute (U01CA155309) for those studies coordinated by IARC, and by the intramural research program of the National Cancer Institute, US NIH, for those studies coordinated by the NCI. MD Anderson GWAS was supported by NIH (grant R01 CA170298) and the Center for Translational and Public Health Genomics, Duncan Family Institute for Cancer Prevention and Risk Assessment, The University of Texas MD Anderson Cancer Center. Funding for the IARC gene expression and eQTL study was provided by the US National Institutes of Health (NIH), National Cancer Institute (U01CA155309). RSL received IARC Postdoctoral fellowship from the IARC, partially supported by EC FP7 Marie Curie Actions – People – Co- Funding of regional, national and international programmes (COFUND). DCM is supported by a Cancer Research UK Population Research Fellowship. MMCI- supported by MH CZ - DRO (MMCI, 00209805).
Data availability
Genome-wide summary statistics are made available through the NHGRI-EBI GWAS Catalog https://www.ebi.ac.uk/gwas/downloads/summary-statistics. Data from the first IARC GWAS scan included in the study are available from Paul Brennan upon reasonable request. The data from second IARC scan are accessible on dbGaP: (phs001271.v1.p1). The first and second NCI scans are accessible on dbGaP (phs000351.v1.p1 and phs001736.v1.p1 respectively). Data from the MDA scan is available from Xifeng Wu upon reasonable request.
Compliance with ethical standards
Conflict of interest
The authors declare that they have no conflict of interest.
Footnotes
Publisher’s note: Springer Nature remains neutral with regard to jurisdictional claims in published maps and institutional affiliations.
Supplementary information
The online version of this article (10.1038/s41431-019-0455-9) contains supplementary material, which is available to authorized users.
References
- 1.Znaor A, Lortet-Tieulent J, Laversanne M, Jemal A, Bray F. International variations and trends in renal cell carcinoma incidence and mortality. Eur Urol. 2015;67:519–30. doi: 10.1016/j.eururo.2014.10.002. [DOI] [PubMed] [Google Scholar]
- 2.Lopez-Beltran A, Scarpelli M, Montironi R, Kirkali Z. 2004 WHO classification of the renal tumors of the adults. Eur Urol. 2006;49:798–805. doi: 10.1016/j.eururo.2005.11.035. [DOI] [PubMed] [Google Scholar]
- 3.Scelo Ghislaine, Li Peng, Chanudet Estelle, Muller David C. Variability of Sex Disparities in Cancer Incidence over 30 Years: The Striking Case of Kidney Cancer. European Urology Focus. 2018;4(4):586–590. doi: 10.1016/j.euf.2017.01.006. [DOI] [PubMed] [Google Scholar]
- 4.Bray FCM, Mery L, Piñeros M, Znaor A, Zanetti R and Ferlay J, editors. Cancer Incidence in Five Continents, 2017, Vol. XI (electronic version).
- 5.Clocchiatti A, Cora E, Zhang Y, Dotto GP. Sexual dimorphism in cancer. Nat Rev Cancer. 2016;16:330–9. doi: 10.1038/nrc.2016.30. [DOI] [PubMed] [Google Scholar]
- 6.Yuan Y, Liu L, Chen H, Wang Y, Xu Y, Mao H, et al. Comprehensive characterization of molecular differences in cancer between male and female patients. Cancer Cell. 2016;29:711–22. doi: 10.1016/j.ccell.2016.04.001. [DOI] [PMC free article] [PubMed] [Google Scholar]
- 7.Haas NB, Nathanson KL. Hereditary kidney cancer syndromes. Adv Chronic Kidney Dis. 2014;21:81–90. doi: 10.1053/j.ackd.2013.10.001. [DOI] [PMC free article] [PubMed] [Google Scholar]
- 8.Purdue MP, Johansson M, Zelenika D, Toro JR, Scelo G, Moore LE, et al. Genome-wide association study of renal cell carcinoma identifies two susceptibility loci on 2p21 and 11q13.3. Nat Genet. 2011;43:60–65. doi: 10.1038/ng.723. [DOI] [PMC free article] [PubMed] [Google Scholar]
- 9.Wu X, Scelo G, Purdue MP, Rothman N, Johansson M, Ye Y, et al. A genome-wide association study identifies a novel susceptibility locus for renal cell carcinoma on 12p11.23. Hum Mol Genet. 2012;21:456–62. doi: 10.1093/hmg/ddr479. [DOI] [PMC free article] [PubMed] [Google Scholar]
- 10.Henrion M, Frampton M, Scelo G, Purdue M, Ye Y, Broderick P, et al. Common variation at 2q22.3 (ZEB2) influences the risk of renal cancer. Hum Mol Genet. 2013;22:825–31. doi: 10.1093/hmg/dds489. [DOI] [PMC free article] [PubMed] [Google Scholar]
- 11.Henrion MY, Purdue MP, Scelo G, Broderick P, Frampton M, Ritchie A, et al. Common variation at 1q24.1 (ALDH9A1) is a potential risk factor for renal cancer. PLoS ONE. 2015;10:e0122589. doi: 10.1371/journal.pone.0122589. [DOI] [PMC free article] [PubMed] [Google Scholar]
- 12.Scelo G, Purdue MP, Brown KM, Johansson M, Wang Z, Eckel-Passow JE, et al. Genome-wide association study identifies multiple risk loci for renal cell carcinoma. Nat Commun. 2017;8:15724. doi: 10.1038/ncomms15724. [DOI] [PMC free article] [PubMed] [Google Scholar]
- 13.Gudmundsson J, Sulem P, Gudbjartsson DF, Masson G, Petursdottir V, Hardarson S, et al. A common variant at 8q24.21 is associated with renal cell cancer. Nat Commun. 2013;4:2776. doi: 10.1038/ncomms3776. [DOI] [PubMed] [Google Scholar]
- 14.Winkler TW, Justice AE, Graff M, Barata L, Feitosa MF, Chu S, et al. Correction: The influence of age and sex on genetic associations with adult body size and shape: a large-scale genome-wide interaction study. PLoS Genet. 2016;12:e1006166. doi: 10.1371/journal.pgen.1006166. [DOI] [PMC free article] [PubMed] [Google Scholar]
- 15.Zhuang JJ, Morris AP. Assessment of sex-specific effects in a genome-wide association study of rheumatoid arthritis. BMC Proc. 2009;3(Suppl 7):S90. doi: 10.1186/1753-6561-3-S7-S90. [DOI] [PMC free article] [PubMed] [Google Scholar]
- 16.Randall JC, Winkler TW, Kutalik Z, Berndt SI, Jackson AU, Monda KL, et al. Sex-stratified genome-wide association studies including 270,000 individuals show sexual dimorphism in genetic loci for anthropometric traits. PLoS Genet. 2013;9:e1003500. doi: 10.1371/journal.pgen.1003500. [DOI] [PMC free article] [PubMed] [Google Scholar]
- 17.Price AL, Patterson NJ, Plenge RM, Weinblatt ME, Shadick NA, Reich D. Principal components analysis corrects for stratification in genome-wide association studies. Nat Genet. 2006;38:904–9. doi: 10.1038/ng1847. [DOI] [PubMed] [Google Scholar]
- 18.Pruim RJ, Welch RP, Sanna S, Teslovich TM, Chines PS, Gliedt TP, et al. LocusZoom: regional visualization of genome-wide association scan results. Bioinformatics. 2010;26:2336–7. doi: 10.1093/bioinformatics/btq419. [DOI] [PMC free article] [PubMed] [Google Scholar]
- 19.Magi R, Morris AP. GWAMA: software for genome-wide association meta-analysis. BMC Bioinf. 2010;11:288. doi: 10.1186/1471-2105-11-288. [DOI] [PMC free article] [PubMed] [Google Scholar]
- 20.Hormozdiari F, van de Bunt M, Segre AV, Li X, Joo JWJ, Bilow M, et al. Colocalization of GWAS and eQTL signals detects target genes. Am J Hum Genet. 2016;99:1245–60. doi: 10.1016/j.ajhg.2016.10.003. [DOI] [PMC free article] [PubMed] [Google Scholar]
- 21.Hoyal CR, Kammerer S, Roth RB, Reneland R, Marnellos G, Kiechle M, et al. Genetic polymorphisms in DPF3 associated with risk of breast cancer and lymph node metastases. J Carcinog. 2005;4:13. doi: 10.1186/1477-3163-4-13. [DOI] [PMC free article] [PubMed] [Google Scholar]
- 22.Ricketts CJ, Linehan WM. Gender specific mutation incidence and survival associations in clear cell renal cell carcinoma (CCRCC) PLoS ONE. 2015;10:e0140257. doi: 10.1371/journal.pone.0140257. [DOI] [PMC free article] [PubMed] [Google Scholar]
- 23.Cancer Genome Atlas Research N. Comprehensive molecular characterization of clear cell renal cell carcinoma. Nature. 2013;499:43–49. doi: 10.1038/nature12222. [DOI] [PMC free article] [PubMed] [Google Scholar]
- 24.Kapur P, Pena-Llopis S, Christie A, Zhrebker L, Pavía-Jiménez A, Rathmell WK, et al. Effects on survival of BAP1 and PBRM1 mutations in sporadic clear-cell renal-cell carcinoma: a retrospective analysis with independent validation. Lancet Oncol. 2013;14:159–67. doi: 10.1016/S1470-2045(12)70584-3. [DOI] [PMC free article] [PubMed] [Google Scholar]
- 25.Kwekel JC, Desai VG, Moland CL, Vijay V, Fuscoe JC. Sex differences in kidney gene expression during the life cycle of F344 rats. Biol Sex Differ. 2013;4:14. doi: 10.1186/2042-6410-4-14. [DOI] [PMC free article] [PubMed] [Google Scholar]
- 26.Brannon AR, Haake SM, Hacker KE, Pruthi RS, Wallen EM, Nielsen ME, et al. Meta-analysis of clear cell renal cell carcinoma gene expression defines a variant subgroup and identifies gender influences on tumor biology. Eur Urol. 2012;61:258–68. doi: 10.1016/j.eururo.2011.10.007. [DOI] [PMC free article] [PubMed] [Google Scholar]
- 27.Huby RD, Glaves P, Jackson R. The incidence of sexually dimorphic gene expression varies greatly between tissues in the rat. PLoS ONE. 2014;9:e115792. doi: 10.1371/journal.pone.0115792. [DOI] [PMC free article] [PubMed] [Google Scholar]
- 28.Putra AC, Eguchi H, Lee KL, Yamane Y, Gustine E, Isobe T, et al. The A Allele at rs13419896 of EPAS1 is associated with enhanced expression and poor prognosis for non-small cell lung cancer. PLoS ONE. 2015;10:e0134496. doi: 10.1371/journal.pone.0134496. [DOI] [PMC free article] [PubMed] [Google Scholar]
- 29.Iwamoto S, Tanimoto K, Nishio Y, Putra AC, Fuchita H, Ohe M, et al. Association of EPAS1 gene rs4953354 polymorphism with susceptibility to lung adenocarcinoma in female Japanese non-smokers. J Thorac Oncol. 2014;9:1709–13. doi: 10.1097/JTO.0000000000000309. [DOI] [PubMed] [Google Scholar]
- 30.Riazalhosseini Y, Lathrop M. Precision medicine from the renal cancer genome. Nat Rev Nephrol. 2016;12:655–66. doi: 10.1038/nrneph.2016.133. [DOI] [PubMed] [Google Scholar]
- 31.Gossage L, Eisen T, Maher ER. VHL, the story of a tumour suppressor gene. Nat Rev Cancer. 2015;15:55–64. doi: 10.1038/nrc3844. [DOI] [PubMed] [Google Scholar]
- 32.Fuady JH, Gutsche K, Santambrogio S, Varga Z, Hoogewijs D, Wenger RH. Correction: Estrogen-dependent downregulation of hypoxia-inducible factor (HIF)-2alpha in invasive breast cancer cells. Oncotarget. 2017;8:20516. doi: 10.18632/oncotarget.16388. [DOI] [PMC free article] [PubMed] [Google Scholar]
- 33.Grampp S, Platt JL, Lauer V, Salama R, Kranz F, Neumann VK, et al. Genetic variation at the 8q24.21 renal cancer susceptibility locus affects HIF binding to a MYC enhancer. Nat Commun. 2016;7:13183. doi: 10.1038/ncomms13183. [DOI] [PMC free article] [PubMed] [Google Scholar]
- 34.Schodel J, Bardella C, Sciesielski LK, Brown JM, Pugh CW, Buckle V, et al. Common genetic variants at the 11q13.3 renal cancer susceptibility locus influence binding of HIF to an enhancer of cyclin D1 expression. Nat Genet. 2012;44:420–5. doi: 10.1038/ng.2204. [DOI] [PMC free article] [PubMed] [Google Scholar]
- 35.Yagai T, Matsui S, Harada K, Inagaki FF, Saijou E, Miura Y, et al. Expression and localization of sterile alpha motif domain containing 5 is associated with cell type and malignancy of biliary tree. PLoS ONE. 2017;12:e0175355. doi: 10.1371/journal.pone.0175355. [DOI] [PMC free article] [PubMed] [Google Scholar]
- 36.Hwang SJ, Yang Q, Meigs JB, Pearce EN, Fox CS. A genome-wide association for kidney function and endocrine-related traits in the NHLBI’s Framingham Heart Study. BMC Med Genet. 2007;8(Suppl 1):S10. doi: 10.1186/1471-2350-8-S1-S10. [DOI] [PMC free article] [PubMed] [Google Scholar]
- 37.Iyengar SK, Sedor JR, Freedman BI, Kao WH, Kretzler M, Keller BJ, et al. Genome-wide association and trans-ethnic meta-analysis for advanced diabetic kidney disease: family investigation of nephropathy and diabetes (FIND) PLoS Genet. 2015;11:e1005352. doi: 10.1371/journal.pgen.1005352. [DOI] [PMC free article] [PubMed] [Google Scholar]
Associated Data
This section collects any data citations, data availability statements, or supplementary materials included in this article.
Supplementary Materials
Data Availability Statement
Genome-wide summary statistics are made available through the NHGRI-EBI GWAS Catalog https://www.ebi.ac.uk/gwas/downloads/summary-statistics. Data from the first IARC GWAS scan included in the study are available from Paul Brennan upon reasonable request. The data from second IARC scan are accessible on dbGaP: (phs001271.v1.p1). The first and second NCI scans are accessible on dbGaP (phs000351.v1.p1 and phs001736.v1.p1 respectively). Data from the MDA scan is available from Xifeng Wu upon reasonable request.