

SUMMARY
Structural and transcriptional changes during early brain maturation follow fixed developmental programs defined by genetics. However, whether this is true for functional network activity remains unknown, primarily due to experimental inaccessibility of the initial stages of the living human brain. Here, we developed human cortical organoids that dynamically change cellular populations during maturation, and exhibited consistent increases in electrical activity over the span of several months. The spontaneous network formation displayed periodic and regular oscillatory events that were dependent on glutamatergic and GABAergic signaling. The oscillatory activity transitioned to more spatiotemporally irregular patterns, while synchronous network events resembled features similar to those observed in preterm human electroencephalography. These results show that the development of structured network activity in a human neocortex model may follow stable genetic programming. Our approach provides opportunities for investigating and manipulating the role of network activity in the developing human cortex.
Keywords: cortical organoids, network oscillations, stem cells, single-cell transcriptomics, phase-amplitude coupling, preterm electroencephalography
GRAPHICAL ABSTRACT
eTOC
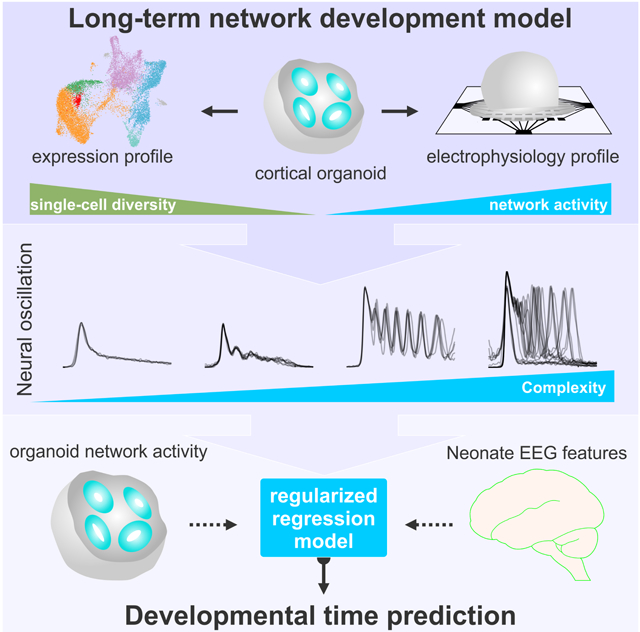
Oscillatory activity is a candidate mechanism for how neural populations are temporally organized. Cortical organoids exhibit periodic and highly regular nested oscillatory network events that were dependent on glutamatergic and GABAergic signaling. The emerging development of network activity transitions to more spatiotemporally complex activity, capturing features of preterm infant electroencephalography.
INTRODUCTION
Diverse and hierarchical cellular networks develop into circuits with patterns of functional spatiotemporal activity to form the human brain. Neural oscillations, a prominent, rhythmic brain signal found across species, robustly track behavioral and disease states, and have long been leveraged in systems neuroscience due to their ubiquity and accessibility (Buzsaki and Draguhn, 2004; de Hemptinne et al., 2015; Fries, 2005; Henriques and Davidson, 1991; Khan et al., 2013; Uhlhaas and Singer, 2010). These complex network dynamics emerge early in development, and is unclear if shaped exclusively by biological programming prenatally (Blankenship and Feller, 2010; Johnson, 2001; Power et al., 2010). In vitro and in vivo rodent studies have shown that a conserved repertoire of organized network activity, such as traveling waves, giant depolarizing potentials, and early network oscillations, develops according to a consistent timeline prior to and immediately after birth (Allene et al., 2008; Khazipov and Luhmann, 2006; Uhlhaas et al., 2010). However, due to an inability to interrogate the electrophysiology of intact embryonic brains, it remains unknown whether the same happens in humans. As a result, our knowledge about human brain functional development rests upon observations from nonhuman model systems.
Organoids generated from induced pluripotent stem cells (iPSC) have emerged as a scaled-down and three-dimensional model of the human brain, mimicking various developmental features at the cellular and molecular levels (Camp et al., 2015; Cederquist et al., 2019; Giandomenico et al., 2019; Lancaster and Knoblich, 2014; Lancaster et al., 2013; Luo et al., 2016; Mariani et al., 2012; Paşca et al., 2015; Qian et al., 2016; Renner et al., 2017; van de Leemput et al., 2014; Xiang et al., 2019; Xiang et al., 2017). Despite recent advances in the understanding of their cellular diversity, there is no evidence that these organoids develop complex and functional neural network activity that resembles early human brain formation (Birey et al., 2017; Giandomenico et al., 2019; Quadrato et al., 2017). Therefore, researchers have not yet clearly determined whether brain organoids are a suitable model for neural network dynamics (Kelava and Lancaster, 2016; Pasca, 2018).
Here, we use human iPSCs to generate cortical organoids that exhibit evolving cellular transcriptional profile and nested oscillatory network dynamics over the span of several months. We subsequently investigated the molecular basis of human oscillatory activity formation, maintenance, and temporal control. Finally, we applied supervised machine learning with cross-validation to evaluate the similarity between electrophysiological network activity patterns of the in vitro model and human preterm neonatal electroencephalogram (EEG). Our findings suggest that organoid models are suitable for the investigation of the physiological basis of network formation at early and late stages of the human brain development. This prolonged evaluation of cortical organoid activity expands our understanding of the emergence of network-level neurodynamics in humans.
RESULTS
Generation of functional cortical organoids
Despite the structural and transcriptional similarities between brain organoids and the developing nervous system, the emergence of higher-level complex network activity comparable to the living human brain remains largely untested (Figure 1A). To investigate the formation of a functional network, we promoted cortical specification by previously described protocols (Paşca et al., 2015; Thomas et al., 2017; Yoon et al., 2019) (Figure 1B, see Methodsfor details). At the beginning of differentiation, an abundance of proliferative neural progenitor cells (NPCs) (expressing Ki67, SOX2 and Nestin) that self-organized into a polarized neuroepithelium-like structure was observed. Similar to human cortical development in vivo, the proliferative zone around a lumen delimited by β-catenin+ cells was surrounded by progenitor cells. Progressively, the organoids increased in size and in the proportion of mature neurons (expressing NeuN and MAP2) to ultimately develop into concentric multilayer structures composed of NPCs, intermediate progenitors (TBR2, also known as EOMES), and lower (CTIP2, also known as BCL11B) and upper (SATB2) cortical layer neurons (Figure 1C-E and S1). The neurons exhibit dendritic protrusions and synaptic ultrastructure (Figure 1F and 1G). After 6 months, inhibitory neurons can also be observed (calretinin CR, also known as CALB2; GABAB; NKX2.1, also known as TTF1; GABA; LHX6; somatostatin SST and parvalbumin PV) (Figure 1D and S1). Although the initial fraction of GFAP-positive cells was less than 5%, this population increased to about 30-40% after 6 months of differentiation (Figure 1D and 1E).
Figure 1. Cellular and molecular development of human cortical organoids.

(A) Overview of human neural network formation and dynamics evaluation using cortical organoids. (B) Schematic of the protocol used to generate cortical organoids. Scale bar, 200 μm. (C) Organoid growth during different developmental stages. (D) Representative immunostainings showing proliferating NPCs (Ki67 and Nestin), lower (TBR1 and CTIP2) and upper (SATB2) cortical layer neurons, glial cells (GFAP) and GABAergic (CR) neurons overtime. Scale bar, 50 μm. (E) Population analysis of specific markers indicating stages of maturation and multiple neuronal subtypes. The data are shown as mean ± s.e.m. (n = 8). (F) Representative image of a pyramidal neuron; dendritic structures are observed in cells transduced with the SYN:EGFP reporter (scale bar, 5 μm). (G) Electron microscopy of synaptic ultrastructure in 4-month cortical organoids (blue). Scale bar, 200 nm. (H) Uniform manifold approximation and projection (UMAP) plot of 15,990 cells from integrating datasets on 1-, 3-, 6-, and 10-month cortical organoids. Colors denote cells sampled from four different time points. (I) UMAP plot of the integrated datasets colored by seven main cell clusters. Red as GABAergic neurons, orange as glutamatergic neurons, blue as glia cells, green as intermediate progenitors, purple as progenitors, green blue as mitotic cells, and grey as others. (J) Separate UMAP plots of integrated data by different time points. Same color scheme used for main cell clusters. (K) Dot plots showing cluster specific gene expression across main cell clusters. (L) UMAP plots showing expression levels of cell-type specific markers (see Figure S1 for additional markers). (M) Barplots of proportion of cell types at individual time points.
To characterize the cellular diversity of cortical organoids during development, we performed single-cell RNA-seq on 1-, 3-, 6-, and 10-month organoids (Figure 1H-M, Figure S1 and Table S1). We used unsupervised clustering on the combined dataset of 15,990 cells to identify clusters and their relative abundance at distinct time points. Based on the expression gene markers, we combined smaller subclusters into five major cell classes: progenitors, intermediate progenitors, glial cells, glutamatergic neurons and GABAergic neurons. Based on this annotation, 1-month organoids consisted of > 70% progenitor cells (expressing SOX2 and PAX6) (Figure 1J and 1M). At the 3- and 6-month stage, cortical organoids comprised mainly glia (SLC1A3) and glutamatergic neurons (GRIA2 and SNAP25) (Figure 1J and 1M). The glial cells started with a small population, and increased to around 40% of cells present in the cortical organoids. Remaining populations of progenitors (around 5%) and intermediate progenitors (around 10%) were present throughout the maturation. A fraction of glutamatergic neurons at the 3- and 6-month time point expressed subunits of GABAergic receptors such as GABRB3 (Figure S1C). This expression of GABAergic receptors predates the appearance of interneurons.
GABAergic neurons were mainly restricted to 6- to 10-month organoids as indicated by expression of GAD2 (also known as GAD65), DLX1 and DLX5 (Figure 1J-M, Figure S1C and D), reaching around 15% of the total neuronal population after 10 months of maturation, consistent with its presence later in the in vivo development (Uylings et al., 2002). The molecular profile of GABAergic neurons was further evaluated by single-cell transcriptomics (Figure S1E) and by the presence of protein markers (Figure S1F). To further demonstrate the biosynthesis of GABA during the maturation process, we employed metabolomics liquid chromatography coupled to mass spectrometry (Gertsman et al., 2014). The neurotransmitter GABA was detected in the culture media of cortical organoids after 6 months of maturation (Figure S1G), in a physiological relevant concentration (Van Hove and Thomas, 2014). These results suggest the presence of the basic components for the generation of a neural network in a developing human cortical in vitro model.
Emergence of nested oscillatory network activity
In addition to the observed cellular diversity and expression of synaptic markers, we interrogated the presence of functional network activity. Starting at a single cellular level, we used whole-cell patch-clamp recording from 6-month cortical organoids (Figure S2 A-E). The action potential firing activity and the voltage-dependent Na+ current were tetrodotoxin (TTX) sensitive. Application of glutamate receptor antagonists (NBQX and AP5) fully inhibited the spontaneous excitatory postsynaptic currents recorded at −60 mV, confirming the presence of functional excitatory neurons.
To further evaluate the cortical organoid functionality in a mesoscopic level, we performed weekly extracellular recordings of spontaneous electrical activity using multielectrode arrays (MEA). Cortical organoids were plated per well in 8 wells of a MEA plate containing 64 low-impedance (0.04 MΩ) platinum microelectrodes with 30 μm of diameter spaced by 200 μm, yielding a total of 512 channels. We separately analyzed single-channel and population firing characteristics derived from channel-wise spike times and the local field potential (LFP), a measure of aggregate synaptic currents and other slow ionic exchanges (Buzsáki et al., 2012) (Figure 2A). The spikes, also refer here as events, were defined by the event unit waveforms standard structure with typical refractory periods and by pharmacological intervention. These spikes or events from each channel do not represent putative single-unit action potentials, but represent multi-unit activity (MUA). Since both the spatial and temporal resolution of MEA sampling is sparse, single-unit spike trains were not isolated, instead submitting channel-wise and whole-well activity for further analysis, rather than individual event trains. Over the course of 10 months, cortical organoids exhibited consistent increases in electrical activity, as parametrized by channel-wise firing rate, burst frequency, and synchrony (Figure 2B-D and Figure S2F-I), which indicates a continually-evolving neural network. Additionally, the variability between replicates over 40 weeks of differentiation was significantly lower compared to iPSC-derived neurons in monolayer cultures (Figure 2C inset and Figure S2J).
Figure 2. Oscillatory network dynamics in long-term cortical organoids.

(A) Schematic of the organoid signal processing pipeline. Raw MEA data is analyzed as population spiking and LFP separately. Synchronous network events are highlighted in yellow. (B) Raster plot of network spiking activity after 1.5 and 6 months of maturation. A 3-s interval of activity over 5 channels is shown in the upper right corners. (C) Cortical organoids show elevated and continuously increasing mean firing rate compared to 2D monolayer neurons (n = 8 for organoid cultures, and n = 12 for 2D neurons). Inset, correlation of the firing rate vector over 12 weeks of differentiation (from 8 to 20) between pairs of cultures showing reduced variability among organoid replicates. (D) Temporal evolution of cortical organoid network activity. Detailed definitions and further parameters are presented in Figure S2. (E) Time series of population spiking and LFP during network events in cortical organoid development. Each overlaid trace represents a single event during the same recording session. The number of subpeaks during an event (F) is maximized and stereotypical at 6-months, developing nonlinearly and following an inverted-U trajectory. (G) Network variability, measured as the coefficient of variation of the inter-event interval, increases monotonically throughout development. (H) 1-4 Hz oscillatory power in the LFP increases up to the 25th week in culture and plateaus at 30 weeks. Inset, oscillatory power is calculated by fitting a straight line (dashed) over the aperiodic portion of the PSD and taken as the height of narrow peaks rising above the linear fit. (I) Pairwise correlation of LFP across all electrodes (coherence) within a well during network events initially increase, then decreases after 30 weeks. (J) An example of sequential frames during a network event show the spatial propagation of wave spreading, then disappearing again after 100ms. The data shown in C, D, F, G, H, and I are presented as mean ± s.e.m. *P < 0.05, **P < 0.01, ***P < 0.001, unpaired Student’s t-test (C), quadratic (F, H and I) and linear (G) regression.
During individual recordings, cultures displayed a robust pattern of activity, switching between long periods of quiescence and short bursts of spontaneous network-synchronized spiking (hereafter referred to as “network events”). These network events were periodic (~0.05 Hz) but infrequent early in development (~2 months), occurring roughly every 20 seconds and decayed monotonically after the initial onset (Figure 2E). From 4-months onwards, a secondary peak emerged 300-500 ms after the initial network activation, leading to the presence of a nested faster oscillatory (2-3 Hz) pattern up to 6-months in culture (Figure 2F and Figure S3A-F). Notably, this robust fast timescale nested oscillation was not observed in 3D neurospheres, suggesting that the spherical arrangement of neurons is insufficient for the emergence of nested oscillations (Figure S3G-J). The regular oscillatory activity during network events transitioned to stronger, yet more variable, oscillations over time. To quantify this network complexity, we tracked the regularity (coefficient of variation of inter-event intervals, CV) and the spatial and temporal correlation between spontaneous network events. The inter-event interval CV consistently increased over 10 months of differentiation (Figure 2G), from extremely regular latencies (CV ≅ 0) at 2 months to irregular, Poisson-like (CV ≅ 1) at 10 months. This indicates increased variability between consecutive network events initiation. Additionally, spatial and temporal irregularity on a shorter time-scale (within-event) also increased with development, suggesting a breakdown of deterministic population dynamics from the onset of network events.
Periodic oscillatory activity is often defined as a “bump” over the characteristic 1/f background in the power spectral density (PSD) of extracellular signals above-and-beyond the aperiodic 1/f signal (Buzsaki et al., 2013; Gao et al., 2017). In organoid LFPs, we observed both prominent oscillatory peaks in the low-frequency range (1-4 Hz) and in the aperiodic signal characteristic of neural recordings (Ben-Ari, 2001; Voytek et al., 2015). The development of oscillatory activity in cortical organoids over time was quantified by computing the PSD for each LFP recording (Figure 2H, inset). Oscillatory power in the delta range (1-4 Hz) increased for up to 24 weeks in culture, tapering off slightly in subsequent recordings and plateauing during the last 10 weeks. This inverted-U trajectory reflects the network’s initial acquisition of oscillatory modes at steady frequencies and the dispersion of this regularity at later time points. The LFP results reveal the development of the cortical organoid cultures across different network states: from sparse activity with extreme rigidity and regularity, to one that acquires repetitive and regular oscillatory patterns (Voytek and Knight, 2015), until it finally reaches a stage of higher spatiotemporal complexity and variability that is reminiscent of self-organized networks (Tetzlaff et al., 2010) (Figure 2I,J and Figure S3C-F).
Oscillatory coordination of neural ensembles and its synaptic mechanisms
Oscillatory dynamics have been postulated to coordinate spiking across neural ensembles. In the LFP and other mesoscopic brain signals, this manifests as a phenomenon known as cross-frequency phase-amplitude coupling (PAC) (Voytek and Knight, 2015), wherein the high-frequency content of the LFP is entrained to the phase of slow oscillations (Manning et al., 2009; Miller et al., 2007; Mukamel et al., 2005). In the cortical organoids, we observed greater PAC between oscillatory delta (1-4 Hz) and broadband gamma activity (100-400 Hz, see Methods) during network events compared to quiescent periods (Figure 3A-C). This broadband gamma is non-oscillatory, but has been shown to be an LFP surrogate of population spiking (Manning et al., 2009; Miller et al., 2007).
Figure 3. Cortical organoid serves as a model of functional oscillations and their synaptic mechanisms.

(A-C) Phase-amplitude coupling is observed in organoid LFP during network events. (A) Example of raw LFP during a network event decomposed into its low-frequency component (1-4 Hz delta) and the amplitude envelope of the high-frequency, broadband gamma component (200-400 Hz). Analysis was repeated for 100-200 Hz with near identical effect size and significance. (B) Normalized gamma amplitude binned by delta phase during network events (black) shows greater modulation depth by low frequency delta than during non-event periods (red). (C) Phase-amplitude coupling during network events is significantly greater than non-event periods in all batches. (D) Effect of selective drug treatments on neuronal electrical activity in 6-month organoids. Representative raster plots and burst measurements of untreated and treated organoids. The pharmacological manipulation was performed using cortical organoid plated on 4 MEA wells (n = 4, cortical organoid culture for each treatment). Scale bar, 20 s. Exposure to AP5 + CNQX, baclofen and muscimol reversibly extinguish the network bursts (synchrony), while no changes were promoted by bicuculline. (E-F) Pharmacological perturbation of oscillatory activity during network events in 6-month organoids. Pre and post refer to before treatment administration and after administration, respectively. Application of bicuculline and picrotoxin increases the number of network events, while CNQX + AP5 and baclofen completely abolish synchronized network events. Bicuculline blocks oscillatory network activity but not the network event itself. Data are shown as mean ± s.e.m.; unpaired Student’s t-test.
We further evaluated the role of glutamatergic and GABAergic synaptic transmission in forming oscillations by pharmacological intervention. Organoid neural networks were susceptible to both glutamate receptor antagonists (AP5 and CNQX; NMDA and AMPA/kainate, respectively) and GABA receptor agonists (muscimol, GABAA; baclofen, GABAB) by significantly reducing the number of spikes events and bursts, with a subsequent extinction of synchronous activity. The electrical activity was abolished in the presence of TTX (Figure 3D and 3E). Blockade of GABAergic transmission by bicuculline increased the number of network-synchronized events and did not affect peak population firing rates, but abolished nested 2 Hz oscillatory activity by erasing subsequent reverberant peaks (Figure 3F).
Cortical organoid network development resembles some preterm EEG features
Despite emergence of complex oscillatory network activity in organoids, it is unclear whether the spontaneous developmental trajectory observed is representative of programmed early neurodevelopment. While network activity from cortical organoids does not exhibit the full temporal complexity seen in adults, the pattern of alternating periods of quiescence and network-synchronized events resembles electrophysiological signatures present in preterm human infant EEG. During trace discontinu (Tolonen et al., 2007), quiescent periods are punctuated by high-amplitude oscillations (spontaneous activity transients, SATs) lasting a few seconds. Intervals of complete quiescence disappear as infants become of term, and the EEG is dominated by continuous and low-amplitude desynchronized activity in adult brains (Figure 4A, Figure S4A and B).
Figure 4. Cortical organoid network dynamics mimic premature neonates after 28 weeks of maturation.

(A) Representative LFP trace from cortical organoid, highlighting instances of network events (yellow). Comparable events between periods of quiescence (discontinuous network dynamics) are shown in human preterm neonate EEG at 35 weeks gestational age, while a different pattern of continuous activity is observed in adult EEG. SAT: spontaneous activity transient. (B) Examples of analogous features in preterm neonate EEG and organoid LFP show various levels of similarity throughout development. RMS: root mean square; 50%/95% refer to 50th and 95th percentile of feature distribution within a recording. (C) Pearson’s correlation coefficients between age and electrophysiological features (mean ± std of bootstrapped distribution) for both organoid and premature neonates show different degrees of developmental similarity for individual features (12 total selected). For example, SATs (events) per hour shows remarkable similarity over time between organoid and neonates. (D) Schematic of machine learning procedure for age prediction: EEG features from 39 premature neonates (n = 567 recordings) between 25- and 38-weeks PMA (post-menstrual age) were used to train and cross-validate a regularized regression model (ElasticNet), optimizing for preterm neonate age prediction based on their EEG features only (top). The model was clamped after training, and applied directly on organoid LFP features and control datasets, including held-out preterm neonate data, mouse primary culture, 2D iPSC culture, and human fetal brain culture. (E) Model-predicted developmental time (y-axis, age in weeks) follows actual weeks-in-culture (x-axis) for organoids (orange and blue), as well as true age of held-out preterm neonate data points (black). Dashed line represents unity, signifying perfect prediction. Large circles on solid lines and shaded regions denote mean ± std of prediction, respectively, while dots indicate per-sample prediction (n = 8 for organoids at all time points). (F) Pearson’s correlation coefficient between predicted and actual developmental time for organoid, and control datasets. Significant positive correlations indicate the model’s ability to capture developmental trajectory in a particular dataset.
Due of the inability to interrogate the electrophysiology of intact human embryonic brains, we attempted to quantitatively compare network activity in cortical organoids to preterm human EEG. We analyzed a publicly available dataset of 101 serial EEG recordings from 39 preterm infants ranging from 24 to 38 weeks post-menstrual age (PMA); 567 data points total (Stevenson et al., 2017). The dataset contains 23 precomputed features for each EEG record, ranging from timing, rate, and variability of SATs (or bursts), as well as spectral power in canonical oscillatory bands (delta, theta, etc., see Table S2 for full list of features). We computed analogous features from each organoid LFP recording when appropriate. It is important to note that the biophysics of scalp EEG is drastically different from extracellular field potential in the organoid, due to factors such as spatial filtering by the scalp and orientation of neuronal populations in relation to the recording electrode. Therefore, we selected a subset of 12 features to compare in the organoid LFP (highlighted in Table S2), the majority of those correspond to duration and timing of SATs. While features like EEG standard deviation (or root mean square, RMS) and interhemispheric synchrony are likely altered by skull thickening during early development, the large amplitude network synchronous events are reliably detected in both EEG and LFP. Timing features derived from SAT times (duration, inter-SAT interval, etc.) were compared between cortical organoid and preterm neonates.
By comparing specific timing features between cortical organoids and preterm infants, we found a range of correlations in the developmental trajectory of features with age, as well as similarities in development between the two datasets (Figure 4B and C). For instance, “SATs per hour” (“events per hour” in organoids, Figure 4B) and 95-percentile of inter-SAT duration distribution showed high similarity both in absolute value and their developmental trajectory (correlation with age), while “root-mean-square SAT duration” and median (50%) SAT duration show different trends and absolute value, from 25 to 38 weeks in both datasets (all features presented in Figure S4C and D). To compare the similarity of developmental trajectory quantitatively, we computed the average resampled correlation between each feature and developmental time in both datasets (Figure 4C and Figure S4D, see Methods for details). These results summarize what is shown in Figure 4B: SATs per hour consistently increase during development in both organoids and preterm infants, while the variability of SAT duration (TSAT RMS) consistently decrease. Other features show inconsistent developmental trajectories over time between organoid LFPs and preterm EEGs.
Taking in consideration the wide range of similarities observed across the two datasets, we asked which features’ developmental trajectory were most informative of the developmental time, and whether those were conserved between organoids and preterm infants. To accomplish this in an objective fashion, we trained a regularized regression model with cross-validation (ElasticNet, L1 and L2 regularized), to predict preterm infant age from their EEG features. In other words, the regression model was only optimized to predict preterm infant age based on their EEG, and was blind to the organoid data. Following training and hyperparameter selection, the regression model was “locked” while we directly applied it on the organoid LFP dataset and various control datasets to obtain their predicted developmental time (Figure 4D).
Although the regression model predicted organoid developmental time poorly before 25 weeks (Figure 4E, orange), and with high variability, mean predicted developmental time followed true age with much higher fidelity after 25 weeks (blue). A subset of the preterm EEG data held out during training was used to further validate the performance of the model (black), in addition to other control datasets, including mouse primary culture, iPSC monolayer culture, and human fetal brain culture (Figure S4E, details in Methods). To quantify how well developmental trend over time was captured by the regression model, we compute the Pearson correlation coefficient between the model-predicted age and the true age of the various datasets. Note that a significant positive correlation was only observed for organoid and held-out EEG datasets (Figure 4F). While the developmental trajectory of cortical organoids is not identical to, and more variable than, that of the fetal human brain, the two populations share similarities in how their network electrophysiological properties change over time, suggesting genetically programmed developmental timelines that can be detected by a simple machine learning algorithm.
DISCUSSION
While brain organoids have been shown to mimic early human neurodevelopment at the cellular and molecular levels, evidence of network activity maturation and the corresponding cellular basis have not been previously explored. Here, we report the formation of small-scale functional electrophysiological networks in human cortical organoids while tracking their gene expression profile and cellular composition over time. Single cell RNA-seq at multiple time points spanning 10 months show development of various cellular subclusters, transitioning from progenitor cells to neuronal and glial populations.
Cortical organoids begin to exhibit highly synchronous and stereotypical network activity (events) at 2 months, which transition into 2-3 Hz rhythmic activity by 4 to 6 months. Subsequently, network activity becomes more variable spatiotemporally, coinciding with the development of inhibitory populations. Oscillatory activity at 6 months exhibits cross-frequency coupling, a potential signature of functional neuronal network communication; pharmacological intervention demonstrates the causal involvement of glutamate and GABA in generating and sustaining oscillations. Finally, we observe similarities in the developmental trajectory of some electrophysiological features between organoids and human preterm infants, where a machine learning model trained to predict neonatal age from their EEG features can predict organoid developmental timeline. Taken altogether, these results demonstrate the utility of human stem cell-derived brain organoids as a viable neuroscience research model, not only for the shifting landscape of molecular and cellular composition, but also for the maturation of functional activity in brain networks during early neurodevelopment.
Diversity of excitatory and inhibitory populations
We used longitudinal single-cell transcriptional profiling followed by immunostaining and functional validation to demonstrate the cellular dynamics of cortical organoids during long-term development, revealing an unprecedented diversity of cell types. Notably, GABAergic neurons were mainly restricted to 6- to 10-month organoids, reaching around 10-15% of the total neuronal population after 10 months, consistent with its presence later in the in vivo development (Uylings et al., 2002). A metabolomic identification of GABA released in the culture media was further used to validate the presence and functionality of the GABAergic system. While our aim was not to investigate the origin of GABAergic neurons in the human neocortex, we cannot exclude the possibility of aberrant cellular differentiation, warranting further dissection of the cortical organoid model for novel neurodevelopmental pathways. The dynamic cell population and the presence of neurotransmitter systems suggest the activity of the basic components for the emergence of a neural network in a developing in vitro model.
Synchronous oscillations as a signature of functional network activity
The presence and changes of oscillations at fast timescales (>1 Hz) is a hallmark of the in vivo brain, while coupling across different frequencies has been proposed to coordinate the flow of information across regions (Buzsaki, 2004; Fries, 2005; Voytek et al., 2015). With the cellular components for the generation of a functional neural network in place, we tested if the cortical organoids display activity typically found in organized cortical networks. Robust extracellular electrical activity was observed at earlier stages and progressively developed into an organized oscillatory network. Cortical organoids initially exhibited periodic and highly regular nested oscillatory network events that were dependent on glutamatergic and GABAergic signaling. Our data suggest that GABA transmission is crucial for the maintenance, but not the initiation of faster oscillatory activity. This is consistent with accounts of inhibition rhythmically coordinating pyramidal populations’ activity during early development (Opitz et al., 2002). Additionally, during periods of high network activity, the power of high-frequency (>100 Hz) activity is coupled to the phase of the 3 Hz oscillation in the local field potential. Without positing its functional role, this observation suggests that more complex oscillatory activity can indeed manifest and be studied in this in vitro system.
It is also unclear the biological basis of the increased variability in the number of spontaneous events in organoid cultures, especially after 28 weeks in culture. We believe that different factors could increasingly introduce variability or diversity into the neural population during maturation. In this context, since we started with single cells that aggregate to form organoids, small population differences at early stages of organoid formation could lead to changes in activity. Differences in the organoid positioning on the MEA and manipulation could also affect the signal acquisition. Additionally, we do not exclude the possibility of the formation of independent network profiles based on intrinsic activity and retro-feedback properties.
Comparing to the early developing brain: insights and limitations
Some features of early network dynamics in humans (e.g., spontaneous activity transients, SATs) can be recapitulated by the in vitro model, with no additional constraints other than structural and genetic similarities. The regularized regression model presented here was built on preterm EEG data only, following an internal cross-validation procedure to estimate the hyperparameters. It was then directly applied to organoid LFP data – previously unseen by the classifier – to produce a “predicted developmental time”, in addition to data from several other cellular models for validation. Simultaneous MEA and EEG seizure recordings, in human subjects, share common features in the EEG frequency range (Schevon et al., 2012). However, when comparing the in vitro MEA and neonatal EEG features, it is crucial to remove any comparison of features affected by the spatial filtering properties of the skull. Moreover, there are a few factors that might challenge the interpretation of the regression model results. First, it is difficult to control external variation in infant EEG due to differences that may arise from the EEG acquisition system and electrodes positioning. Second, clinical confounds due to potential neurological condition and medications may also impact the dataset. Lastly, it is important to highlight that the regression model cannot be extended to neurotypical adult, as adult EEGs do not display the observed bursting patterns under normal conditions, thus the relevant features (e.g., SAT timing features) cannot be computed. Nonetheless, while we do not claim functional equivalence between the organoids and a full cortex – neonatal or adult – the current results represent the first step towards an in vitro model that captures some of the complex and oscillatory spatiotemporal dynamics of the human brain.
Conclusion
Given the potential roles of synchronized and oscillatory network dynamics in coordinating information flow between developed brain regions (Uhlhaas et al., 2010), these results highlight the potential for cortical organoids to advance our understanding of functional electrophysiology. Additionally, by applying spiking and LFP analysis that is traditional to animal models, our findings offer a link between microscale organoid physiology and systems neuroscience. Finally, considering the diversity and maturation of cell types generated, the robustness of the neuronal networks, the presence of structural traits of mature neurons and the possibility of using sensory experience to modulate neuronal activity collectively, cortical organoids may be used to model cellular interactions and neural circuit dysfunctions related to neurodevelopmental and neuropsychiatric pathologies. Importantly, this organoid model is small, approximately one million times smaller than the human brain, but ethical implications cannot be ignored about the future possibility of larger and more complex organoids (Farahany et al., 2018). Nevertheless, our findings illuminate a link between microscale organoid physiology and systems neuroscience. This offers a promising, small-scale experimental model of human neocortex to help address neurodevelopmental pathologies that affect millions of people, but otherwise lack an existing animal model.
STAR METHODS
LEAD CONTACT AND MATERIALS AVAILABILITY
This study did not generate new unique reagents.
Further information and requests should be addressed to and will be fulfilled by the Lead Contact, Alysson R. Muotri (muotri@ucsd.edu).
EXPERIMENTAL MODELS
Human cell source.
iPSC lines derived from control individuals have been previously characterized elsewhere (Nageshappa et al., 2016; Tang et al., 2016). iPSC colonies were expanded on Matrigel-coated dishes (BD Biosciences, San Jose, CA, USA) with mTeSR1 medium (StemCell Technologies, Vancouver, Canada). The cells were routinely checked by karyotype and CNV arrays to avoid genomic alterations in the culture. Embryonic samples were obtained from fetus brains and cultured in Neurobasal (Life Technologies, Carlsbad, CA, USA) supplemented with GlutaMAX (Life Technologies), 1% Gem21 NeuroPlex (Gemini Bio-Products, West Sacramento, CA, USA), 1% MEM nonessential amino acids (NEAA; Life Technologies), 1% penicillin/streptomycin (PS; Life Technologies). The study was approved by the University of California San Diego IRB/ESCRO committee (protocol 141223ZF).
Rodent cell source.
Newborn mouse primary culture was performed as described elsewhere (Moore et al., 2019). The cells were maintained in Neurobasal medium with GlutaMAX, 1% Gem21 NeuroPlex, 1% NEAA and 1% PS. The study was approved by the University of California San Diego IACUC committee (protocol S09005).
METHODS DETAILS
Generation of cortical organoids.
Feeder-free iPSCs were fed daily with mTeSR1 for 7 days. Colonies were dissociated using Accutase (Life Technologies) in PBS (1:1) for 10 minutes at 37 °C and centrifuged for 3 minutes at 150 x g. The cell pellet was resuspended in mTeSR1 supplemented with 10 μM SB431542 (SB; Stemgent, Cambridge, MA, USA) and 1 μM Dorsomorphin (Dorso; R&D Systems, Minneapolis, MN, USA). Approximately 4 × 10⁶ cells were transferred to one well of a 6-well plate and kept in suspension under rotation (95 rpm) in the presence of 5 μM ROCK inhibitor (Y-27632; Calbiochem, Sigma-Aldrich, St. Louis, MO, USA) for 24 hours to form free-floating spheres. After 3 days, mTeSR1 was substituted by Media1 [Neurobasal (Life Technologies) supplemented with GlutaMAX, 1% Gem21 NeuroPlex (Gemini Bio-Products), 1% N2 NeuroPlex (Gemini Bio-Products), 1% NEAA (Life Technologies), 1% PS (Life Technologies), 10 μM SB and 1 μM Dorso] for 7 days. Then, the cells were maintained in Media2 [Neurobasal with GlutaMAX, 1% Gem21 NeuroPlex, 1% NEAA and 1% PS] supplemented with 20 ng/mL FGF2 (Life Technologies) for 7 days, followed by 7 additional days in Media2 supplemented with 20 ng/mL of FGF2 and 20 ng/mL EGF (PeproTech, Rocky Hill, NJ, USA). Next, cells were transferred to Media3 [Media2 supplemented with 10 ng/mL of BDNF, 10 ng/mL of GDNF, 10 ng/mL of NT-3 (all from PeproTech), 200 μM L-ascorbic acid and 1 mM dibutyryl-cAMP (Sigma-Aldrich) to promote maturation, gliogenesis and activity]. After 7 days, cortical organoids were maintained in Media2 for as long as needed, with media changes every 3-4 days.
Neurosphere generation.
The neurosphere generation protocol was published elsewhere (Nageshappa et al., 2016). Briefly, iPSC were dissociated using Accutase (Life Technologies), centrifuged and resuspended in medium (IMDM medium, 15 % fetal bovine serum, 2 mM L-glutamine, 1 % NEAA, 1 mM sodium pyruvate, 100 U PS, 200μg/mL iron-saturated transferrin, 10 μM β-mercaptoethanol, 50 μg/mL ascorbic acid; supplemented with 10 μM SB (Stemgent) and 1 μM Dorso (R&D Systems) on a “low-attachment” plate for embryoid body (EB) formation. After 8 days, the EBs were plated for rosette formation and expansion of neural progenitors in the presence of defined medium DMEM/F-12 supplemented with Gem21 NeuroPlex (Gemini Bio-Products) and 20 ng/mL of FGF2. For neurosphere generation, 4,000 neural progenitors were seeded on “low-attachment” plate under rotation with no FGF2. The neurospheres were developed for around 8 weeks prior MEA plating.
Mycoplasma testing.
All cellular cultures were routinely tested for mycoplasma by PCR. Media supernatants (with no antibiotics) were collected, centrifuged, and resuspended in saline buffer. Ten microliters of each sample were used for a PCR with the following primers: Forward: GGCGAATGGGTGAGTAAC; Reverse: CGGATAACGCTTGCGACCT. Only negative samples were used in the study.
Immunofluorescence staining.
Cortical organoids were fixed with 4 % paraformaldehyde overnight at 4 °C and then transferred to 30 % sucrose. After the 3D structures sink, they were embedded in O.C.T. (Sakura, Tokyo, Japan) and sliced in a cryostat (20 μm slices). Following air dry, the slides containing the sliced samples were permeabilized/blocked with 0.1 % triton X-100 and 3% FBS in PBS for 2 hours at room temperature, and incubated with primary antibodies overnight at 4 °C. Primary antibodies used in this study were: mouse anti-Nestin, Abcam (Cambridge, UK) ab22035, 1:250; rat anti-CTIP2, Abcam ab18465, 1:500; rabbit anti-SATB2, Abcam ab34735, 1:200; chicken anti-MAP2, Abcam ab5392, 1:2000; rabbit anti-Synapsin1, EMD-Millipore AB1543P, 1:500; mouse anti-NeuN, EMD-Millipore MAB377, 1:500; rabbit anti-Ki67, Abcam ab15580, 1:1000; rabbit anti-SOX2, Cell Signaling Technology 2748, 1:500; rabbit anti-GFAP, DAKO Z033429, 1:1000; rabbit anti-TBR1, Abcam ab31940, 1:500; rabbit anti-TBR2, Abcam ab23345, 1:500; rabbit anti-beta-catenin, Abcam E247, 1:200; mouse anti-GABA, Abcam ab86186, 1:200; mouse anti-GABA B Receptor 1, Abcam ab55051, 1:100; mouse anti-Parvalbumin, Millipore MAB1572, 1:500; rabbit anti-Calretinin, Abcam ab92341, 1:200; rat anti-Somatostatin, Millipore MAB354, 1:100; rabbit anti-TTF1 (NKX2.1), Abcam ab76013, 1:200. Next, the slices were washed with PBS and incubated with secondary antibodies (Alexa Fluor 488-, 555- and 647-conjugated antibodies, Life Technologies, 1:1000) for 2 hours at room temperature. The nuclei were stained using DAPI solution (1 μg/mL). The slides were mounted using ProLong Gold antifade reagent and analyzed under a fluorescence microscope (Axio Observer Apotome, Zeiss).
Electron microscopy (EM).
EM was performed at the CMM Electron Microscopy Facility at University of California San Diego. Four-month organoids were immersed in modified Karnovsky’s fixative (2.5 % glutaraldehyde and 2 % paraformaldehyde in 0.15 M sodium cacodylate buffer, pH 7.4) for at least 4 hours, post fixed in 1% osmium tetroxide in 0.15 M cacodylate buffer for 1 hour and stained in 2 % uranyl acetate for 1 hour. Samples were dehydrated in ethanol, embedded in Durcupan epoxy resin (Sigma-Aldrich), sectioned at 50 to 60 nm on a Leica Ultracut UCT (Leica, Bannockburn, IL), and transfer onto Formvar and carbon-coated copper grids. Sections were stained with 2 % uranyl acetate for 5 minutes and Sato's lead stain for 1 minute. Grids were analyzed using a JEOL 1200EX II (JEOL, Peabody, MA) transmission electron microscope equipped with a Gatan digital camera (Gatan, Pleasanton, CA).
10X genomics single-cell and analysis.
Cortical organoids were manually dissociated and sorted for single-cell RNA-seq analysis on the same day. Dissociated cells were first placed on ice, diluted in 2-5 ml of cell media and then treated with flavopiridol (5 μM, Sigma-Aldrich) to arrest transcriptional activity. Cells were then stained with the DNA-dyes DAPI (300 nM, Invitrogen) and DRAQ5 (2.5 μM, Thermo-Fischer) and incubated on ice for 10 minutes prior to sorting. Cells were sorted using a SH800 sorter (Sony) into 50 μL of cell media using a gating strategy that first isolated large, cell-sized particles and then sorted based on viability. Sorted cells were pelleted (3 min, 100 x g, 4 °C) and resuspended in 40 μL of fresh cell media. Cell concentration was determined and the minimum population viability threshold for downstream single cell RNA-seq processing was set at 80%.
Single cell RNA-seq libraries were constructed using the Chromium Single Cell 3’ v2 Library kit (10x Genomics, (Zheng et al., 2017) according to manufacturer descriptions; approximately 12,000 cells were loaded per sample. Reverse transcription and other amplification steps were carried out on a T100 thermal cycler (Bio-Rad). After reverse transcription, GEMs (Gel beads in emulsion) were lysed and cDNA was cleaned up with MyOne Silane Beads (Thermo Fisher Scientific). Single stranded cDNA was PCR-amplified for 12 cycles and purified using SPRIselect Reagent Kit (Beckman Coulter). Next, cDNA was enzymatically fragmented followed by double size selection with SPRIselect Reagent Kit (B23317, Beckman Coulter). Subsequently, adaptors were ligated and libraries were constructed by PCR. Another round of double size selection was performed using SPRIselect Reagent Kit to generate final libraries with a size of 200-700bp. Final libraries were quantified using Qubit dsDNA HS Assay Kit (Thermo Fisher Scientific) and size distribution was measured using Tapestation (High Sensitivity D1000, Agilent). Average fragment size of successful libraries was 500 bp. The libraries were loaded at a concentration of 13 pM and sequenced on a Hiseq 4000 sequencer (Illumina) with the following parameters (Read1 26 cycles; Index 1 8 cycles; Read 2 98 cycles).
Raw sequencing data from 1, 3, 6, 10-month organoids were preprocessed with Cell Ranger software (version 2.1.1, 10X Genomics, Pleasanton). Reads were aligned to hg38 human reference genome (Zerbino et al., 2018) and the feature-barcode matrix was generated. The secondary analysis performed on the feature-barcode matrix was processed via the Seurat v2.0 package (Butler et al., 2018). For the analysis of individual time points, all genes that were not detected in at least 5 cells and cells with less than 200 genes detected were discarded. The additional filtering was based on gene-UMI distribution and percentage of mitochondrial reads. The filtered matrix was log-normalized and scaled to 10,000 transcripts per cell. Variable genes across the single cells were identified with the FindVariableGenes function and unwanted sources of variation, such as UMI counts per cell, percent of mitochondrial reads, were regressed out with the ScaleData function. Dimension reduction of the pre-processed matrix was performed by principal component analysis (PCA). The number of principal components was identified based on a strong enrichment of genes with low p-values, which were computed by a resampling test. This procedure was implemented with the JackStraw function in Seurat. With the selected dimensions, cellular distance matrix was first organized into a K-nearest neighbor (KNN) graph and then partitioned into clusters with Louvain algorithm via the FindClusters function. Finally, cells within the graph-based clusters were co-localized on the UMAP plot (McInnes L, 2018) of two dimensions by the RunUMAP function. Identifying top differentially expressed genes for each cluster was performed using the FindAllMarkers function.
Datasets from the four time points were merged with the MergeSeurat function and then the merged matrix was used as an input to the Seurat v3 anchoring procedure, which assembles datasets into an integrated reference by identifying cell pairwise correspondences for single cells across different datasets. Further analysis was processed with Seurat v3.0 package (Stuart et al., 2018). Default parameters including a dimensionality of 30 were set to run the FindIntegrationAnchors and IntegrateData function. On the integrated datasets, clustering was performed with a resolution parameter set to be 1.0 and a dimensionality of 30 by FindNeighbors and FindClusters. With the graph-based clustering, a total of 14 clusters were generated, which were further merged into seven main clusters based on expression of marker genes. UMAP plots displayed by the DimPlot function were used to visualize and explore the integrated datasets. Dot plots and UMAP plots for transcript abundance of marker genes were made using ggplot2 package (Wickham, 2016), while the barplot was created with graphics v3.5.3 package (Murrell, 2005). The dot plots show the percentage of cells that express more than one transcript for each gene and its log-normalized expression level across main cell clusters. Violin plots for marker gene expression across all clusters were produced with the VlnPlot function.
Mass spectrometry.
Samples were assayed using an adaptation of published protocol (Gertsman et al., 2014). Cortical organoid media (100 μL) was mixed with 2 μM 13C4-4- aminobutyric acid, as internal standard. Metabolites were extracted using 80 % ice-cold methanol. After incubation for 30 min at −20 °C, samples were deproteinized at 4 °C by centrifugation at 17,136 × g for 10 minutes. Supernatants were evaporated to dryness in a centrifugal evaporator at 36 °C (Savant SPD121P Spe ed-Vac concentrator. Thermo Fisher, Asheville, NC) and reconstituted in 100 μL of 10 % methanol in water + 0.1 % formic acid, by means of consecutive vortexing, orbital shaking and sonication. 5 uL of which were injected into a Sciex 4500 triple quadrupole mass spectrometer (Sciex, Foster City, California, USA) to determine 4-aminobutyric acid (GABA) concentration. Chromatographic separations were conducted a 3 μm ACE C18-PFP reversed-phase HPLC column (Mac-mod analytical, Chadds Ford, PA, USA) using an Acquity binary pump (Waters, Milford, MA, USA) equipped with an inline degasser at 0.3 mL/min flow-rate and at 13 °C, to enhance the retention of the low-retained compounds, by means of a simple binary gradient of acetonitrile partitioning in 3 % acetonitrile in water, both containing 0.1 % formic acid. Compounds were eluted during the first 3 minutes, then it ramped to 100%. Total run time was 45 minutes. Positive electrospray ionization multiple reaction monitoring transitions were optimized for GABA (and 13C4-GABA), m/z 104.2>87 (108.2>90.9) and m/z 104.2>68.9 (108.2>73), using collision energies of 15 and 23, respectively, and unit mass resolution. GABA concentrations were calculated by interpolation using an 8-point calibration curve, spanning 0.01 to 0.2 μM, constructed by supplementing medium with the appropriate amounts of GABA. Quantification was conducted using MultiQuant 2.1 software (Sciex, Foster City, CA, USA).
Whole-cell patch-clamp.
Whole-cell patch-clamp recordings were performed from cells of cortical organoids in a similar condition as for MEA recordings: 6- to 8-week cortical organoids were plated on 35 mm dishes that were previously coated with 100 μg/mL poly-L-ornithine and 10 μg/ml laminin. Cells were fed twice a week and have been maintained for 24 weeks. The extracellular solution for patch-clamp experiments contained (in mM) the following: 130 NaCl, 3 KCl, 1 CaCl2, 1 MgCl2, 10 HEPES, and 10 glucose; pH 7.4 with 1 M NaOH (~4mM Na+ added). The internal solution for patch electrodes contained (in mM) the following: 138 K-gluconate, 4 KCl, 10 Na2-phosphocreatine, 0.2 CaCl2, 10 HEPES (Na+ salt), 1 EGTA, 4 Mg-ATP, 0.3 Na-GTP; pH 7.4 with 1 M KOH (~3 mM K+ added). The osmolarity of all solutions was adjusted to 290 mOsm. Electrodes for electrophysiological recording were pulled on a Flaming/Brown micropipette puller (Model P-87, Sutter Instrument, CA, USA) from filamented borosilicate capillary glass (1.2 mm OD, 0.69 mm ID, World Precision Instruments, FL, USA). The electrode resistances were 3–8 MΩ. Patch-clamp experiments were performed with an Axon CV-4 headstage and Axopatch 200A amplifier (Molecular Devices, CA, USA) at room temperature. Liquid junction potential correction (~10 mV) was not applied. Electrophysiology data were analyzed offline using pCLAMP 10 software (Molecular Devices, CA, USA).
Multi-electrode array (MEA) recording.
Two to three 6-week cortical organoids were plated per well in 12-well MEA plates (Axion Biosystems, Atlanta, GA, USA). Each well contains 64 low-impedance (0.04 MΩ) platinum microelectrodes with 30 μm of diameter spaced by 200 μm, yielding a total of 512 channels (8 wells containing organoids and 4 internal control). The plate was previously coated with 100 μg/mL poly-L-ornithine and 10 μg/mL laminin, and we performed four independent experiments in duplicates. Cells were fed twice a week and measurements were collected 24 hours after the medium was changed, once a week, starting at two weeks after plating (8 weeks of organoid differentiation). Recordings were performed using a Maestro MEA system and AxIS Software Spontaneous Neural Configuration (Axion Biosystems) with a customized script for band-pass filter (0.1-Hz and 5-kHz cutoff frequencies). Spikes were detected with AxIS software using an adaptive threshold crossing set to 5.5 times the standard deviation of the estimated noise for each electrode (channel). The plate was first allowed to rest for three minutes in the Maestro device, and then four minutes of data were recorded. For the MEA analysis, the electrodes that detected at least 5 spikes/min were classified as active electrodes using Axion Biosystems’ Neural Metrics Tool. Bursts were identified in the data recorded from each individual electrode using an inter-spike interval (ISI) threshold requiring a minimum number of 5 spikes with a maximum ISI of 100 ms. A minimum of 10 spikes under the same ISI with a minimum of 25 % active electrodes were required for network bursts in the well. The synchrony index was calculated using a cross-correlogram synchrony window of 20 ms. Bright-field images were captured to assess for cell density and electrode coverage.
Custom MEA analysis.
Custom MEA analysis and developmental time regression model can be found in: https://github.com/voytekresearch/OscillatoryOrganoids. Raw MEA recordings were converted to .mat files using Axion-provided functions and analyzed offline using custom MATLAB functions and scripts. Local field potential signals (LFP) from each of the 64 electrodes were generated by low-pass filtering (FIR filter) and downsampling raw signals from 12,500 Hz to 1,000 Hz (resample.m). Multi-unit spikes were detected as follows: each channel was first referenced to the well median for every time point, similar to a common average reference (64 channels). The median was used instead of the mean to avoid biasing the reference during high firing rate periods. Next, the re-referenced signal was bandpass filtered for 300-3,000 Hz with a 3rd-order Butterworth filter (butter.m). The adaptative spike threshold was set to be 5.5 standard deviations, where the standard deviation was estimated from the median as previously described (Quiroga (Quiroga et al., 2005) to avoid biasing the threshold for channels with high firing rates (thus an artificially high threshold). Spike timestamps were taken as the peak time after the absolute value of the signal crossed the threshold, but at least 1 ms from another spike (findpeaks.m) Spike timestamps were then converted into binary vectors (1 ms bin size), summed across 64 channels, and smoothed (conv.m) with a normalized 100-point (0.1 s) Gaussian window (gausswin.m) to create a population spiking vector for each MEA well. Note that spikes from each channel do not represent putative single-unit action potentials, as the spatial resolution of MEA electrodes were too sparse. Multi-unit spiking was not sorted since total population spiking (of well) was submitted for further analysis, rather than individual spike trains.
Network event analysis.
A network event was detected when population spiking was i) greater than 80% of the maximum spiking value over the length of the recording; ii) at least 1 spike/s; and iii) 1 second away from any other network events. The first peak after all 3 criteria was satisfied was marked as t = 0, and the window of data from 0.5 s before to 2.5 s after the peak was collected as the network event, as events almost always subsided 2.5 seconds after onset by both algorithmic detection and visual inspection. Nearly all spiking channels experienced a significant firing rate increase during network events. LFP data from all 64 channels from the same timeframe were also collected for analysis. All events from different MEA wells obtained on the same recording day were aggregated for statistical analysis and plotting. Subpeaks within an event were identified using findpeaks.m, where a subpeak must satisfy the following: i) peak height of at least 25% of the first peak; ii) peak width of at least 50 ms; iii) at least 200 ms away from the previous peak; and iv) peak prominence of 1 over Peak 1 height. Subpeak time and the height relative to the initial peak were recorded. The inter-event interval coefficient of variation (IEI CV) was calculated as the standard deviation of the inter-event interval divided by its mean, where IEI is the time between consecutive network events within the same MEA well. Event temporal correlation was calculated as the mean Pearson correlation coefficient of population spiking vector between each pair of network event in the same MEA well across a single recording session. Event spatial correlation was calculated as the mean Pearson correlation coefficient between all pairs of 64 LFP channels during each 3-s network event.
Oscillatory spectral power analysis.
Power spectral density (PSD) estimates were computed using Welch’s method (pwelch.m), with a window length of 2 s and overlap of 1 s. Oscillatory power was defined as peaks in the PSD above the aperiodic 1/f power law decay. Thus, for each channel, a straight line was fit over the PSD in double-log space between 0.5-20 Hz using robust fit (robustfit.m), and oscillatory power was computed as the difference between the mean log PSD power and the mean log fitted power (baseline), over 2.5-4.5 Hz. This method accounts for non-oscillatory changes, such as slow transients or the aperiodic 1/f background component, whereas standard wavelet filtering methods will confound the two (Haller et al., 2018).
Phase Amplitude Coupling (PAC).
LFP data from all 64 channels of each well was first lowpass/bandpass filtered (eegfilt.m, EEGLAB) for delta (0-4 Hz) and high-frequency, broadband (100-400 Hz) activity, sometimes referred to as high gamma. Delta phase was extracted by taking the phase angle of the bandpassed delta signal Hilbert transform (hilbert.m, angle.m), while gamma power was extracted by taking the squared magnitude of the filtered gamma. Gamma power was smoothed with the same delta-band filter for display purposes, but not for subsequent analysis. Note that analysis was performed for 100-200 Hz and 200-400 Hz separately, as LFP spectrum follows an inverse power law (1/f), and grouping a wide frequency band (100-400 Hz) together would bias power estimates towards lower frequency limits (~100 Hz). To compute PAC, instantaneous delta phase was binned into 20 equidistant bins between - π and π, and gamma power was sorted based on the corresponding delta phase at the same sample time and averaged across the same phase bin. This procedure was performed separately for event and non-event indices, where event indices are the same 3-second windows as described above in Network Event Analysis, while all other times are considered as non-event time points. Modulation Index was computed as the Kullback-Leibler divergence between the sum-normalized distribution of gamma power across phase bins and a uniform distribution (Tort et al., 2010). Figure 3C presents well-averaged MI across all 64 channels. For visualization in Figure 3B, the binned gamma power vector for each channel was circularly shifted such that the phase of maximum gamma power was −π.
Pharmacology.
The pharmacological manipulation was performed using cortical organoid plated on 4 MEA wells (n = 4, cortical organoid culture) the following drugs: 10 μM bicuculline, 100 μM picrotoxin, 50 μM muscimol, 20 μM CNQX, 20 μM AP5, 25 μM baclofen and 1 μM TTX. In this assessment, baseline recordings were obtained immediately before and 15 minutes after the addition of the compound. Three washes with PBS for total removal of the drug were performed in washout experiments; fresh media was added and another recording was conducted after 2 hours.
Preterm neonatal EEG.
A preterm neonatal EEG dataset was obtained from a publicly available dataset (Stevenson et al., 2017). Raw recordings were not available due to patient confidentiality concerns. The dataset includes 567 recordings from 39 preterm neonates (24-38 weeks PMA), consisting of 23 EEG features computed from the entirety of each recording (Table S2). See cited publication for details of features. Briefly, we chose to include features derived from duration and timing of (interval between subsequent) network events in neonates and organoids, as these are least affected by anatomical differences between the two model systems (i.e., skull filtering), as well as spectral features (delta, theta, and alpha power). 5%/50%/95% refer to percentile of the feature distribution from a recording.
Resampled feature-age correlation.
We computed Pearson’s correlation coefficient between neonate age and each of the 12 EEG features, after a leave-K-groups-out resampling procedure N times, where K is the number of neonates from whom all recordings were left out in computing the correlation (50% of all neonates, resampling N = 100). An identical procedure was performed to compute the correlation between organoid culture development time and LFP features (K = 4 out of 8, 50%, N = 100). Mean and standard deviation were then computed over all resampled draws in order to compare between organoid LFP and neonatal EEG to produce Figure 4C and Figure S4D.
Neonate-organoid development time regression model.
To compare the similarity of developmental trajectory of cortical organoids and the preterm human brain, we trained an Elastic Net (L1- and L2- regularized) regression model on only the preterm neonatal EEG features and used that model (with all parameters held the same) to predict an equivalent organoid development time for each recording time point over 40 weeks in culture. Specifically, the training dataset consisted of a subset of the preterm EEG data; we discarded all “low-activity-period” features (Lisman, 1997) since there was no equivalent period for organoid recordings, as well as features for which we could not sensibly compute from organoid LFPs, such as interhemispheric synchrony. This selection was done a priori, and 12 features remained, including 3 features for relative spectral power in distinct frequency bands. The features corresponding to aspects of spontaneous activity transient (SAT) timing, such as SATs per hour and SAT duration, were similarly computed on organoid LFPs after network event detection described earlier (see Table S2 for a full list of included and rejected features). This latter organoid LFP test dataset was never seen by the regression model until prediction time. Training was performed using scikit-learn linear model module [ElasticNetCV (Pedregosa et al., 2011)], with K-Group shuffle split cross-validation on regularization hyperparameters, where K = 25% of groups, N = 200 shuffles. In other words, we found the best regularized linear model possible for predicting the age of preterm neonates using those precomputed EEG features. This model was directly applied on organoid LFP features to determine the corresponding development time of the organoids during 40 weeks in culture. Control datasets were also submitted for prediction, including held-out preterm EEG (positive control), and mouse primary culture, 2D iPSC culture, and human fetal culture (negative controls). To quantify the model’s ability to predict the developmental trend of the out of sample datasets, we compute the Pearson correlation coefficient between the predicted and actual age of each dataset. To eliminate the potential confound of a difference in frequency-dependent filtering properties of the skull and difference in spatial integration of currents in macroscopic EEG electrodes compared to microscopic planar MEA electrodes, the same analysis was performed after discarding the spectral features (leaving 9 features total). This result is presented in Figure S4E, in addition to the prediction for the control datasets.
QUANTIFICATION AND STATISTICAL ANALYSIS
Statistical analysis.
Data are presented as mean±s.e.m., unless otherwise indicated, and it was obtained from different samples. No statistical method was used to predetermine the sample size. The statistical analyses were performed using Prism software (GraphPad, San Diego, CA, USA). Student’s t-test, Mann-Whitney-test, or ANOVA with post hoc tests were used as indicated. Significance was defined as P < 0.05(*), P < 0.01(**), or P < 0.001(***).
Statistics and Regression for custom MEA analysis.
To fit linear or quadratic models in Figure 2F, G, I, we used organoid developmental time (in days) as input and electrophysiological features as output (LinearModel.fit, MATLAB). Reported R2 and p values are model statistics over the entire dataset. All events from different MEA wells on the same recording day were aggregated as samples drawn from the same distribution.
DATA AND CODE AVAILABILITY
Single-cell RNA sequencing data.
All datasets and/or analyses generated during the current study are available from the corresponding author upon reasonable request. Single-cell RNA sequencing data that support the findings of this study have been deposited at NCBI GEO: GSE130238.
The unnormalized feature weights.
The code can be found online: https://github.com/voytekresearch/OscillatoryOrganoids/blob/master/organoid_EEG_age_regression.ipynb.
Supplementary Material
KEY RESOURCES TABLE
| REAGENT or RESOURCE | SOURCE | IDENTIFIER |
|---|---|---|
| Antibodies | ||
| Mouse anti-Nestin | Abcam | ab22035 |
| Rat anti-CTIP2 | Abcam | ab18465 |
| Rabbit anti-SATB2 | Abcam | ab34735 |
| Chicken anti-MAP2 | Abcam | ab5392 |
| Rabbit anti-Ki67 | Abcam | ab15580 |
| Rabbit anti-TBR1 | Abcam | ab31940 |
| Rabbit anti-TBR2 | Abcam | ab23345 |
| Rabbit anti-beta-catenin | Abcam | E247 |
| Mouse anti-GABA | Abcam | ab86186 |
| Mouse anti-GABA B Receptor 1 | Abcam | ab55051 |
| Rabbit anti-Calretinin | Abcam | ab92341 |
| Rabbit anti-TTF1 (NKX2.1) | Abcam | ab76013 |
| Rabbit anti-Synapsin1 | Millipore | AB1543P |
| Mouse anti-NeuN | Millipore | MAB377 |
| Mouse anti-Parvalbumin | Millipore | MAB1572 |
| Rat anti-Somatostatin | Millipore | MAB354 |
| Rabbit anti-SOX2 | Cell Signaling | 2748 |
| Rabbit anti-GFAP | DAKO | Z033429 |
| Donkey anti-Mouse IgG- Alexa Fluor 488 | Thermo Fisher | R37114 |
| Donkey anti-Rabbit IgG- Alexa Fluor 488 | Thermo Fisher | R37118 |
| Donkey anti-Rat IgG- Alexa Fluor 488 | Thermo Fisher | A21208 |
| Goat anti-Mouse IgM- Alexa Fluor 488 | Thermo Fisher | A21042 |
| Goat anti-Chicken IgY- Alexa Fluor 488 | Thermo Fisher | A11039 |
| Donkey anti-Rabbit IgG- Alexa Fluor 555 | Thermo Fisher | A31572 |
| Donkey anti-Mouse IgG- Alexa Fluor 555 | Thermo Fisher | A31570 |
| Donkey anti-Mouse IgG- Alexa Fluor 647 | Thermo Fisher | A31571 |
| Donkey anti-Rabbit IgG- Alexa Fluor 647 | Thermo Fisher | A31573 |
| Goat anti-Mouse IgM- Alexa Fluor 647 | Thermo Fisher | A21238 |
| Goat anti-Chicken IgY- Alexa Fluor 647 | Thermo Fisher | A21449 |
| Chemicals, Peptides, and Recombinant Proteins | ||
| Dorsomorphin | R&D Systems | 3093 |
| Stemolecule SB431542 | StemGent | 04-0010-10 |
| ROCK inhibitor (Ri) Y-27632 dihydrochloride | Sigma-Aldrich | 688000 |
| FGF-Basic (AA 1-155) Recombinant Human Protein | Life Technologies | PHG0263 |
| Animal-Free Recombinant Human EGF | Peprotech | AF-100-15 |
| Recombinant Human BDNF | Peprotech | 450-02 |
| Recombinant Human GDNF | Peprotech | 450-10 |
| Recombinant Human NT-3 | Peprotech | 450-03 |
| L-Ascorbic acid | Sigma-Aldrich | A4403 |
| N6,2′-O-Dibutyryladenosine 3′,5′-cyclic monophosphate sodium salt | Sigma-Aldrich | D0627 |
| Bicuculline methiodide | Tocris | 2503 |
| Picrotoxin | Tocris | 1128 |
| Muscimol | Tocris | 0289/1 |
| CNQX disodium salt | Tocris | 1045 |
| D-AP5 | Tocris | 0106 |
| (R)-Baclofen | Tocris | 0796/10 |
| Tetrodotoxin citrate | Tocris | 1069 |
| Critical Commercial Assays | ||
| Chromium Single Cell 3’ v2 Library kit | 10X Genomics | PN-120237 |
| MyOne Silane Beads | Thermo Fisher | 37002D |
| SPRIselect Reagent Kit | Beckman Coulter | B23317 |
| Qubit dsDNA HS Assay Kit | Thermo Fisher | Q32854 |
| Deposited Data | ||
| Single-cell RNA sequencing data | This paper | NCBI GEO: GSE130238 |
| Experimental Models: Cell Lines | ||
| Control iPSCs | N/A | N/A |
| Experimental Models: Organisms/Strains | ||
| C57 black 6 | The Jackson Laboratory | C57BL6 |
| Software and Algorithms | ||
| GraphPad Prism | GraphPad Software | N/A |
| AxIS Software | Axion Biosystems | N/A |
| Neural Metrics Tool | Axion Biosystems | N/A |
| MATLAB | MathWorks | N/A |
| Cell Ranger software version 2.1.1 | 10X Genomics | N/A |
HIGHLIGHTS.
Long-term single-cell transcriptomics reveals cortical organoid developmental dynamics
Cortical organoids exhibit phase-amplitude coupling during network-synchronous events
Differential role of glutamate and GABA in initiating and maintaining oscillations
Network-level events are similar to the human preterm neonatal EEG features
ACKNOWLEDGMENTS
This work was supported by grants from the California Institute for Regenerative Medicine (CIRM) DISC1-08825 and DISC2-09649, the National Institutes of Health through the R01MH108528, R01MH094753, R01MH109885, R01MH100175, R56MH109587, a SFARI grant #345469, and a NARSAD Independent Investigator Grant to A.R.M. B.V is supported by a Sloan Research Fellowship, the Whitehall Foundation (2017-12-73), and the National Science Foundation (1736028). I.A.C. is a San Diego IRACDA Fellow supported by National Institutes of Health (NIH)/NIGMS K12 GM06852 Award. G.W.Y. and A.R.M. are supported by U19MH1073671, part of the National Cooperative Reprogrammed Cell Research Groups (NCRCRG) to Study Mental Illness. R.G is supported by the Natural Sciences and Engineering Research Council of Canada (NSERC PGS-D), UCSD Kavli Innovative Research Grant (IRG), Frontiers for Innovation Scholars Program, and Katzin Prize. We thank Patrick S. Cooper for his help on the Australian EEG Database. We thank Dr. V. Taupin for her expert assistance with electron microscopy, and Dr. Bruce Barshop and Dr. Jon Gangoiti (UCSD) for their expertise in mass spectrometry. We also thank the Epigenomics Center (UCSD). This work was supported by the UC San Diego School of Medicine.
Footnotes
DECLARATION OF INTERESTS
Dr. Muotri is a co-founder and has equity interest in TISMOO, a company dedicated to genetic analysis focusing on therapeutic applications customized for autism spectrum disorder and other neurological disorders with genetic origins. The terms of this arrangement have been reviewed and approved by the University of California San Diego in accordance with its conflict of interest policies.
Publisher's Disclaimer: This is a PDF file of an unedited manuscript that has been accepted for publication. As a service to our customers we are providing this early version of the manuscript. The manuscript will undergo copyediting, typesetting, and review of the resulting proof before it is published in its final citable form. Please note that during the production process errors may be discovered which could affect the content, and all legal disclaimers that apply to the journal pertain.
REFERENCES
- Allene C, Cattani A, Ackman JB, Bonifazi P, Aniksztejn L, Ben-Ari Y, and Cossart R (2008). Sequential generation of two distinct synapse-driven network patterns in developing neocortex. J Neurosci 28, 12851–12863. [DOI] [PMC free article] [PubMed] [Google Scholar]
- Ben-Ari Y (2001). Developing networks play a similar melody. Trends in Neurosciences 24, 353–360. [DOI] [PubMed] [Google Scholar]
- Birey F, Andersen J, Makinson CD, Islam S, Wei W, Huber N, Fan HC, Metzler KRC, Panagiotakos G, Thom N, et al. (2017). Assembly of functionally integrated human forebrain spheroids. Nature 545, 54–59. [DOI] [PMC free article] [PubMed] [Google Scholar]
- Blankenship AG, and Feller MB (2010). Mechanisms underlying spontaneous patterned activity in developing neural circuits. Nat Rev Neurosci 11, 18–29. [DOI] [PMC free article] [PubMed] [Google Scholar]
- Butler A, Hoffman P, Smibert P, Papalexi E, and Satija R (2018). Integrating single-cell transcriptomic data across different conditions, technologies, and species. Nat Biotechnol 36, 411–420. [DOI] [PMC free article] [PubMed] [Google Scholar]
- Buzsaki G (2004). Large-scale recording of neuronal ensembles. Nat Neurosci 7, 446–451. [DOI] [PubMed] [Google Scholar]
- Buzsáki G, Anastassiou CA, and Koch C (2012). The origin of extracellular fields and currents — EEG, ECoG, LFP and spikes. Nature Reviews Neuroscience 13, 407. [DOI] [PMC free article] [PubMed] [Google Scholar]
- Buzsaki G, and Draguhn A (2004). Neuronal oscillations in cortical networks. Science 304, 1926–1929. [DOI] [PubMed] [Google Scholar]
- Buzsaki G, Logothetis N, and Singer W (2013). Scaling brain size, keeping timing: evolutionary preservation of brain rhythms. Neuron 80, 751–764. [DOI] [PMC free article] [PubMed] [Google Scholar]
- Camp JG, Badsha F, Florio M, Kanton S, Gerber T, Wilsch-Brauninger M, Lewitus E, Sykes A, Hevers W, Lancaster M, et al. (2015). Human cerebral organoids recapitulate gene expression programs of fetal neocortex development. Proc Natl Acad Sci U S A 112, 15672–15677. [DOI] [PMC free article] [PubMed] [Google Scholar]
- Cederquist GY, Asciolla JJ, Tchieu J, Walsh RM, Cornacchia D, Resh MD, and Studer L (2019). Specification of positional identity in forebrain organoids. Nature Biotechnology 37, 436–444. [DOI] [PMC free article] [PubMed] [Google Scholar]
- de Hemptinne C, Swann NC, Ostrem JL, Ryapolova-Webb ES, San Luciano M, Galifianakis NB, and Starr PA (2015). Therapeutic deep brain stimulation reduces cortical phase-amplitude coupling in Parkinson’s disease. Nat Neurosci 18, 779–786. [DOI] [PMC free article] [PubMed] [Google Scholar]
- Farahany NA, Greely HT, Hyman S, Koch C, Grady C, Pasca SP, Sestan N, Arlotta P, Bernat JL, Ting J, et al. (2018). The ethics of experimenting with human brain tissue. Nature 556, 429–432. [DOI] [PMC free article] [PubMed] [Google Scholar]
- Fries P (2005). A mechanism for cognitive dynamics: neuronal communication through neuronal coherence. Trends Cogn Sci 9, 474–480. [DOI] [PubMed] [Google Scholar]
- Gao R, Peterson EJ, and Voytek B (2017). Inferring synaptic excitation/inhibition balance from field potentials. Neuroimage 158, 70–78. [DOI] [PubMed] [Google Scholar]
- Gertsman I, Gangoiti JA, and Barshop BA (2014). Validation of a dual LC-HRMS platform for clinical metabolic diagnosis in serum, bridging quantitative analysis and untargeted metabolomics. Metabolomics 10, 312–323. [DOI] [PMC free article] [PubMed] [Google Scholar]
- Giandomenico SL, Mierau SB, Gibbons GM, Wenger LMD, Masullo L, Sit T, Sutcliffe M, Boulanger J, Tripodi M, Derivery E, et al. (2019). Cerebral organoids at the air-liquid interface generate diverse nerve tracts with functional output. Nat Neurosci 22, 669–679. [DOI] [PMC free article] [PubMed] [Google Scholar]
- Haller M, Donoghue T, Peterson E, Varma P, Sebastian P, Gao R, Noto T, Knight RT, Shestyuk A, and Voytek B (2018). Parameterizing neural power spectra. bioRxiv, 299859. [DOI] [PMC free article] [PubMed] [Google Scholar]
- Henriques JB, and Davidson RJ (1991). Left frontal hypoactivation in depression. J Abnorm Psychol 100, 535–545. [DOI] [PubMed] [Google Scholar]
- Johnson MH (2001). Functional brain development in humans. Nat Rev Neurosci 2, 475–483. [DOI] [PubMed] [Google Scholar]
- Kelava I, and Lancaster MA (2016). Stem Cell Models of Human Brain Development. Cell Stem Cell 18, 736–748. [DOI] [PubMed] [Google Scholar]
- Khan S, Gramfort A, Shetty NR, Kitzbichler MG, Ganesan S, Moran JM, Lee SM, Gabrieli JD, Tager-Flusberg HB, Joseph RM, et al. (2013). Local and long-range functional connectivity is reduced in concert in autism spectrum disorders. Proc Natl Acad Sci U S A 110, 3107–3112. [DOI] [PMC free article] [PubMed] [Google Scholar]
- Khazipov R, and Luhmann HJ (2006). Early patterns of electrical activity in the developing cerebral cortex of humans and rodents. Trends Neurosci 29, 414–418. [DOI] [PubMed] [Google Scholar]
- Lancaster MA, and Knoblich JA (2014). Generation of cerebral organoids from human pluripotent stem cells. Nat Protoc 9, 2329–2340. [DOI] [PMC free article] [PubMed] [Google Scholar]
- Lancaster MA, Renner M, Martin CA, Wenzel D, Bicknell LS, Hurles ME, Homfray T, Penninger JM, Jackson AP, and Knoblich JA (2013). Cerebral organoids model human brain development and microcephaly. Nature 501, 373–379. [DOI] [PMC free article] [PubMed] [Google Scholar]
- Lisman JE (1997). Bursts as a unit of neural information: making unreliable synapses reliable. Trends Neurosci 20, 38–43. [DOI] [PubMed] [Google Scholar]
- Luo C, Lancaster MA, Castanon R, Nery JR, Knoblich JA, and Ecker JR (2016). Cerebral Organoids Recapitulate Epigenomic Signatures of the Human Fetal Brain. Cell Rep 17, 3369–3384. [DOI] [PMC free article] [PubMed] [Google Scholar]
- Manning JR, Jacobs J, Fried I, and Kahana MJ (2009). Broadband shifts in local field potential power spectra are correlated with single-neuron spiking in humans. J Neurosci 29, 13613–13620. [DOI] [PMC free article] [PubMed] [Google Scholar]
- Mariani J, Simonini MV, Palejev D, Tomasini L, Coppola G, Szekely AM, Horvath TL, and Vaccarino FM (2012). Modeling human cortical development in vitro using induced pluripotent stem cells. Proceedings of the National Academy of Sciences 109, 12770–12775. [DOI] [PMC free article] [PubMed] [Google Scholar]
- McInnes L, H. J, Melville J (2018). UMAP: uniform manifold approximation and projection for dimension reduction. ArXiv e-prints. [Google Scholar]
- Miller KJ, Leuthardt EC, Schalk G, Rao RP, Anderson NR, Moran DW, Miller JW, and Ojemann JG (2007). Spectral changes in cortical surface potentials during motor movement. J Neurosci 27, 2424–2432. [DOI] [PMC free article] [PubMed] [Google Scholar]
- Moore SM, Seidman JS, Ellegood J, Gao R, Savchenko A, Troutman TD, Abe Y, Stender J, Lee D, Wang S, et al. (2019). Setd5 haploinsufficiency alters neuronal network connectivity and leads to autistic-like behaviors in mice. Transl Psychiatry 9, 24. [DOI] [PMC free article] [PubMed] [Google Scholar]
- Mukamel R, Gelbard H, Arieli A, Hasson U, Fried I, and Malach R (2005). Coupling Between Neuronal Firing, Field Potentials, and fMRI in Human Auditory Cortex. Science 309, 951–954. [DOI] [PubMed] [Google Scholar]
- Murrell P (2005). R Graphics (Chapman & Hall/CRC Press; ). [Google Scholar]
- Nageshappa S, Carromeu C, Trujillo CA, Mesci P, Espuny-Camacho I, Pasciuto E, Vanderhaeghen P, Verfaillie CM, Raitano S, Kumar A, et al. (2016). Altered neuronal network and rescue in a human MECP2 duplication model. Mol Psychiatry 21, 178–188. [DOI] [PMC free article] [PubMed] [Google Scholar]
- Opitz T, De Lima AD, and Voigt T (2002). Spontaneous development of synchronous oscillatory activity during maturation of cortical networks in vitro. J Neurophysiol 88, 2196–2206. [DOI] [PubMed] [Google Scholar]
- Paşca AM, Sloan SA, Clarke LE, Tian Y, Makinson CD, Huber N, Kim CH, Park J.-y., Rourke NAO, Nguyen KD, et al. (2015). Functional cortical neurons and astrocytes from human pluripotent stem cells in 3D culture. [DOI] [PMC free article] [PubMed] [Google Scholar]
- Pasca SP (2018). The rise of three-dimensional human brain cultures. Nature 553, 437–445. [DOI] [PubMed] [Google Scholar]
- Pedregosa F, Ga, #235, Varoquaux I, Gramfort A, Michel V, Thirion B, Grisel O, Blondel M, Prettenhofer P, et al. (2011). Scikit-learn: Machine Learning in Python. J Mach Learn Res 12, 2825–2830. [Google Scholar]
- Power JD, Fair DA, Schlaggar BL, and Petersen SE (2010). The development of human functional brain networks. Neuron 67, 735–748. [DOI] [PMC free article] [PubMed] [Google Scholar]
- Qian X, Nguyen HN, Song MM, Hadiono C, Ogden SC, Hammack C, Yao B, Hamersky GR, Jacob F, Zhong C, et al. (2016). Brain-Region-Specific Organoids Using Mini-bioreactors for Modeling ZIKV Exposure. Cell 165, 1238–1254. [DOI] [PMC free article] [PubMed] [Google Scholar]
- Quadrato G, Nguyen T, Macosko EZ, Sherwood JL, Min Yang S, Berger DR, Maria N, Scholvin J, Goldman M, Kinney JP, et al. (2017). Cell diversity and network dynamics in photosensitive human brain organoids. Nature 545, 48–53. [DOI] [PMC free article] [PubMed] [Google Scholar]
- Quiroga RQ, Reddy L, Kreiman G, Koch C, and Fried I (2005). Invariant visual representation by single neurons in the human brain. Nature 435, 1102–1107. [DOI] [PubMed] [Google Scholar]
- Renner M, Lancaster MA, Bian S, Choi H, Ku T, Peer A, Chung K, and Knoblich JA (2017). Self-organized developmental patterning and differentiation in cerebral organoids. EMBO J 36, 1316–1329. [DOI] [PMC free article] [PubMed] [Google Scholar]
- Schevon CA, Weiss SA, McKhann G Jr., Goodman RR, Yuste R, Emerson RG, and Trevelyan AJ (2012). Evidence of an inhibitory restraint of seizure activity in humans. Nat Commun 3, 1060. [DOI] [PMC free article] [PubMed] [Google Scholar]
- Stevenson NJ, Oberdorfer L, Koolen N, O'Toole JM, Werther T, Klebermass-Schrehof K, and Vanhatalo S (2017). Functional maturation in preterm infants measured by serial recording of cortical activity. Sci Rep 7, 12969. [DOI] [PMC free article] [PubMed] [Google Scholar]
- Stuart T, Butler A, Hoffman P, Hafemeister C, Papalexi E, Mauck WM, Stoeckius M, Smibert P, and Satija R (2018). Comprehensive integration of single cell data. bioRxiv, 460147. [DOI] [PMC free article] [PubMed] [Google Scholar]
- Tang X, Kim J, Zhou L, Wengert E, Zhang L, Wu Z, Carromeu C, Muotri AR, Marchetto MCN, Gage FH, et al. (2016). KCC2 rescues functional deficits in human neurons derived from patients with Rett syndrome. Proceedings of the National Academy of Sciences 113, 751–756. [DOI] [PMC free article] [PubMed] [Google Scholar]
- Tetzlaff C, Okujeni S, Egert U, Worgotter F, and Butz M (2010). Self-organized criticality in developing neuronal networks. PLoS Comput Biol 6, e1001013. [DOI] [PMC free article] [PubMed] [Google Scholar]
- Thomas CA, Tejwani L, Trujillo CA, Negraes PD, Herai RH, Mesci P, Macia A, Crow YJ, and Muotri AR (2017). Modeling of TREX1-Dependent Autoimmune Disease using Human Stem Cells Highlights L1 Accumulation as a Source of Neuroinflammation. Cell Stem Cell 21, 319–331 e318. [DOI] [PMC free article] [PubMed] [Google Scholar]
- Tolonen M, Palva JM, Andersson S, and Vanhatalo S (2007). Development of the spontaneous activity transients and ongoing cortical activity in human preterm babies. Neuroscience 145, 997–1006. [DOI] [PubMed] [Google Scholar]
- Tort ABL, Komorowski R, Eichenbaum H, and Kopell N (2010). Measuring Phase-Amplitude Coupling Between Neuronal Oscillations of Different Frequencies. Journal of Neurophysiology 104, 1195–1210. [DOI] [PMC free article] [PubMed] [Google Scholar]
- Uhlhaas PJ, Roux F, Rodriguez E, Rotarska-Jagiela A, and Singer W (2010). Neural synchrony and the development of cortical networks. Trends Cogn Sci 14, 72–80. [DOI] [PubMed] [Google Scholar]
- Uhlhaas PJ, and Singer W (2010). Abnormal neural oscillations and synchrony in schizophrenia. Nat Rev Neurosci 11, 100–113. [DOI] [PubMed] [Google Scholar]
- Uylings HBM, Delalle I, Petanjek Z, and Koenderink MJT (2002). Structural and Immunocytochemical Differentiation of Neurons in Prenatal and Postnatal Human Prefrontal Cortex. Neuroembryology and Aging 1, 176–186. [Google Scholar]
- van de Leemput J, Boles NC, Kiehl TR, Corneo B, Lederman P, Menon V, Lee C, Martinez R.a., Levi BP, Thompson CL, et al. (2014). CORTECON: A temporal transcriptome analysis of in vitro human cerebral cortex development from human embryonic stem cells. Neuron 83, 51–68. [DOI] [PubMed] [Google Scholar]
- Van Hove JLK, and Thomas JA (2014). Disorders of Glycine, Serine, GABA, and Proline Metabolism In Physician’s Guide to the Diagnosis, Treatment, and Follow-Up of Inherited Metabolic Diseases, Blau N, Duran M, Gibson KM, and Dionisi Vici C, eds. (Berlin, Heidelberg: Springer Berlin Heidelberg; ), pp. 63–83. [Google Scholar]
- Voytek B, Kayser AS, Badre D, Fegen D, Chang EF, Crone NE, Parvizi J, Knight RT, and D'Esposito M (2015). Oscillatory dynamics coordinating human frontal networks in support of goal maintenance. Nature Neuroscience 18, 1318. [DOI] [PMC free article] [PubMed] [Google Scholar]
- Voytek B, and Knight RT (2015). Dynamic network communication as a unifying neural basis for cognition, development, aging, and disease. Biol Psychiatry 77, 1089–1097. [DOI] [PMC free article] [PubMed] [Google Scholar]
- Wickham H (2016). ggplot2 (Springer; ). [Google Scholar]
- Xiang Y, Tanaka Y, Cakir B, Patterson B, Kim K-Y, Sun P, Kang Y-J, Zhong M, Liu X, Patra P, et al. (2019). hESC-Derived Thalamic Organoids Form Reciprocal Projections When Fused with Cortical Organoids. Cell Stem Cell 24, 487–497.e487. [DOI] [PMC free article] [PubMed] [Google Scholar]
- Xiang Y, Tanaka Y, Patterson B, Kang YJ, Govindaiah G, Roselaar N, Cakir B, Kim KY, Lombroso AP, Hwang SM, et al. (2017). Fusion of Regionally Specified hPSC-Derived Organoids Models Human Brain Development and Interneuron Migration. Cell Stem Cell 21, 383–398 e387. [DOI] [PMC free article] [PubMed] [Google Scholar]
- Yoon S-J, Elahi LS, Pașca AM, Marton RM, Gordon A, Revah O, Miura Y, Walczak EM, Holdgate GM, Fan HC, et al. (2019). Reliability of human cortical organoid generation. Nature Methods 16, 75–78. [DOI] [PMC free article] [PubMed] [Google Scholar]
- Zerbino DR, Achuthan P, Akanni W, Amode MR, Barrell D, Bhai J, Billis K, Cummins C, Gall A, Giron CG, et al. (2018). Ensembl 2018. Nucleic Acids Res 46, D754–D761. [DOI] [PMC free article] [PubMed] [Google Scholar]
- Zheng GX, Terry JM, Belgrader P, Ryvkin P, Bent ZW, Wilson R, Ziraldo SB, Wheeler TD, McDermott GP, Zhu J, et al. (2017). Massively parallel digital transcriptional profiling of single cells. Nat Commun 8, 14049. [DOI] [PMC free article] [PubMed] [Google Scholar]
Associated Data
This section collects any data citations, data availability statements, or supplementary materials included in this article.
Supplementary Materials
Data Availability Statement
Single-cell RNA sequencing data.
All datasets and/or analyses generated during the current study are available from the corresponding author upon reasonable request. Single-cell RNA sequencing data that support the findings of this study have been deposited at NCBI GEO: GSE130238.
The unnormalized feature weights.
The code can be found online: https://github.com/voytekresearch/OscillatoryOrganoids/blob/master/organoid_EEG_age_regression.ipynb.