Abstract
Lamin A/C (LMNA) is one of the most frequently mutated genes in dilated cardiomyopathy (DCM). LMNA-related DCM is a common inherited cardiomyopathy associated with systolic dysfunction and high prevalence arrhythmias. Here we modeled the LMNA-DCM in vitro using patient-specific induced pluripotent stem cell-derived cardiomyocytes (iPSC-CMs). Electrophysiological studies showed that the mutant iPSC-CMs displayed aberrant calcium homeostasis leading to arrhythmias at the single-cell level. Mechanistically, we uncovered that the platelet-derived growth factor (PDGF) signaling pathway was activated in mutant iPSC-CMs when compared to isogenic controls. Conversely, pharmacological and molecular inhibition of the PDGF signaling pathway ameliorated the arrhythmia phenotypes of mutant iPSC-CMs in vitro. Taken together, our findings suggest that the activation of the PDGF pathway contributes to the pathogenesis of the LMNA-DCM and point to PDGF receptor beta (PDGFRB) as a potential therapeutic target.
LMNA-DCM is an autosomal dominant disorder caused by mutations in the LMNA gene encoding for the LMNA proteins that constitute the major component of the nuclear envelope1–3. LMNA-DCM accounts for 5–10% of DCM cases and has an age-related penetrance with a typical onset between the ages of 30 and 404,5. In contrast to most other forms of familial DCM, sudden cardiac death may be the first manifestation of LMNA-DCM even in the absence of systolic dysfunction, due to malignant arrhythmias such as ventricular tachycardia and fibrillation4–6. However, the precise mechanisms linking the LMNA mutations to the increased arrhythmogenicity are unknown.
Modeling LMNA-DCM with iPSC-CMs in vitro
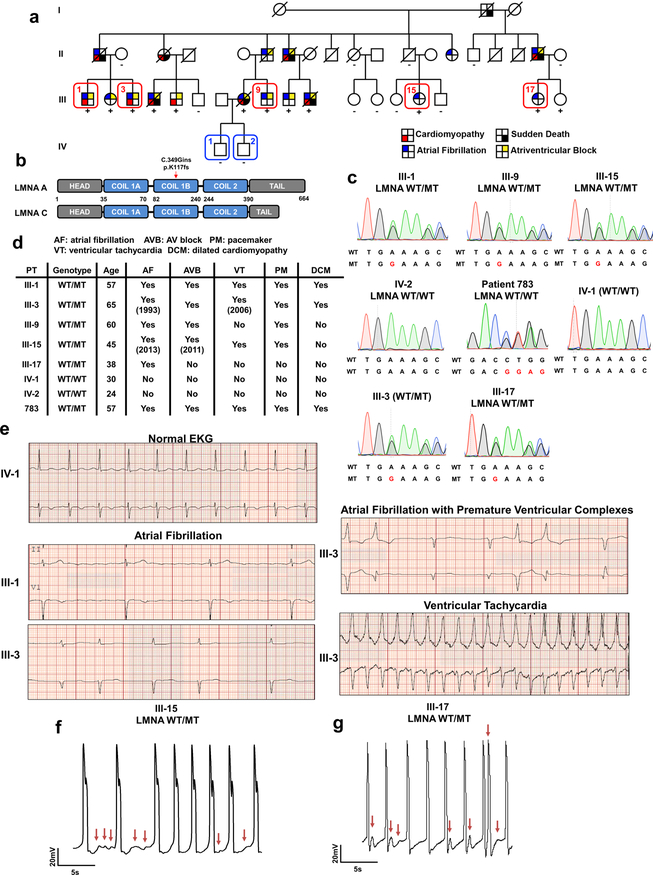
We recruited a large family cohort carrying a frame shift mutation in the LMNA gene that leads to the early termination of translation (c. 349_350insG; p. K117fs) (Extended Data Fig. 1a–c). Three of the carriers (III-1, III-3, and III-9) presented with atrial fibrillation that progressed to atrioventricular block, ventricular tachycardia (Extended Data Fig. 1d, e), and DCM.
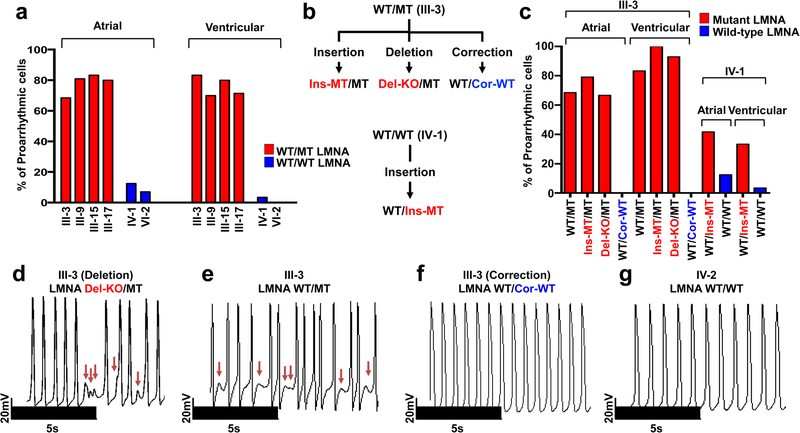
We generated multiple patient-specific iPSC lines using non-integrating reprogramming methods7,8 and derived iPSC-CMs using a chemically-defined protocol8–10 to examine the electrophysiological properties at the single cell level. We found that the LMNA-mutant iPSC-CMs (III-3, III-9, III-15, and III-17) exhibited arrhythmias resembling delayed afterdepolarizations (DADs) in both atrial- and ventricular-like iPSC-CMs when compared to healthy controls (IV-1 and IV-2) (Fig. 1a and Extended Data Fig. 1f, g). Taken together, these data demonstrated that patient-specific iPSC-CMs recapitulated the disease phenotype associated with LMNA-DCM in vitro.
Figure 1. LMNA mutation causes arrhythmic phenotype in patient specific iPSC-CMs.
a, Quantification of arrhythmic occurrence in control and mutant iPSC-CMs. b, Schematic view of genome editing strategy. c, Quantification of arrhythmic occurrence in isogenic iPSC-CMs. d-g, Electrophysiological measurements of spontaneous action potentials in parental mutant iPSC-CMs (III-3; WT/MT), isogenic mutant iPSC-CMs (III-3; Del-KO/MT), isogenic control iPSC-CMs (III-3; WT/Cor-WT), and control iPSC-CMs (IV-2; WT/WT). The experiments were repeated three times independently with similar results.
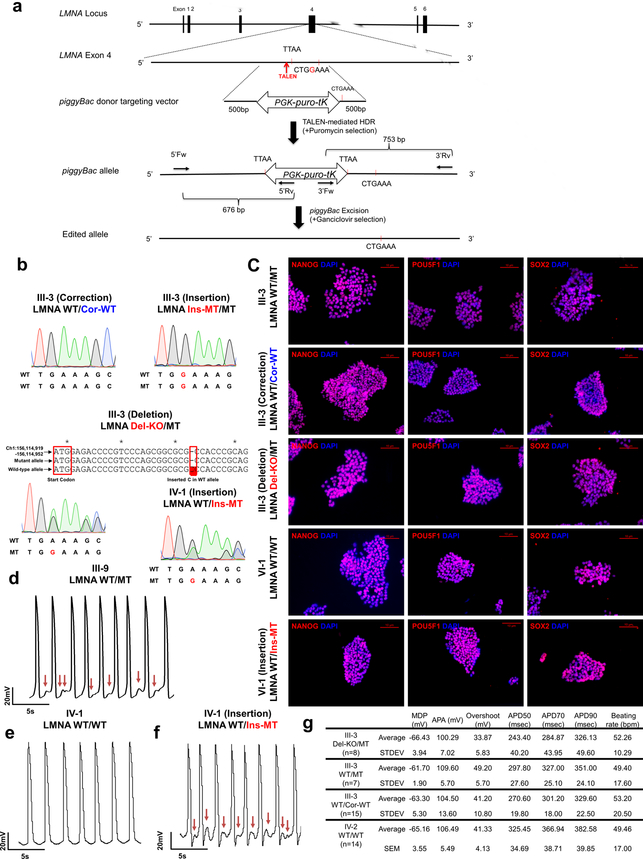
Next, we generated a panel of isogenic lines that differed only in this mutation for the iPSC line derived from patient III-3 (WT/MT) using TALEN-mediated genome editing11,12. Specifically, we corrected the LMNA mutation in iPSCs (WT/Cor-WT), inserted the K117fs mutation in the WT allele (Ins-MT/MT), and generated a knock-out iPSC line by targeting the start codon11 (ATG site) of the WT allele (Del-KO/MT) (Fig. 1b and Extended Data Fig. 2a–c). We also introduced the K117fs mutation in the healthy control iPSC line (patient IV-1, WT/WT) to generate a heterozygous mutant iPSC line (WT/Ins-MT). We generated iPSC-CMs from the isogenic lines and observed that the targeted gene-correction rescued the electrophysiological abnormalities in WT/Cor-WT when compared to the parental WT/MT, the genome-edited Ins-MT/MT, and the Del-KO/MT iPSC-CMs (Fig. 1c–g). Accordingly, the insertion of the K117fs mutation in the healthy control (WT/Ins-MT) induced arrhythmias (Extended Data Fig. 2d–g). Together, these data suggest that the K117fs is a pathogenic mutation that causes LMNA-DCM.
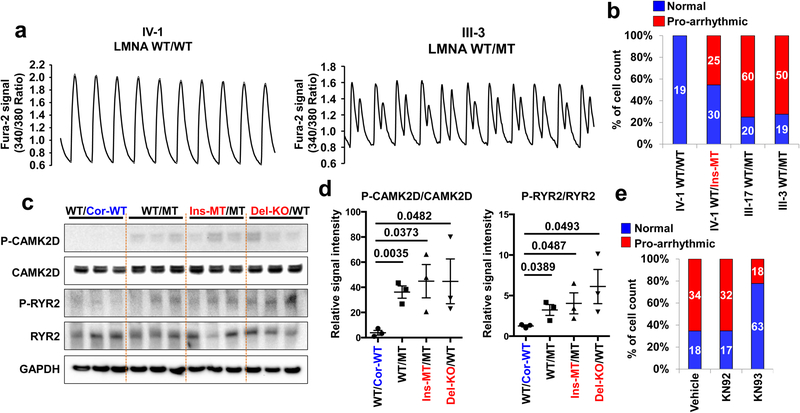
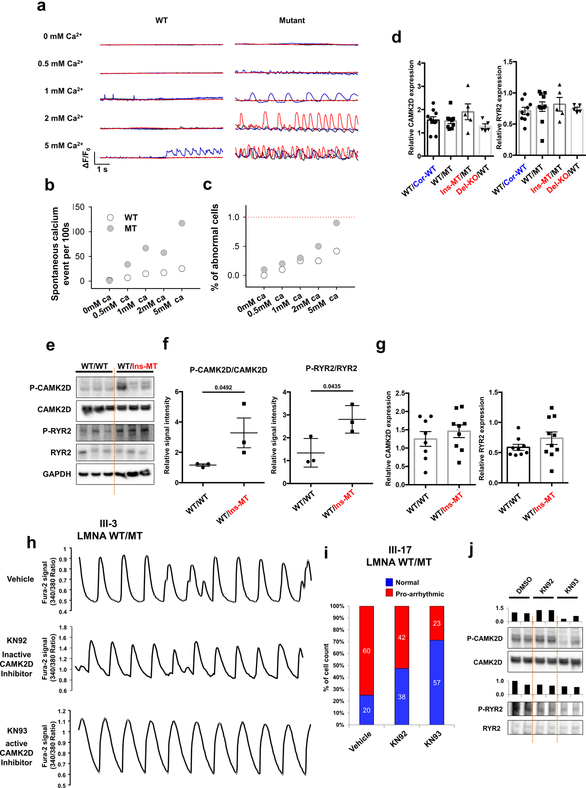
As homeostasis of calcium (Ca2+) is critical for excitation-contraction coupling in the heart13,14, we analyzed the intracellular Ca2+-handling properties of the isogenic iPSC-CMs. Abnormal Ca2+ transients were observed in K117fs iPSC-CMs, whereas the control iPSC-CMs exhibited uniform Ca2+ transients (Fig. 2a). In addition, the WT/Ins-MT displayed abnormal Ca2+ transients when compared to the isogenic WT/WT iPSC-CMs (Fig. 2b). Also, we recorded the calcium transient in the presence of tetrodotoxin, a sodium channel blocker, to inhibit any beating initiated at the plasma membrane15,16. We observed spontaneous Ca2+ cycling at very low extracellular Ca2+ levels in WT/MT iPSC-CMs in contrast to the minimal occurrence of Ca2+ activity found in the isogeneic control line (WT/Cor-WT), suggesting an abnormal calcium release from the sarcoplasmic reticulum (SR) (Extended Data Fig. 3a–c). Taken together, these findings demonstrated that SR Ca2+ dysregulation is associated with the electrical abnormalities observed in K117fs iPSC-CMs.
Figure 2. Abnormal calcium handling as a cause of arrhythmic phenotype in LMNA-mutant iPSC-CMs.
a, Representative Ca2+ transients of control and mutant iPSC-CMs. b, Quantification of cells exhibiting arrhythmic waveforms in control and mutant iPSC-CMs. c, d, Immunoblot analysis of phospho-RYR2, RYR2, phospho-CAMK2D, and CAMK2D levels in control and mutant iPSC-CMs. Data are expressed as mean ± s.e.m., and a two-tailed Student’s t-test was used to calculate P values. n=3. Numbers above the line show significant P values. e, Quantification of cells exhibiting arrhythmic waveforms in mutant iPSC-CMs (III-3; WT/MT) treated with 1 uM of KN92 or KN93 for 24 hr. All traces were recorded for 20 sec. The Ca2+ transients in a were repeated as described in b independently with similar results. The Immunoblot data in c were repeated twice independently with similar results.
As Ca2+/calmodulin–dependent kinase II (CAMK2)-mediated ryanodine receptor 2 (RYR2) hyper-phosphorylation leads to DAD-related arrhythmias17, we tested whether the activation of this pathway induces arrhythmias in K117fs iPSC-CMs. Interestingly, phospho-RYR2 (P-RYR2) and phospho-CAMK2D (P-CAMK2D) levels were significantly increased in K117fs (WT/MT, Ins-MT/MT, and Del-KO/MT) when compared to the isogenic control iPSC-CMs (WT/Cor-WT) (Fig. 2c, d). Furthermore, the mRNA expression levels of both CAMK2D and RYR2 were similar between isogenic control and K117fs iPSC-CMs (Extended Data Fig. 3d–g). When the CAMK2D activation was inhibited in K117fs iPSC-CMs using KN93, a specific CAMK2D inhibitor, we observed a significant decrease in P-RYR2 and P-CAMK2D levels and abnormal Ca2+ transients (22.22%, n=81) when compared to control (65.38%, n=52) or the inactive analog KN92 (65.30%, n=49) (Fig. 2e and Extended Data Fig. 3h–j). Taken together, these data suggest that CAMK2-mediated RYR2 activation causes abnormal Ca2+ handling and arrhythmias in K117fs iPSC-CMs.
NMD-mediated haploinsufficiency of LMNA
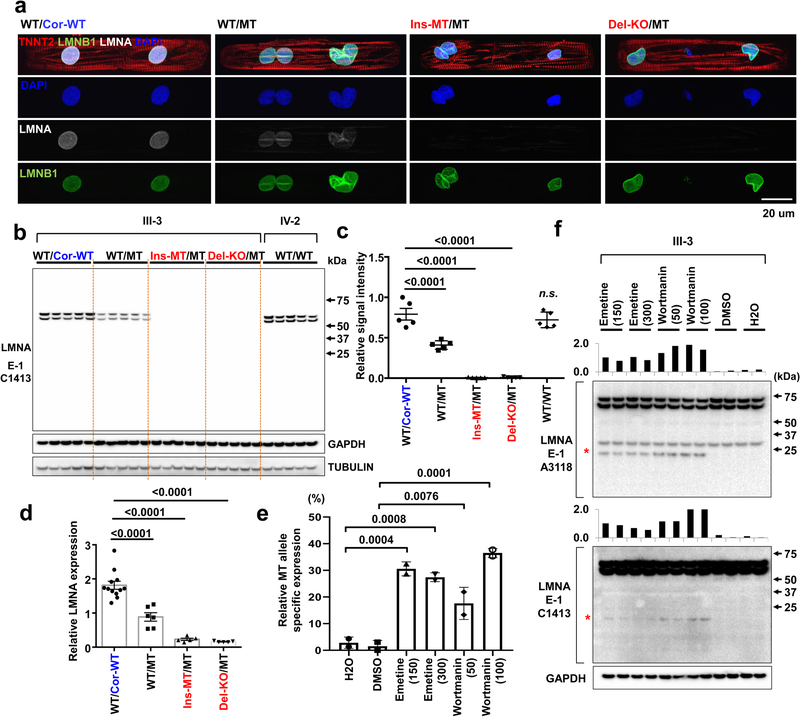
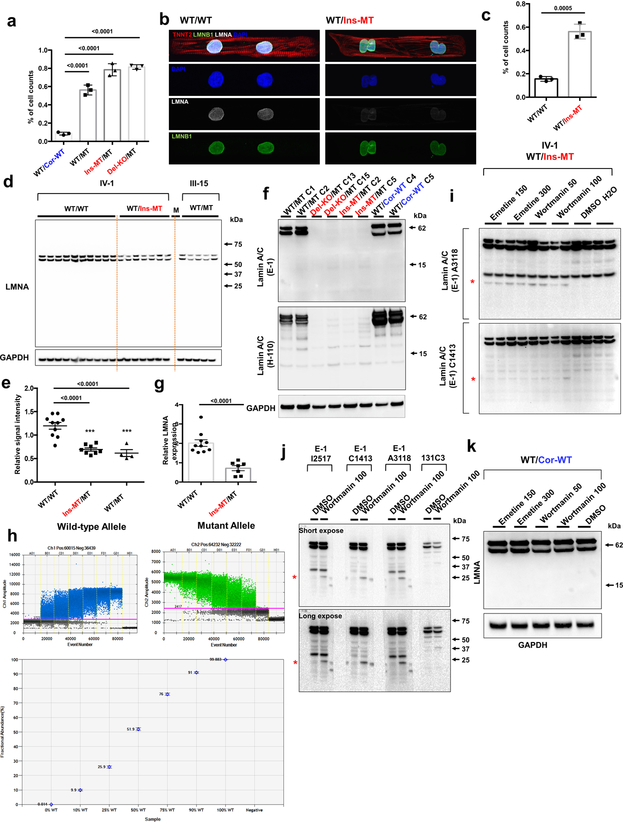
Given that abnormalities in nuclear structures are associated with laminopathies,18 we examined the nuclear envelope integrity in K117fs iPSC-CMs. By immunostaining we demonstrated that K117fs iPSC-CMs displayed abnormal nuclear structures when compared to isogenic controls (Fig. 3a and Extended Data Fig. 4a–c). Interestingly, the expression of lamin A/C proteins was significantly reduced in K117fs when compared to isogenic control iPSC-CMs. Furthermore, the full-length or truncated LMNA proteins were not detected in Ins-MT/MT and Del-KO/MT iPSC-CMs (Fig. 3b, c and Extended Data Fig. 4d–f). These data suggest that the K117fs mutation leads to haploinsufficiency of the LMNA proteins. Importantly, the total LMNA mRNA expression was significantly reduced in K117fs as compared to isogenic control iPSC-CMs (Fig. 3d and Extended Data Fig. 4g).
Figure 3. NMD pathway-mediated suppression of LMNA-mutant mRNA leads to haploinsufficiency of LMNA in mutant CMs.
a, Representative confocal images of control and mutant lines. Micro-patterned CMs were stained with specific antibodies for TNNT2 (Red), LMNA (White), and LMNB1 (Green). Blue color represents DAPI. Scale bar, 20 uM. The IF data were repeated 3 times independently with similar results. b, Immunoblot analysis of LMNA protein level in control and mutant iPSC-CMs. c, Quantification of signal intensity of LMNA band in (b). n=4. d, Relative mRNA expression of total LMNA in control and mutant iPSC-CMs. n=12 (WT/Cor-WT), n=6 (WT/MT), n=5 (Ins-MT/MT and Del-KO/MT). e, Digital PCR analysis of allele specific expression of LMNA in mutant iPSC-CMs treated with emetine (150 or 300 mcg/mL for 6 hr) and wortmannin (50 or 100 mM for 6 hr). n=2. Data are expressed as mean ± s.d., and statistical significance was obtained using one-way ANOVA. f, Immunoblot analysis of cell lysates from mutant iPSC-CMs treated with emetine and wortmannin. Two different batches of antibodies were used. Red asterisk represents truncated LMNA protein (about 14 kD size). Bar graph represents of signal intensity of truncated LMNA protein. The IB data in b and f were repeated twice independently with similar results. c-e, Data are expressed as mean ± s.e.m., and statistical significance was obtained using one-way ANOVA.
The nonsense-mediated mRNA decay (NMD) is a mechanism coupled to translation that selectively degrades mRNAs bearing premature translation-termination codons19,20. To investigate whether NMD influences levels of LMNA mRNA in K117fs iPSC-CMs, we assessed the allele-specific expression of mRNAs. We found that 97% and 3% of the total LMNA mRNA was expressed by the wild-type and the K117fs allele, respectively, in the K117fs iPSC-CMs (WT/MT, III-3) (Fig. 3e and Extended Data Fig. 4h). We observed a significant increase in the K117fs allele expression levels (18–37%) and the appearance of a 14 kD band upon inhibition of the NMD pathway in K117fs iPSC-CMs (Fig. 3f and Extended Data Fig. 4i, j). In addition, the 14 kD band was not detected in the isogenic control line (WT/Cor-WT) post-NMD inhibition (Extended Data Fig. 4k), suggesting that a truncated LMNA protein is translated from the K117fs mRNA. Collectively, these findings indicate that the NMD-mediated degradation of the mutant mRNA induces LMNA haploinsufficiency in K117fs iPSC-CMs.
Increased open chromatin in mutant iPSC-CMs
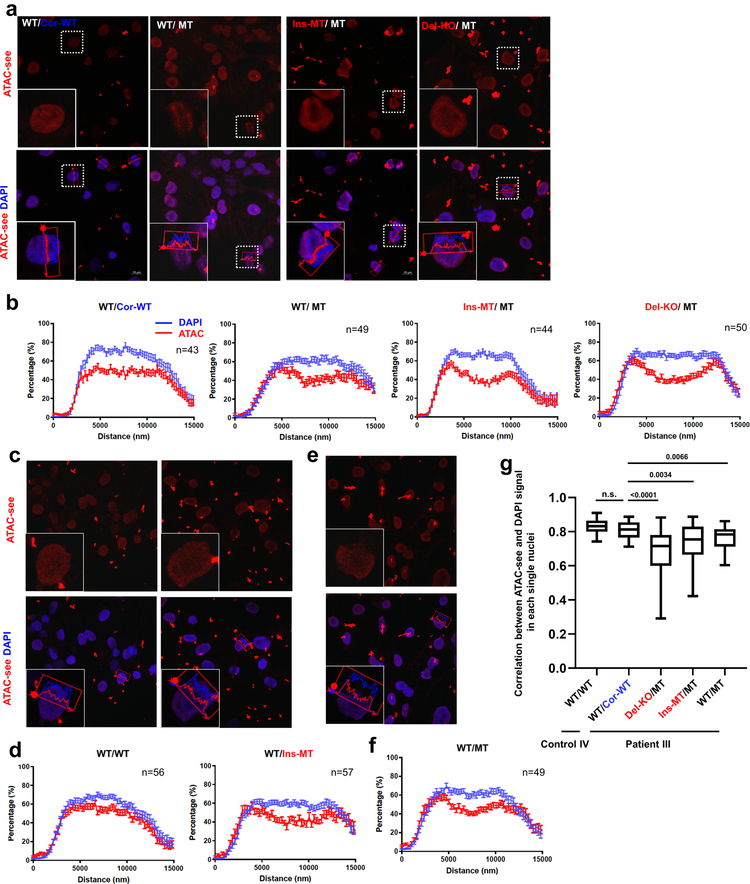
LMNA interacts with heterochromatin-rich genomic regions at the nuclear envelope called Lamin-Associated Domains (LADs) that play an essential role for chromatin organization21–24. We therefore postulate that LMNA haploinsufficiency could disturb chromatin distribution, leading to the aberrant gene expression in K117fs iPSC-CMs. Using a transposase-accessible chromatin with visualization (ATAC-see) assay25, we observed that the open chromatin distribution was biased toward the nuclear periphery in K117fs iPSC-CMs, whereas isogenic control iPSC-CMs showed a uniform distribution throughout the nucleus (Extended Data Fig. 5a–g).
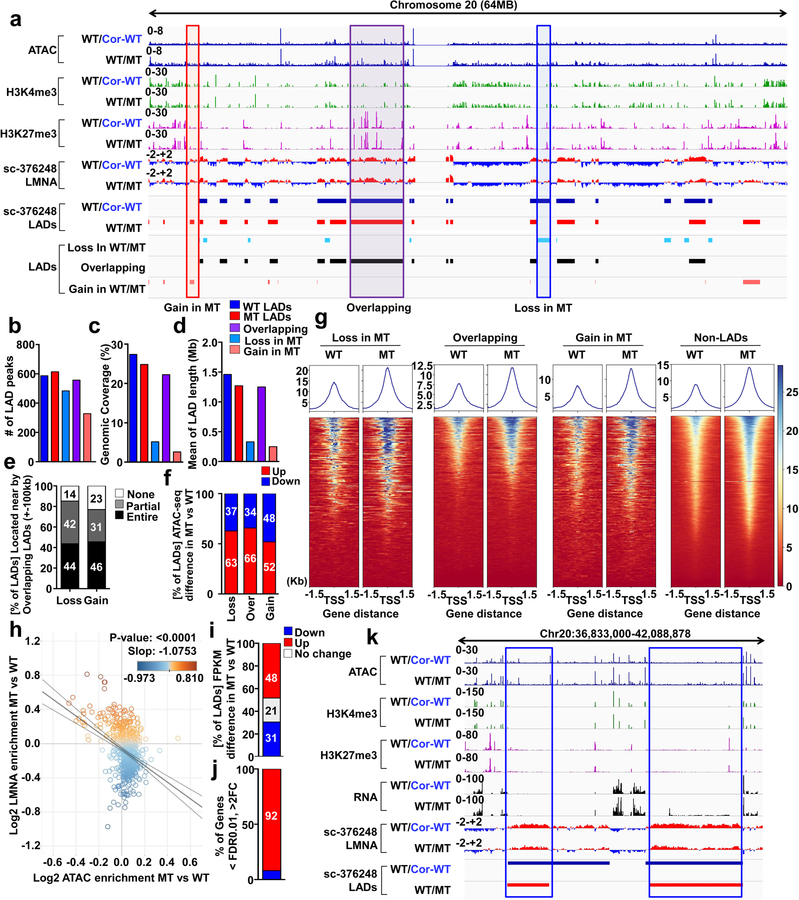
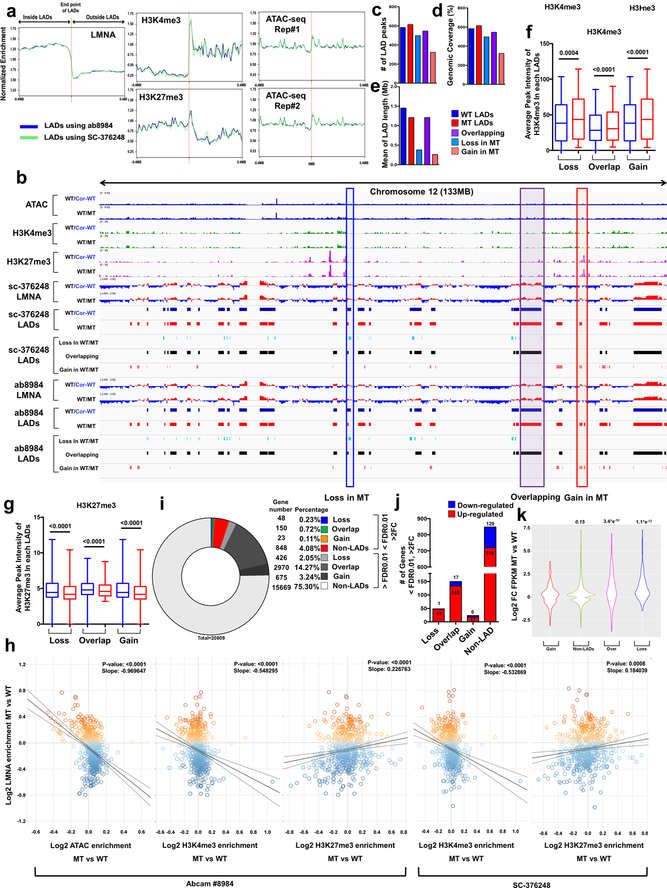
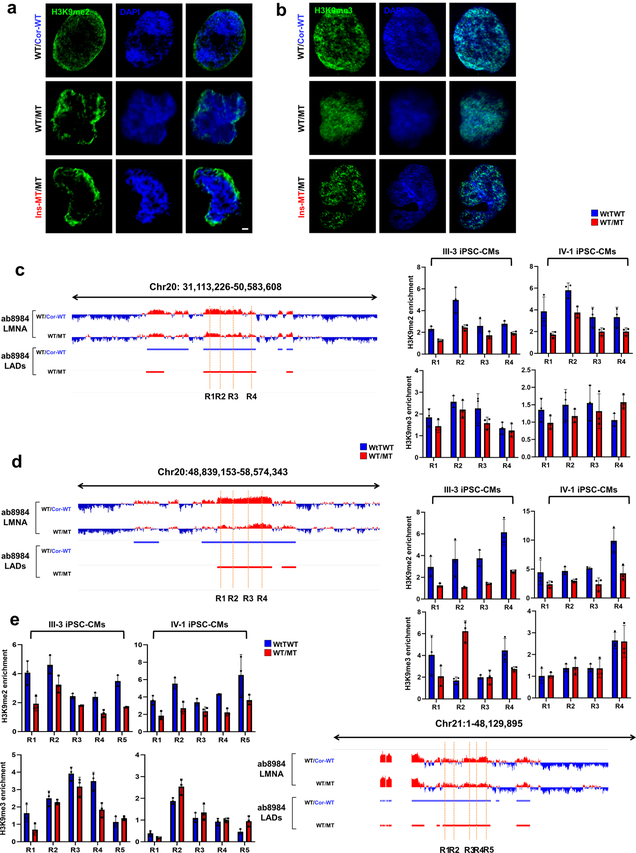
To study whether haploinsufficiency of LMNA results in an abnormal open chromatin conformation, we investigated the relationship between LADs and gene activation (Extended Data Fig. 6a)26,27. We compared the LADs in isogenic iPSC-CMs and grouped these LADs into three categories: Loss, Overlapping, and Gain (Fig. 4a and Extended Data Fig. 6b). The genomic coverage, mean of LAD length, and numbers of LADs were similar in K117fs and isogenic control iPSC-CMs (Fig. 4b–d, and Extended Data Fig. 6c–e). Interestingly, the Loss or Gain LADs were located in nearby overlapping regions in K117fs iPSC-CMs, suggesting that haploinsufficiency of LMNA leads to local changes of existing LADs (Fig. 4e). Analysis of chromatin conformation and histone modifications showed that most of the gene promoters residing in LADs were associated with increased open chromatin in K117fs iPSC-CMs as compared to control iPSC-CMs (Fig. 4g and Extended Data Fig. 6f, g). The normalized ATAC-seq and histone modification enrichment in each LADs were negatively correlated with LMNA enrichment, and genes associated with LADs were more actively expressed in K117fs iPSC-CMs as compared to control iPSC-CMs (Fig. 4h–k and Extended Data Fig. 6h–k). Moreover. the H3K9me2 in mutant iPSC-CMs was not equally distributed throughout the nuclear periphery and was less enriched in LADs (Extended Data Fig. 7a–e)28. Collectively, these data indicate that haploinsufficiency of LMNA causes local changes in LADs leading to transcriptional activation.
Figure 4. Haploinsufficiency of LMNA results in reduced LMNA enrichment and increased open chromatin formation of each LAD.
a, Representative images of ChIP-seq, ATAC-seq, and RNA-seq of chromosome 20. b-d, (b) Number, (c) Genomic Coverage, and (d) Mean of length of LADs in control, mutant, Gain, Overlapping and Loss LADs. e, Location of LADs of Loss or Gain category. LADs located within ±100 kb of overlapping LADs are showed as “Entire”. LADs partially shared with ±100kb of overlapping LADs are showed as “Partial”. LADs located outside of ±100kb of overlapping LADs are shown as “None”. f, Comparison of normalized ATAC enrichment of each LAD in control and mutant iPSC-CMs. Red represents the percentage of LADs showing up-regulated normalized ATAC enrichment in mutant iPSC-CMs as compared to control iPSC-CMs. g, Normalized ATAC-seq signal intensity around the TSS of genes located in each LAD category. h, Scatter plot of normalized LMNA and ATAC enrichment of each LAD (n=588). Y-axis represents log2 relative normalized LMNA enrichment of each LAD in mutant iPSC-CMs as compared to control iPSC-CMs. X-axis represents log2 relative normalized ATAC enrichment of each LAD in mutant iPSC-CMs as compared to control iPSC-CMs. One dot represents one LAD. i, Comparison of normalized FPKM of each LAD in control and mutant iPSC-CMs. Red represents the percentage of LADs showing up-regulated normalized FPKM in mutant iPSC-CMs as compared to control iPSC-CMs. j, Percentage of differentially expressed genes located in LADs. (FDR <0.01; Log2FC >1 or <−1). k, Representative images of ChIP-seq, ATAC-seq, and RNA-seq. Blue box represents the LAD showing lower LMNA enrichment and higher expression in mutant iPSC-CMs as compared to control iPSC-CMs.
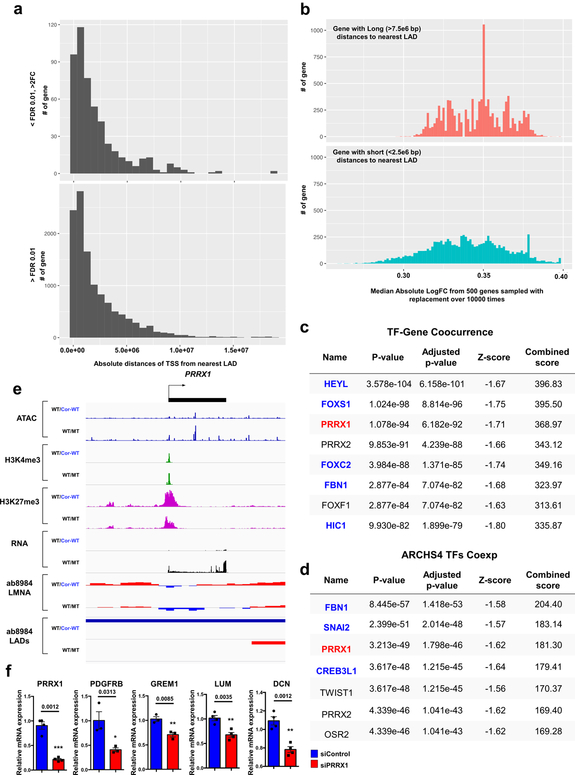
Interestingly, we also found that many of the genes located in the non-LAD region were highly up-regulated in K117fs as compared to control iPSC-CMs, although the distance to the nearest LAD does not affect its expression (Extended Data Fig. 8a, b). The TF-Gene Co-occurrence and ARCHS4 database analysis of differentially expressed genes located in non-LADs suggest that a prominent TF of interest (PRRX1) located within a LAD may affect the abnormal expression of genes in non-LADs (Extended Data Fig. 8c–f). These data suggest a potential mechanism of how the alteration of LADs in K117fs iPSC-CMs affects the transcriptional regulation of genes located in non-LADs.
The PDGF pathway links to arrhythmic phenotype
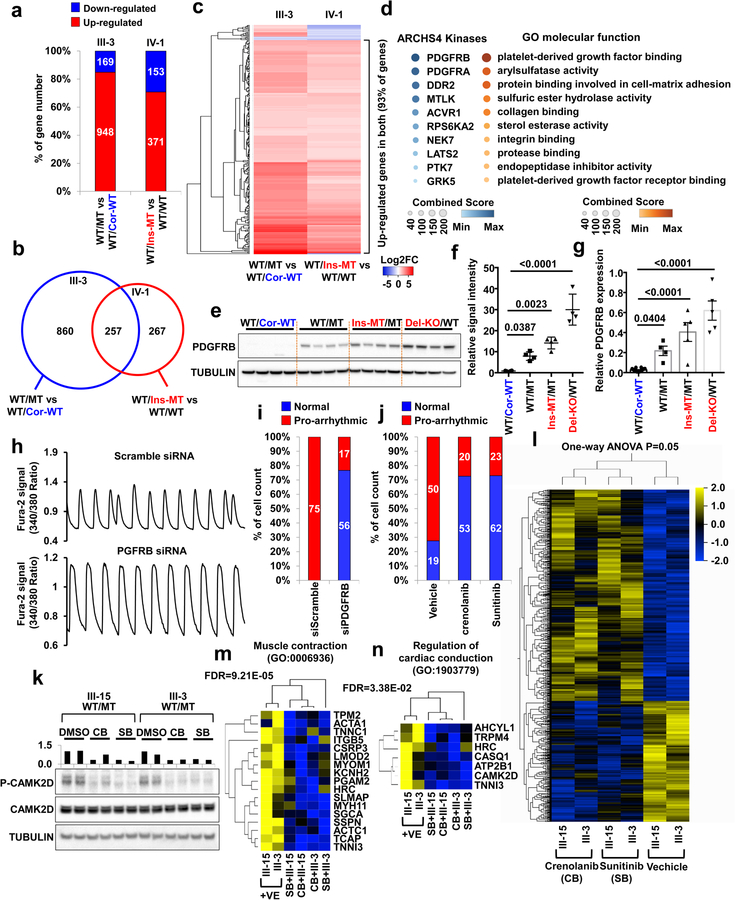
To identify additional potential target genes that are closely associated with the disease phenotype, we compared the transcriptomes of K117fs mutant and control iPSC-CMs. By comparing the total RNA expression of control iPSC-CMs versus K117fs iPSC-CMs, we found that most of the differentially expressed genes were up-regulated in K117fs iPSC-CMs (III-3, 84.87%; IV-1, 70.80%), which confirmed our earlier results on global gene activation in K117fs iPSC-CMs (Fig. 5a). A cross-analysis of differentially expressed genes based on two different genetic backgrounds (III-3 and IV-1) identified 257 genes whose expression in K117fs iPSC-CMs significantly differed from that in isogenic control iPSC-CMs (Fig. 5b). As expected, 239 out of 257 genes (93%) were up-regulated in K117fs iPSC-CMs as compared to isogenic control iPSC-CMs (Fig. 5c). Gene ontology (GO) enrichment analysis revealed that the up-regulated genes in K117fs iPSC-CMs were functionally enriched for terms associated with platelet-derived growth factor (PDGF) binding, arylsulfatase activity, protein binding involved in cell-matrix adhesion, and PDGF receptor binding (Fig. 5d). The ARCHS4 Kinase29 analysis also showed that the up-regulated genes in LMNA-mutant iPSC-CMs were highly enriched in the PDGF pathway.
Figure 5. Abnormal activation of PDGFRB is required for arrhythmic phenotype in mutant iPSC-CMs.
a, Number of differentially expressed genes in mutant iPSC-CMs as compared to control iPSC-CMs. LMNA WT/MT and LMNA WT/Cor-WT were derived from patient III-3. LMNA WT/WT, and WT/Ins-MT were generated form health control IV-1. b, Venn diagram of differentially expressed genes in mutant iPSC-CMs as compared to control iPSC-CMs. c, Heatmaps of log2 fold-change of 257 differentially expressed genes in mutant iPSC-CMs as compared to control iPSC-CMs. d, Gene ontology and ARCHS4 Kinase Coexpression analysis of differential expressed genes. Color code indicates combined score of FDR and Z-score. e, Immunoblot analysis of PDGFRB in control and mutant iPSC-CMs. f, Quantification of signal intensity of LMNA in (e). n=4. g, Real-time PCR analysis of PDGFRB expression levels in control and mutant iPSC-CMs. n=8 (WT/Cor-WT), n=4 (WT/MT), n=5 (Ins-MT/MT, Del-KO/MT). h, Representative Ca2+ transients of mutant iPSC-CMs treated with siRNA for scramble or PDGFRB. All traces were recorded for 20 sec. i, Quantification of cells exhibiting arrhythmic waveforms of (h). j, Quantification of cells exhibiting arrhythmic waveforms of Ca2+ transients of mutant iPSC-CMs treated with PDGRB inhibitors, crenolanib (100 nM) and sunitinib (500 nM), for 24 hr. k, Immunoblot analysis of phospho-CAMK2D and CAMK2D protein levels with treatment of DMSO, Crenolanib or Sunitinib. The data were repeated twice independently with similar results. l, Hierarchical clustering of Ampli-Seq data under one-way ANOVA (p=0.05). Two different LMNA-mutant iPSC-CMs lines treated with crenolanib, sunitinib or vehicles were subjected to RNA-seq. Total number of genes is 915. m, n, GO analysis identified set of genes that related with muscle contraction and regulation of cardiac conduction. f, g, Data are expressed as mean ± s.e.m., and statistical significance was obtained using one-way ANOVA. The Ca2+ transients of h were repeated as described in i independently with similar results.
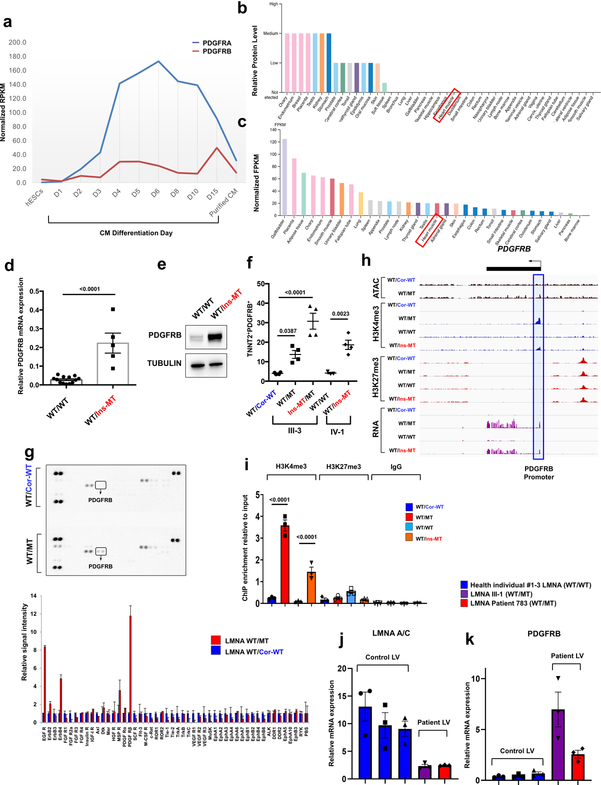
The PDGF signaling is highly activated in smooth muscle and endothelial cells, and is initiated through the activation of two major receptors belonging to the PDGF receptor alpha (PDGFRA) and PDGF receptor beta (PDGFRB) family30. During cardiomyocyte differentiation, PDGFRA and PDGFRB are highly up-regulated in early stages of differentiation but become down-regulated after generating fully functional CMs31 (Extended Data Fig. 9a). In particular, PDGFRB expression is lowly expressed in adult iPSC-CMs and normal heart tissues, but can be activated under stress conditions32,33, suggesting that the PDGF signaling is silenced in CMs under physiological conditions (Extended Data Fig. 9a–c). However, we found that a significant increase in PDGFRB expression in K117fs iPSC-CMs when compared to controls iPSC-CMs (Fig. 5e–g and Extended Data Fig. 9d–f). In addition, a kinase array showed hyper-activation of PDGFRB in K117fs iPSC-CMs as compared to isogenic control iPSC-CMs (Extended Data Fig. 9g). Furthermore, we found that the promoter region of the PDGFRB was more accessible in K117fs iPSC-CMs as demonstrated by high enrichment of the active histone marker (H3K4me3) and open chromatin in the ATAC-seq analysis (Extended Data Fig. 9h, i). Consistent with our observations in iPSC-CMs, heart tissue samples from both patients showed lower LMNA expression and higher PDGFRB expression when compared with healthy control tissues (Extended Data Fig. 9j, k). Taken together, these data suggest that PDGFRB is more epigenetically activated in K117fs iPSC-CMs than in control iPSC-CMs.
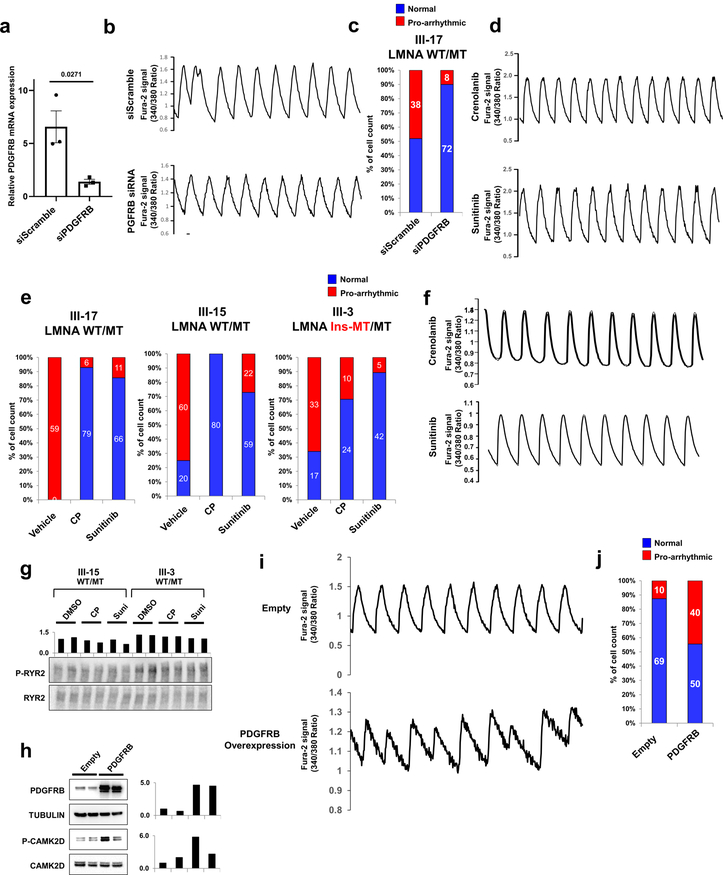
Next, we tested whether the abnormal activation of PDGFRB was directly linked to the arrhythmic phenotype observed in K117fs iPSC-CMs. Knock-down of PDGFRB expression in K117fs iPSC-CMs by siRNA resulted in a reduced prevalence of abnormal Ca2+ transients (23.28%, n=72) when compared to the siRNA scramble control treatment (100%, n=75) (Fig. 5h, i and Extended Data Fig. 10a–c). Treatment with 2 specific PDGFRB inhibitors, crenolanib and sunitinib, also rescued the arrhythmic phenotype in K117fs iPSC-CMs (crenolanib 27.39%, n=73; sunitinib 27.05%, n=85) as compared with vehicle-treated cells (72.46%, n=69) (Fig. 5j and Extended Data Fig. 10d–f). As expected, the phosphorylation of both CAMK2D and RYR2 was reduced with the treatment of crenolanib and sunitinib in K117fs iPSC-CMs (III-15, III-3) (Fig. 5k and Extended Data Fig. 10g). We also observed that the over-expression of PDGFRB resulted in up-regulation of CAMK2D phosphorylation, inducing an arrhythmic phenotype in control iPSC-CMs (44.44%, n=90) (Extended Data Fig. 10h–j). These data indicate that the abnormal activation of PDGFRB contributes to the arrhythmic phenotype observed in K117fs iPSC-CMs.
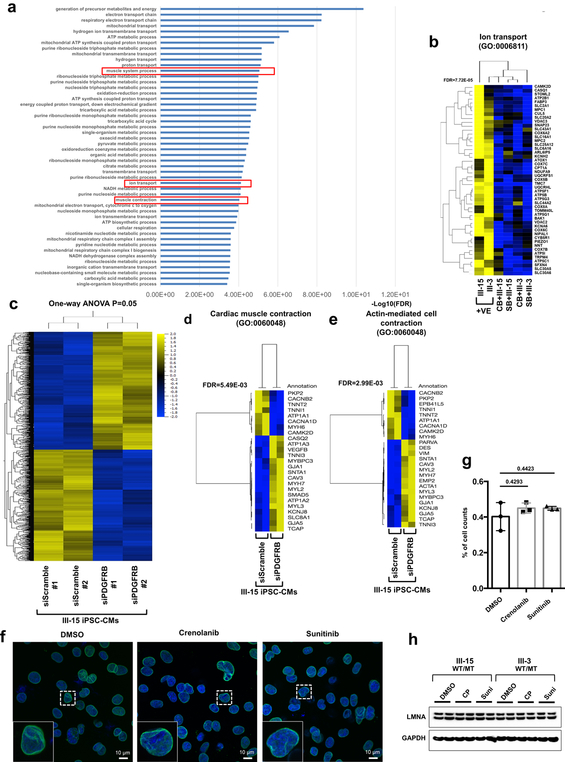
To test the effects of abnormal activation of PDGFRB on the gene expression profile in K117fs iPSC-CMs, we next evaluated how treatment with crenolanib and sunitinib affected the transcriptome of K117fs iPSC-CMs. We identified a total of 910 genes that were differentially expressed between the treatment and the non-treatment groups (Fig. 5l). The GO term analysis of down-regulated genes in the treatment groups showed a high enrichment of genes related to heart functions, including muscle contraction, the regulation of cardiac conduction, and ion transport (Fig. 5m, n and Extended Data Fig. 11a, b). We confirmed significant changes in the expression of genes related to cardiac muscle contraction and actin-mediated cell contraction through the knock-down of PDGFRB in K117fs iPSC-CMs (Extended Data Fig. 11c–e). We found that there were no differences in the LMNA protein level and nuclear structure after treatment with both crenolanib and sunitinib (Extended Data Fig. 11f–h). Taken together, these data confirm that the haploinsufficiency of LMNA causes the abnormal activation of PDGF signaling pathway, leading to the development of arrhythmias in LMNA-DCM.
Discussion
Lamin A/C proteins are key components of heterochromatin conformation and gene silencing machinery and are expressed in a cell type-specific manner23,34,35. Our study is first to elucidate how haploinsufficiency of the LMNA affects chromatin conformation and gene expression profile in LMNA-mutant iPSC-CMs. Furthermore, we demonstrated that the inhibition of the PDGF pathway or the CAMK2D-RYR2 axis ameliorates the arrhythmic phenotype in K117fs iPSC-CMs, suggesting a novel therapeutic target for LMNA-DCM (Extended Data Fig. 12). Our study suggests that several FDA-approved PDGFRB inhibitors, such as sunitinib, sorafinib, and axitinib, may be re-purposed for this condition. However, our previous study using a human iPSC-CM platform also revealed a dose-dependent cardiac toxicity that is implicated in most tyrosine kinase inhibitors36. Therefore, further studies are warranted to identify the proper dosage or alternatives to these small molecule inhibitors that can be safely used in vivo to optimally alter the PDGF signaling pathway and prevent fatal arrhythmia that is frequently observed in this cohort.
Methods
No statistical methods were used to predetermine sample size. The experiments were not randomized. The investigators who performed electrophysiological test and Ca2+ imaging analysis were blinded to group allocation during experiments and data collection. The studies comply with all ethical regulations.
Patient recruitment.
The fibroblasts, PBMCs, and heart tissues were obtained from patients using IRB-approved protocols at Stanford University (Protocol ID 17576 and 29904). Informed consent was obtained from all patients who were included in our study. Clinical features of patients are described in the extended data Fig. 1b.
Culture and maintenance of hESCs and iPSCs.
hESCs (H7) and iPSC lines were maintained in a chemically defined medium Essential 8 (E8 medium) (Life Technologies) on Matrigel-coated (BD Bioscience, San Jose, CA) plates at 37°C with 5% (vol/vol) CO2.
Pluripotency marker analysis.
Human iPSC colonies grown in Matrigel-coated 8-well chamber glasses (Thermo Scientific) were fixed using 4% paraformaldehyde (PFA) and permeabilized with 0.5% Triton X-100. After blocking samples with 5% goat serum in PBST (PBS with 0.1% Tween20), cells were stained with mouse anti-SSEA4 (R&D systems), rabbit anti-OCT3/4 (Santa Cruz Biotechnology), rabbit anti-NANOG (Santa Cruz Biotechnology), and mouse anti-SOX2 (R&D systems). Cells were then incubated with Alexa Fluor-conjugated secondary antibodies (Life Technologies) and Hoechst 33342 (Life Technologies) to visualize the specific stains. Image acquisition was performed on an Eclipse 80i fluorescence microscope (Nikon Instruments).
TALEN-mediated homologous recombination.
TALEN pair vectors were designed and constructed using the rapid TALEN assembly system as previously described11. Five hundred base-pair fragments of wild-type LMNA exon 1 and adjacent intronic sequences were synthesized as GeneArt String DNA fragments (Life Technologies) to make left and right homologous arms, and cloned into PB-MV1Puro-TK vectors (Transposagen), as previously described12. Two silent mutations in homologous arms were inserted to avoid re-cleavage of the genomic sequence. Both TALEN pairs and targeting vectors were delivered into iPSCs by nucleofection using P3 Primary Cell 4D-Nucleofector × Kit (Lonza). Afterwards, cells with correct targeting vector integration were selected by puromycin (Life Technologies) and genotyped. To excise the selection cassette, transient expression of piggyBac transposase was performed by transfection of excising piggyBacTM transposase mRNA (Transposagen) using Lipofectamine® MessengerMAX™ (LifeTechnologies). After negative selection using ganciclovir (Sigma Aldrich), the established clones were genotyped by PCR and bidirectional direct sequencing.
TALEN-mediated non-homologous end joining.
TALEN pair vectors were designed and constructed using the rapid TALEN assembly system as previously described11,12 and were delivered into iPSCs by nucleofection using the P3 Primary Cell 4D-Nucleofector × Kit (Lonza). Forty-eight hr following nucleofection, transfected cells were enriched by fluorescence-activated cell sorting (FACS), and established clones were genotyped by PCR and bidirectional direct sequencing.
Off-target detection.
Genomic DNA was extracted from gene-edited iPSC clones using the DNeasy Blood & Tissue Kit (Qiagen). The potential TALEN off-target sites were predicted in silico based on sequence homology using the bioinformatics tool PROGNOS. The top 20 targets were interrogated by DNA sequencing. The primers designed by PROGNOS were used to amplify the genomic regions of putative off-target site by PCR. Each PCR reaction contained 1.25 units of Prime STAR®GXL DNA Polymerase (Clontech), 50 ng of genomic DNA, and 0.2 genomic DNA (total volume 20 μl). The PCR products were analyzed by Sanger, and sequencing reads were aligned to the wild-type sequence obtained from the parental iPSC line.
Immunocytochemistry.
Cells grown on coverslips were fixed using 4% PFA, permeabilized with 0.5% Triton X-100, incubated with primary antibodies and Hoechst 33342, and detected using Alexa Fluor-conjugated secondary antibodies. Primary antibodies include rabbit anti-cardiac troponin T (Abcam), mouse anti-cardiac troponin T (Thermo Scientific), mouse anti-sarcomeric alpha-actinin (Sigma-Aldrich), goat anti-LMNA (Santa Cruz), and rabbit anti-LMNA (Santa Cruz). Image acquisition was performed on an Eclipse 80i fluorescence microscope, a confocal microscope (Carl Zeiss, LSM 510 Meta), and ZEN software (Carl Zeiss).
Quantitative RT-PCR.
Total mRNAs were isolated from iPSC-CMs using the Qiagen miRNeasy Mini kit. 1 μg of RNA was used to synthesize cDNA using the iScript™ cDNA Synthesis kit (Bio-Rad). 0.25 μl of the reaction was used to quantify gene expression by qPCR using TaqMan Universal PCR Master Mix. Expression values were normalized to the average expression of housekeeping gene 18s.
Western blotting.
Following SDS–PAGE, proteins were transferred to 0.45 μm nitrocellulose membranes (Bio-Rad) using a mini Bio-Rad Mini PROTEAN 3 Cell system in NuPAGE transfer buffer (Life technologies). The membrane was then blocked in Membrane Blocking Solution (Life technologies) and incubated with primary antibodies overnight at 4 °C. Blots were incubated with the appropriate secondary antibodies for 1 hr at room temperature and visualized using the ECL Western Blotting Analysis System (GE Healthcare). Primary antibodies used were mouse anti-LMNA (Santa Cruz), rabbit anti-LMNA (Santa Cruz), CAMK2D (Abcam), PDGFRB (Cell Signaling), RYR2 (Abcam), phospho-RYR2 (Donald M. Bers lab), and HRP-conjugated α−tubulin (Cell Signaling).
Patch clamp.
Whole-cell action potentials (APs) were recorded with the use of a standard patch-clamp technique. Briefly, cultured iPSC-CMs were plated on No. 1 18 mm glass coverslips (Warner Instruments) coated with Matrigel, placed in a RC-26C recording chamber (Warner Instruments), and mounted onto the stage of an inverted microscope (Nikon). The chamber was continuously perfused with warm (35–37 °C) extracellular solution (pH 7.4) of the following composition: NaCl (140 mM), KCl (5.4 mM), CaCl2 (1.8 mM), MgCl2 (1 mM), HEPES (10 mM), and glucose (10 mM). pH was adjusted to 7.4 with NaOH. Glass micropipettes were fabricated from standard wall borosilicate glass capillary tubes (Sutter BF 100-50-10, Sutter Instruments) using a programmable puller (P-97; Sutter Instruments) and filled with the following intracellular solution (pH 7.2): 120 KCl, 1.0 MgCl2, 10 HEPES, 10 EGTA, and 3 Mg-ATP. A single beating cardiomyocyte was selected and APs were recorded in whole-cell current clamp mode using an EPC-10 patch-clamp amplifier (HEKA). Data were acquired using Patch Master software (HEKA) and digitized at 1.0 kHz. The following criteria were used for classifying ventricular-like iPSC-CMs. The criteria were a negative maximum diastolic membrane potential (<−55 mV), an AP maximum upstroke velocity > 10V/s, a prominent plateau phase, AP duration at 90% repolarization/AP duration at 50% repolarization (APD90/APD50) <1.4, and AP amplitude >90 mV.
Differentiation of iPSC-CMs.
iPSCs were grown to 90% confluence and subsequently differentiated into beating cardiomyocytes, using a small-molecule-based monolayer method described previously41. Ten days after cardiac differentiation, iPSC-CM monolayers were purified using RPMI-1640 without glucose (Life Technologies) and with B27 supplement (Life Technologies). The non-glucose culture medium was changed every 2 days. After 5 days, iPSC-CMs were reseeded on Matrigel-coated plates in a culture medium containing glucose.
siRNA-mediated knockdown.
Gene knockdown experiments were performed using Lipofectamine RNAiMax (Life Technologies) according to the manufacturer’s instructions. Cells were transfected with either scrambled or siRNA against PDGFRB (SilencerRSelect, ThermoFisher, 25 nM per well, #4390824) for 48 hr before being subjected to subsequent downstream analyses.
Treatment with NMD inhibitors.
Potent NMD inhibitors, emetine and wortmannin (Sigma-Aldrich), were dissolved in water and dimethylsulfoxide, respectively. An equal concentration of solvent (water or dimethylsulfoxide) was used as the control. iPSC-CMs were treated with emetine or wortmannin for 6 hr prior to the experiment.
Treatment with PDGFRB inhibitors.
PDGFRB inhibitors, sunitinib and CP-868596 (Selleckchem), were dissolved in dimethylsulfoxide. An equal concentration of solvent (dimethylsulfoxide) was used as the control. iPSC-CMs were treated with sunitinib or CP-868596 for 48 hr prior to the experiment.
Treatment with CAMK2D inhibitors.
Active CAMK2D inhibitor (KN-93) and inactive CAMK2D inhibitor (KN-92) were dissolved in dimethylsulfoxide. iPSC-CMs were treated with KN-92 or KN-93 for 24 hr prior to the experiment.
Droplet digital PCR.
Total RNA was extracted from iPSC-CMs at day 30 post-differentiation using the miRNeasy Mini Kit (QIAGEN), and the complementary DNA (cDNA) preparation was carried out using the iScript cDNA Synthesis Kit (Bio-Rad Laboratories). The concentration of cDNA was reduced to about 0.2 ng/μl RNA equivalent, and 1 ng (5 μl of 0.2 ng/μl) of RNA-equivalent cDNA was mixed with primers, probes, and ddPCR Supermix reaction (total volume 20 μl). The final concentrations of the primers and the probe were 900 nM and 500 nM, respectively. The following primers and probes for discriminating allelic expression of LMNA p.K117 (wild-type allele) from p.K117fs (mutant allele) were used: Forward primer, 5’ GCAAGACCCTTGACTCAGTA3’; Reverse primer, 5’ CTCCTTGGAGTTCAGCAG3’; Wild-type probe: 5’(6-FAM) TGCGCGCTTTCAGCTCCTTAA (Blackhole Quencher)3’; and Mutant Probe, 5’(HEX) TGCGCGCTTTCCAGCTCCT (Blackhole Quencher)3’. Droplet formation was carried out using a QX100 droplet generator. A rubber gasket is placed over the cartridge and loaded into the droplet generator. The emulsion (35 μL in volume) was then slowly transferred using a multichannel pipette to a 96-Well twin.tec™ PCR Plate (Eppendorf). The plate was heat-sealed with foil and the emulsion was cycled to end point per the manufacturer’s protocol with an annealing temperature at 61°C. Finally, the samples were analyzed using a BioRad QX100 reader.
Ca2+ imaging.
iPSC-CMs seeded on a glass cover-slip for 5–7 days were loaded with the cell-permeable calcium-sensitive dye fura-2 AM (2 μmol/L) for 20 min. After 15 min washing in 1.8 mmol/L Ca-Tyrode (135 mmol/L NaCl, 4 mmol/L KCl, 1 mmol/L MgCl2, 5 mmol/L glucose, and 10 mmol/L HEPES, pH 7.4) buffer to allow de-esterification, cover-slips were mounted on the stage of an inverted epifluorescence microscope (Nikon Eclipse Ti-S). Myocytes were field-stimulated at 0.5 Hz with pulse duration of 10 ms. Fura-2 AM-loaded cells were excited at both 340 and 380 nm, and the emission fluorescence signal was collected at 510 nm37. Changes in fluorescence signal were measured by the NIS Elements AR software, which permits the recording of multiple cells in one view. Intracellular calcium changes were expressed as changes in the ratio R=F340/F380 and the calcium transient waves were analyzed using the Greensmith method38.
Measuring abnormal calcium release from the sarcoplasmic reticulum.
Both patient and Ctrl iPSC-CMs were seeded on coverslips in single cells. After 3–4 days of recovery, the cells were loaded with 5 μM Fluo-4AM at 37 °C for 10 min and then washed with Tyrode’s solution × 3 times. Ca2+ release events were recorded with Carl Zeiss confocal (710) in a line-scanning mode (512 pixels × 1920 lines). The extracellular media were prepared with sequential increases of Ca2+ concentration (0, 0.5, 1, 2, and 5 mM), and were used to treat iPSC-CMs during the recording. The Ca2+ imaging data were displayed and analyzed using Image J.
Measuring sarcomeric alignments.
Immunostaining images of iPSC-CMs were viewed with Image J, and the fluorescent signals along the sarcomere structure were pulled out. A custom-made Interactive Digital Language (IDL) algorithm was used to analyze the regularity of sarcomere signal distribution with fast Fourier transformation (FFT). The sarcomere length and the regularity of sarcomere distribution were indicated as the position and the height of the first main peak after FFT data processing.
Chromatin immunoprecipitation sequencing.
LMNA antibodies (Santa Cruz Biotechnology; sc-6215 and sc-7292) was incubated with Dynabeads (Life Technology; 10003D) for 12 hr at 4 °C. A small portion of the crosslinked, sheared chromatin was saved as the Input, and the remainder was employed for the immunoprecipitation using antibody-conjugated Dynabeads. After overnight incubation at 4 °C, the incubated beads ware rinsed with a sonication buffer (50 mM Hepes pH 7.9, 140 mM NaCl, 1 mM EDTA, 1% Triton X-100, 0.1% Na-deoxycholate, 0.1% SDS, 0.5 mM PMSF), a high salt buffer (50 mM Hepes pH 7.9 500 mM NaCl, 1 mM EDTA, 1% Triton X-100, 0.1% Na-deoxycholate, 0.1% SDS, 0.5 mM PMSF), and a LiCl buffer (20 mM Tris, pH 8.0, 1 mM EDTA, 250 mM LiCl, 0.5% NP-40, 0.5% Na-deoxycholate, 0.5 mM PMSF). The washed beads were incubated with an elution buffer (50 mM Tris, pH 8.0, 1 mM EDTA, 1% SDS, 50 mM NaHCO3) for 1 hr at 65 °C and then de-crosslinked with 5 M NaCl overnight at 65 °C. The immunoprecipitated DNA was treated with Rnase A and Proteinase K, and purified by ChIP DNA clean and concentrator (Zymo Research; D5205). The raw sequencing data were analyzed as previously described39.
RNA-sequencing.
For each sample in the whole transcriptome sequencing library, 60–80 million 75-basepair paired-end reads were acquired from the sequencer. Base quality of raw reads is high after checking with FastQC 0.11.4. Using STAR 2.5.1b, we aligned the reads to the human reference genome (hg19), with splice junctions defined by the GTF file downloaded from UCSC. On average, 92% of reads were aligned to the reference genome, and 83% of reads were uniquely aligned to the reference genome. Gene expression was determined by calculating fragments per kilobase per million aligned reads (FPKM) using Cufflinks 2.2.1. In addition, Cufflinks was used to determine differential expression between each two conditions.
Assay for Transposase Accessible Chromatin with high-throughput sequencing (ATAC-seq).
The samples were treated and processed as described previously40. Briefly, 100,000 cells were centrifuged at 500 g for 5 min at room temperature. The cell pellet was resuspended in 50 ml lysis buffer (10 mM Tris–Cl, pH 7.4; 10 mM NaCl; 3 mM MgCl2; 0.01% Igepal CA-630) and centrifuged immediately at 500 g for 10 min at 4 °C. The cell pellet was resuspended in 50 ml transposase mixture (25 ul 2×TD buffer, 22.5 μl, dH2O, and 2.5 μl, Illumina Tn5 transposase or with final concentration of 100 nM Atto-590-labeled in-house Tn5) and incubated at 37 °C for 30 min. After transposition, the mixture was purified with the Qiagen Mini-purification kit and eluted in 10 ul Qiagen EB elution buffer. Sequencing libraries were prepared following the original ATAC-seq protocol40. The sequencing was performed on Illumina NextSeq at the Stanford Functional Genomics Facility. ATAC-seq reads were trimmed of adapters and then mapped to hg19 genome assembly using bowtie 241. Following QC to remove duplicate reads, average read intensities were calculated with the aid of deepTools42 and R/Bioconductor (v.3.2.1)43. Promoter regions were defined as ±1 kilobase around hg19 gene transcription start site coordinates unless otherwise stated.
Assay for Transposase Accessible Chromatin with visualization (ATAC-see).
The samples were treated and processed as described previously29. Briefly, iPSC-CMs were fixed with 1% formaldehyde (Sigma, USA) for 10 min and quenched with 0.125 M glycine for 5 min at room temperature. After fixation, the cells (either growing on slides or centrifuged on glass slides with Cytospin) were permeabilized with a lysis buffer (10 mM Tris–Cl, pH 7.4, 10 mM NaCl, 3 mM MgCl2, 0.01% Igepal CA-630) for 10 min at room temperature. After permeabilization, the slides were rinsed in PBS twice and put in a humid chamber box at 37 °C. The transposase mixture solution (25 μl 2× TD buffer, final concentration of 100 nM Tn5-ATTO-59ON, adding dH2O up to 50 μl) was added on the slide and incubated for 30 min at 37 °C. After the transposase reaction, slides were washed with PBS containing 0.01% SDS and 50 mM EDTA for 15 min three times at 55 °C. After washing, slides were mounted using Vectashield with DAPI (cat. no. H-1200, Vector labs). Fluorescent images were captured on a confocal microscope equipped with a 40× oil immersion lens. Fluorescent intensity profiles of DAPI and ATAC were exported using ZEN (Zeiss). To find out if the LMNA mutation led to the special re-distribution of the epigenetic histone markers in the diseased cardiomyocytes, the correlation between ATAC-see and DAPI signal of each nucleus was calculated using Pearson Correlation method. Image analysis was conducted using Graphpad.
RNA-seq and ChIP-seq analysis.
FastQC (v0.11.5) and MultiQC (v1.3) were used to assess read quality. Adapter and quality trimming of reads were performed with trimmomatic (v0.36). Reads were mapped to the HG19 reference genome using STAR (v2.5.3a) with ENCODE Long RNA-seq parameters. Uniquely mapped reads were filtered for and bigWig files were generated with samtools (v1.4). FPKM values and differentially expressed genes were obtained using cuffdiff (v2.2.1). ChIP-seq data were processed using the AQUAS pipeline from the Kundaje lab at Stanford University (https://github.com/kundajelab/chip-seq-pipeline2), which has an end-to-end implementation of the ENCODE (phase-3) ChIP-seq pipeline. Default parameters were used with the exception of specifying “-type histone -species hg19”. Prior to LAD detection of LMNA data, duplicate reads were removed with Mark Duplicates from Picard Tools (v2.17.3), and DownsampleSam was used to downsample the larger of each pair of aligned input and ChIP read files, giving each pair the same read depth and avoiding normalization bias.
LAD detection and analysis.
LMNA binding data were analyzed with the aid of Enriched Domain Detector39 (v1.0) using an 11 Kb bin size, gap penalty of 5, and FDR significance threshold of 0.05. Gains, loss, and intersection in LADs between control and mutant cells were tallied from bedtools (v2.27.1). Gene expression changes within each category of LADs (gained, loss, or shared in mutant vs. control) based on RNA-seq data were compared in R v.3.2.1 and Bioconductor43 with the aid of the iRanges and GenomicRanges packages44. In deciding whether a gene overlaps with each category, the union of called peaks from the LMNA ChIP-seq of two antibodies and the intersection of two cell lines were used. A gene is considered to reside in a particular LAD if any of its hg19-annotated transcription start sites overlaps with the LAD range by genomic coordinates. In cases of ambiguity, intersection (shared between control and mutant cells) regions take precedence over gain and loss regions. ATAC-seq read intensities within each LAD category around genomic features, including transcription start sites and transcription end sites, were visualized with the aid of deepTools42 using feature coordinates from hg19 annotations.
Statistical analyses.
Data were expressed as mean ± s.e.m. Immunoblots shown are representative of at least two independent experiments. All other experiments are the average of at least two independent assays, and for cell number calculation in immunostaining assays, at least 100 cells per sample were counted for each independent experiment. Statistical analyses were performed using GraphPad Prism (version 6.0e). An unpaired two-tailed Student’s t-test was used to calculate significant differences between two groups. Multiple comparison correction analysis was performed using one-way ANOVA followed by Tukey’s post-hoc HSD test. A P value of <0.05 was considered statistically significant.
Extended Data
Extended Data Fig. 1. LMNA mutant iPSC-CMs can recapitulate arrhythmic phenotype of LMNA-DCM patient.
a, Schematic pedigree of the family carrying LMNA mutation. Patients (III-1, III-3, III-9, III-15, and III-17) and healthy individuals (IV-1 and IV-2) recruited for this study are numbered. Circles represent female family members and squares represent males. “+” and “-” signs underneath family members indicate the presence or absence of the LMNA mutation, respectively. b, Schematic view of C349Gin frameshift mutation in LMNA gene. c, Genotyping of fibroblasts derived from patients and healthy controls. d, Clinical features of patients and healthy individuals. e, Electrocardiogram (EKG) of patients (III-1 and III-3) and healthy individual (IV-1). The EKG data was measured one time for each patient. f, g, Electrophysiological measurements of spontaneous action potentials in mutant iPSC-CMs (III-15 and III-17) recorded by patch clamp in current-clamp mode. The experiments were repeated three times independently with similar results.
Extended Data Fig. 2. LMNA mutation as a cause of arrhythmic phenotype in LMNA mutant iPSC-CMs.
a, Gene editing strategy using TALEN method. The piggyBac system was utilized to generate isogenic lines as previously described11,12. b, Genotyping of gene-edited isogenic lines (III-3; corrected, insertion, deletion) (IV-1 insertion). For LMNA Del-KO/MT, we utilized TALEN pairs that target the start codon of the LMNA gene. Genotyping showed C insertion in wild-type allele that reads early stop codon. c, Immunostaining of NANOG (Red), POU5F1 (Red), and SOX2 (Red) in iPSC lines. Blue signal represents DAPI. Scale bar, 10 μm. The experiments in c were repeated twice independently with similar results. d-f, Electrophysiological recordings of spontaneous action potentials in control (IV-1) and mutant iPSC-CMs (III-9, isogenic IV-1; WT/Ins-MT) measured by patch clamp in current-clamp mode. Red arrows indicate DAD-like arrhythmias. The experiments were repeated three times independently with similar results. g. EP parameters. MDP: maximal diastolic potential; APA: action potential amplitude; APD: action potential duration at 50%, 70%, 90% of repolarization; bpm: beats per minute.
Extended Data Fig. 3. Abnormal calcium handling in LMNA mutant iPSC-CMs.
a, Confocal imaging of Fluo-4AM calcium events in control (III-3; WT/Cor-WT) and mutant (III-3; WT/MT) iPSC-CMs while being treated with increasing extracellular Ca2+ concentration. All representative traces were the recordings from 3 individual cells (presented as red, blue, and black). b, Spontaneous calcium event per 100s of control and mutant iPSC-CMs in each different extracellular Ca2+ concentration. c, Summary of the percentage of cells exhibiting spontaneous SR Ca2+ release events in control and mutant iPSC-CMs. d, Real-time analysis of CAMK2D and RYR2 expression in control and mutant iPSC-CMs. Data are expressed as mean ± s.e.m. e, f, Immunoblot analysis of phospho-RYR2, RYR2, phospho-CAMK2D, and CAMK2D protein levels in control and mutant iPSC-CMs. Data are expressed as mean ± s.e.m., and a two-tailed Student’s t-test was used to calculate P values. n=3. Numbers above the line show significant P values. g, Real-time PCR analysis of CAMK2D expression in control and mutant iPSC-CMs. Expression level of GAPDH was used as control. Data are expressed as mean ± s.e.m., and a two-tailed Student’s t-test was used to calculate P values. n=8. h, Representative Ca2+ transients of mutant iPSC-CMs (III-3; WT/MT) treated with 1 uM of KN92 or KN93 for 24 hr. i, Quantification of the percentage of cells exhibiting arrhythmic waveforms in mutant iPSC-CMs (III-17 and WT/MT) at basal level, as well as after the treatment with 1 uM of KN92 or KN93 for 24 hr. j, Immunoblot analysis of phospho-RYR2, RYR2, phospho-CAMK2D and CAMK2D protein levels with treatment of DMSO, KN92 or KN93 for 24 hr. The experiments in a were repeated twice independently with similar results. The Ca2+ transients in h were repeated as described in figure 2e independently with similar results. The Immunoblot data in e and j was repeated twice independently with similar results.
Extended Data Fig. 4. Down-regulation of mutant mRNA through NMD pathway in LMNA-mutant iPSC-CMs.
a, Quantification of cells showing abnormal nuclear structure in control and mutant iPSC-CMs. The images were recorded from three differentiation batches. n=215 (WT/Cor-WT), n=286 (WT/MT), n=222 (Ins-MT/MT), n=280 (Del-KO/MT). b, Representative confocal images of control and mutant lines. Micro-patterned CMs were stained with specific antibodies for TNNT2 (Red), LMNA (White) and LMNB1 (Green). Blue signal represents DAPI. Scale bar, 20 μM. The experiments were repeated three times independently with similar results. c, Quantification of cells showing abnormal nuclear structure in control and mutant iPSC-CMs. The images were recorded from three differentiation batches. Data are expressed as mean ± s.e.m., and a two-tailed Student’s t-test was used to calculate P values. n=3. Total counted cell numbers are 175 (WT/WT) and 203 (WT/Ins-MT). Numbers above the line show significant P values. d, Immunoblot analysis of LMNA protein level in control and mutant iPSC-CMs. e, Quantification of signal intensity of LMNA band in (d). Data are expressed as mean ± s.e.m., and statistical significance was obtained using one-way ANOVA. Numbers above the line show significant P values. n=10 (WT/WT), n=7 (WT/Ins-MT), n=5 (WT/MT). f, Immunoblot analysis of LMNA protein level in two different clones of control and mutant iPSC-CMs. Two different antibodies recognizing N-terminal of LMNA were used. GAPDH was used as loading control. g, Relative mRNA expression of total LMNA in control and mutant iPSC-CMs. Data are expressed as mean ± s.e.m., and a two-tailed Student’s t-test was used to calculate P values. Numbers above the line show significant P values. n=10 (WT/WT), n=7 (WT/Ins-MT). h, Confirmation of allele-specific primers using plasmid carrying wild-type LMNA or mutant LMNA. Digital PCR using allele specific primers detected the ratio of wild-type/mutant-type LMNA, which was consistent with ratio of wild-type/mutant-type plasmids. Data are expressed as mean ± s.d. n=3 i, Immunoblot analysis of cell lysates from mutant iPSC-CMs treated with emetine and wortmannin. Two different batches of antibodies were used. Red asterisk represents truncated LMNA protein having 14 kD size. j, Immunoblot analysis of cell lysates from mutant iPSC-CMs treated with wortmannin. Three different batches of E-1 antibody detect the N-terminal of LMNA, and 131C3 antibody detects the C-terminal. k, Immunoblot analysis of cell lysates from control iPSC-CMs treated with emetine and wortmannin. The experiments in f, i-k were repeated twice independently with similar results.
Extended Data Fig. 5. Haploinsufficiency of LMNA results in abnormal distribution of open chromatin in LMNA-mutant CMs.
a-f, Representative images and normalized signal intensity of ATAC-see and DAPI of control and mutant iPSC-CMs. Data were obtained from different patient lines, including Patient III-3 and its isogenic lines (a, b); Control IV-1 and its isogenic line (c, d); and Patient III-15 (e, f) for normalized signal intensity of ATAC-see and DAPI. Data are expressed as mean ± s.e.m. g, Correlation of signal distribution between ATAC-see and DAPI. n=42 (WT/WT), n=28 (WT/Cor-WT), n=33 (Del-KO/MT), n=32 (Ins-WT/WT), n=25 (WT/MT) for normalized signal intensity of ATAC-see and DAPI. Data are mean and minima to maxima, and two-tailed Student’s t-test was used to calculate P values. The experiments in a, c, and e were repeated three times independently with similar results.
Extended Data Fig. 6. Genomic and chromatin features of LADs in control and mutant iPSC-CMs.
a, Normalized enrichment of LMNA ChIP-seq signals, histone markers (H3K4me3 and H3K27me3), and ATAC-seq signals within ± 0.4 mb of mapped LAD borders. The genomic locations of LADs were obtained from ChIP-seq on LMNA using two different antibodies (Abcam #8984; blue line, SC-376248; green line) in control iPSC-CMs (III-3). b, Representative images of ChIP-seq, ATAC-seq, and RNA-seq of chromosome 12 (133 MB). Red box represents LAD explicitly called in mutant iPSC-CMs (Gain). Purple box represents LADs called in both control and mutant iPSC-CMs (Overlapping). Blue box represents LADs explicitly called in control iPSC-CMs (Loss). c-e, (c) Number, (d) Genomic Coverage, and (e) Mean of length of LADs in control, mutant, gain, overlapping and loss LADs. ChIP-seq on LMNA (Abcam #8984) was used for data analysis. f, g, Average peak intensity of H3K4me3 and H3K27me3 of each LAD. n=184 (Loss), n=370 (Overlap), n=184 (Gain) for H3K4me3. n=273 (Loss), n=504 (Overlap), n=273 (Gain) for H3K27me3. Data are mean and minima to maxima, and Wilcoxon matched pairs signed rank test was used to calculate P values. h, Scatter plot of normalized LMNA, ATAC and histone markers (H3K4me3 and H3K27me3) enrichment of each LAD. Y-axis represents log2 relative normalized LMNA enrichment of each LAD in mutant iPSC-CMs as compared to control iPSC-CMs. X-axis represents log2 relative normalized ATAC and histone marks enrichment of each LAD in mutant iPSC-CMs as compared with control iPSC-CMs. Each data point represents one LAD. The statistical significance was obtained using one-way ANOVA. n=587 for SC-376248 and n=585 for Abcam #8984. i, percentage of differentially expressed gene in mutant iPSC-CMs as compared to control iPSC-CMs. j, Number of differentially expressed genes located in mutant iPSC-CMs as compared to control iPSC-CMs. (FDR <0.01; Log2FC >1 or <−1). k, Distribution of Log2 fold-change of FPKM in control and mutant iPSC-CMs. Statistical tests: Non-parametric Kruskal Wallis (testing for two-sided differences) followed by Dunn’s post-hoc for multiple comparison adjustment. n=266 (Gain), n=8171 (Non-LADs), n=835 (Overlap), n=206 (Loss).
Extended Data Fig. 7. Abnormal distribution of H3K9methylation in mutant iPSC-CMs.
a, b, Representative images of IF staining of control mutant iPSC-CMs. iPSC-CMs were stained with specific antibodies for H3K9me2 or H3K9me3 (Green). Blue signal represents DAPI. Scale bar, 1000 nM. The experiments were repeated three times independently with similar results. c-e, Representative images of LMNA enrichment and LAD distribution of ChIP-seq data. ChIP-qPCR analysis of H3K9me2 and H3K9me3 enrichment on LAD region. Data are expressed as mean ± s.d. n=3.
Extended Data Fig. 8. TFs altered by haploinsufficiency of LMNA contribute to the activation of genes located outside LADs.
a, Distribution of absolute distances to the nearest LAD (by nucleotide distance) from the TSS of genes that are differentially expressed (upper) or that show no significant difference in expression between mutant and control iPSC-CMs. b, Distribution of median absolute log2FC from genes with relatively long (>7.5e6 bp) distances to the nearest LAD (upper) and genes with relatively short (<2.5e6 bp) distances to the nearest LAD (lower). In each category, 500 genes were sampled with replacement over 10,000 times. c, d, TF-Gene Co-occurrence and ARCHS4 TFs Coexpression analyses of differentially expressed genes located in non-LADs. Blue color represents gene located in non-LADs. Black color represents no significant gene expression difference between control and mutant iPSC-CMs. Red color represents genes located in LADs and highly expressed in mutant iPSC-CMs as compared with control iPSC-CMs. Top 200 differentially expressed genes located in non-LADs were used for the analysis. e, Representative images of ChIP-seq, ATAC-seq, and RNA-seq of PRRX1 genomic region. f, Relative mRNA expression of PRRX1, PDGFRB, GREM1, LUM and DCN in mutant iPSC-CMs treated with scramble or PRRX1 siRNA. Data are expressed as mean ± s.e.m., and a two-tailed Student’s t-test was used to calculate P values. n=3 (PDGFRB, GREM1), n=4 (DCN, LUM, PRRX1). Numbers above the line show significant P values.
Extended Data Fig. 9. PDGFRB is up-regulated in LMNA-mutant iPSC-CMs.
a, Expression levels of PDGFRA and PDGFRB during human iPSC-CM differentiation process. The data were adapted from GSE76523. b, c, Protein and RNA levels of PDGFRB in human tissues. The data were adapted from Protein and RNA Atlas Database. d, Real-time PCR analysis of PDGFRB expression in LMNA-mutant and control iPSC-CMs. Data are expressed as mean ± s.e.m., and a two-tailed Student’s t-test was used to calculate P values. n=13 (WT/WT), n=5 (WT/Ins-MT). Numbers above the line show significant P values. e, Immunoblot analysis of PDGFRB protein levels in control versus mutant iPSC-CMs. GAPDH was used as loading control. The experiments were repeated twice independently with similar results. f, Flow cytometry analysis of TNNT2+ and PDGFRB+ cells in control and mutant iPSC-CMs. n=4. g, Kinase array of control and mutant iPSC-CMs. Fifty different protein kinases were presented in each chip. Raw images of blotting membrane (left). Two dots carried same antibody for technical duplicate. Quantification of signal intensity of each spot (right). h, Representative images of ChIP-seq, ATAC-seq, and RNA-seq on the genomic regions of PDGFRB. Blue box represents the promoter region of PDGFRB. i, ChIP-qPCR of H3K4me3 and H3K27me3 enrichment at the promoter region of PDGFRB in control and mutant iPSC-CMs. n=3. j, k, Real-time PCR analysis of LMNA and PDGFRB expression levels in left ventricle heart tissue from health controls (n=3) and LMNA-DCM patients (n=2). Data are expressed as mean ± s.e.m. The Kinase data in g was repeated twice independently with similar results. f, i, Data are expressed as mean ± s.e.m., and statistical significance was obtained using one-way ANOVA. Numbers above the line show significant P values.
Extended Data Fig. 10. Arrhythmic phenotype in mutant iPSC-CMs is dependent on the activation of PDGFRB pathway.
a, Real-time PCR analysis of PDGFRB expression levels in mutant iPSC-CMs (WT/MT) treated with siRNA of scramble or PDGFRB. The siRNA treated for 48 hr. Data are expressed as mean ± s.e.m., and a two-tailed Student’s t-test was used to calculate P values. n=3. Numbers above the line show significant P values. b, Representative Ca2+ transients of mutant iPSC-CMs (III-17; WT/MT) treated with scrambled siRNA or PDGFRB-specific siRNA. c, Quantification of the number of cells exhibiting arrhythmic waveforms in (b). d, Representative Ca2+ transients of mutant iPSC-CMs treated with PDGRB inhibitors, crenolanib (100 nM) and sunitinib (500 nM), for 24 hr. All traces were recorded for 20 sec. e, Quantification of mutant iPSC-CMs (III-17, III-15, and III-3) exhibiting arrhythmic waveforms with or without the treatment of PDGRB inhibitors, crenolanib (100 nM) and sunitinib (500 nM), for 24 hr. f, Representative Ca2+ transients of mutant iPSC-CMs (III-17; WT/MT) treated with PDGFRB inhibitors. g, Immunoblot analysis of phospho-RYR2 and RYR2 protein levels with treatment of DMSO, Crenolanib or Sunitinib. The data were repeated twice independently with similar results. h, immunoblot analysis of PDGFRB, Tubulin, phospho-CAMK2D, and CAMK2D protein levels in control iPSC-CMs expressing Empty and PDGFRB constructs. The experiments were repeated twice independently with similar results. i, Representative Ca2+ transients of iPSC-CMs expressing Empty and PDGFRB constructs. j, Quantification of arrhythmic waveforms of iPSC-CMs in (i). The Ca2+ transients in b, d, f and i were repeated as described in c, e and j independently with similar results.
Extended Data Fig. 11. Gene expression profile of PDGFRB inhibition in LMNA-mutant iPSC-CMs.
a, GO analysis of down-regulated genes (n=352) in LMNA-mutant iPSC-CMs treated with PDGFRB inhibitor, crenolanib (100 nM) and sunitinib (500 nM), for 24 hr. b, Heat-map of expression profile of gene set related with GO function of Ion transport. The FDR values were obtained from GO enrichment analysis tool. c, Hierarchical clustering of AmpliSeq RNA-sequencing data under one-way ANOVA (p = 0.05) (n=230). Two different siRNAs for PDGFRB and scramble in LMNA-mutant iPSC-CMs (III-15; WT/MT). d, e, Heat-map of expression profile of gene (n=25) sets related with GO function of cardiac muscle contraction and actin-mediated cell contraction. The FDR values were obtained from GO enrichment analysis tool. f, No significant changes in abnormal nuclear structure of mutant iPSC-CMs by inhibition of PDGFRB were found. Representative images of mutant iPSC-CMs treated with PDGFRB inhibitor, crenolanib (100 nM) and sunitinib (500 nM), for 24 hr. iPSC-CMs were stained with specific antibodies for LMNB1 (Green). Blue signal represents DAPI. Scale bar, 10 μM. The experiments were repeated three times independently with similar results. g, Quantification of cells showing abnormal nuclear structure in mutant iPSC-CMs treated with PDGFRB inhibitor. The images were recorded from three differentiation batches. n=90 (DMSO), n=69 (Crenolanib), n=79 (Sunitinib). Data are expressed as mean ± s.e.m., and statistical significance was obtained using one-way ANOVA. Numbers above the line show P values. h, Immunoblot analysis of LMNA and GAPDH protein levels in mutant iPSC-CMs treated with PDGFRB inhibitor. The experiments were repeated twice independently with similar results.
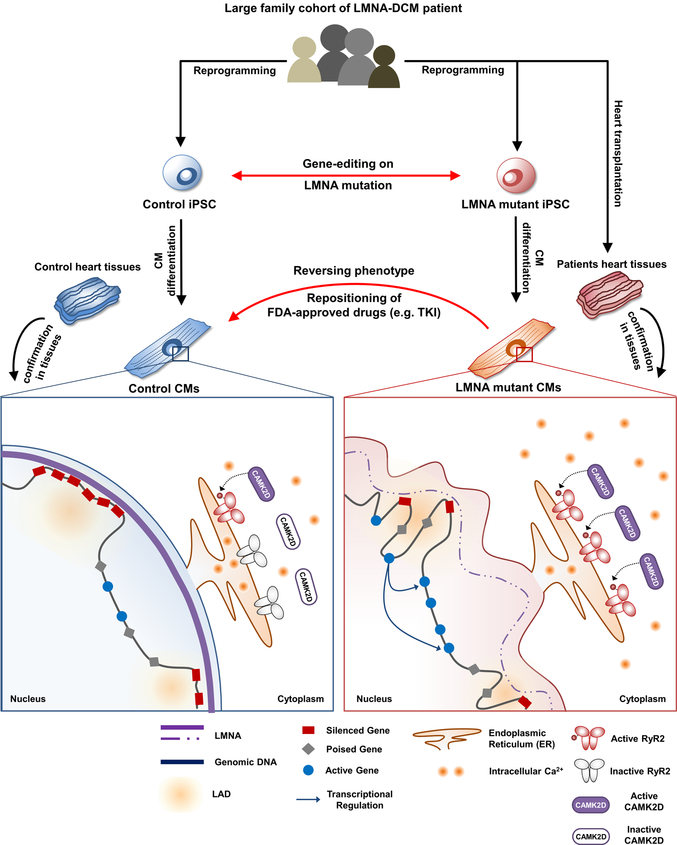
Extended Data Fig. 12. Proposed disease model of LMNA-DCM.
We recruited a large family cohort with DCM and generated patient-specific induced pluripotent stem cells (iPSCs) from several patients (n=5) and healthy individuals (n=2). We next utilized gene-edited isogenic iPSC lines (n=4) and patient heart tissues to address the intriguing question why patients with LMNA-DCM have increased manifestation of cardiac arrhythmias. The electrophysiological studies of mutant iPSC-derived cardiomyocytes (iPSC-CMs) demonstrated that LMNA mutation was the cause of increased arrhythmogenicity in LMNA-mutant iPSC-CMs. We also found that the LMNA mutation caused haploinsufficiency in LMNA, which led to abnormal calcium homeostasis in mutant iPSC-CMs through up-regulation of calcium handling genes. Whole transcriptome profiling (RNA-seq) further demonstrated an abnormal activation of PDGF pathway in mutant iPSC-CMs. The inhibition of PDGF signal pathway by treatment of siRNA or FDA-approved drugs such as sunitinib and crenolanib could rescue the arrhythmic phenotype of LMNA-mutant iPSC-CMs. Cross-analysis of various ChIP-seq, ATAC-seq, and RNA-seq revealed a possible underlying mechanism that haploinsufficiency of LMNA could disrupt global chromatin conformation, resulting in abnormal gene expression of mutant iPSC-CMs. These findings were further corroborated by studies in cardiac tissues from healthy and LMNA-DCM patients, thus validating a novel mechanism of LMNA-DCM pathogenesis both in vitro and in vivo.
Supplementary Material
Acknowledgements
We thank the laboratory of Donald M. Bers for providing the phospho-RYR antibody, and Sang Ah Yi, Ki Hong Nam, Gunes Ates Akgun, Caressa Chen, and Sophia Zhang for their contribution. This research is supported by AHA 17MERIT33610009, NIH R01 HL128170, R01 HL113006, R01 HL130020, R01 HL132875, CIRM TRAN4–09884, Leducq Foundation 18CVD05 (J.C.W.); R01 HL139679, R00 HL104002, AHA 17IRG33410532 (I.K.); Prince Mahidol Award Foundation (V.T.); the German Research Foundation (T.S.); National Research Foundation of Korea 2012R1A5A2A28671860 and 2019R1C1C1010675 (J.L.); NIH F32 HL139045 (E.L.); CIRM GC1R-06673-A (M.P.S.); and NIH P50 HG007735 and Howard Hughes Medical Institute (H.Y.C.)
Reprints and permissions information is available at www.nature.com/reprints. J.C.W. is a co-founder of Khloris Biosciences but has no competing interests, as the work presented was performed independently. Readers are welcome to comment on the online version of the paper. Correspondence and requests for materials should be addressed to J.C. (jaecheol@skku.edu), I.K. (ioannis1@stanford.edu) or J.C.W. (joewu@stanford.edu).
Footnotes
Data Availability. Gene Expression Omnibus (GEO): GSE118885
Main text references
- 1.Carmosino M et al. Role of nuclear Lamin A/C in cardiomyocyte functions. Biol. Cell 106, 346–358 (2014). [DOI] [PubMed] [Google Scholar]
- 2.Fatkin D et al. Missense Mutations in the Rod Domain of the Lamin A/C Gene as Causes of Dilated Cardiomyopathy and Conduction-System Disease. New England Journal of Medicine 341, 1715–1724 (1999). [DOI] [PubMed] [Google Scholar]
- 3.Krohne G & Benavente R The nuclear lamins. Experimental Cell Research 162, 1–10 (1986). [DOI] [PubMed] [Google Scholar]
- 4.Hershberger RE & Morales A LMNA-Related Dilated Cardiomyopathy in GeneReviews(®) (eds. Pagon RA et al. ) (University of Washington, Seattle, 1993). [Google Scholar]
- 5.Hershberger RE, Hedges DJ & Morales A Dilated cardiomyopathy: the complexity of a diverse genetic architecture. Nat Rev Cardiol 10, 531–547 (2013). [DOI] [PubMed] [Google Scholar]
- 6.Tesson F et al. Lamin A/C mutations in dilated cardiomyopathy. Cardiol J 21, 331–342 (2014). [DOI] [PubMed] [Google Scholar]
- 7.Diecke S et al. Novel codon-optimized mini-intronic plasmid for efficient, inexpensive, and xeno-free induction of pluripotency. Scientific Reports 5, 8081 (2015). [DOI] [PMC free article] [PubMed] [Google Scholar]
- 8.Kodo K et al. iPSC-derived cardiomyocytes reveal abnormal TGF-β signalling in left ventricular non-compaction cardiomyopathy. Nat Cell Biol 18, 1031–1042 (2016). [DOI] [PMC free article] [PubMed] [Google Scholar]
- 9.Lee J et al. SETD7 Drives Cardiac Lineage Commitment through Stage-Specific Transcriptional Activation. Cell Stem Cell 22, 428–444.e5 (2018). [DOI] [PMC free article] [PubMed] [Google Scholar]
- 10.Sharma A et al. Derivation of highly purified cardiomyocytes from human induced pluripotent stem cells using small molecule-modulated differentiation and subsequent glucose starvation. Journal of Visualized Experiments e52628 (2015). doi: 10.3791/52628 [DOI] [PMC free article] [PubMed] [Google Scholar]
- 11.Karakikes I et al. A comprehensive TALEN-based knockout library for generating human induced pluripotent stem cell-based models for cardiovascular diseases. Circulation Research 120, 1561–1571 (2017). [DOI] [PMC free article] [PubMed] [Google Scholar]
- 12.Termglinchan V, Seeger T, Chen C, Wu JosephC. & Karakikes I Efficient Genome Editing in Induced Pluripotent Stem Cells with Engineered Nucleases In Vitro in Cardiac Gene Therapy (ed. Ishikawa K) 55–68 (Springer; New York, 2017). doi: 10.1007/978-1-4939-6588-5_4 [DOI] [PubMed] [Google Scholar]
- 13.Bers DM Calcium Cycling and Signaling in Cardiac Myocytes. Annual Review of Physiology 70, 23–49 (2008). [DOI] [PubMed] [Google Scholar]
- 14.Lan F et al. Abnormal Calcium Handling Properties Underlie Familial Hypertrophic Cardiomyopathy Pathology in Patient-Specific Induced Pluripotent Stem Cells. Cell Stem Cell 12, 101–113 (2013). [DOI] [PMC free article] [PubMed] [Google Scholar]
- 15.Itzhaki I et al. Modeling of Catecholaminergic Polymorphic Ventricular Tachycardia With Patient-Specific Human-Induced Pluripotent Stem Cells. Journal of the American College of Cardiology 60, 990–1000 (2012). [DOI] [PubMed] [Google Scholar]
- 16.Maizels L et al. Patient-Specific Drug Screening Using a Human Induced Pluripotent Stem Cell Model of Catecholaminergic Polymorphic Ventricular Tachycardia Type 2. Circulation: Arrhythmia and Electrophysiology 10, e004725 (2017). [DOI] [PubMed] [Google Scholar]
- 17.Bers DM Cardiac Sarcoplasmic Reticulum Calcium Leak: Basis and Roles in Cardiac Dysfunction. Annual Review of Physiology 76, 107–127 (2014). [DOI] [PubMed] [Google Scholar]
- 18.Schreiber KH & Kennedy BK When Lamins Go Bad: Nuclear Structure and Disease. Cell 152, 1365–1375 (2013). [DOI] [PMC free article] [PubMed] [Google Scholar]
- 19.Kervestin S & Jacobson A NMD: a multifaceted response to premature translational termination. Nature Reviews Molecular Cell Biology 13, 700–712 (2012). [DOI] [PMC free article] [PubMed] [Google Scholar]
- 20.Hug N, Longman D & Cáceres JF Mechanism and regulation of the nonsense-mediated decay pathway. Nucl. Acids Res 44, 1483–1495 (2016). [DOI] [PMC free article] [PubMed] [Google Scholar]
- 21.Luperchio TR, Wong X & Reddy KL Genome regulation at the peripheral zone: lamina associated domains in development and disease. Current Opinion in Genetics & Development 25, 50–61 (2014). [DOI] [PubMed] [Google Scholar]
- 22.Guelen L et al. Domain organization of human chromosomes revealed by mapping of nuclear lamina interactions. Nature 453, 948–951 (2008). [DOI] [PubMed] [Google Scholar]
- 23.Perovanovic J et al. Laminopathies disrupt epigenomic developmental programs and cell fate. Science Translational Medicine 8, 335ra58–335ra58 (2016). [DOI] [PMC free article] [PubMed] [Google Scholar]
- 24.Kind J & van Steensel B Genome–nuclear lamina interactions and gene regulation. Current Opinion in Cell Biology 22, 320–325 (2010). [DOI] [PubMed] [Google Scholar]
- 25.Chen X et al. ATAC-see reveals the accessible genome by transposase-mediated imaging and sequencing. Nat Meth 13, 1013–1020 (2016). [DOI] [PMC free article] [PubMed] [Google Scholar]
- 26.Gesson K et al. A-type lamins bind both hetero- and euchromatin, the latter being regulated by lamina-associated polypeptide 2 alpha. Genome Res. 26, 462–473 (2016). [DOI] [PMC free article] [PubMed] [Google Scholar]
- 27.Rønningen T et al. Prepatterning of differentiation-driven nuclear lamin A/C-associated chromatin domains by GlcNAcylated histone H2B. Genome Res. 25, 1825–1835 (2015). [DOI] [PMC free article] [PubMed] [Google Scholar]
- 28.Poleshko A et al. Genome-Nuclear Lamina Interactions Regulate Cardiac Stem Cell Lineage Restriction. Cell 171, 573–587.e14 (2017). [DOI] [PMC free article] [PubMed] [Google Scholar]
- 29.Lachmann A et al. Massive mining of publicly available RNA-seq data from human and mouse. Nature Communications 9, 1366 (2018). [DOI] [PMC free article] [PubMed] [Google Scholar]
- 30.Andrae J, Gallini R & Betsholtz C Role of platelet-derived growth factors in physiology and medicine. Genes Dev 22, 1276–1312 (2008). [DOI] [PMC free article] [PubMed] [Google Scholar]
- 31.Tompkins JD et al. Mapping Human Pluripotent-to-Cardiomyocyte Differentiation: Methylomes, Transcriptomes, and Exon DNA Methylation “Memories”. EBioMedicine 4, 74–85 (2016). [DOI] [PMC free article] [PubMed] [Google Scholar]
- 32.Uhlén M et al. Proteomics. Tissue-based map of the human proteome. Science 347, 1260419 (2015). [DOI] [PubMed] [Google Scholar]
- 33.Chintalgattu V et al. Cardiomyocyte PDGFR-β signaling is an essential component of the mouse cardiac response to load-induced stress. J Clin Invest 120, 472–484 (2010). [DOI] [PMC free article] [PubMed] [Google Scholar]
- 34.Mattout A, Cabianca DS & Gasser SM Chromatin states and nuclear organization in development — a view from the nuclear lamina. Genome Biology 16, 174 (2015). [DOI] [PMC free article] [PubMed] [Google Scholar]
- 35.Solovei I et al. LBR and Lamin A/C Sequentially Tether Peripheral Heterochromatin and Inversely Regulate Differentiation. Cell 152, 584–598 (2013). [DOI] [PubMed] [Google Scholar]
- 36.Sharma A et al. High-throughput screening of tyrosine kinase inhibitor cardiotoxicity with human induced pluripotent stem cells. Science Translational Medicine 9, eaaf2584 (2017). [DOI] [PMC free article] [PubMed] [Google Scholar]
- 37.Lam CK et al. Novel Role of HAX-1 in Ischemic Injury Protection Involvement of Heat Shock Protein 90Novelty and Significance. Circulation Research 112, 79–89 (2013). [DOI] [PMC free article] [PubMed] [Google Scholar]
- 38.Greensmith DJ Ca analysis: An Excel based program for the analysis of intracellular calcium transients including multiple, simultaneous regression analysis. Computer Methods and Programs in Biomedicine 113, 241–250 (2014). [DOI] [PMC free article] [PubMed] [Google Scholar]
- 39.Lund E, Oldenburg AR & Collas P Enriched domain detector: a program for detection of wide genomic enrichment domains robust against local variations. Nucl. Acids Res 42, e92–e92 (2014). [DOI] [PMC free article] [PubMed] [Google Scholar]
- 40.Buenrostro JD, Giresi PG, Zaba LC, Chang HY & Greenleaf WJ Transposition of native chromatin for fast and sensitive epigenomic profiling of open chromatin, DNA-binding proteins and nucleosome position. Nat Meth 10, 1213–1218 (2013). [DOI] [PMC free article] [PubMed] [Google Scholar]
- 41.Langmead B & Salzberg SL Fast gapped-read alignment with Bowtie 2. Nat Meth 9, 357–359 (2012). [DOI] [PMC free article] [PubMed] [Google Scholar]
- 42.Ramírez F, Dündar F, Diehl S, Grüning BA & Manke T deepTools: a flexible platform for exploring deep-sequencing data. Nucleic Acids Res 42, W187–W191 (2014). [DOI] [PMC free article] [PubMed] [Google Scholar]
- 43.Huber W et al. Orchestrating high-throughput genomic analysis with Bioconductor. Nat Meth 12, 115–121 (2015). [DOI] [PMC free article] [PubMed] [Google Scholar]
- 44.Lawrence M et al. Software for Computing and Annotating Genomic Ranges. PLOS Computational Biology 9, e1003118 (2013). [DOI] [PMC free article] [PubMed] [Google Scholar]
Associated Data
This section collects any data citations, data availability statements, or supplementary materials included in this article.


