

Abstract
In recent years, long non-coding RNAs have emerged as a novel class of regulators of cancer biological processes. While they are dysregulated in many cancer types, little is known about their expression and functional profiles. This study has been focused on the determination of the role of a specific lncRNA in papillary thyroid cancer. Quantitative reverse transcription PCR was performed to detect the expression levels of 84 lncRNAs in 61 papillary thyroid carcinoma tissues and their adjacent non-tumor tissues. The highest fold-change was obtained for lung cancer associated transcript 1 LUCAT1, and thus, this study determines the expression and biological implication of lncRNA LUCAT1 through different in vitro and ex vivo approaches in this tumor. LUCAT1 was specifically located at the cell nucleus in tumoral regions of patient tissues. Furthermore, LUCAT1 knockdown significantly reduced both cell proliferation and invasion ex vivo and induced cell-cycle arrest and apoptosis. These facts were corroborated by an enhanced expression of P21, P57, P53 and BAX, and a reduced expression of EZH2 and HDAC1. In addition, a significant decrease was observed on DNMT1 and NRF2 genes, helping to clarify the role of LUCAT1 on PTC. Our study reveals the involvement of LUCAT1 in PTC development, through acting in cell-cycle regulation, proliferation, epigenetic modifications through LUCAT1/ CDK1/ EZH2/ P57/ P21/ HDAC1/ DNMT1/ P53/ BAX axis and apoptosis, via extrinsic pathway activating caspases. These findings indicate that LUCAT1 is maybe a potential therapeutic target and molecular biomarker for PTC.
Subject terms: Cancer epigenetics, Thyroid cancer
Introduction
Thyroid cancer is a rare tumor with a range of 2–20 cases/100,000 persons/year. It is the most common endocrine malignancy (90% of all endocrine neoplasms), and the leading cause of deaths of all endocrine tumors1. Papillary thyroid carcinoma (PTC) originates from the follicular cell epithelium of the thyroid. It presents as a solitary thyroid nodule, although in 35–45% of cases it can be associated with lymph node metastasis. Although much improvement on the treatment of PTC has been achieved, its prognosis remains very poor. Thus, the identification of the pathogenic mechanisms that trigger PTC is essential to improve the prognosis and therapies for this tumor.
The broad term long non-coding RNA (lncRNA) refers to a class of endogenous ncRNA transcript that is 200 nucleotides in length or larger and does not seem to contain a protein-coding sequence. Today it is known that some putative lncRNAs are translated into functional micropeptides, although they were misannotated as noncoding genes2,3. Even more, some lncRNAs are transcribed bidirectionally from promoters and enhancers4.
These molecules participate in transcriptional, epigenetic, or post-transcriptional regulation of gene expression, positively or negatively5,6. In human, there are from ~16,000 lncRNAs predicted by GENCODE7 to ~100,000 predicted by NONCODE8. These differences among both databases highlight either the huge number of lncRNA genes in the human genome and the growing need for steady lncRNA research.
An overwhelming amount of literature supporting the role of lncRNAs in cancer is emerging, where they can function as oncogenes or tumor suppressor genes. Two studies give further supporting evidence for the role of lncRNAs in cancer after the analysis of a huge group of clinical specimens9,10. Their outcomes reveal that, while in cancer the CpG island are hypermethylated, more than 1,000 lncRNAs are hypomethylated at their promoters. Consequently, lncRNAs are attractive and promising targets in the evaluation of cancer diagnosis, prognosis and distinct therapeutic strategies.
Since 2007 to date, many lncRNAs have been associated with PTC, although most of them have emerged in the last few years11,12. In this study, after a previous screening of several lncRNAs on PTC tissues, we focused on “lung cancer associated transcript 1” (LUCAT1). This lncRNA is located on chromosome 5 and comprises 4 exons and 3 introns but its function and molecular mechanism in PTC remains unclear. It was firstly described in the airway epithelium of cigarette smokers13 and to date has been associated with different tumors, which reinforces its importance as a prognostic value in cancer. In addition, it is considered as a potential prognostic biomarker and therapeutic target for each type of tumor with which it has been linked.
Two studies about ovarian cancer and overexpression of LUCAT1 have been described and revealed that LUCAT1/miR-612/HOXA13 pathway modulates ovarian cancer progression14,15. It has been also detected in lung cancer, where LUCAT1 epigenetically repress p21 and p5716, and decrease DNMT1 and/or DNMT3B expression levels17. Some studies in colorectal cancer have obtained that LUCAT1 induces cell cycle arrest and apoptosis by activating the ribosomal protein RPL40-MDM2-p53 pathway18,19.
Different studies have been performed on clear cell renal cell carcinoma, where LUCAT1 was upregulated and it binds to polycomb PRC2 complex and suppress P57 expression20. It is essential for proliferation and invasion and directly inhibit the expression of microRNA-495-3p21. LUCAT1 also induced cell cycle G1 arrest in this tumor22. Regarding the role that plays LUCAT1 in hepatocarcinoma, it directly sponges the onco-miR-181d-5p23. It promotes cell proliferation, migration and invasion through modulating miR-301b/STAT3 axis24 and it inhibits the phosphorylation of Annexin A225. Finally, different associations of LUCAT1 with other types of cancers have been also published, such as in glioma, where it regulates miR-37526 and in osteosarcoma, where it acts through miR-200c/ABCB1 pathway27. Furthermore, LUCAT1 also acts on esophageal squamous cell carcinoma where it regulates the stability of DNMT1 leading to the formation and metastasis of this carcinoma28. LUCAT1 and CCNB1 had a positive relationship in regulating the progress of bladder cancer29. It was also found to present a differential expression on head and neck squamous cell carcinoma, together with other lncRNAs30 and it exerts an oncogenic function in cervical cancer by binding to miR-181a31.
All abovementioned studies clearly defined LUCAT1 as an important biomarker in cancer prognosis. However, the molecular mechanism in thyroid cancer and particularly in PTC needs further investigation.
Materials and Methods
Patients and tissue samples
Sixty-one papillary thyroid tumor tissues and their corresponding adjacent non-tumor thyroid tissues were obtained from PTC patients undergoing surgical resection. All patients had total thyroidectomy. The samples were snap frozen in liquid nitrogen and stored at −80 °C. All the clinical data are compiled in Table 1. A written informed consent was obtained from all the participants for clinical and molecular genetic studies, after a full explanation of the purpose and nature of all procedures used. The study was approved by the Ethics Committee for clinical research in the University Hospital Virgen del Rocío (Seville, Spain) and complies with the tenets of the declaration of Helsinki.
Table 1.
Clinicopathological features of the enrolled PTC patients. Correlation between LUCAT1 expression and clinicopathologic factors in PTC validated cohort. *P < 0.05 is considered statistically significant.
| Parameter | Case | Total (n = 61) | LUCAT1 expression | P (Fisher’s exact test) | |
|---|---|---|---|---|---|
| Low | High | ||||
| Age, years | |||||
| <45 | 35 | 1 | 34 | <0.0001* | |
| ≥45 | 26 | 15 | 11 | ||
| Gender | |||||
| Male | 20 | 8 | 12 | 0,1225 | |
| Female | 41 | 8 | 33 | ||
| Primary tumor | |||||
| T1-T2 | 30 | 18 | 12 | <0.0001* | |
| T3-T4 | 31 | 2 | 29 | ||
| Lymph node metastasis | |||||
| N0 | 26 | 26 | 0 | <0.0001* | |
| N1 | 35 | 6 | 29 | ||
| Stage | |||||
| I,II | 38 | 15 | 23 | 0,0167* | |
| III,IV | 23 | 2 | 21 | ||
| TNM | |||||
| M0 | 50 | 45 | 5 | <0.0001* | |
| M1 | 11 | 1 | 10 | ||
TNM: tumor-node-metastasis.
In addition, formalin-fixed paraffin-embedded (FFPE) tumor tissue samples from the same snap frozen samples, were used. All samples were from the University Hospital Virgen del Rocío-Institute of Biomedicine of Seville Biobank (Andalusian Public Health System Biobank and ISCIII-Red de Biobancos PT13/0010/0056).
Screening by lncRNA PCR Array
Total RNA was obtained from tissues of our patients and commercial cell lines by using RNEasy Purification Kit (Qiagen), according to the manufacturer’s instructions. The RNA was quantified by Nanodrop (Invitrogen) and 1 μg of total RNA was reverse transcribed into cDNA using PrimeScript RT Reagent Kit (TaKaRa) to determine lncRNA expression levels, using GAPDH as reference gene. For lncRNA expression analysis, laboratory-verified SYBR®Green qPCR assays (RT2 lncRNA PCR Array, Qiagen) were used. Each plate contains 84 lncRNAs already associated with different cancer pathways (Supplementary Table 1). The quantitative real-time PCR (qRT-PCR) was performed at the 7900HT Fast Real-Time PCR System with the 384-Well Block Module (Applied Biosystems). All the reactions were carried out in triplicate. All the data were analysed by Applied Biosystems software and the relative expression levels of lncRNAs were determined by the equation 2−ΔΔCt. Two-tailed t-test was used to analyse differences between tumor tissues and their corresponding adjacent non-tumor thyroid tissues. A P < 0.05 was considered as a statistically significant difference.
To quantify the silencing level of LUCAT1 in cell lines, the qRT-PCR was performed at 7500 Fast Real Time PCR System (Applied Biosystems) by using the primers provided by the manufacturer (Human LUCAT1, LPH16113A-200, Qiagen). All the reactions were carried out in triplicate.
ViewRNA ISH Tissue 1-Plex Assay
For the in-situ detection of LUCAT1, the ViewRNATM ISH Tissue 1-Plex Assay (Affymetrix) on 5 μm FFPE tissue sections was used. The design of the probe of LUCAT1 was based on the Refseq variant NR_103548 (http://www.ncbi.nlm.nih.gov/nuccore). The specificity of the signal was compared within each slide among the tumoral tissue and its normal paired tissue. The omission of the target probe set was used as a negative control. Images were captured by a TCS SP2 AOBS Spectral Confocal (Leica), using both 405 and 561 nm laser excitation lines, to compare normal vs paired tumoral tissue in each sample. 63xOil immersion objective was used. Images were obtained by photomultiplier, at 23 °C of temperature and processed by Leica Confocal Software and Multicolor Package.
Cell lines and siRNA transfection
Human papillary thyroid cancer cell lines (BCPAP, 8505c) were obtained from Deutsche Sammlung von Mikroorganismen und Zellkulturen [DSMZ Cat# ACC-273 (established from a metastasizing papillary thyroid carcinoma) and ACC-219 (established from a papillary adenocarcinoma) respectively] and TPC1 cell line was a gift from Dr. Velázquez Henar (Autonomous University of Barcelona, Spain). All the cells were cultured in RPMI-1640 Medium (Invitrogen) supplemented with 10% fetal bovine serum at 37 °C in 5% CO2. The authentication method used by DMSZ is standardization of STR Profiling (ANSI eStandards Store, 2012).
For silencing assays, 250.000 cells were seeded in a 6-well plate and transfected when 70% confluent with siRNA1 at 20 μM. Initially, two different concentrations (5 or 20 μM) of two different siRNAs (siRNA1 and siRNA2; Silencer® Select siRNAs, ThermoFisher Scientific) were tested to decide the best one to use in all assays (siRNA1 at 20 μM). We also included a negative control siRNAs at the same concentrations and time points (si-NC; 24, 48 and 72 h), by using Viromer® BLUE Reagent (Viromer®) according to the manufacturer’s instructions. Then the cells were harvested for RNA extraction (Qiagen). Assays were performed three times.
Cell proliferation
Cell Counting Kit-8 assay (CCK8) was used to quantify cell proliferation following manufacturer’s instructions. Briefly, 10.000 cells/96-well plates were silenced by siRNA1 (20 μm) during 24 and 48 h. Next day, each well was supplemented with the CCK-8 solution [2-(2-methoxy-4-nitrophenyl)-3-(4-nitrophenyl)-5-(2,4-disulfophenyl)-2H-tetrazolium, monosodium salt] which forms a formazan dye upon reduction in the presence of an electron mediator. After 4 h at 37 °C in 5% CO2 incubator, the absorbance (OD450 nm) was read in a microplate reader (BioRad). Data represent the mean ± SD from three independent experiments.
Cell invasion assay
To determine cell invasive capacity after transfection of all cell lines with siRNA1 (20 μm) and negative control siRNA, transwell assay (ECMatrix Cell Invasion Assay, Millipore, 8.0-μm pores) was used, following the manufacturer instructions. Briefly, the kit utilizes ECMatrix™, a reconstituted basement membrane matrix of proteins derived from the Engelbreth Holm-Swarm mouse tumor. Cells (0.5 × 10⁶) in 500 μl medium with 10% FBS were placed into the insert. After 24 h incubation, non-invading cells as well as the ECMatrix gel were removed from the interior of the inserts and 500 μl of staining solution was added to the unoccupied wells of the plate. Images were acquired using a fluorescence microscope (BX61) with camera (DP72) (Olympus) and 10x objective. The number of migrated cells was quantified by dissolving stained cells in 10% acetic acid and the absorbance (OD560nm) was read in a microplate reader (BioRad). Data represent the mean ± SD from three independent experiments.
Western blotting
For protein extracts, cells were seeded at a density of 250.000 cells/well and transfected with siRNA1 (20 μm) to be collected after 24 h using RIPA buffer (Sigma-Aldrich). The protein quality was quantified by Bradford method (ThermoFisher Scientific). Protein extracts were separated by 4–20% SDS-PAGE, equal amount of protein was transferred onto polyvinylidenefluoride (BioRad) membranes and incubated with the following primary antibodies: anti-P21 (Cell Signaling Technology, CST; Cat# 2947), anti-P57 (CST, Cat# 2557), anti-P53 (CST, Cat# 2524), anti-EZH2 (D2C9) (CST, Cat# 5246), anti-NRF2 (D1Z9C) XP (CST, Cat#12721), anti-HDAC1 (CST, Cat#34589), anti-CDK1 (abcam, [A17] ab18), anti-DNMT1 (abcam, [60B1220,1] ab13537), and anti-BAX (CST, Cat# 2772). Regarding the procaspase assay, the Procaspase Antibody Sampler Kit (CST, Cat#12742).
All primary antibodies were used at 1:1000 at 4 °C for 24 h, except for anti-Lamin (1:2000). After the incubation with secondary antibodies (anti-mouse IgG HRP Linked Antibody, Cell Signaling Technology, 1:2000; anti-rabbit IgG, HRP Linked whole Ab, Amersham, 1:20000), the bands were visualized by ECL (BioRad) and quantified on a ChemiDoc XRS + (BioRad) system by using ImageLab software. GAPDH served as internal control (anti-GAPDH, D16H11, CST, Cat# 5174). All assays were performed three times.
Apoptosis and cell-cycle assays
All cell lines were transfected following our selected conditions (siRNA1, 20 μm, 24 h). Then, 1 × 10⁶ cells were collected and washed twice with ice-cold PBS. For apoptosis assay, cells were dual stained using FITC Annexin V Apoptosis Detection Kit I (BD Biosciences) according to the manufacturer’s protocol.
For cell-cycle analysis, cells were fixed with ethanol 70%, washed with PBS and then treated with RNAase A (100 ug/ul) and IP. Stained cells were immediately analysed using a flow cytometer (BD Biosciences). All assays were performed three times.
Caspases assays
The detection of active caspase-3/7 and caspase-6, central effector caspases in apoptosis, in our three different silenced cells, was based on the bioluminescence chemistry commercially available as Caspase-Glo® 3/7 reagent and Caspase-Glo® 6 reagent (G8090 and G0970 respectively, Promega). Ninety-six well plates were seeded with 20,000 cells and incubated for 3 hours in free serum medium. After that, conditioned medium was substituted with the Caspase-Glo reagent following the manufacturer recommendations. Luminescence was measured with the Fluoroskan Ascent Microplate Reader (ThermoFisher Scientific) and results are reported as relative light units (RLU, background subtraction).
Statistical analysis
The Student’s t test (two-tailed) was used to analyse all data. A P < 0.05 was considered statistically significant.
Levene’s test was used to assess the equality of variances for gender and age of patients in two groups (high and low LUCAT1 expression), through t-test. A P < 0.05 was considered statistically significant.
Results
Screening phase of the study
The expression profiles of 84 lncRNAs, already associated with different cancer pathways, were determined in 61 tumoral and non-tumoral paired tissues by SYBR®Green qPCR assays. Thirty-five differentially expressed lncRNAs were detected in our samples (all adjusted P ≤ 0.05). From those altered lncRNAs, 30 were downregulated and 5 were upregulated (Table 2). It is important to highlight that 12 of these lncRNAs found (9 down and 3 upregulated) had been already described as associated with PTC, which reinforces the validity of our approach. Based on the greatest fold change (log2 = 6.45), the upregulated lncRNA LUCAT1 was selected for further independent testing and validation.
Table 2.
Aberrant lncRNAs in human PTC tissues: All significant lncRNAs obtained by qRT-PCR (7900HT Taqman system) through the RT2 lncRNA PCR Arrays in our cohort of tissues from PTC patients.
| LncRNA | P-value | Ct (average) | Expression | Fold change |
|---|---|---|---|---|
| CAHM | 0.0000166 | 28.45 | downregulated | 0.57 |
| HAND2-AS1 | 0.0000023 | 31.93 | downregulated | 0.23 |
| HEIH | 0.0015059 | 26.76 | downregulated | 0.64 |
| HULC | 0.0205454 | 30.87 | downregulated | 0.7 |
| KCNQ1OT1 | 0.0002485 | 27.31 | downregulated | 0.52 |
| GAS5 | 0.0182714 | 26.10 | upregulated | 1.84 |
| LUCAT1 | 0.0006995 | 28.75 | upregulated | 6.45 |
| LINC00963 | 0.0064283 | 27.84 | downregulated | 0.75 |
| LINC01233 | 0.0117869 | 31.51 | downregulated | 0.67 |
| LINC00312 | 0.0032486 | 30.24 | downregulated | 0.54 |
| MIR17HG | 0.0033552 | 29.75 | downregulated | 0.7 |
| NRON | 0.0185571 | 30.52 | downregulated | 0,7 |
| POU5F1P5 | 0.0016513 | 29.48 | downregulated | 0.65 |
| PRNCR1 | 0.0002028 | 27.37 | downregulated | 0.73 |
| RMRP | 0.0247415 | 19.78 | downregulated | 0.77 |
| SNHG16 | 0.0189111 | 26.48 | downregulated | 0.8 |
| SPRY4-IT1 | 0.0019224 | 28.38 | downregulated | 0.7 |
| SUMO1P3 | 0.0002431 | 28.30 | downregulated | 0.66 |
| TUG1 | 0.0001961 | 25.35 | downregulated | 0.5 |
| XIST | 0.0004757 | 23.35 | downregulated | 0.63 |
| ACTA2-AS1 | 0.0155455 | 32.35 | downregulated | 0.44 |
| CCAT1 | 0.0050830 | 32.37 | downregulated | 0.36 |
| TSIX | 0.0054958 | 32.53 | downregulated | 0.62 |
| BANCR(*) | 0.0000345 | 32.30 | downregulated | 0.56 |
| H19(*) | 0.0266375 | 27.80 | downregulated | 0.53 |
| MALAT1(*) | 0.0017976 | 26.58 | downregulated | 0.28 |
| MEG3(*) | 0.0061960 | 30.59 | downregulated | 0.33 |
| PTCSC1(*) | 0.0000000 | 25.05 | downregulated | 0.46 |
| PTCSC3(*) | 0.0000000 | 25.74 | downregulated | 0.65 |
| PVT1(*) | 0.0000025 | 30.36 | downregulated | 0.5 |
| PCAT1(*) | 0.0019005 | 30.53 | downregulated | 0.65 |
| TERC(*) | 0.0000121 | 29.02 | downregulated | 0.5 |
| LINC00152(*) | 0.0003256 | 26.96 | upregulated | 2.69 |
| MIR31HG(*) | 0.0013127 | 29.47 | upregulated | 6.38 |
| LINC00887(*) | 0.0086052 | 31.48 | upregulated | 5.08 |
(*) Already described in association with PTC.
Specific LUCAT1 location and expression at thyroid tissue in PTC patients
The influence of LUCAT1 on different crucial cell processes (proliferation, apoptosis, invasion and cell-cycle) led us to analyse its cell location. In situ hybridization analysis using a specific probe for LUCAT1 was performed in FFPE samples from the same PTC patients where LUCAT1 was found to be upregulated. Small red punctuates in tumoral regions of LUCAT1 samples, but not in their normal regions, were detected. Furthermore, no specific red signal in any region of the control samples was found under confocal microscope after screening the whole sample. The red signal observed was weak, but specifically expressed in the cell nucleus (Fig. 1).
Figure 1.

LUCAT1 is specifically expressed at cell nucleus on tumoral regions from PTC tissues. The differences among the control samples hybridized without probe and samples incubated overnight with LUCAT1 probe were analysed. Comparisons among tumoral and non tumoral regions from the same patient were realized. All samples (tumoral and non tumoral, with or without probe) proceed from the same the same PTC patient (serial FFPE slides, 5 μm). Different samples from PTC patients were analysed by double blind examination. The specific red punctuate was depicted (arrows). Magnifications: 63×. Scale bar: 50 μm.
LUCAT1 expression and its association with clinical-pathologic features of patients
To further evaluate the prognostic value of LUCAT1 in PTC, the association between clinicopathological features and LUCAT1 overexpression, a univariate analysis by using the Fisher exact test was performed. Age, gender, primary tumor, lymph node metastases, stage and tumor-node-metastasis were analysed (Table 1). The 65% of patients analysed presented upregulation of this lncRNA, and from them, more than 50% showed a T3N1M1 stage, which suggests a positive correlation among overexpression of this lncRNA and an advanced stage of tumor in these patients.
The t-test of Levene’s test revealed that the average age of onset of tumor was 17,35 years more for patients with low LUCAT1 expression versus those with LUCAT1 overexpression (IC95% 10,18; 24,52) in a significant manner (p < 0.001). These data suggest that LUCAT1 might play as an unfavourable prognostic factor.
Knockdown of LUCAT1 impairs cell proliferation and leads to cell-cycle arrest
The qRT-PCR results revealed that LUCAT1 expression levels were significantly reduced (86.24% on BCPAP; 68,5% on TPC1 and 88.5% on 8505c) after 24 h transfection with siRNA1 at 20 µM, in comparison with si-NC (Fig. 2). No significant differences were found at 48 h and 72 h (Supplementary Table 2).
Figure 2.

Silencing of LUCAT1 by siRNAs. The expression levels of LUCAT1 were detected by qRT-PCR in (A) B-CPAP, (B) TPC1 and (C) 8050c silenced cells with control siRNA (siNC) and LUCAT1 siRNAs (1 and 2) at 24 h and two concentrations (5 and 20 μm). Data represent the mean ± SD from three independent experiments. *P < 0.05; **P < 0.01; ***P < 0.001.
After the knockdown of LUCAT, a significant reduction in cell proliferation (Fig. 3A) and cell G1 phase arrest (Fig. 3B) was detected in all cell lines analysed, after performing CCK8 assays and flow cytometry respectively. These findings indicate that LUCAT1 may play an important role in PTC development.
Figure 3.

Knockdown of LUCAT1 inhibited cell proliferation and induced a cell cycle arrest. (A) Representation of the effects on the proliferation (OD450nm) after transfection with LUCAT1 with siRNA1 (20 μm) at 24 h and negative control (siNC). (B) Flow cytometry analysis of cell cycle 24 h after transfection with siRNA1 (20 μm) in all three cell lines. Data represent the mean ± SD from three independent experiments. *P < 0.05; **P < 0.01; ***P < 0.001.
Knockdown of LUCAT1 induces cell apoptosis and impairs cell invasion
To further determine the role of LUCAT1 in apoptosis, flow cytometry analyses were performed on our three PTC cell lines, and the outcomes showed that silenced LUCAT1 would induce cell apoptosis in all cell lines studied (Fig. 4A). In addition, transwell assays unveiled a significant impairment of the invasive ability of these transfected cells (Fig. 4B). These data suggest that LUCAT1 might be playing a relevant role in PTC progression through regulating cell apoptosis and invasion.
Figure 4.

Inhibition of LUCAT1 expression induced apoptosis and inhibited cell invasion. (A) Apoptosis was measured, by flow cytometry using PI/Annexin V staining, on silenced cells (siRNA1, 20 μm, 24 h). (B) Quantification of three independent replicates assays of apoptosis. (C) Representative images (4x magnification, 500 μm) of the polycarbonate membranes showing a significant reduction of invasion ability after transfection to silenced LUCAT1, as well as with negative control (siNC). Cells that migrated through the membrane were quantified by dissolving stained cells in 10% acetic acid for colorimetric reading of OD560nm. (D) Quantification of three independent replicates assays of cell invasion. Data represent the mean ± SD from three independent experiments. *P < 0.05; **P < 0.01; ***P < 0.001.
Knockdown of LUCAT1 induces caspase-8 activation and cleavage of nuclear downstream targets
To further explore the implication of LUCAT1 in apoptosis, the initiator caspase-8 and 9 were analysed by Western Blot. A significant cleavage was detected for caspase-8, suggesting that the extrinsic pathway was followed. Following caspase-8 activation, downstream activation of effector caspases (3, 6 and 7) was analysed by luminescence. All of them were active and able to cleavage downstream nuclear targets as Lamin A/C and PARP (Fig. 5).
Figure 5.

Regulation of apoptosis via extrinsic pathway activating caspases by LUCAT1. (A) Western Blotting analysis of cleaved (activated) caspase 8 and dowstream targets (Lamin and PARP) in BCPAP, TPC1 and 8505c cell lines and (B) Quantification by quimioluminiscence of three independent experiments was performed by ImageLab software. (C) Luminiscent assay to measure the activation of caspases –3, 6 and −7 in the three cell lines studied. *P < 0.05; **P < 0.01; ***P < 0.001.
Potential role of LUCAT1 as a tumor activator
Previous targets described for LUCAT1, together with other ones related with cell proliferation, differentiation and epigenetic regulation (HDAC1) and cell-cycle and apoptosis (P53, BAX and CDK1) were checked in our model through Western Blot. P21, P57, P53 and BAX were significantly overexpressed while EZH2, DNMT1, CDK1, HDAC1 and NRF2 (this gene was not significantly downregulated in 8505c cell line), were significantly downregulated (Fig. 6A). After quantification of three independent experiments, the significant alterations on the protein expression levels were confirmed (Fig. 6B). A hypothetical model of action of LUCAT1 is proposed (Fig. 7).
Figure 6.
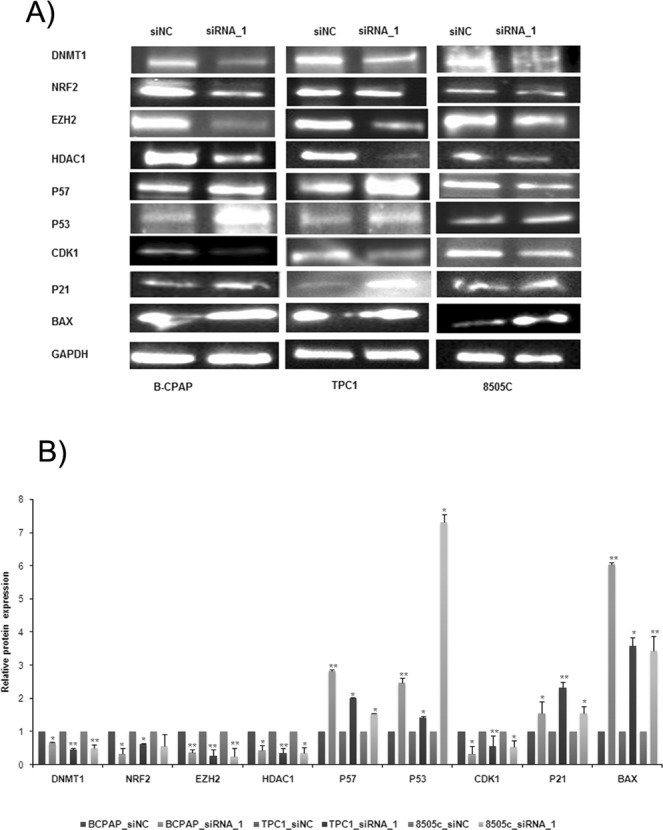
Different targets regulated by LUCAT1. (A) Western Blotting analysis of the expression of different proteins related with proliferation, apoptosis, cell cycle and epigenetic mechanisms. Blots were cropped either from the different parts of the same gel or from different gels. (B) Quantification by quimioluminiscence of three independent experiments was performed by ImageLab software. *P < 0.05; **P < 0.01; ***P < 0.001.
Figure 7.

A schematic diagram depicting the possible model of LUCAT1 action on PTC. A hypothetical model of action is proposed for LUCAT1.
These results reinforce the potential role of LUCAT1 as a transcriptional regulator by impairing cell proliferation and invasion, inducing apoptosis though extrinsic pathway activating caspases and leading to cell-cycle arrest.
Discussion
LUCAT1 has been found to be implicated in different biological processes in a broad variety of cancers, which reinforces its potential oncogenic role, but, to our knowledge, this is the first study analysing LUCAT1 and its role in PTC development.
It is important to discern the potential association between a given lncRNA and clinical features of the patients evaluated, because it can be highlighted as an interesting molecular biomarker for a particular cancer type32,33. In our case, around 50% of patients presented upregulated LUCAT1 and an advanced tumor stage, suggesting that it could be implicated in some mechanisms leading to the progression of PTC.
LUCAT1 is specifically located in the cell nucleus of the tumoral regions, as it has been confirmed in renal carcinoma22. This fact suggests that it could regulate gene transcription28,34.
Furthermore, our outcomes indicate that LUCAT1 might induce cell proliferation by regulating the cell-cycle, alike to other potential oncogenic lncRNAs35.
Unrestricted cell proliferation is a hallmark of cancers and is usually evoked by alterations in cyclin-dependent kinases (CDKs) activity36. The CDK1 protein is essential to entry into S-phase and mitosis37. Thus, CDK1 knockdown hindered G1/S progression. A significant reduction of CDK1 was detected in all the cell lines tested, which supports the implication of LUCAT1 in cell-cycle, supporting previous evidences on different carcinomas16,22.
There is a signalling link between CDK1 and EZH2, with a relevant role in cancer cell invasion38.
The downregulation of EZH2 observed in our cell lines, could be produced by the reduced expression of CDK1 after LUCAT1 knockdown that thus promotes the aberrant cell transformation to cancer cells. P57 is a direct target of EZH2 and, in fact, previous evidences revealed that LUCAT1 epigenetically impaired the P21 and P57 expression16. Interestingly, P21, when localized specifically to the nucleus regulates cell proliferation and differentiation39.
In the current study, an increased expression of both P21 and P57 and a downregulation of EZH2 would reinforce the role of LUCAT1 on proliferation and cell-cycle regulation.
Recent evidences in PTC have confirmed that recruitment of polycomb repressor complexes PRC2 (with EZH2) and histone deacetylase HDAC1/2 is needed for transcriptional repression and pro-proliferation through P5740. Both histone deacetylation (supported by HDACs)41 and DNA methylation (by DNA methyl transferases, DNMTs)42 are two relevant gene-silencing mechanisms which accelerate the progression of many cancers. DNMT1 and HDAC1 are known to be upregulated in PTC43,44.
Distant metastases are one of the main factors for overall survival in PTC45. Based on this concept, the invasion capacity and apoptosis of cells were tested. It is worthy to mention that P53 together with P21 produces a cell cycle G1 phase arrest46. In our cell model, a significant P53 and BAX proteins levels increase was detected, suggesting the implication of LUCAT1 in this mechanism.
In this manner, LUCAT1 is proposed to be related with PTC progression through LUCAT1/CDK1/EZH2/P57/P21/HDAC1/DNMT1/P53/BAX axis, suggesting its role as tumor activator in PTC, as it has been reported in other type of cancers16,28.
Finally, searching for a pathway involved on the development of PTC, and based on previous studies13,28, the expression level of NRF2 was analysed. It has been described that the NRF2 pathway is commonly activated in PTC and its knockdown significantly decreased viability of PTC cell lines47. NRF2 is implicated in cell survival through the regulation of the reactive oxygen species level48. Then, knockdown of LUCAT1 reveals reduced NRF2 levels, suggesting that NRF2 could be regulated by LUCAT1 and both act on PTC progression.
Collectively, our study highlights LUCAT1 as a new prognosis-related biomarker associated with PTC, through the LUCAT1/CDK1/EZH2/P57/P21/HDAC1/DNMT1/P53/BAX axis and with the influence of other mechanisms, such as increase of oxidative stress through the downregulation of the antioxidant gene NRF2.
Supplementary information
Acknowledgements
The authors thank the patients that have participated in this study, as well as the donors and the University Hospital Virgen del Rocío-Institute of Biomedicine of Seville Biobank (Andalusian Public Health System Biobank and ISCIII-Red de Biobancos PT13/0010/0056) for the human specimens used in this study. Authors also thank the gift of TPC1 cells from Dr. Velázquez (Barcelona) and to Alba Polonio for her technical support. This study has been funded by Instituto de Salud Carlos III through the project “PI16/0142” (Co-funded by European Regional Development Fund: Investing in your future). In addition, it has been funded by the Regional Ministry of Innovation, Science and Enterprise of the Regional Government of Andalusia “CTS-7447”. CIBERER is an initiative of the ISCIII, Spanish Ministry of Economy and Competitiveness.
Author Contributions
B.L.-T., R.M.F., S.B. and G.A. drafted the manuscript. B.L.-T. carried out functional analysis. J.M.M.M. and M.R.M.D. performed the surgical interventions in thyroid cancer patients. R.M.F. and S.B. conceived the study and coordinated all the laboratory tasks. All authors read and approved the final manuscript.
Data Availability
All data generated and/or analysed during this study are available from the corresponding author on reasonable request.
Competing Interests
The authors declare no competing interests.
Footnotes
Publisher’s note Springer Nature remains neutral with regard to jurisdictional claims in published maps and institutional affiliations.
Supplementary information
Supplementary information accompanies this paper at 10.1038/s41598-019-50913-7.
References
- 1.Segev DL, Umbricht C, Zeiger MA. Molecular pathogenesis of thyroid cancer. Surg Oncol. 2003;12:69–90. doi: 10.1016/S0960-7404(03)00037-9. [DOI] [PubMed] [Google Scholar]
- 2.Matsumoto A, Nakayama KI. Hidden Peptides Encoded by Putative Noncoding RNAs. Cell structure and function. 2018;43:75–83. doi: 10.1247/csf.18005. [DOI] [PubMed] [Google Scholar]
- 3.Yeasmin F, Yada T, Akimitsu N. Micropeptides Encoded in Transcripts Previously Identified as Long Noncoding RNAs: A New Chapter in Transcriptomics and Proteomics. Frontiers in genetics. 2018;9:144. doi: 10.3389/fgene.2018.00144. [DOI] [PMC free article] [PubMed] [Google Scholar]
- 4.Engreitz JM, et al. Local regulation of gene expression by lncRNA promoters, transcription and splicing. Nature. 2016;539:452–455. doi: 10.1038/nature20149. [DOI] [PMC free article] [PubMed] [Google Scholar]
- 5.Batista PJ, Chang HY. Long noncoding RNAs: cellular address codes in development and disease. Cell. 2013;152:1298–1307. doi: 10.1016/j.cell.2013.02.012. [DOI] [PMC free article] [PubMed] [Google Scholar]
- 6.Huarte M. The emerging role of lncRNAs in cancer. Nat Med. 2015;21:1253–1261. doi: 10.1038/nm.3981. [DOI] [PubMed] [Google Scholar]
- 7.Harrow J, et al. GENCODE: the reference human genome annotation for The ENCODE Project. Genome research. 2012;22:1760–1774. doi: 10.1101/gr.135350.111. [DOI] [PMC free article] [PubMed] [Google Scholar]
- 8.Zhao Y, et al. NONCODE 2016: an informative and valuable data source of long non-coding RNAs. Nucleic acids research. 2016;44:D203–208. doi: 10.1093/nar/gkv1252. [DOI] [PMC free article] [PubMed] [Google Scholar]
- 9.Chiu HS, et al. Pan-Cancer Analysis of lncRNA Regulation Supports Their Targeting of Cancer Genes in Each Tumor Context. Cell reports. 2018;23:297–312 e212. doi: 10.1016/j.celrep.2018.03.064. [DOI] [PMC free article] [PubMed] [Google Scholar]
- 10.Wang Z, et al. lncRNA Epigenetic Landscape Analysis Identifies EPIC1 as an Oncogenic lncRNA that Interacts with MYC and Promotes Cell-Cycle Progression in Cancer. Cancer cell. 2018;33:706–720 e709. doi: 10.1016/j.ccell.2018.03.006. [DOI] [PMC free article] [PubMed] [Google Scholar]
- 11.Lan X, et al. Genome-wide analysis of long noncoding RNA expression profile in papillary thyroid carcinoma. Gene. 2015;569:109–117. doi: 10.1016/j.gene.2015.05.046. [DOI] [PubMed] [Google Scholar]
- 12.Yang M, et al. Long noncoding RNA are aberrantly expressed in human papillary thyroid carcinoma. Oncol Lett. 2016;12:544–552. doi: 10.3892/ol.2016.4653. [DOI] [PMC free article] [PubMed] [Google Scholar]
- 13.Thai P, et al. Characterization of a novel long noncoding RNA, SCAL1, induced by cigarette smoke and elevated in lung cancer cell lines. Am J Respir Cell Mol Biol. 2013;49:204–211. doi: 10.1165/rcmb.2013-0159RC. [DOI] [PMC free article] [PubMed] [Google Scholar]
- 14.Zheng ZG, et al. The Essential Role of H19 Contributing to Cisplatin Resistance by Regulating Glutathione Metabolism in High-Grade Serous Ovarian Cancer. Sci Rep. 2016;6:26093. doi: 10.1038/srep26093. [DOI] [PMC free article] [PubMed] [Google Scholar]
- 15.Yu, H., Xu, Y., Zhang, D. & Liu, G. Long noncoding RNA LUCAT1 promotes malignancy of ovarian cancer through regulation of miR-612/HOXA13 pathway. Biochem Biophys Res Commun, 10.1016/j.bbrc.2018.07.165 (2018). [DOI] [PubMed]
- 16.Sun Y, et al. Long non-coding RNA LUCAT1 is associated with poor prognosis in human non-small lung cancer and regulates cell proliferation via epigenetically repressing p21 and p57 expression. Oncotarget. 2017;8:28297–28311. doi: 10.18632/oncotarget.16044. [DOI] [PMC free article] [PubMed] [Google Scholar]
- 17.Ling XX, et al. LncRNA LUCAT1 Activation Mediated by the Down-regulation of DNMT1 Is Involved in Cell Apoptosis Induced by PM2.5. Biomed Environ Sci. 2018;31:608–612. doi: 10.3967/bes2018.082. [DOI] [PubMed] [Google Scholar]
- 18.Zhou Q, et al. LUCAT1 promotes colorectal cancer tumorigenesis by targeting the ribosomal protein L40-MDM2-p53 pathway through binding with UBA52. Cancer science. 2019;110:1194–1207. doi: 10.1111/cas.13951. [DOI] [PMC free article] [PubMed] [Google Scholar]
- 19.Chen, Y., Yu, X., Xu, Y. & Shen, H. Identification of dysregulated lncRNAs profiling and metastasis-associated lncRNAs in colorectal cancer by genome-wide analysis. Cancer Med, 10.1002/cam4.1168 (2017). [DOI] [PMC free article] [PubMed]
- 20.Xiao H, et al. Long non-coding RNA Lucat1 is a poor prognostic factor and demonstrates malignant biological behavior in clear cell renal cell carcinoma. Oncotarget. 2017;8:113622–113634. doi: 10.18632/oncotarget.21185. [DOI] [PMC free article] [PubMed] [Google Scholar]
- 21.Wang, X., Guo, S., Zhao, R., Liu, Y. & Yang, G. STAT3-activated lncRNA LUCAT1 drives cell proliferation, migration and invasion in hepatoblastoma through regulating miR-301b/STAT3 axis. Human gene therapy, 10.1089/hum.2018.146 (2018). [DOI] [PubMed]
- 22.Zheng Z, et al. Long Non-Coding RNA LUCAT1 Promotes Proliferation and Invasion in Clear Cell Renal Cell Carcinoma Through AKT/GSK-3beta Signaling Pathway. Cellular physiology and biochemistry: international journal of experimental cellular physiology, biochemistry, and pharmacology. 2018;48:891–904. doi: 10.1159/000491957. [DOI] [PubMed] [Google Scholar]
- 23.Gramantieri L, et al. LncRNAs as novel players in hepatocellular carcinoma recurrence. Oncotarget. 2018;9:35085–35099. doi: 10.18632/oncotarget.26202. [DOI] [PMC free article] [PubMed] [Google Scholar]
- 24.Wang, L. N., Zhu, X. Q., Song, X. S. & Xu, Y. Long noncoding RNA lung cancer associated transcript 1 promotes proliferation and invasion of clear cell renal cell carcinoma cells by negatively regulating miR-495-3p. J Cell Biochem, 10.1002/jcb.27099 (2018). [DOI] [PubMed]
- 25.Lou Y, et al. Long non-coding RNA LUCAT1 promotes tumourigenesis by inhibiting ANXA2 phosphorylation in hepatocellular carcinoma. Journal of cellular and molecular medicine. 2019;23:1873–1884. doi: 10.1111/jcmm.14088. [DOI] [PMC free article] [PubMed] [Google Scholar]
- 26.Gao YS, Liu XZ, Zhang YG, Liu XJ, Li LZ. Knockdown of long non-coding RNA LUCAT1 inhibits cell viability and invasion by regulating miR-375 in glioma. Oncol Res. 2017 doi: 10.3727/096504017X15088061795756. [DOI] [PMC free article] [PubMed] [Google Scholar]
- 27.Han, Z. & Shi, L. Long non-coding RNA LUCAT1 modulates methotrexate resistance in osteosarcoma via miR-200c/ABCB1 axis. Biochem Biophys Res Commun, 10.1016/j.bbrc.2017.11.121 (2017). [DOI] [PubMed]
- 28.Yoon JH, et al. The long noncoding RNA LUCAT1 promotes tumorigenesis by controlling ubiquitination and stability of DNA methyltransferase 1 in esophageal squamous cell carcinoma. Cancer Lett. 2017;417:47–57. doi: 10.1016/j.canlet.2017.12.016. [DOI] [PubMed] [Google Scholar]
- 29.Cao YP, et al. Long Non-Coding RNA Expression Profiles for the Characterization of Different Bladder Cancer Grade. Cellular physiology and biochemistry: international journal of experimental cellular physiology, biochemistry, and pharmacology. 2018;50:1154–1163. doi: 10.1159/000494542. [DOI] [PubMed] [Google Scholar]
- 30.Haque SU, et al. Differential expression and prognostic value of long non-coding RNA in HPV-negative head and neck squamous cell carcinoma. Head Neck. 2018 doi: 10.1002/hed.25136. [DOI] [PMC free article] [PubMed] [Google Scholar]
- 31.Zhang L, Liu SK, Song L, Yao HR. SP1-induced up-regulation of lncRNA LUCAT1 promotes proliferation, migration and invasion of cervical cancer by sponging miR-181a. Artificial cells, nanomedicine, and biotechnology. 2019;47:556–564. doi: 10.1080/21691401.2019.1575840. [DOI] [PubMed] [Google Scholar]
- 32.Xiong X, Zhu H, Chen X. Low expression of long noncoding RNA CASC2 indicates a poor prognosis and promotes tumorigenesis in thyroid carcinoma. Biomed Pharmacother. 2017;93:391–397. doi: 10.1016/j.biopha.2017.06.063. [DOI] [PubMed] [Google Scholar]
- 33.Xu Y, Jiang X, Cui Y. Upregulated long noncoding RNA PANDAR predicts an unfavorable prognosis and promotes tumorigenesis in cholangiocarcinoma. Onco Targets Ther. 2017;10:2873–2883. doi: 10.2147/OTT.S137044. [DOI] [PMC free article] [PubMed] [Google Scholar]
- 34.Vance KW, Ponting CP. Transcriptional regulatory functions of nuclear long noncoding RNAs. Trends Genet. 2014;30:348–355. doi: 10.1016/j.tig.2014.06.001. [DOI] [PMC free article] [PubMed] [Google Scholar]
- 35.Shan D, Shang Y, Hu T. Long noncoding RNA BLACAT1 promotes cell proliferation and invasion in human cervical cancer. Oncol Lett. 2018;15:3490–3495. doi: 10.3892/ol.2018.7773. [DOI] [PMC free article] [PubMed] [Google Scholar]
- 36.Malumbres M. Physiological relevance of cell cycle kinases. Physiol Rev. 2011;91:973–1007. doi: 10.1152/physrev.00025.2010. [DOI] [PubMed] [Google Scholar]
- 37.Lindqvist A, van Zon W, Karlsson Rosenthal C, Wolthuis RM. Cyclin B1-Cdk1 activation continues after centrosome separation to control mitotic progression. PLoS Biol. 2007;5:e123. doi: 10.1371/journal.pbio.0050123. [DOI] [PMC free article] [PubMed] [Google Scholar]
- 38.Wei Y, et al. CDK1-dependent phosphorylation of EZH2 suppresses methylation of H3K27 and promotes osteogenic differentiation of human mesenchymal stem cells. Nat Cell Biol. 2011;13:87–94. doi: 10.1038/ncb2139. [DOI] [PMC free article] [PubMed] [Google Scholar]
- 39.de Renty C, DePamphilis ML, Ullah Z. Cytoplasmic localization of p21 protects trophoblast giant cells from DNA damage induced apoptosis. PLoS One. 2014;9:e97434. doi: 10.1371/journal.pone.0097434. [DOI] [PMC free article] [PubMed] [Google Scholar]
- 40.Li X, et al. TBX3 promotes proliferation of papillary thyroid carcinoma cells through facilitating PRC2-mediated p57(KIP2) repression. Oncogene. 2018;37:2773–2792. doi: 10.1038/s41388-017-0090-2. [DOI] [PubMed] [Google Scholar]
- 41.Wang C, Fu M, Pestell RG. Histone acetylation/deacetylation as a regulator of cell cycle gene expression. Methods in molecular biology. 2004;241:207–216. doi: 10.1385/1-59259-646-0:207. [DOI] [PubMed] [Google Scholar]
- 42.Rhee I, et al. CpG methylation is maintained in human cancer cells lacking DNMT1. Nature. 2000;404:1003–1007. doi: 10.1038/35010000. [DOI] [PubMed] [Google Scholar]
- 43.Choi YW, et al. B-RafV600E inhibits sodium iodide symporter expression via regulation of DNA methyltransferase 1. Exp Mol Med. 2014;46:e120. doi: 10.1038/emm.2014.68. [DOI] [PMC free article] [PubMed] [Google Scholar]
- 44.Huang K, Cui M, Ye F, Li Y, Zhang D. Global profiling of the signaling network of papillary thyroid carcinoma. Life Sci. 2016;147:9–14. doi: 10.1016/j.lfs.2016.01.005. [DOI] [PubMed] [Google Scholar]
- 45.Su DH, Chang SH, Chang TC. The impact of locoregional recurrences and distant metastases on the survival of patients with papillary thyroid carcinoma. Clin Endocrinol (Oxf) 2015;82:286–294. doi: 10.1111/cen.12511. [DOI] [PubMed] [Google Scholar]
- 46.Lee SH, et al. A novel oxiranylchromenone derivative, MHY336, induces apoptosis and cell cycle arrest via a p53- and p21-dependent pathway in HCT116 human colon cancer cells. Int J Oncol. 2014;44:943–949. doi: 10.3892/ijo.2013.2226. [DOI] [PubMed] [Google Scholar]
- 47.Ziros PG, et al. Nrf2 is commonly activated in papillary thyroid carcinoma, and it controls antioxidant transcriptional responses and viability of cancer cells. J Clin Endocrinol Metab. 2013;98:E1422–1427. doi: 10.1210/jc.2013-1510. [DOI] [PubMed] [Google Scholar]
- 48.Liu Y, et al. PBK/TOPK mediates promyelocyte proliferation via Nrf2-regulated cell cycle progression and apoptosis. Oncol Rep. 2015;34:3288–3296. doi: 10.3892/or.2015.4308. [DOI] [PubMed] [Google Scholar]
Associated Data
This section collects any data citations, data availability statements, or supplementary materials included in this article.
Supplementary Materials
Data Availability Statement
All data generated and/or analysed during this study are available from the corresponding author on reasonable request.