

Abstract
Tenascin-R (TN-R), an extracellular matrix glycoprotein of the CNS, localizes to nodes of Ranvier and perineuronal nets and interactsin vitro with other extracellular matrix components and recognition molecules of the immunoglobulin superfamily. To characterize the functional roles of TN-R in vivo, we have generated mice deficient for TN-R by homologous recombination using embryonic stem cells. TN-R-deficient mice are viable and fertile. The anatomy of all major brain areas and the formation and structure of myelin appear normal. However, immunostaining for the chondroitin sulfate proteoglycan phosphacan, a high-affinity ligand for TN-R, is weak and diffuse in the mutant when compared with wild-type mice. Compound action potential recordings from optic nerves of mutant mice show a significant decrease in conduction velocity as compared with controls. However, at nodes of Ranvier there is no apparent change in expression and distribution of Na+ channels, which are thought to bind to TN-R via their β2 subunit. The distribution of carbohydrate epitopes of perineuronal nets recognized by the lectinWisteria floribunda or antibodies to the HNK-1 carbohydrate on somata and dendrites of cortical and hippocampal interneurons is abnormal. These observations indicate an essential role for TN-R in the formation of perineuronal nets and in normal conduction velocity of optic nerve.
Keywords: extracellular matrix glycoprotein, HNK-1 carbohydrate, inhibitory interneurons, knock-out mutation, node of Ranvier, parvalbumin, phosphacan, sodium channel
The extracellular matrix (ECM) is a complex network of macromolecules that includes glycoproteins, polysaccharides, and proteoglycans. These provide mechanical strength, scaffolding, and support to tissues and organs, and they participate in cellular differentiation. In the nervous system, interactions of neuronal and glial cells with the ECM regulate cell migration, survival, and differentiation, axonal pathfinding, and synapse formation.
The tenascin family constitutes a group of extracellular matrix proteins displaying a common structure (for review, seeChiquet-Ehrismann et al., 1994; Erickson, 1994). At the amino terminus, a signal sequence is followed by a cysteine-rich stretch, epidermal growth factor-like (EGF) repeats, fibronectin-type III (FN) homologous repeats, and a fibrinogen-like (FG) domain at the C terminus. The number of EGF domains is characteristic for each member of the family, whereas because of alternative splicing, the number of FN repeats may vary, and isoforms of tenascin (TN)-C and TN-R exist, differing in the number of FN repeats. Currently, five members of the tenascin family (TN-C, TN-R, TN-X, TN-Y, TN-W) have been identified in diverse species from zebrafish to humans (for review, see Bristow et al., 1993;Chiquet-Ehrismann et al., 1994; Erickson, 1994; Tongiorgi et al., 1995;Hagios et al., 1996; Weber et al., 1998).
TN-C is by far the most extensively studied member of this family. TN-C has been implicated, for instance, in different morphogenetic processes during development, axonal regeneration, tumorigenesis, and wound healing. Surprisingly and disappointingly, the inactivation of thetn-c gene in mice has not provided any insight into TN-C’s functional role in vivo (Saga et al., 1992; Forsberg et al., 1996). The complete absence of TN-C immunoreactivity in the mutant created by Saga and colleagues is a matter of discussion, however (Mitrovic and Schachner, 1995; Settles et al., 1997). Preliminary evidence for behavioral defects and a disturbed serotonin and dopamine balance in these TN-C-deficient mice has been reported (Fukamauchi et al., 1996, 1997; Fukamauchi and Kusakabe, 1997). Furthermore, the structure of the neuromuscular junction and peripheral nerves appears to be altered (Cifuentes-Diaz et al., 1998; but also see Moscoso et al., 1998).
TN-X may exert an essential role in connective-tissue structure and function, and an association of TN-X deficiency with Ehlers-Danlos syndrome has been discovered recently (Burch et al., 1997).
TN-R [previously designated J1–160/180 and janusin in rodents and restrictin in chicken (Nörenberg et al., 1992; Fuss et al., 1993; for review, see Schachner et al., 1994)] appears to be restricted to the CNS. TN-R is synthesized by oligodendrocytes with high expression during the period of active myelination (Bartsch et al., 1993;Wintergerst et al., 1993). It is detectable at contact sites between unmyelinated axons, at the interface between axons and myelinating processes of oligodendrocytes, and between myelin sheaths (Bartsch et al., 1993) and is highly accumulated at the nodes of Ranvier (ffrench-Constant et al., 1986; Bartsch et al., 1993). TN-R is also expressed by subpopulations of neurons, such as horizontal cells in the retina, stellate and basket cells in the cerebellum, motoneurons in the spinal cord, and some neurons in the hippocampus (Fuss et al., 1993;Wintergerst et al., 1993).
In vitro, TN-R promotes neurite outgrowth and morphological polarization of differentiating neurons when presented as a uniform substrate (Lochter and Schachner, 1993; Lochter et al., 1994). When offered as a substrate boundary with a neurite outgrowth-conducive molecule, TN-R is repellent for growth cone advance (Pesheva et al., 1993; Taylor et al., 1993). Recently, a role of TN-R as a modulator of fasciculation has been discovered in a cerebellar explant cell culture system (Xiao et al., 1998). In addition, TN-R as a substrate promotes adhesion and differentiation of oligodendrocytes and astrocytes (Pesheva et al., 1989, 1997; Morganti et al., 1990). These observations indicate that the cellular responses to TN-R are complex and probably mediated by several neuronal receptors that interact with distinct domains of the TN-R molecule.
Among these neuronal receptors for TN-R, one has been identified as the F3/F11/contactin (F3 in rodents and F11 or contactin in chicken) immunoglobulin (Ig) superfamily adhesion molecule (Pesheva et al., 1993). F3/F11/contactin is expressed predominantly by neurons (Brümmendorf et al., 1989; Gennarini et al., 1989;Faivre-Sarrailh et al., 1992) and mediates cell recognition leading to heterophilic adhesion with neurons (Brümmendorf et al., 1993;Peles et al., 1995). The interaction of TN-R with F3/F11/contactin has been localized to the Ig-like domains of F3/F11/contactin (Brümmendorf et al., 1993; Xiao et al., 1996, 1998). TN-R-elicited repulsion and defasciculation of neurites are both mediated by binding of the amino-terminal domain of TN-R to the Ig domains of F3/F11/contactin (Pesheva et al., 1993; Xiao et al., 1996,1998). F3/F11/contactin is present in a complex comprising both L1 and Fyn tyrosine kinase (Olive et al., 1995; Zisch et al., 1995), and clustering of F3/F11/contactin at the cell surface by antibodies induces tyrosine phosphorylation of several intracellular proteins including Fyn (Zisch et al., 1995; Cervello et al., 1996), suggesting that TN-R-elicited signals can be transmitted via F3/F11/contactin to second messenger pathways into the interior of the target cells. Furthermore, it has been suggested, on the basis of the sequence homology between F3/F11/contactin and the β2 subunit of Na+ channels (Isom et al., 1995), that tenascin-C and tenascin-R may interact with β2 and thereby provide a mechanism for Na+ channel localization and regulation of functional activity at nodes of Ranvier (Srinivasan et al., 1997).
TN-R also interacts with other molecules of the extracellular matrix that may influence the properties of the intercellular space. The chondroitin sulfate proteoglycan versican and TN-R are colocalized in the granular layer of the cerebellum, and the lectin domain of versican binds to TN-R in vitro (Aspberg et al., 1995). In optic nerve, retina, and brain, there is an overlapping localization of TN-R and phosphacan (Xiao et al., 1997; Milev et al., 1998), a nervous tissue-specific chondroitin sulfate proteoglycan that is an mRNA splicing product containing the entire extracellular domain of a receptor-type protein tyrosine phosphatase (for review, see Margolis et al., 1996). A brain-derived chondroitin sulfate proteoglycan related to phosphacan has been isolated by affinity to a recombinant amino-terminal EGF domain of TN-R (Xiao et al., 1997), and phosphacan binds with high affinity (Kd ∼2 nm) to native TN-R (Milev et al., 1998). Furthermore, interactions with receptors for the HNK-1 carbohydrate epitope expressed by TN-R, such as laminin (Hall et al., 1993, 1995), may influence the functions of TN-R.
On the basis of the cell type-specific distribution, time of expression, and functional activities of TN-R assayed in vitro, various potential functions of TN-R have been proposed (for review, see Schachner et al., 1994). To investigate the functions of TN-R in vivo, we have generated mice deficient in the expression of TN-R via homologous recombination in embryonic stem cells. Here, we report that TN-R-deficient mice show alterations in the distribution of extracellular matrix molecules associated with perineuronal nets and nodes of Ranvier, along with a marked decrease in conduction velocity in CNS axons.
MATERIALS AND METHODS
tn-r Targeting construct. A genomic clone containing the 5′ part of the tn-r gene was isolated from a mouse 129Sv genomic library (Müller et al., 1994) by hybridization with a rat 0.48 kb cDNA fragment corresponding the EGF coding region of clone J1–160/180 (Fuss et al., 1991). The fragmentEcoRV intron 1 to HindIII intron 2 was first subcloned into pUC19 (Yanish-Perron et al., 1985) and then into pBluescript KS (Stratagene, La Jolla, CA), yielding the plasmid pTNR3′. The fragment EcoRV intron 0 to SacI exon 1 was subcloned into pBluescript KS (Stratagene), and the PGK promotor–neo cassette of pPGKneobpA (Soriano et al., 1991) located on a XhoI–SalI fragment was inserted in opposite orientation to tn-r gene transcription. The EcoRI fragment of this subclone was inserted into pTNR3′, and then a HSV-tk cassette (Mansour et al., 1988) was inserted via SalI in opposite orientation to tn-r gene transcription at the 3′ end, resulting in the targeting construct p5′PGKneo3′TK (see Fig.1B).
Fig. 1.

tn-r gene, tn-rtargeting construct, expected and observed structure of the disruptedtn-r gene, tn-r transcript, and aberrant transcript structure. A, Restriction map of the mousetn-r gene. Translated and nontranslated exons are represented by closed and open boxes, respectively, and are numbered with Roman numerals. E,S, Sp, R,X, and H represent cleavage sites forEcoRI, SacI, SphI,EcoRV, XhoI, and HindIII (not all sites given), respectively. B, Restriction map of the tn-r targeting construct p5′PGKneo3′TK, containing 4.2 and 3.9 kb of homologous sequences on the 5′ and 3′ sites of the neo insertion, respectively, and deleting the two potential translation initiation codons. PGKneobpA and HSV-tk cassettes and the pBluescript KS (KS-) vector part are indicated by boxes.Arrows indicate the transcriptional orientation of the respective genes. N represents cleavage site forNotI. C, Expected and observed structure of the tn-r gene after homologous recombination and localization of probes. Horizontal bars indicate the localization of hybridization probes 5′EX, 3′EX, and 3′INT.D, Structure of the wild-type tn-r gene transcript. Translated and nontranslated exons are represented byclosed and open boxes, respectively, and are numbered with Roman numerals. E, Structure of the aberrant tn-r gene transcript. Exons are represented byopen boxes. The aberrant splicing of 200 bp of intronic sequence is indicated by a hatched box.
Embryonic stem cell culture. The embryonic stem cell line E14.1 (Hooper et al., 1987) was cultured on irradiated primary mouse embryonic fibroblasts. Embryonic stem cells (2 × 10⁷) were transfected by electroporation (Bio-Rad Gene Pulser; 230V, 500 μF) with 20 μg ofNotI-linearized targeting construct, cultured on irradiated SNL 76/7 feeder cells (McMahon and Bradley, 1990) and selected with 0.2 μm1-(2-deoxy,2-fluoro-β-d-arabinofuranosyl)-5-iodouracil (FIAU; Bristol Meyers) and 300 μg/ml G418 (Life Technologies, Gaithersburg, MD) for 3 and 6 d, respectively. After single colonies were picked, aliquots of the individual clones were frozen as described (Chan and Evans, 1991) or cultured in medium containing 60% buffalo rat liver-conditioned medium without feeder cells for DNA isolation.
Screening of recombinant clones and Southern blot analysis.Embryonic stem cells were lysed and DNA was isolated as described (Ramirez-Solis et al., 1992). DNA of individual embryonic stem cell clones was digested with EcoRI and analyzed after Southern blotting as described (Montag et al., 1994) by hybridization with probe 5′EX [SacI intron 0 to EcoRV intron 0; labeled to 108 cpm/μg by random priming (Feinberg and Vogelstein, 1983)]. Genomic DNA from positive embryonic stem cells was further analyzed after restriction with the appropriate enzymes by Southern blot analysis as above using the probes 3′EX (HindIII intron 2 to SphI intron 2) and 3′INT (XhoI intron 2 to HindIII intron 2).
Blastocyst injection and mating of mice. Blastocysts were collected from B6CBAF1 females at day 4 of pregnancy in CZB medium (Chalot et al., 1989). Microinjection of embryonic stem cells into blastocysts was performed essentially as described (Hogan et al., 1986). Male chimeras were mated with C57BL/6J females, and the heterozygous (tn-r+/−) offspring were crossed to obtain homozygous (tn-r−/−) mice. The genotype of the mice was characterized by Southern blotting.
RNA preparation and Northern blot analysis. Total RNA from brains of tn-r+/+,tn-r+/−, andtn-r−/− mice was isolated using the RNeasy Kit (Qiagen, Hilden, Germany). RNA was electrophoresed in a 1.5% agarose gel containing 7% formaldehyde and transferred onto Hybond-N membranes (Amersham, Arlington Heights, IL). Hybridization was performed with the following probes labeled to 108cpm/μg by random priming (Feinberg and Vogelstein, 1983): 2676 bpEcoRI fragment of rat TN-R cDNA (Fuss et al., 1991) encoding 4.5 EGF and 7 FN repeats and 409 bp Sma-CelII fragment of rat TN-R cDNA (Fuss et al., 1991) encoding the 4.5 EGF repeats.
RT-PCR and sequencing of cDNA. Reverse transcription (AMV reverse transcriptase; Boehringer Mannheim, Mannheim, Germany) of total RNA from brains of tn-r+/− mice was performed according to the manufacturer’s instructions and using primer 211 (5′-CCTTAAGTGGGTGAGGACAATGACA-3′). Two cDNA fragments of 2.6 and 2.0 kb were amplified after PCR (annealing temperature 60°C, 30 cycles) using primers 211 and 5′UT (5′-GAATTCCAAGAGAAACCATCAGAG-3′). The fragments were subcloned into pBluescript KS (Stratagene), and sequence analysis was performed with the T7 Sequencing Kit (Pharmacia, Piscataway, NJ).
Protein analysis of brain extracts. For analysis of proteins, total brains of 14-d-oldtn-r+/+ andtn-r−/− mice were homogenized in buffer H (1 mm NaHCO3, 0.2 mm CaCl2, 0.2 mmMgCl2, 1 mm spermidine) complemented with protease inhibitors (10 μg/ml soybean trypsin inhibitor, 10 μg/ml turkey egg-white trypsin inhibitor, 1 mmphenylmethylsulfonyl fluoride, 0.5 mm iodoacetamide). The homogenate was centrifuged at 4°C and 30,000 ×g. The protein concentration of the supernatant was determined (BCA assay, Pierce, Rockford, IL). After addition of 2× loading buffer and heat denaturation, the samples were analyzed under reducing conditions by SDS-PAGE (Laemmli, 1970) and Western blotting (Towbin et al., 1979). Primary antibodies were visualized by horse radish peroxidase-coupled antibodies to mouse or rabbit IgG (1:10,000 diluted, Dianova, Hamburg, Germany) and enhanced chemiluminescence (Amersham).
Antibodies. Polyclonal antibodies to TN-R (Pesheva et al., 1989), phosphacan (Milev et al., 1994), TN-R domain-specific polyclonal antibodies (pFN, pEGF/S) (Xiao et al., 1998), and monoclonal antibodies 596 and 619, recognizing epitopes of the protein backbone of TN-R (Xiao et al., 1996), have been described. Monoclonal antibodies PA-235 (Sigma, St. Louis, MO) and undiluted hybridoma culture supernatant (Abo and Balch, 1981) were used for detecting parvalbumin and human natural killer cell antigen-1 (HNK-1), respectively. For indirect immunofluorescence, polyclonal and monoclonal antibodies were visualized by fluorescein isothiocyanate (FITC)-coupled antibodies to mouse or rabbit IgG (Dako, Carpinteria, CA).
Light and electron microscopy. For light and electron microscopy, mice were deeply anesthetized and perfused through the left ventricle with 4% paraformaldehyde and 2% glutaraldehyde in 0.1m phosphate buffer, pH 7.4. Optic nerves and brains were removed and post-fixed in the same fixative. Optic nerves or vibratome sections of retinae or brains, 200–500 μm in thickness, were incubated in 2% OsO4 for 2 hr, dehydrated in an ascending series of methanol, and embedded in Epon resin. For light microscopy, 3-μm-thick sections were stained with Toluidine blue and examined with a Zeiss Axiophot. For electron microscopy, ultrathin sections were counterstained with lead citrate and examined with a Zeiss EM 10C.
In situ hybridization.In situhybridization analysis was performed as described (Bartsch et al., 1992b). TN-R cRNA probes were generated by in vitrotranscription (Dörries et al., 1993) of pBluescript KS containing a 2.7 kb insert encoding the 4.5 EGF and the first seven FN repeats of TN-R. TN-C cRNA probes were generated as described (Bartsch et al., 1992b).
Indirect immunofluorescence of extracellular matrix molecules and myelin-associated glycoprotein. Indirect immunofluorescence for the detection of myelin-associated glycoprotein (MAG), TN-C, and phosphacan was performed on sections of fresh-frozen tissue as described (Poltorak et al., 1987; Bartsch et al., 1992a; Xiao et al., 1997). Parvalbumin and the sulfated carbohydrate epitope HNK-1 were detected on fixed sections. For fixation, animals were deeply anesthetized with Ketanest/Rompun (0.15 ml/10 gm body weight, i.p.) and transcardially perfused with saline followed by PBS, pH 7.4, containing 4% paraformaldehyde. The brains were post-fixed in the same fixative overnight at 4°C. Immunocytochemistry was performed on free-floating vibratome sections (30 μm thick) (Härtig et al., 1992; Seeger et al., 1994). Sections were incubated in PBS, pH 7.4, containing 2% BSA for 2 hr, followed by antibodies to parvalbumin (diluted 1:5000 in PBS/0.1% BSA) and the sulfated carbohydrate HNK-1 epitope (undiluted hybridoma culture supernatant) for 48 hr at 4°C under constant agitation. For the staining of parvalbumin, 0.1% Triton X-100 was added to the incubation buffer. Sections were rinsed with three changes of the same buffer. Cy-2-conjugated secondary anti-mouse antibodies (diluted 1:200) were applied for 2 hr at room temperature. Sections were mounted in Aqua-Poly/Mount (Polysciences, Warrington, PA).
Detection of perineuronal nets. The detection of the perineuronal nets was performed on fixed vibratome sections (see above) using the biotinylated lectin Wisteria floribunda(Sigma). The final concentration of the lectin was 20 μg/ml. For double-staining, sections were first incubated with the lectin and then with antibodies to parvalbumin or to the HNK-1 carbohydrate. Cy-3-conjugated streptavidin (diluted 1:600; Dianova) was used for detection of the lectin.
Quantitative analysis of cytological parameters. Twelve sections per animal (n = 5 for wild-type and TN-R-deficient mice) were chosen to determine the number and length of labeled dendrites per neuron for the lectin- and HNK-1-positive cell. The sections were selected from bregma −1.46 (Franklin and Paxinos, 1997). Sections were evaluated by image analysis (KS-400, Kontron/Zeiss) using an Axiovert microscope (Zeiss) equipped with a motorized stage and a CCD camera (Hamamatsu) connected to a PC monitor. Frames of 150 × 200 μm were randomly chosen from a particular brain area and monitored at a magnification of 400×. For the lectin staining, the primary somatosensory, retrosplenial agranular, and granular cortices (50 frames per slice), and the hippocampus (25 frames per slice) were analyzed. The primary somatosensory cortex (25 frames per slice) and the hippocampus (25 frames per slice) were analyzed by staining for the HNK-1 epitope. All positively stained cell somata and dendrites were counted. Data were evaluated using the two-samplet test (Systat 6.0, SPSS Inc.).
Detection of glycan by digoxigenin-labeled lectin. To determine whether TN-R carries N-acetylgalactosamine carbohydrate epitopes, binding of peanut agglutinin (PNA) to TN-R was analyzed. Protein extracts from brains of 3-month-old wild-type and TN-R-deficient mice were processed as described above. Samples were analyzed by SDS-PAGE (Laemmli, 1970) and Western blotting (Towbin et al., 1979). Detection of glycans was performed by using digoxigenin-labeled PNA (Boehringer Mannheim) followed by visualization with anti-digoxigenin-alkaline phosphatase conjugates (Boehringer Mannheim).
Na+ channel immunofluorescence. Optic nerves from wild-type (C57BL/6) and TN-R-deficient postnatal mice (P8 to adult) were dissected immediately after animals were killed. Nerves were then placed in 4% paraformaldehyde in 0.1 m phosphate buffer (PB), pH 7.2, for 30 min, then transferred to a 20% sucrose solution in 0.1 m PB for 3 hr. The nerve was then frozen in OCT mounting medium (Miller) and cut in 10 μm sections. Sections were placed in 0.1 m PB and finally spread on gelatin-coated coverslips and allowed to air dry. Cryosectioned tissue was then permeabilized for 2 hr in 0.1 m PB, pH 7.4, containing 0.3% Triton X-100 and 10% goat serum (PBTGS). In all steps involving antibodies, the tissue preparations were washed three times for 5 min each with PBTGS between succeeding steps. All antibodies were diluted in PBTGS. Affinity-purified polyclonal Na+channel antibodies (for details, see Rasband et al., 1998b) were diluted 1:50 and incubated with the cryosectioned tissue overnight. The secondary antibodies, goat anti-rabbit Fc-specific Fab2 fragments, conjugated to biotin (1:400, Accurate Chemicals, Westbury, NY), were applied for 1 hr, followed by Extravadin-FITC (1 hr, 1:200, Sigma). In experiments in which the relative Na+ channel fluorescence of nodal regions was compared, the secondary antibody was a goat anti-rabbit IgG conjugated to FITC and incubation with Extravadin-FITC was omitted. Finally, labeled cryosections were rinsed consecutively in PBTGS, 0.1 m PB, and 0.05 m PB for 5 min each. The samples were then air-dried and mounted on slides with an anti-fade mounting medium. The labeled tissue was examined on a Nikon Microphot fluorescence microscope fitted with a C4742–95 cooled CCD camera (Hamamatsu). The camera was connected to a laboratory computer that controlled image acquisition and storage. Each field of view (FOV) was later analyzed for the number of nodes and fluorescence intensity using the analysis program Image Pro (Media Cybernetics).
Electrophysiology. Optic nerves were dissected immediately after animals were killed and placed in Locke’s solution consisting of (in mm): NaCl 154, KCl 5.6, CaCl2 2,d-glucose 5, and HEPES 10, pH 7.4. Nerves were then transferred to a recording chamber that was continuously perfused, oxygenated, and temperature-regulated. For stimulation and recording of action potentials, each end of the nerve was drawn into a suction electrode (Stys et al., 1991). The stimulus was adjusted to ∼10% above the level that elicited a maximum response. Compound action potentials (CAPs) were amplified, digitized, recorded, and analyzed on a laboratory computer. Control optic nerves used in suction electrode recordings came from C57BL/6 (n = 6), 129/SvEv (n = 2), and 129/SvEms (n = 2) mice. In control experiments in which the sciatic nerve was used instead of the optic nerve, the procedure was the same, with the single exception being that the nerve was desheathed before recording. Amplitudes were typically ∼3 mV but were arbitrary in these external electrode recordings and thus are not included in the Figures. The average amplitude of CAPs in TN-R-deficient nerves was 3.0 ± 1.4 mV, not significantly different from that of wild-type (3.3 ± 1.1 mV).
For conduction velocity measurements, the time to the peak amplitude of the CAP was measured from the onset of the nerve stimulus. In two cases (one wild type, one TN-R deficient), a smaller, faster component of the CAP was seen, but it was not possible to derive a peak value from these faster components. Instead, the main peak amplitude was used as in all other experiments. Before transfer to the recording chamber, nerve length was measured. The conduction velocity was then calculated as the length of the nerve divided by the time to peak amplitude.
RESULTS
Generation of TN-R-deficient mice
Using a rat cDNA fragment corresponding to the amino-terminal region of TN-R, a clone carrying the 5′part of the tn-r gene was isolated from a mouse 129Sv genomic library. The partial structure of the tn-r gene is shown in Figure1A. Exon 1 encodes the two potential translational start codons followed by the signal sequence and the cysteine-rich amino-terminal part, and exon 2 codes for all EGF repeats. To inactivate the tn-r gene, a targeting vector was constructed (Fig. 1B). This vector contains a 4.2 kb 5′ homologous sequence, a PGK-neocassette (Soriano et al., 1991) in opposite direction to thetn-r transcription and replacing the coding region of exon 1 and part of intron 1, 3.9 kb of the 3′ homologous region including exon 2, and the herpes simplex virus (HSV) thymidine kinase gene (tk) for selection against random integration (Mansour et al., 1988). Homologous recombination with this targeting vector results in an insertional mutation (Fig. 1C) and deletes the region encoding the ribosomal binding site, the translation initiation codon(s), and the amino terminus including the signal sequence, which is thus expected to result in a null mutation.
After electroporation of the linearized targeting vector into E14 embryonic stem cells (Hooper et al., 1987) and double selection with FIAU and G418, approximately 1 clone of 100 carried the desired mutation as determined by Southern blot analysis with the external probe 5′EX (Fig. 2A). The presence of a new EcoRI site introduced by insertion ofneo into exon 1 of the tn-r gene was detected by the appearance of a 7.7 kb band in addition to the wild-type band of 10.7 kb. Further analysis with the 3′ external probe 3′EX (Fig.2A) and the 3′ internal probe 3′INT (data not shown) confirmed the pattern expected after homologous recombination.
Fig. 2.

Southern, Northern, and Western blot analysis of wild-type and tn-r targeted embryonic stem cells and tn-r−/−,tn-r+/−, andtn-r+/+ mice. A, Southern blot analysis. DNA from wild-type (lanes 1 and3) and tn-r targeted embryonic stem cells (lanes 2 and 4) and DNA fromtn-r+/+ (lanes 6 and9), tn-r+/−(lanes 5 and 8), andtn-r−/− (lanes 7 and10) mice digested with EcoRI (lanes 1, 2, 5–10) or SphI (lanes 3 and 4) was hybridized with probes 5′EX (lanes 1, 2, 8–10), 3′EX (lanes 3 and4), or 3′INT (lanes 5–7). The size of DNA fragments in kilobases is indicated at the left margin. B, Northern blot analysis. RNA from brains of tn-r+/+,tn-r+/−, andtn-r−/− mice was hybridized with a 400 bp cDNA fragment specific for the EGF encoding part (exon 2;lanes 1–3) or with a 2.7 kb cDNA fragment specific for the 3′ part of the tn-r transcript (lanes 4–6). The size of an RNA marker in kilobases is indicated at the left margin. C, Western blot analysis of brain protein extracts using monoclonal antibody 596 against TN-R. Num-bers indicate micrograms of protein loaded per lane of detergent extracts of a crude soluble fraction from 14-d-old tn-r+/+ andtn-r−/− mice. Intn-r+/+ mice, TN-R is detectable in 0.5 μg of protein as a broad band at 160–180 kDa, representing the 160 and 180 kDa isoforms. No signal is obtained in 500 μg of protein from TN-R-deficient mice. D, Western blot analysis of brain extracts using monoclonal antibody 619, polyclonal antibodies against TN-R (pTN-R), and TN-R domain-specific polyclonal antibodies (pEGF/S, pFN). Ten micrograms of protein of detergent extracts of a crude soluble fraction from brains of 14-d-old wild-type and TN-R-deficient mice were loaded per lane. The molecular mass of TN-R isoforms in kilodaltons is indicated at the left margin.
Highly chimeric mice were obtained after injection of targeted embryonic stem cells into blastocysts. Chimeric males showed germline transmission of the disrupted tn-r gene as analyzed by Southern blot analysis. Crossing of heterozygous (tn-r+/−) offspring yielded homozygous TN-R-deficient (tn-r−/−) mice with strictly Mendelian frequencies. Southern blot analysis of these mice with the probes 3′EX (data not shown), 5′EX, and 3′INT showed the pattern expected for a single integration by homologous recombination (Fig. 2A).
To determine whether the mutated tn-r gene is transcribed, total RNA from brains of tn-r+/+,tn-r+/−, andtn-r−/− mice was subjected to Northern blot analysis. After hybridization with a rat cDNA probe specific for the EGF coding sequence in exon 2, no signal was detectable with RNA from TN-R-deficient mice, whereas TN-R mRNA of ∼12 kb was easily detectable in tn-r+/+ andtn-r+/− mice (Fig.2B). Hybridization with a rat cDNA probe corresponding to the 4.5 EGF and the first seven FN repeats of TN-R detected an RNA of ∼12 kb in tn-r+/+,tn-r+/−, andtn-r−/− mice (Fig.2B), indicating that the mutated tn-r gene is still transcribed yielding an mRNA missing the first exons. The nucleotide sequence of the 5′ end of this aberrant RNA was determined after RT-PCR (see Materials and Methods) and revealed that it contains 5′ nontranslated sequence of the tn-r cDNA (EMBL accession no. AJ005844) followed by intronic sequences and the exon encoding the second FN-like domain (Fig. 1E). Therefore, the RNA transcribed from the mutated tn-r gene is missing the region encoding the ribosomal binding site, the translation initiation codon, the signal sequence, the EGF-like domains, and the first FN-like domain.
To confirm that the mutation generated a null allele, proteins from brains of 14-d-old tn-r+/+,tn-r+/−, andtn-r−/− mice were analyzed by immunoblot analysis. TN-R was easily detected in 0.5 μg of protein from brains of wild-type mice using monoclonal antibody 596, but no signal could be detected in 500 μg of protein from brains of TN-R-deficient mice (Fig. 2C). Furthermore, using monoclonal antibody 619 recognizing the fibrinogen-like domain of TN-R (Xiao et al., 1996), polyclonal antibodies against brain-derived TN-R, and TN-R domain-specific polyclonal antibodies pEGF-S and pFN, TN-R could not be detected in protein extracts from brains of TN-R-deficient mice (Fig.2D). Similarly, immunohistochemical analysis of sections through the optic nerve, retina, and the cerebellum from adult TN-R-deficient mice with monoclonal antibody 619 showed no immunoreactivity for TN-R (Fig.3b). The antibodies also did not reveal any intracellular staining, indicating that no TN-R-related truncated form is expressed.
Fig. 3.

Immunohistological analysis of wild-type and TN-R-deficient mice. Immunohistological localization of TN-R by indirect immunofluorescence on sections of cerebella of 8-week-old wild-type (a) and TN-R-deficient (b) mice using monoclonal antibody 619 (a, b). Intense TN-R immunoreactivity is visible in sections from wild-type mice (a), whereas no immunoreactivity is detectable on sections from TN-R-deficient mice (b) or from wild-type incubated with secondary antibody only (c). mol, Molecular layer; pcl, Purkinje cell layer; igl, internal granular layer. Scale bar, 100 μm.
Neither heterozygous nor homozygous TN-R-deficient mice showed any obvious, grossly abnormal behavioral phenotype up to an age of ∼1 year, the latest time point investigated. Furthermore, we have established TN-R-deficient lines by intercrossing homozygous TN-R-deficient mice, proving that both sexes are fertile.
Morphological analysis of the CNS of TN-R-deficient mice.
At the light microscopic level, the general morphology of brains of 2- and 8-week-old and 9-month-old TN-R-deficient mice appeared normal and was not distinguishable from that of wild-type littermates. In the cerebellum of 4-month-old TN-R-deficient mice, the molecular layer, Purkinje cell layer, and internal granular layer revealed an apparently normal morphology (Fig. 4, compare a, b). In the retina of adult TN-R-deficient mice, the inner and outer nuclear layer and the plexiform layers were formed normally with respect to their thickness and cellular organization (Fig. 4, compare c, d). In addition, cross sections through the spinal cord of TN-R-deficient mice displayed a normal pattern of myelination (data not shown).
Fig. 4.
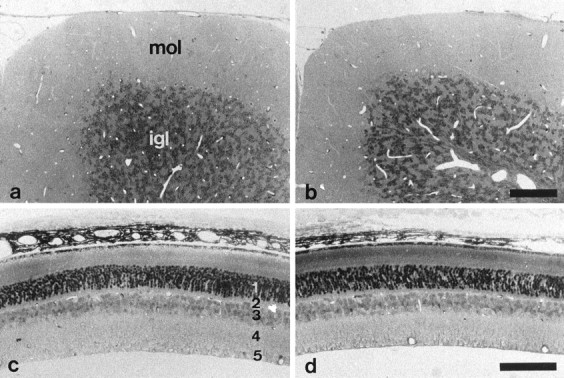
Light microscopic analysis of cerebella and retinae from wild-type and TN-R-deficient mice. Semithin sections through cerebella (a, b) and retinae (c, d) of 8-week-old wild-type (a, c) and TN-R-deficient (b, d) mice. The overall histology and number and localization of the different cell types in both brain regions appear normal in TN-R-deficient mice. mol, Molecular layer; igl, internal granular layer;1, outer nuclear layer; 2, outer plexiform layer; 3, inner nuclear layer;4, inner plexiform layer; 5, ganglion cell layer and nerve fiber layer. Scale bars (shown inb): a, b, 100 μm; (shown in d): c, d, 100 μm.
Using a cRNA probe directed against a region common to the TN-R mRNA and the truncated RNA expressed in the mutant, cells normally expressing TN-R could be visualized in TN-R-deficient mice byin situ hybridization. Horizontal cells located at the outer margin of the inner nuclear layer of the retina, and glial cells in the myelinated part of the optic nerve of 14-d-old TN-R-deficient mice expressed the aberrant TN-R mRNA and were present in a density and distribution similar to that of TN-R-expressing cells in wild-type littermates (Fig. 5, comparea, b). In the cerebellum of 14-d-old TN-R-deficient mice, the aberrant TN-R mRNA was expressed by cells located in the developing white matter and internal granular layer and by stellate and basket cells in the molecular layer (data not shown). This staining pattern in TN-R-deficient mice revealed no difference from that in wild-type littermates. Likewise, motoneurons located in the spinal cord showed a distribution and density not different between wild-type and TN-R-deficient animals (data not shown).
Fig. 5.
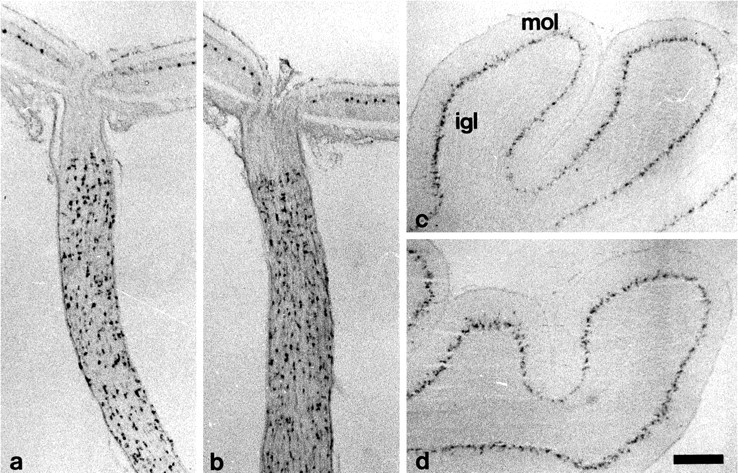
In situ hybridization analysis of retinae, optic nerves, and cerebella from wild-type and TN-R-deficient mice. Localization by in situ hybridization oftn-r (a, b) and tn-c(c, d) transcripts in 14-d-old wild-type (a, c) and TN-R-deficient (b, d) mice. a, b, The tn-r cRNA probe detects wild-type (a) and aberrant (b) transcripts in cells located at the outer margin of the inner nuclear layer of retinae and in cells restricted to the myelinated part of optic nerves. c, d, tn-c transcripts are detected in Golgi epithelial cells of cerebella of both genotypes.igl, Internal granular layer; mol, molecular layer. Scale bar (shown in d)a, b, 200 μm; c, d, 250 μm.
Electron microscopic analysis of optic nerves of TN-R-deficient mice
TN-R is expressed by cells of the oligodendrocyte cell lineage during development and in the adult (Pesheva et al., 1989;Bartsch et al., 1993; Wintergerst et al., 1993) and has been hypothesized to be functionally involved in the formation of nodes of Ranvier (ffrench-Constant et al., 1986; Bartsch et al., 1993). Myelination and morphology of myelin sheaths were studied in 14-d-old and 2- and 9-month-old TN-R mutants at the ultrastructural level. In cross-sectioned optic nerves of 14-d-old mice, the density of myelin sheaths was comparable between wild-type and TN-R-deficient animals (data not shown), indicating that myelination is not delayed in the mutant. Moreover, myelin sheaths in the optic nerve of 2- and 9-month-old TN-R-deficient mice did not show obvious morphological defects (Fig. 6, compare a,b). The ultrastructure of nodes of Ranvier also did not reveal obvious morphological differences between wild-type (data not shown) and TN-R-deficient mice (Fig. 6c). Paranodal loops of myelin sheaths formed normally in TN-R-deficient mice (Fig.6c), and processes of perinodal astrocytes extended in a similar pattern into the nodal region of myelinated axons of wild-type and mutant mice.
Fig. 6.
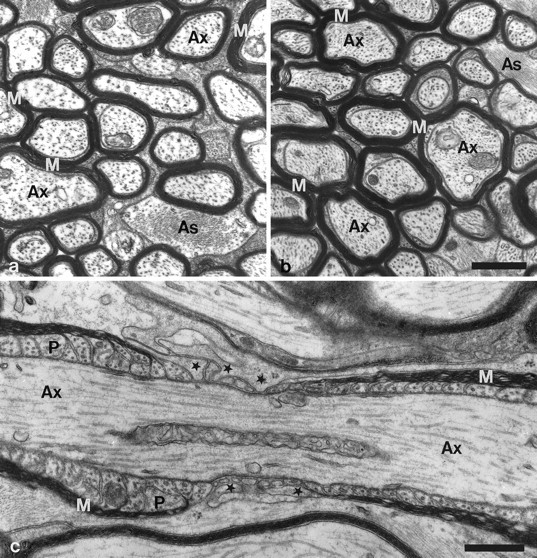
Electron microscopic analysis of optic nerves of wild-type and TN-R-deficient mice. Cross sections through optic nerves of 8-week-old wild-type (a) and TN-R-deficient (b) mice. There are no significant differences in the number of myelinated axons or the ultrastructure of myelin between both genotypes. c, Longitudinal section through a myelinated ganglion cell axon of an 8-week-old TN-R-deficient mouse. Note the normal ultrastructure of paranodal regions of myelin sheaths and the presence of perinodal astrocyte processes (some marked withstars) extending into the nodal regions of the axon.As, Astrocyte; Ax, axon;M, myelin; P, paranodal loops. Scale bar, 0.5 μm.
Expression of extracellular matrix molecules and myelin-associated glycoprotein in TN-R-deficient mice
In situ hybridization analysis of cerebella from wild-type and TN-R-deficient mice revealed no significant differences in the distribution and density of cells expressing TN-C mRNA (Fig. 5, compare c, d). In agreement with this observation, we found no obvious differences in the intensity and distribution of TN-C protein in the cerebellar cortex of adult wild-type and TN-R-deficient mice (Fig.7, compare a, b). In the adult optic nerve, TN-C is accumulated in the unmyelinated proximal, i.e., near retina part, but is hardly detectable in the distal, myelinated part [for a wild-type, see Fig. 7c(Bartsch et al., 1992a)]. This characteristic, restricted expression of TN-C was also maintained in TN-R-deficient mice (Fig.7d). MAG is expressed by oligodendrocytes and located on myelinating oligodendrocyte processes and in the periaxonal region of myelinated axons. Immunohistochemical localization of MAG did not show differences between TN-R-deficient and wild-type animals (data not shown).
Fig. 7.
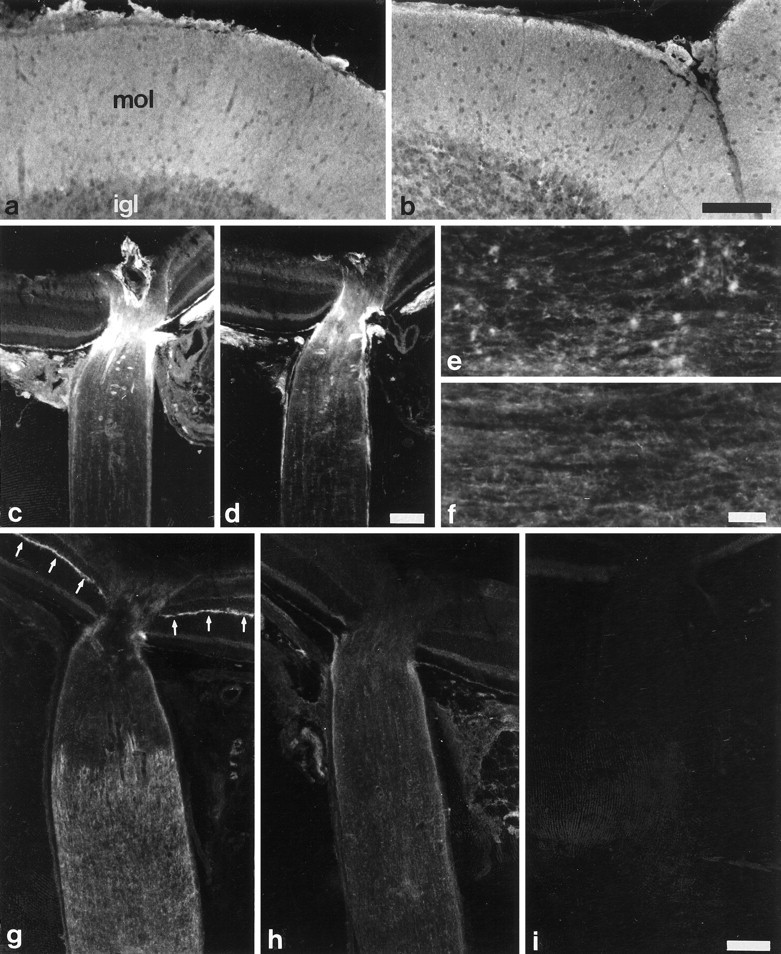
Immunohistochemical localization of phosphacan and TN-C in wild-type and TN-R-deficient mice. TN-C was detected in the cerebellar cortex (a, b) and retina and optic nerve (c, d), and phosphacan was detected in the spinal cord (e, f) and retina and optic nerve (g, h) of adult wild-type (a, c, e, g) and TN-R-deficient (b, d, f, h) mice. TN-C immunoreactivity in the cerebellar cortex of adult mice is homogeneously distributed in the molecular layer (a, mol) and is weakly detectable in the internal granular layer (a, igl), with no obvious differences in intensity and distribution between wild-type (a) and TN-R-deficient (b) mice. Intense TN-C immunoreactivity in the retina and optic nerve of wild-type (c) and TN-R-deficient (d) mice is restricted to the retinal end of the nerve. The retina and distal myelinated part of the optic nerve of both genotypes is hardly stained by TN-C antibodies (c, d). Spots of increased phosphacan immunoreactivity are detectable in the white matter of spinal cords of wild-type mice (e), whereas phosphacan is diffusely distributed in white matter of TN-R-deficient mice (f). Incubation of retinae and optic nerves of wild-type mice with anti-phosphacan antibodies reveals particularly strong staining of the outer plexiform layer of the retina (g, arrows) and a punctuate staining of the distal myelinated part of the optic nerve. Phosphacan immunoreactivity in retinae and optic nerves of TN-R-deficient animals (h), in contrast, is weak and diffusely distributed when compared with wild-type mice. Sections incubated with secondary antibodies only are devoid of any labeling (i). Scale bars (shown in b fora and b, in d forc and d, and in i forg–i), 100 μm; (shown in f)e, f, 250 μm.
Using immunohistochemistry, we recently found a striking colocalization of TN-R and the chondroitin sulfate proteoglycan phosphacan in retinae and optic nerves from adult wild-type mice (Xiao et al., 1997; Milev et al., 1998). In the retina, TN-R [data not shown; see Bartsch et al. (1993)] and phosphacan immunoreactivities (Fig. 7g) are intense in the outer plexiform layer and weak in the inner plexiform layer and nerve fiber layer. In the optic nerve, TN-R and phosphacan were predominantly detectable in the distal myelinated part of the nerve, and spot-like intense immunoreactivity of both ECM molecules suggests their accumulation at nodes of Ranvier [for TN-R, see Bartsch et al. (1993); for phosphacan, see Fig. 7g; Xiao et al. (1997)]. Spots of increased TN-R- (Wintergerst et al., 1993) and phosphacan (Fig. 7e) immunoreactivity were also detectable in the white matter of longitudinally sectioned spinal cords of wild-type mice. This characteristic distribution of phosphacan immunoreactivity was not detectable, however, in the retina, optic nerve, or spinal cord of TN-R-deficient mice (Fig. 7f,h). In particular, neither prominent phosphacan positivity of the outer plexiform layer of the retina nor intense spot-like phosphacan immunoreactivity in the optic nerve or white matter of the spinal cord were visible in TN-R mutants (Fig. 7, compare e,f and g, h). Instead, phosphacan immunoreactivity was weak and diffuse, indicating an altered distribution of this ECM component in mutant mice.
Analysis of parvalbumin-positive interneurons and perineuronal nets
TN-R is expressed by interneurons in the cerebellar cortex, retina, and hippocampus (Fuss et al., 1993; Wintergerst et al., 1993). We investigated the density of inhibitory interneurons by immunocytochemistry using antibodies to the Ca2+-binding protein parvalbumin as a marker for a subpopulation of GABAergic cells. The density of parvalbumin-immunoreactive cells was not different between wild-type and mutant animals in the regions studied (somatosensory cortex, retrosplenial cortex, and the CA1 field of the hippocampus). Representative aspects of parvalbumin-positive neurons are shown for the adult somatosensory cortex of wild-type and TN-R-deficient animals (Fig. 8, compare a,b).
Fig. 8.
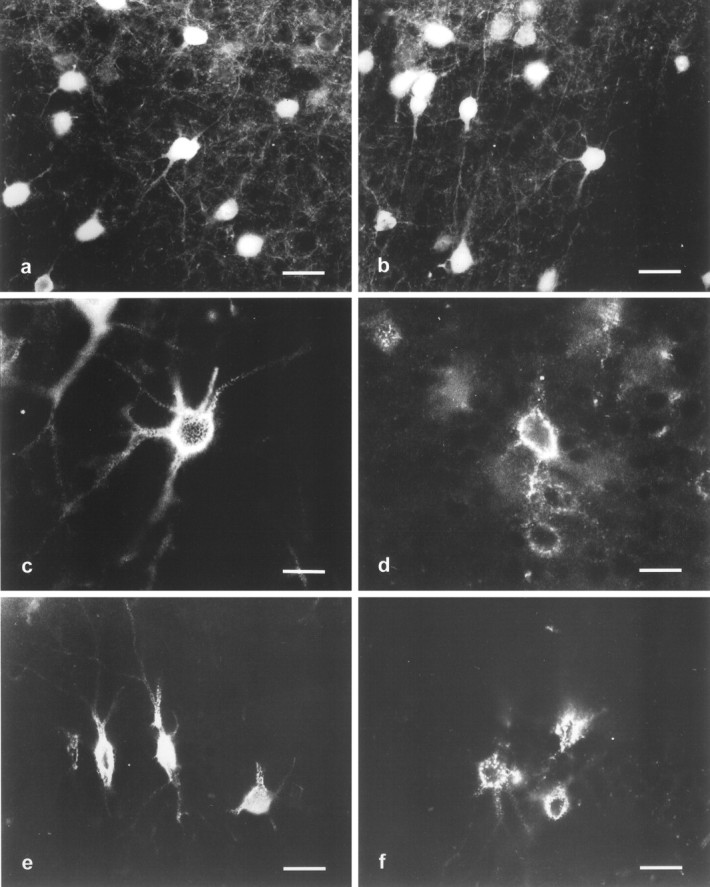
Immunohistochemical localization of parvalbumin and Wisteria floribunda lectin-binding sites in the somatosensory cortex and hippocampus of wild-type and TN-R-deficient mice. Parvalbumin (a, b) and lectin-binding sites (c–f) in layer IV of the somatosensory cortex (a–d) and CA1 region of the hippocampus (e, f) of wild-type (a, c, e) and TN-R-deficient (b, d, f) mice. There is no significant difference in density, distribution, or cell morphology of parvalbumin-positive neurons in the somatosensory cortex of wild-type and TN-R-deficient mice (compare a, b). Perineuronal nets stained by the lectin are less developed in TN-R-deficient mice when compared with wild-type mice (comparec, d). In wild-type animals the punctuate staining of cell bodies is distinct and well delineates the primary dendritic shafts extending from the neuronal cell body (c). In TN-R-deficient mice the lectin staining of neuronal cell bodies is less punctuate and does not extend well into the primary dendritic shafts (d). Similarly, in the hippocampus, primary dendritic shafts are distinctly labeled by the lectin in wild-type animals (e), whereas only cell bodies but not dendritic shafts are detectably labeled by the lectin in TN-R-deficient mice (f). Scale bars: a, b, e,f, 40 μm; c, d, 20 μm.
The parvalbumin-immunoreactive GABAergic interneurons are surrounded by perineuronal nets (Härtig et al., 1992, 1994; Lüth et al., 1992; Brückner et al., 1994). Perineuronal nets are described as a lattice-like accumulation of different extracellular molecules adhering intimately to the surface of cell body and proximal dendrites, excluding the axon initial segment of certain neurons in the adult brain (for review, see Celio and Blümcke, 1994), and they are characteristically stained by Wisteria floribunda lectin and peanut agglutinin. These lectins label the perineuronal nets in a mesh-like pattern that surrounds the perikarya and the first order branches of dendrites. Sometimes the initial segments of axons of these parvalbumin-positive interneurons are also labeled (for instance, see Fig. 8c). Such cells are found in layer IV and, in particular, in its upper part of the somatosensory cortex of adult mice (Fig. 8c). This staining pattern is also found associated with neurons of the agranular and granular retrosplenial cortices. In the hippocampus, lectin-labeled neurons are present in the strata oriens and pyramidale of the CA1–3 fields and in the stratum radiatum of the dorsal half of the CA3 field. Only a few lectin-labeled cells are located within and underneath the stratum granulare of the dentate gyrus (data not shown).
In TN-R-deficient mice, the distribution and shape of perineuronal nets is clearly different from that in wild-type animals (Fig.8c–f). The abnormal configuration of perineuronal nets in TN-R-deficient mice is characterized by a less regularly shaped distribution around the neuronal perikarya, and the primary dendritic shafts are less ensheathed by the punctuate appearance of the lectin labeling. It is noteworthy that all parvalbumin-reactive neurons contain these abnormally shaped perineuronal nets as revealed by double-labeling (data not shown). Antibodies against the HNK-1 carbohydrate structure show a labeling pattern similar to that of the lectin, thus also revealing a less regularly shaped and altered appearance of perineuronal nets in the mutant (data not shown). Quantitative evaluation of the density of lectin- and HNK-1-positive neurons, number of lectin- and HNK-1-positive dendrites extending from individual neuronal somata, and lengths of primary dendritic shafts labeled by lectin and HNK-1 antibodies showed significant differences between wild-type and TN-R-deficient animals (Table1). Although the numbers of lectin- and HNK-1-positive neurons were similar for TN-R-deficient and wild-type mice in the brain areas analyzed, the numbers of dendrites per neuron and the length of the primary shafts that were labeled by lectin and HNK-1 antibodies were reduced in the TN-R-deficient compared with wild-type animals.
Table 1.
Quantitative evaluation of density of neuronal cell bodies, dendrites per neuron, and dendritic length per neuron in wild-type and TN-R-deficient mice as visualized by staining with the lectinWisteria floribunda and immunocytochemical detection of the HNK-1 carbohydrate epitope
| Neurons/frame | Dendrites/neuron | Dendritic length (μm) | ||||
|---|---|---|---|---|---|---|
| Cortex | Hippocampus | Cortex | Hippocampus | Cortex | Hippocampus | |
| Wisteria flo ribunda | ||||||
| Wild type | 4.120 ± 0.235 | 2.740 ± 0.519 | 2.380 ± 0.111 | 3.000 ± 0.130 | 22.266 ± 0.953 | 28.154 ± 1.479 |
| tn-r−/− | 3.920 ± 0.150 | 2.580 ± 0.231 | 1.260 ± 0.133*** | 1.360 ± 0.117**** | 14.220 ± 0.487*** | 18.962 ± 0.559** |
| HNK-1 | ||||||
| Wild type | 3.260 ± 0.361 | 1.980 ± 0.278 | 1.920 ± 0.153 | 2.040 ± 0.129 | 18.772 ± 0.948 | 17.372 ± 1.596 |
| tn-r−/− | 3.160 ± 0.425 | 2.040 ± 0.277 | 0.680 ± 0.086*** | 1.020 ± 0.128*** | 12.412 ± 0.546*** | 11.096 ± 0.801* |
Wisteria floribunda staining is of the perineuronal nets in the primary sensory cortex, retrosplenial granular and agranular cortex, and in the hippocampus. HNK-1 staining is in the primary sensory cortex and hippocampus. Values are means ± SEM.
*p < 0.05, **p < 0.01, ***p < 0.001, ****p < 0.0001.
To exclude the possibility that the abnormal distribution of HNK-1 carbohydrate and binding sites for the lectin Wisteria floribunda detected in TN-R-deficient mice is caused simply by the absence of TN-R as the major carrier of these carbohydrates in perineuronal nets, we determined whether TN-R carries glycans that are recognized by PNA, a lectin that, like Wisteria floribunda, recognizes N-acetylgalactosamine in perineuronal nets. The pattern of proteins labeled by PNA after Western blot analysis of brain extracts from 3-month-old TN-R-deficient and wild-type mice were indistinguishable (data not shown). Importantly, TN-R immunopurified from adult brain was also not recognized by PNA. Thus, the absence of TN-R from perineuronal nets in TN-R-deficient mice cannot explain the difference in labeling of perineuronal nets.
In summary, the density of parvalbumin-positive interneurons with perineuronal nets labeled by Wisteria floribunda lectin or HNK-1 antibodies does not differ between wild-type and TN-R-deficient animals. The perineuronal nets around somata and accompanying the primary dendritic shafts are clearly less developed, however, in TN-R-deficient mice than in wild-type mice.
Na+ channels at nodes of Ranvier in the optic nerve
The presence of TN-R at CNS nodes of Ranvier, along with the partial homology of the Na+ channel β2 subunit to the TN-R receptor F3/F11/contactin (Isom et al., 1995), suggested that TN-R might play a role in the dense clustering of channels in the nodal axolemma. Thus, we immunolabeled Na+ channels in cryosectioned optic nerves from 8-d-old to adult mice. We compared the number of Na+ channel aggregates at nodes of Ranvier in TN-R-deficient mice with wild-type mice. This was performed by selecting a random FOV within the immunolabeled tissue sample and then counting the number of stained nodes within that FOV as a function of age. An average of nine FOVs were used per postnatal day. Figure 9A,B shows portions of representative FOVs of cryosectioned optic nerves from adult TN-R-deficient and adult wild-type mice, respectively. On close examination of individual nodes, the Na+ channel immunolabeling was highly focal and was expressed on the surface identically in TN-R-deficient and wild-type mice. Figure 9Csummarizes the data obtained from this comparison. No difference was seen in the number of Na+ channel clusters at nodes of Ranvier at any stage nor in the rate at which these specialized structures formed, suggesting that the TN-R-deficient mouse was able to target correctly and cluster Na+ channels in the absence of TN-R and that internodal distances were also unaffected.
Fig. 9.

Immunohistochemical evaluation of Na+ channel distribution in TN-R-deficient and wild-type mice. Representative regions of Na+channel-immunolabeled optic nerve from TN-R-deficient (A) and wild-type C57BL/6 (B) mice. The region shown is ∼70% of one field of view (FOV). Arrowheads in both A and B point to large fibers with double lines of Na+ channel immunofluorescence characteristic of surface staining at nodes. C, Development of Na+ channel aggregates at nodes of Ranvier in wild-type C57BL/6 and TN-R-deficient mouse optic nerves. The numbers of nodal Na+ channel clusters per FOV in both wild-type (wt) and TN-R-deficient (tn-r−/−) mice matched closely. The number of nodal aggregates reached the final amount at approximately postnatal day 26. Error bars represent ± SD, and curves were drawn by hand to indicate trends. Scale bar, 10 μm.
Optic nerves of TN-R-deficient mice have a reduced conduction velocity
Despite the apparently normal occurrence of focal Na+ channel clusters in the optic nerves of TN-R-deficient mice, functional changes could result from more subtle alterations in nodal channel density, channel gating characteristics, or local electrical cable properties. To investigate the electrophysiological properties of CNS axons in TN-R-deficient mice, we used suction electrodes to measure CAPs from optic nerves. Figure10A shows representative CAPs at 24°C and 37°C. The signals from the knock-out animals appeared to have slower kinetics than those from controls. The time-to-peak for each trace was then measured and converted to a conduction velocity. The average velocity in wild-type mice was nearly two times that of the TN-R-deficient mice at all temperatures measured (Fig. 10C). At 24°C, the conduction velocity of control optic nerves was 3.5 ± 0.28 m/sec (SEM,n = 10) and that of TN-R-deficient optic nerves was 1.8 ± 0.18 m/sec (n = 5). At 37°C, the corresponding velocities were 8.2 ± 0.76 m/sec (n= 9) in wild-type mice and 4.5 ± 0.30 m/sec (n = 5) in TN-R-deficient mice. Significance levels were calculated using the Student’s t test and were as follows: 24°C,p < 0.005; 30°C, p < 0.0005; 37°C, p < 0.005. The length of the TN-R-deficient nerves was 4.50 ± 0.20 mm, and the length of wild-type preparations was 4.44 ± 0.06 mm (SEM). Thus, the length did not vary with the deletion of TN-R and is not likely to be a significant source of error in velocity measurements given the large difference that was observed. The short conduction distance and high velocity, especially at 37°C, made it difficult to separate the CAP from the stimulus artifact. Several controls were performed to insure that the measurement of time-to-peak was accurate. One possible problem is direct stimulation close to the recording electrode. As a test, when the stimulus intensity was raised incrementally from 0 to supramaximal values, no change in the location of the CAP was observed (Fig.10B, top trace). Second, the slowing of conduction velocities was similar at 24° and 37°C, whereas direct stimulation would appear at both temperatures. Finally, records were made before and after addition of 200 nm TTX, and the stimulus artifact in the latter was subsequently subtracted. Randomness of a few microseconds in the timing of the stimulus introduced limitations, but this procedure allowed removal of most of the late phase of the artifact (Fig. 10B, bottom trace). In a control nerve at 37°C (the most stringent condition), the measured velocity was 6.91 m/sec before subtraction and 6.70 m/sec afterward, a change of just 3%. Thus, despite these experimental limitations, the measured differences in conduction properties between tn-r+/+ andtn-r−/− preparations are significant. As a further control, we tested sciatic nerves from TN-R-deficient and wild-type mice, because TN-R is absent from the PNS (Pesheva et al., 1989). The conduction velocities at 24°C in nerves from the wild-type mouse averaged 14.62 ± 1.77 m/sec (n = 2); in the TN-R-deficient mouse they averaged 17.85 ± 2.07 m/sec (n = 2). At 37°C, the velocities were 27.08 ± 0.76 m/sec (n = 2) in the wild-type mouse and 30.08 ± 3.77 m/sec (n = 2) in the TN-R-deficient mouse. In these experiments the TN-R-deficient mouse consistently had a slightly higher conduction velocity, but statistical analysis using a two-tailed Student’s t test revealed that the difference was not significant (p > 0.1). This result confirms the fact that the decrease in speed of action potential propagation seen in the optic nerve was caused by the absence of the CNS-specific TN-R.
Fig. 10.

Determination of conduction velocities of compound action potentials and of nodal Na+ channel aggregates in TN-R-deficient and wild-type mice. A, Representative CAPs from TN-R-deficient (tn-r−/−) and wild-type (wt) C57BL/6 mouse optic nerve suction electrode recordings. Records were taken at both 24° and 37°C. The TN-R-deficient record is noticeably slower than the wild-type record at each temperature. Because the seal resistance varied from nerve to nerve, amplitudes are arbitrary. B, Control experiments were performed to insure that conduction velocities were calculated correctly. The top trace shows a series of CAPs at 37°C from a wild-type optic nerve stimulated from 0 to above the supramaximal value. The bottom trace shows a CAP at 37°C, after the stimulus artifact was subtracted as described in Results. C, The conduction velocity measured in wild-type mouse optic nerves (wt, n= 10) was consistently higher than that seen in TN-R-deficient mice (tn-r−/−, n = 5) at all temperatures measured. Conduction velocity is defined here as the length of the optic nerve used divided by the time to the peak of the action potential from stimulus onset. Significance values were calculated using the Student’s t test and were as follows: 24°C, p < 0.005; 30°C,p < 0.0005; and 37°C, p < 0.005. Error bars represent ±SEM. D, The fluorescence of nodal Na+ channel aggregates in TN-R-deficient (tn-r−/−, n = 94) and wild-type C57BL/6 (wt, n = 103) mouse optic nerves (arbitrary units) as a function of nodal area (μm2). The data were fit using a least-squares algorithm given a y-intercept of 0, i.e., at 0 nodal area there is 0 fluorescence. In the TN-R-deficient mouse, the equation for the line is y = 24773x and in the wild-type mouse y = 24566x. The lines thus virtually overlap.
Na+ channel expression in optic nerves of wild-type and TN-R-deficient mice
One possibility for the difference in conduction velocities between wild-type and TN-R-deficient mice is a difference in the number of Na+ channels at nodes. To investigate this possibility, in side-by-side steps and using the same reagents throughout, cryosections of optic nerves from wild-type and TN-R-deficient mice were labeled for Na+ channel immunoreactivity. Subsequent to labeling, the relative fluorescence intensity of each node (from random FOVs) was measured as a function of nodal area. Figure 10D shows the results for a TN-R-deficient optic nerve and a wild-type optic nerve. Lines through the data are least-squares fits, and when plotted on the same axes the lines for each data set overlapped almost precisely (see Figure caption for additional details). The results thus show that the relative fluorescence intensity was the same, indicating no difference in the number of Na+ channels per unit area at nodes of Ranvier between mutant and wild-type animals. Furthermore, as the data indicate, if the nodal area is doubled, the total relative fluorescence doubles. The decrease in conduction velocity in the TN-R-deficient animals is thus not attributable to a significant difference in Na+ channel density.
DISCUSSION
The TN-R-deficient mice described in this study are surprisingly normal in their gross general behavior and with respect to fertility, body weight, and life span. There is no doubt that the mutation that was introduced abolished expression of TN-R. Southern blot analysis with external and internal tn-r probes showed the hybridization pattern that was expected when homologous recombination took place in the predicted manner replacing the exon encoding the amino terminus of TN-R. Although the mutation does not ablate transcription of the mutated tn-r gene, determination of the sequence of the translation product revealed that it contains an intronic region and lacks further sequences encoded by exons 2 and 3 located downstream of the mutation. A ribosome-binding site, a translation initiation codon, and a signal peptide-encoding sequence preceding an open reading frame are absent, excluding translation of this aberrant RNA into an exported TN-R-related protein. Thus, the mutation resulted in a nonfunctional mRNA generated by an unexpected splicing event. Accordingly, although the aberrant RNA is expressed in the mutant in quantities similar to those of the TN-R mRNA in wild-type mice, neither TN-R nor a truncated form thereof could be detected by Western blot analysis using various polyclonal and monoclonal antibodies at a level of sensitivity sufficient to reveal a 1000-fold reduction of TN-R expression.
The gross anatomy of the brain and spinal cord and the morphology of the retina and cerebellum are also indistinguishable between TN-R-deficient and wild-type mice at the light microscopic level. This could be analyzed in some detail because the mutant mice express a nonfunctional TN-R mRNA, and the localization of cells normally expressing TN-R could thus be studied by in situhybridization. No aberrant location of normally TN-R-positive cells was detected in cerebellum, optic nerve, and retina of TN-R-deficient mice. Therefore, TN-R appears to be dispensable for the migration of these neural cell types and their anatomically correct localization in these areas of the CNS.
TN-R is expressed by oligodendrocytes at times of myelination (Bartsch et al., 1993; Wintergerst et al., 1993) and is highly accumulated at nodes of Ranvier in the optic nerve (ffrench-Constant et al., 1986;Bartsch et al., 1993). The interaction of TN-R with its neuronal receptor F3/F11/contactin decreases fasciculation of cerebellar granule cell neurites in vitro (Xiao et al., 1998), and it has been hypothesized that this defasciculating activity may support the initial ensheathment of axons during myelination (Xiao et al., 1998). The morphological analysis at the ultrastructural level revealed an apparently normal structure and development of myelin sheaths and nodes of Ranvier in the optic nerve of 2- and 8-week-old and 9-month-old TN-R-deficient mice. Furthermore, no morphological indication for degeneration of myelin sheaths or axons was observed. In the optic nerve (Xiao et al., 1997) and white matter of the spinal cord of wild-type mice, TN-R and the chondroitin sulfate proteoglycan phosphacan are colocalized and accumulated at nodes of Ranvier. Remarkably, in the optic nerve and spinal cord of TN-R-deficient mice, phosphacan staining was weak and diffuse, and spots of intense immunoreactivity were absent. Binding of TN-R to a chondroitin sulfate proteoglycan immunologically related to phosphacan has been demonstrated in vitro (Xiao et al., 1997), and phosphacan is a high-affinity ligand to native TN-C and TN-R (Milev et al., 1998). Interestingly, recombinant phosphacan also binds to F3/F11/contactin (Peles et al., 1995), and the minimal binding of native phosphacan to contactin is increased fivefold in the presence of another high-affinity phosphacan ligand, amphoterin (Milev et al., 1998). Therefore, although no morphological alterations of myelin sheaths and nodes of Ranvier could be detected in TN-R-deficient mice, subtle alterations in the localization of extracellular matrix molecules occur in the mutant at this strategically important structure.
Other differences between TN-R-deficient mice and wild-type animals have become apparent in the analysis of the configuration of perineuronal nets associated with a subpopulation of GABAergic interneurons that contain the Ca2+-binding protein parvalbumin. Perineuronal nets of TN-R-deficient mice are significantly less developed compared with wild-type mice. A common cytochemical principle of the perineuronal nets is the accumulation of three classes of substances, hyaluronan, glycoproteins, and proteoglycans, and the high concentration of polyanionic,Nacetylgalactosamine-containing components (Brückner et al., 1993). Chondroitin sulfate seems to be the major component of the net structure, because the perineuronal nets are sensitive to chondroitinase ABC treatment (Fujita et al., 1989; Koppe et al., 1997). The net-like pattern of the perineuronal staining was found to be associated with the neuronal surface (Brückner et al., 1993), and perineuronal nets do not consist of glial processes but rather of a specialized extracellular material interposed between the surface of the inhibitory interneurons and astrocytic processes (Blümcke et al., 1995; Derouiche et al., 1996). The lectinWisteria floribunda, which recognizesN-acetylgalactosamine (Nakagawa et al., 1986a,b, 1987), and the HNK-1 antibody (Kruse et al., 1985) staining, which detects proteoglycans containing sulfated glucuronic acid (Yamamoto et al., 1988; Gowda et al., 1989), are good markers for perineuronal nets. The HNK-1 carbohydrate is also associated with chondroitin sulfate glycosaminoglycans at locations where the neuronal membrane is in close apposition to glial processes (Yamamoto et al., 1988). Parvalbumin staining revealed no differences between the TN-R-deficient and wild-type animals in the morphology of these neurons. However, lectin and HNK-1 antibody staining showed a strong reduction in labeling of the dendrites and an irregularly shaped accumulation of perineuronal components around somata of inhibitory interneurons. Because TN-R is expressed by neurons at times corresponding to the formation and development of perineuronal nets (Fuss et al., 1993; Wintergerst et al., 1993), it will be interesting to investigate the exact role of TN-R in the formation of these nets.
The alterations of the composition of the extracellular matrix at nodes of Ranvier in TN-R-deficient mice are a first indication for a distinct function for TN-R at this site. The accumulation of TN-R at nodes of Ranvier in wild-type mice (Bartsch et al., 1993), as well as the sequence homology between the β2 subunit of the Na+ channel and the TN-C and TN-R binding partner F3/F11/contactin, has led to the suggestion that TN-C or a tenascin-like molecule may be involved in the localization of Na+ channels to nodes of Ranvier (Isom et al., 1995;Srinivasan et al., 1997). However, our immunofluorescence studies clearly indicate that TN-R is not required for proper clustering of Na+ channel or for maintenance and/or stabilization of Na+ channels at nodes. In all aspects during development and in adults, Na+ channel distribution and levels of expression were indistinguishable between wild-type and mutant mice.
On the other hand, subsequent measurement of the conduction properties in TN-R deficient mouse optic nerves revealed a dramatically decreased velocity as compared with controls. Because myelination appears to be normal, the mechanism for this change is likely to involve ion channels. Z. C. Xiao and colleagues (personal communication) have recently tested the interaction of TN-R with cells expressing Na+ channels. They found that recombinant domains of TN-R interact with both α and β2 subunits, and of particular interest, exposure of cells to specific TN-R fragments resulted in an increase in peak Na+currents by a factor of ∼2. If this same modulation occurred in vivo, then we might expect that peak Na+conductance at nodes of Ranvier in TN-R null mutants would be about half that in wild-type animals. We tested to determine whether this could explain the lowered conduction velocity through the use of a computational model that has been successful in replicating numerous results in normal and demyelinated axons (Hines and Shrager, 1991). The model was adapted to mammalian nerve by placing voltage-dependent K+ channels within the region just beyond the paranode and removing them from the nodal gap (Chiu et al., 1979; Wang et al., 1993; Mi et al., 1995; Rasband et al., 1998a,b) and by raising the temperature to 37°C. Morphological parameters were measured from electron micrographs of rat optic nerve axons (Peters et al., 1991). For an axon diameter of 0.88 μm (the average of our fibers), the calculated conduction velocity was 7.4 m/sec. When the nodal maximum Na+ conductance was reduced by a factor of 2, the velocity decreased to 5.7 m/sec. These values are close to those measured experimentally (Fig. 10C) and thus support the idea that the removal of Na+ channel modulation by TN-R is responsible for the result in the null mutant. Alternatively, Figure10D suggests that a population of myelinated axons with larger fiber diameters may contribute to the difference in conduction velocity because there are several instances of nodal areas near 2.5 μm2 in the wild-type mouse and only a single case of a nodal area near 2 μm2 in the TN-R-deficient mouse. Additional morphometric analysis of optic nerve axons will be required to test this possibility. It will also be of interest to determine whether these functional changes also occur in other myelinated tracts of the CNS. If so, then perhaps changes in behavior such as increases in reaction time to sudden visual stimuli or alterations in the speed of reaction in any task requiring appropriate brain functions might be observed with specific tests.
Finally, one has to consider the possibility that lack of TN-R in the mutant mouse might partially be compensated for by molecules that perform functions similar to those of TN-R. Potential candidates are other members of the tenascin family. The expression patterns of identified members of this family show only partial overlap with that of TN-R, but new members of the tenascin family have been identified recently (Weber et al., 1998) and even more may exist. The presence of structurally nonrelated molecules performing similar functions as TN-R might also explain the lack of a severe phenotype of TN-R-deficient mice. However, distinct functions of TN-R in organizing the extracellular matrix at nodes of Ranvier and in perineuronal nets are indicated by our analysis of TN-R-deficient mice. Electrophysiologically, the absence of TN-R causes a decrease in conduction velocity in the optic nerve. Albeit these malfunctions do not result in severe behavioral abnormalities, future analyses of TN-R-deficient mice may provide further insights into the molecular mechanisms underlying the generation and propagation of action potentials and the structural assembly of the extracellular matrix at the node of Ranvier and in perineuronal nets.
Footnotes
This work was supported by the Deutsche Forschungsgemeinschaft and the Swiss Multiple Sclerosis Society (M.S.) and National Institutes of Health (P.S., S.R.L.). We thank Dr. U. Müller for providing the genomic library. We are grateful to Kathrin Mannigel for animal care and Christiane Born and Brigitte Barg-Kues for technical assistance.
Correspondence should be addressed to Professor Melitta Schachner, Zentrum für Molekulare Neurobiologie, Universität Hamburg, Martinistrasse 52, D 20246 Hamburg, Germany
Dr. Weber’s present address: Institut Génétique et de Biologie Moléculaire et Cellulaire, Centre National de la Recherche Scientifique/Institut National de la Santé et de la Recherche Médicale/Université Louis Pasteur, Collège de France, B.P. 163, F 67404 Illkirch-Cedex, France.
Dr. Montag’s present address: Leibniz Institute for Neurobiology, Brenneckestrasse 6, D 39118 Magdeburg, Germany.
REFERENCES
- 1.Abo T, Balch CM. A differentiation antigen of human NK and K cells identified by a monoclonal antibody (HNK-1). J Immunol. 1981;127:1024–1029. [PubMed] [Google Scholar]
- 2.Aspberg A, Binkert C, Ruoslahti E. The versican C-type lectin domain recognizes the adhesion protein tenascin-R. Proc Natl Acad Sci USA. 1995;92:10590–10594. doi: 10.1073/pnas.92.23.10590. [DOI] [PMC free article] [PubMed] [Google Scholar]
- 3.Bartsch U, Bartsch S, Dörries U, Schachner M. Immunohistological localization of tenascin in the developing and lesioned adult mouse optic nerve. Eur J Neurosci. 1992a;4:338–352. doi: 10.1111/j.1460-9568.1992.tb00881.x. [DOI] [PubMed] [Google Scholar]
- 4.Bartsch S, Bartsch U, Dörries U, Faissner A, Weller A, Ekblom P, Schachner M. Expression of tenascin in the developing and adult cerebellar cortex. J Neurosci. 1992b;12:736–749. doi: 10.1523/JNEUROSCI.12-03-00736.1992. [DOI] [PMC free article] [PubMed] [Google Scholar]
- 5.Bartsch U, Pesheva P, Raff M, Schachner M. Expression of janusin (J1–160/180) in the retina and optic nerve of the developing and adult mouse. Glia. 1993;9:57–69. doi: 10.1002/glia.440090108. [DOI] [PubMed] [Google Scholar]
- 6.Blümcke I, Eggli P, Celio MR. Relationship between astrocytic processes and perineuronal nets in rat neocortex. Glia. 1995;15:131–140. doi: 10.1002/glia.440150205. [DOI] [PubMed] [Google Scholar]
- 7.Bristow J, Kian Tee M, Gitelmann SE, Mellon SH, Miller WL. Tenascin-X: a novel extracellular matrix protein encoded by the human XB gene overlapping P450c21B. J Cell Biol. 1993;122:265–278. doi: 10.1083/jcb.122.1.265. [DOI] [PMC free article] [PubMed] [Google Scholar]
- 8.Brückner G, Brauer K, Härtig W, Wolff JR, Rickmann MJ, Derouiche A, Delpech B, Girad N, Oertel WH, Reichenbach A. Perineuronal nets provide a polyanionic glia-associated form of microenvironment around certain neurons in many parts of the rat brain. Glia. 1993;8:183–200. doi: 10.1002/glia.440080306. [DOI] [PubMed] [Google Scholar]
- 9.Brückner G, Seeger G, Brauer K, Härtig W, Kacza J, Bigl V. Cortical areas are revealed by distribution patterns of proteoglycan components and parvalbumin in the mongolian gerbil and rat. Brain Res. 1994;658:67–86. doi: 10.1016/s0006-8993(09)90012-9. [DOI] [PubMed] [Google Scholar]
- 10.Brümmendorf T, Wolff JM, Frank R, Rathjen FG. Neural cell adhesion molecule F11, homology with fibronectin type III and immunoglobulin type C domains. Neuron. 1989;2:1351–1361. doi: 10.1016/0896-6273(89)90073-1. [DOI] [PubMed] [Google Scholar]
- 11.Brümmendorf T, Hubert M, Treubert U, Leuschner R, Tárnok A, Rathjen FG. The axonal recognition molecule F11 is a multifunctional protein: specific domains mediate interactions with Ng-CAM and restrictin. Neuron. 1993;10:711–727. doi: 10.1016/0896-6273(93)90172-n. [DOI] [PubMed] [Google Scholar]
- 12.Burch GH, Gong Y, Liu W, Dettman RW, Curry CJ, Smith L, Miller WL, Bristow J. Tenascin-X deficiency is associated with Ehlers-Danlos syndrome. Nat Genet. 1997;17:104–108. doi: 10.1038/ng0997-104. [DOI] [PubMed] [Google Scholar]
- 13.Celio MR, Blümcke I. Perineuronal nets: a specialized form of extracellular matrix in the adult nervous system. Brain Res Rev. 1994;19:128–145. doi: 10.1016/0165-0173(94)90006-x. [DOI] [PubMed] [Google Scholar]
- 14.Cervello M, Matrange V, Durbec P, Rougon G, Gomez S. The GPI-anchored adhesion molecule F3 induces tyrosine phosphorylation: involvement of the FNIII repeats. J Cell Sci. 1996;109:699–704. doi: 10.1242/jcs.109.3.699. [DOI] [PubMed] [Google Scholar]
- 15.Chalot CL, Ziomek CA, Bavister BD, Lewis JL, Torres I. An improved culture medium supports development of random bred 1-cell mouse embryos in vitro. J Reprod Fertil. 1989;86:679–688. doi: 10.1530/jrf.0.0860679. [DOI] [PubMed] [Google Scholar]
- 16.Chan SY, Evans MJ. In situ freezing of embryonic stem cells in multiwell plates. Trends Genet. 1991;7:76. doi: 10.1016/0168-9525(91)90274-T. [DOI] [PubMed] [Google Scholar]
- 17.Chiquet-Ehrismann R, Hagios C, Matsumoto K. The tenascin gene family. Perspect Dev Neurobiol. 1994;2:3–7. [PubMed] [Google Scholar]
- 18.Chiu SY, Ritchie JM, Rogart RB, Stagg D. A quantitative description of membrane currents in rabbit myelinated nerve. J Physiol (Lond) 1979;292:149–166. doi: 10.1113/jphysiol.1979.sp012843. [DOI] [PMC free article] [PubMed] [Google Scholar]
- 19.Cifuentes-Diaz C, Velasco E, Meunier FA, Goudou D, Belkadi L, Faille F, Murawsky M, Angaut-Petit D, Molgo J, Schachner M, Saga Y, Aizawa S, Rieger F. The peripheral nerve and the neuromuscular junction are affected in the tenascin-C-deficient mouse. Cell Mol Biol. 1998;44:357–379. [PubMed] [Google Scholar]
- 20.Derouiche A, Härtig W, Brauer K, Brückner G. Spatial relationship of lectin-labeled extracellular matrix and glutamine synthetase-immunoreactive astrocytes in rat cortical forebrain regions. J Anat. 1996;189:363–372. [PMC free article] [PubMed] [Google Scholar]
- 21.Dörries U, Bartsch U, Nolte C, Roth J, Schachner M. Adaptation of a non-radioactive in situ hybridization method to electron microscopy: detection of tenascin messenger RNAs in mouse cerebellum with digoxygenin-labeled probes and gold-labeled antibodies. Histochemistry. 1993;99:251–262. doi: 10.1007/BF00269143. [DOI] [PubMed] [Google Scholar]
- 22.Erickson HP. Evolution of the tenascin family: implications for the function of the C-terminal fibrinogen-like domain. Perspect Dev Neurobiol. 1994;2:9–19. doi: 10.1080/0907676x.1994.9961218. [DOI] [PubMed] [Google Scholar]
- 23.Faivre-Sarrailh C, Gennarini C, Goridis C, Rougon G. F3/F11 cell surface molecule expression in the developing mouse cerebellum is polarized at synaptic sites and within granule cells. J Neurosci. 1992;12:257–267. doi: 10.1523/JNEUROSCI.12-01-00257.1992. [DOI] [PMC free article] [PubMed] [Google Scholar]
- 24.Feinberg AP, Vogelstein B. A technique for radiolabeling DNA restriction endonuclease fragments to high specific activity. Anal Biochem. 1983;132:6–13. doi: 10.1016/0003-2697(83)90418-9. [DOI] [PubMed] [Google Scholar]
- 25.ffrench-Constant C, Miller RH, Kruse J, Schachner M, Raff MC. Molecular specialization of astrocyte processes at nodes of Ranvier in rat optic nerve. J Cell Biol. 1986;102:844–852. doi: 10.1083/jcb.102.3.844. [DOI] [PMC free article] [PubMed] [Google Scholar]
- 26.Forsberg E, Hirsch E, Frohlich L, Meyer M, Ekblom P, Aszodi A, Werner S, Faessler R. Skin wounds and severed nerves heal normally in mice lacking tenascin-C. Proc Natl Acad Sci USA. 1996;93:6594–6599. doi: 10.1073/pnas.93.13.6594. [DOI] [PMC free article] [PubMed] [Google Scholar]
- 27.Franklin KBJ, Paxinos G. The mouse brain in stereotactic coordinates. Academic; New York: 1997. [Google Scholar]
- 28.Fujita SC, Tada Y, Murakami F, Hayashi M, Matsumura M. Glycosaminoglycan-related epitopes surrounding different subsets of mammalian central neurons. J Neurosci Res. 1989;7:117–130. doi: 10.1016/0168-0102(89)90052-7. [DOI] [PubMed] [Google Scholar]
- 29.Fukamauchi F, Kusakabe M. Preprotachykinin A and cholecystokinin mRNAs in tenascin-gene knockout mouse brain. Neuropeptides. 1997;31:199–201. doi: 10.1016/s0143-4179(97)90090-1. [DOI] [PubMed] [Google Scholar]
- 30.Fukamauchi F, Mataga N, Wang YJ, Sato S, Yoshiki A, Kusakabe M. Abnormal behaviour and neurotransmissions of tenascin gene knockout mouse. Biochem Biophys Res Commun. 1996;221:151–156. doi: 10.1006/bbrc.1996.0561. [DOI] [PubMed] [Google Scholar]
- 31.Fukamauchi F, Mataga N, Wang YJ, Sato S, Yoshiki A, Kusakabe M. Tyrosine hydroxylase activity and its mRNA level in dopaminergic neurons of tenascin gene knockout mouse. Biochem Biophys Res Commun. 1997;231:356–359. doi: 10.1006/bbrc.1997.6101. [DOI] [PubMed] [Google Scholar]
- 32.Fuss B, Pott U, Fischer P, Schwab ME, Schachner M. Identification of a cDNA clone specific for the oligodendrocyte-derived repulsive extracellular matrix molecule J1–160/180. J Neurosci Res. 1991;29:299–307. doi: 10.1002/jnr.490290305. [DOI] [PubMed] [Google Scholar]
- 33.Fuss B, Wintergerst ES, Bartsch U, Schachner M. Molecular characterization and in situ messenger RNA localization of the neural recognition molecule J1–160/180: a modular structure similar to tenascin. J Cell Biol. 1993;120:1237–1249. doi: 10.1083/jcb.120.5.1237. [DOI] [PMC free article] [PubMed] [Google Scholar]
- 34.Gennarini G, Cibelli G, Rougon G, Mattei MG, Goridis C. The mouse neuronal cell surface glycoprotein F3: a phosphatidylinositol-anchored member of the immunoglobulin superfamily related to chicken contactin. J Cell Biol. 1989;109:775–788. doi: 10.1083/jcb.109.2.775. [DOI] [PMC free article] [PubMed] [Google Scholar]
- 35.Gowda DC, Margolis RU, Margolis RK. Presence of the HNK-1 epitope on poly (N-acetyllactosaminyl) oligosaccharides and identification of multiple core proteins in the chondroitin sulfate proteoglycans of the brain. Biochemistry. 1989;28:4468–4474. doi: 10.1021/bi00436a052. [DOI] [PubMed] [Google Scholar]
- 36.Hagios C, Koch M, Spring J, Chiquet M, Chiquet-Ehrismann R. Tenascin-Y: a protein of novel domain structure is secreted by differentiated fibroblasts of muscle connective tissue. J Cell Biol. 1996;134:1499–1512. doi: 10.1083/jcb.134.6.1499. [DOI] [PMC free article] [PubMed] [Google Scholar]
- 37.Hall H, Liu L, Schachner M, Schmitz B. The L2/HNK-1 carbohydrate mediates adhesion of neural cells to laminin. Eur J Neurosci. 1993;5:3442. doi: 10.1111/j.1460-9568.1993.tb00202.x. [DOI] [PubMed] [Google Scholar]
- 38.Hall H, Vorherr T, Schachner M. Characterization of a 21 amino acid peptide sequence of the laminin G2 domain that is involved in HNK-1 carbohydrate binding and cell adhesion. Glycobiology. 1995;5:435–441. doi: 10.1093/glycob/5.4.435. [DOI] [PubMed] [Google Scholar]
- 39.Härtig W, Brauer K, Brückner G. Wisteria floribunda agglutinin-labeled nets surround parvalbumin-containing neurons. NeuroReport. 1992;3:869–872. doi: 10.1097/00001756-199210000-00012. [DOI] [PubMed] [Google Scholar]
- 40.Härtig W, Brauer K, Bigl V, Brückner G. Chondroitin sulfate proteoglycan-immunoreactivity of lectin-labeled perineuronal nets around parvalbumin-containing neurons. Brain Res. 1994;635:307–311. doi: 10.1016/0006-8993(94)91452-4. [DOI] [PubMed] [Google Scholar]
- 41.Hines M, Shrager P. A computational test of the requirements for conduction in demyelinated axons. Restor Neurol Neurosci. 1991;3:81–93. doi: 10.3233/RNN-1991-3205. [DOI] [PubMed] [Google Scholar]
- 42.Hogan B, Beddington R, Costantini R, Lacy E. Manipulating the mouse embryo: a laboratory manual. Cold Spring Harbor Laboratory; Cold Spring Harbor, New York: 1986. [Google Scholar]
- 43.Hooper M, Hardy K, Handsyde A, Hunter S, Monk M. HPRT-deficient (Lesch-Nyhan) mouse embryos derived from germline colonization by cultured cells. Nature. 1987;326:292–295. doi: 10.1038/326292a0. [DOI] [PubMed] [Google Scholar]
- 44.Isom LL, Ragsdale DS, De Jongh KS, Westenbroek RE, Reber BFX, Scheuer T, Catterall WA. Structure and function of the β2 subunit of brain sodium channels, a transmembrane glycoprotein with a CAM motif. Cell. 1995;83:433–442. doi: 10.1016/0092-8674(95)90121-3. [DOI] [PubMed] [Google Scholar]
- 45.Koppe G, Brückner G, Hartig W, Delpech B, Bigl V. Characterization of proteoglycan-containing perineuronal nets by enzymatic treatments of rat brain sections. J Histochem Cytochem. 1997;29:11–20. doi: 10.1023/a:1026408716522. [DOI] [PubMed] [Google Scholar]
- 46.Kruse J, Keilhauer G, Faissner A, Timpl R, Schachner M. The J1 glycoprotein: a novel nervous system cell adhesion molecule of the L2/HNK-1 family. Nature. 1985;316:146–148. doi: 10.1038/316146a0. [DOI] [PubMed] [Google Scholar]
- 47.Laemmli UK. Cleavage of structural proteins during the assembly of the head of bacteriophage T4. Nature. 1970;227:680–685. doi: 10.1038/227680a0. [DOI] [PubMed] [Google Scholar]
- 48.Lochter A, Schachner M. Tenascin and extracellular matrix glycoproteins: from promotion to polarization of neurite outgrowth in vitro. J Neurosci. 1993;13:3986–4000. doi: 10.1523/JNEUROSCI.13-09-03986.1993. [DOI] [PMC free article] [PubMed] [Google Scholar]
- 49.Lochter A, Taylor J, Fuss B, Schachner M. The extracellular matrix molecule janusin regulates neuronal morphology in a substrate- and culture time-dependent manner. Eur J Neurosci. 1994;6:597–606. doi: 10.1111/j.1460-9568.1994.tb00304.x. [DOI] [PubMed] [Google Scholar]
- 50.Lüth HJ, Fischer J, Celio MR. Soybean lectin binding neurons in the visual cortex of the rat contain parvalbumin and are covered by glial nets. J Neurocytol. 1992;21:211–221. doi: 10.1007/BF01194979. [DOI] [PubMed] [Google Scholar]
- 51.Mansour SL, Thomas KR, Capecchi MR. Disruption of the proto-oncogene int-2 in mouse embryo-derived stem cells: a general strategy for targeting mutations to non-selectable genes. Nature. 1988;336:348–352. doi: 10.1038/336348a0. [DOI] [PubMed] [Google Scholar]
- 52.Margolis RK, Rauch U, Maurel P, Margolis RU. Neurocan and phosphacan, two major nervous tissue-specific chondroitin sulfate proteoglycans. Perspect Dev Neurobiol. 1996;3:273–290. [PubMed] [Google Scholar]
- 53.McMahon AP, Bradley A. The Wnt-1 (int) proto-oncogene is required for the development of a large region of the mouse brain. Cell. 1990;62:1073–1085. doi: 10.1016/0092-8674(90)90385-r. [DOI] [PubMed] [Google Scholar]
- 54.Mi H, Deerinck TJ, Ellisman MH, Schwarz TL. Differential distribution of closely related potassium channels in rat Schwann cells. J Neurosci. 1995;15:3761–3774. doi: 10.1523/JNEUROSCI.15-05-03761.1995. [DOI] [PMC free article] [PubMed] [Google Scholar]
- 55.Milev P, Friedlander DR, Sakurai T, Karthikeyan L, Flad M, Margolis RK, Grumet M, Margolis RU. Interactions of the chondroitin sulfate proteoglycan phosphacan, the extracellular domain of a receptor-type protein tyrosine phosphatase, with neurons, glia, and neural cell adhesion molecules. J Cell Biol. 1994;127:1703–1715. doi: 10.1083/jcb.127.6.1703. [DOI] [PMC free article] [PubMed] [Google Scholar]
- 56.Milev P, Chiba A, Häring M, Rauvala H, Schachner M, Ranscht B, Margolis RK, Margolis RU. High affinity binding and overlapping localization of neurocan and phosphacan/protein tyrosine phosphatase-zeta/beta with tenascin-R, amphoterin, and the heparin-binding growth-associated molecule. J Biol Chem. 1998;273:6998–7005. doi: 10.1074/jbc.273.12.6998. [DOI] [PubMed] [Google Scholar]
- 57.Mitrovic N, Schachner M. Detection of tenascin-C in the nervous system of the tenascin C-mutant mouse. J Neurosci Res. 1995;42:710–717. doi: 10.1002/jnr.490420514. [DOI] [PubMed] [Google Scholar]
- 58.Montag D, Giese KP, Bartsch U, Martini R, Lang Y, Blüthmann H, Karthigasan J, Kirschner DA, Wintergerst ES, Nave KA, Zielasek J, Toyka KV, Lipp HP, Schachner M. Mice deficient for the myelin-associated glycoprotein show subtle abnormalities in myelin. Neuron. 1994;13:229–246. doi: 10.1016/0896-6273(94)90472-3. [DOI] [PubMed] [Google Scholar]
- 59.Morganti MC, Taylor J, Pesheva P, Schachner M. Oligodendrocyte-derived J1–160/180 extracellular matrix glycoproteins are adhesive or repulsive depending on the partner cell type and time of interaction. Exp Neurol. 1990;109:98–110. doi: 10.1016/s0014-4886(05)80012-3. [DOI] [PubMed] [Google Scholar]
- 60.Moscoso LM, Cremer H, Sanes JR. Organization and reorganization of neuromuscular junctions in mice lacking neural cell adhesion molecule, tenascin-C, or fibroblast growth factor-5. J Neurosci. 1998;18:1465–1477. doi: 10.1523/JNEUROSCI.18-04-01465.1998. [DOI] [PMC free article] [PubMed] [Google Scholar]
- 61.Müller U, Christina N, Li ZW, Wolfer DP, Lipp HP, Rüllicke T, Brandener S, Aguzzi A, Weissmann C. Behavioral and anatomical deficits in mice homozygous for a modified beta-amyloid precursor protein gene. Cell. 1994;79:755–765. doi: 10.1016/0092-8674(94)90066-3. [DOI] [PubMed] [Google Scholar]
- 62.Nakagawa F, Schulte BA, Spicer SS. Selective cytochemical demonstration of glycoconjugate-containing terminal N-acetylgalactosamine on some brain neurons. J Comp Neurol. 1986a;243:280–290. doi: 10.1002/cne.902430210. [DOI] [PubMed] [Google Scholar]
- 63.Nakagawa F, Schulte BA, Wu JY, Spicer SS. GABAergic neurons of the rodent brain correspond partially with those staining for glycoconjugate with N-acetylgalactosamine. J Neurocytol. 1986b;15:389–396. doi: 10.1007/BF01611440. [DOI] [PubMed] [Google Scholar]
- 64.Nakagawa F, Schulte BA, Wu JY, Spicer SS. Postnatal appearance of glycoconjugate with terminal N-acetylgalactosamine on the surface of selected neurons in mouse brain. Dev Neurosci. 1987;9:53–60. doi: 10.1159/000111608. [DOI] [PubMed] [Google Scholar]
- 65.Nörenberg U, Wille H, Wolff JM, Frank R, Rathjen FG. The chicken neural extracellular matrix molecule restrictin: similarity with EGF-, fibronectin type III-, and fibrinogen-like motifs. Neuron. 1992;8:849–863. doi: 10.1016/0896-6273(92)90199-n. [DOI] [PubMed] [Google Scholar]
- 66.Olive S, Dubois C, Schachner M, Rougon G. The F3 neuronal glycosylphosphatidylinositol-linked molecule is localized to glycolipid-enriched membrane subdomains and interacts with L1 and fyn kinase in cerebellum. J Neurochem. 1995;65:2307–2317. doi: 10.1046/j.1471-4159.1995.65052307.x. [DOI] [PubMed] [Google Scholar]
- 67.Peles E, Nativ M, Campbell PL, Sakurai T, Martinez R, Lev S, Clary DO, Schilling J, Barnea G, Plowman GD, Grumet M, Schlessinger J. The carbonic anhydrase domain of receptor tyrosine phosphatase beta is a functional ligand for the axonal cell recognition molecule contactin. Cell. 1995;82:251–260. doi: 10.1016/0092-8674(95)90312-7. [DOI] [PubMed] [Google Scholar]
- 68.Pesheva P, Spiess E, Schachner M. J1–160 and J1–180 are oligodendrocyte-secreted nonpermissive substrates for cell adhesion. J Cell Biol. 1989;109:1765–1778. doi: 10.1083/jcb.109.4.1765. [DOI] [PMC free article] [PubMed] [Google Scholar]
- 69.Pesheva P, Gennarini G, Goridis C, Schachner M. The F3/11 cell adhesion molecule mediates the repulsion of neurons by the extracellular matrix glycoprotein J1–160/180. Neuron. 1993;10:69–82. doi: 10.1016/0896-6273(93)90243-k. [DOI] [PubMed] [Google Scholar]
- 70.Pesheva P, Gloor S, Schachner M, Probstmeier R. Tenascin-R is an intrinsic autocrine factor for oligodendrocyte differentiation and promotes cell adhesion by sulfatide-mediated mechanism. J Neurosci. 1997;17:4642–4651. doi: 10.1523/JNEUROSCI.17-12-04642.1997. [DOI] [PMC free article] [PubMed] [Google Scholar]
- 71.Peters A, Palay SL, Webster HD. The fine structure of the nervous system, p 235. Oxford; New York: 1991. [Google Scholar]
- 72.Poltorak M, Sadoul R, Keilhauer G, Landa C, Fahrig T, Schachner M. Myelin-associated glycoprotein, a member of the L2/HNK-1 family of neural cell adhesion molecules, is involved in neuron-oligodendrocyte and oligodendrocyte-oligodendrocyte interaction. J Cell Biol. 1987;105:1893–1899. doi: 10.1083/jcb.105.4.1893. [DOI] [PMC free article] [PubMed] [Google Scholar]
- 73.Ramirez-Solis R, Rivera-Perez J, Wallace JD, Wims M, Zheng H, Bradley A. Genomic DNA microextraction: a method to screen numerous samples. Anal Biochem. 1992;201:331–335. doi: 10.1016/0003-2697(92)90347-a. [DOI] [PubMed] [Google Scholar]
- 74.Rasband MN, Trimmer JS, Levinson SR, Shrager P. Clustering of Na+ and K+ channels during development of myelinated central nervous system axons. Soc Neurosci Abstr. 1998a;24:830. [Google Scholar]
- 75.Rasband MN, Trimmer JS, Schwarz TL, Levinson SR, Ellisman MH, Schachner M, Shrager P. Potassium channel redistribution, clustering, and function in remyelinating rat axons. J Neurosci. 1998b;18:36–47. doi: 10.1523/JNEUROSCI.18-01-00036.1998. [DOI] [PMC free article] [PubMed] [Google Scholar]
- 76.Saga Y, Yagi T, Ikawa Y, Sakakura T, Aizawa S. Mice develop normally without tenascin. Genes Dev. 1992;6:1821–1831. doi: 10.1101/gad.6.10.1821. [DOI] [PubMed] [Google Scholar]
- 77.Schachner M, Taylor J, Bartsch U, Pesheva P. The perplexing multifunctionality of janusin, a tenascin-related molecule. Perspect Dev Neurobiol. 1994;2:33–41. [PubMed] [Google Scholar]
- 78.Seeger G, Brauer K, Härtig W, Brückner G. Mapping of perineuronal nets in the rat brain stained by colloidal iron hydroxide histochemistry and lectin cytochemistry. Neuroscience. 1994;58:371–388. doi: 10.1016/0306-4522(94)90044-2. [DOI] [PubMed] [Google Scholar]
- 79.Settles DL, Kusakabe M, Steindler DA, Fillmore H, Erickson HP. Tenascin-C knockout mouse has no detectable tenascin-C protein. J Neurosci Res. 1997;47:109–117. [PubMed] [Google Scholar]
- 80.Soriano P, Montgomery C, Geske R, Bradley A. Targeted disruption of the c-scr proto-oncogene leads to osteopetrosis in mice. Cell. 1991;64:693–702. doi: 10.1016/0092-8674(91)90499-o. [DOI] [PubMed] [Google Scholar]
- 81.Srinivasan J, Laeng P, Schachner M, Catterall WA. Interaction between neuronal voltage gated sodium channels and the extracellular matrix protein tenascin. Soc Neurosci Abstr. 1997;23:909. [Google Scholar]
- 82.Stys PK, Ransom BR, Waxman SG. Compound action potential of nerve recorded by suction electrode: a theoretical and experimental analysis. Brain Res. 1991;546:18–32. doi: 10.1016/0006-8993(91)91154-s. [DOI] [PubMed] [Google Scholar]
- 83.Taylor J, Pesheva P, Schachner M. Influence of janusin and tenascin on growth cone behaviour in vitro. J Neurosci Res. 1993;35:347–362. doi: 10.1002/jnr.490350402. [DOI] [PubMed] [Google Scholar]
- 84.Tongiorgi E, Bernhardt RR, Zinn K, Schachner M. Tenascin-C mRNA is expressed in cranial neural crest cells, in some placodal derivatives, and in discrete domains of the embryonic zebrafish brain. J Neurobiol. 1995;28:391–407. doi: 10.1002/neu.480280311. [DOI] [PubMed] [Google Scholar]
- 85.Towbin H, Staehelin T, Gordon J. Electrophoretic transfer of proteins from polyacrylamide gels to nitrocellulose sheets: procedure and some applications. Proc Natl Acad Sci USA. 1979;76:4350–4354. doi: 10.1073/pnas.76.9.4350. [DOI] [PMC free article] [PubMed] [Google Scholar]
- 86.Wang H, Kunkel DD, Martin TM, Schwartzkroin PA, Tempel BL. Heteromultimeric K+ channels in terminal and juxtaparanodal regions of neurons. Nature. 1993;365:75–79. doi: 10.1038/365075a0. [DOI] [PubMed] [Google Scholar]
- 87.Weber P, Montag D, Schachner M, Bernhardt RR. Zebrafish tenascin-W, a new member of the tenascin family. J Neurobiol. 1998;35:1–16. [PubMed] [Google Scholar]
- 88.Wintergerst ES, Fuss B, Bartsch U. Localization of janusin mRNA in the central nervous system of the developing and adult mouse. Eur J Neurosci. 1993;5:299–310. doi: 10.1111/j.1460-9568.1993.tb00497.x. [DOI] [PubMed] [Google Scholar]
- 89.Xiao ZC, Taylor J, Montag D, Rougon G, Schachner M. Distinct functions of recombinant tenascin-R domains on neuronal cell adhesion, growth cone guidance, neuronal polarity, and interaction with the neuronal immunoglobulin superfamily adhesion molecule F3/11. Eur J Neurosci. 1996;8:766–782. doi: 10.1111/j.1460-9568.1996.tb01262.x. [DOI] [PubMed] [Google Scholar]
- 90.Xiao ZC, Bartsch U, Margolis RK, Margolis RU, Rougon G, Montag D, Schachner M. Isolation of a tenascin-R receptor from mouse brain membranes: a phosphacan-related chondroitin sulfate glycoproteoglycan. J Biol Chem. 1997;272:32092–32101. doi: 10.1074/jbc.272.51.32092. [DOI] [PubMed] [Google Scholar]
- 91.Xiao ZC, Revest JM, Laeng P, Rougon G, Schachner M, Montag D. Defasciculation of neurites is mediated by tenascin-R and its neuronal receptor F3/11. J Neurosci Res. 1998;52:390–404. doi: 10.1002/(SICI)1097-4547(19980515)52:4<390::AID-JNR3>3.0.CO;2-4. [DOI] [PubMed] [Google Scholar]
- 92.Yamamoto M, Marshall P, Hemmendinger LM, Boyer AB, Caviness VS. Distribution of glucuronic acid-and-sulfate-containing glycoproteins in the central nervous system of the adult mouse. J Neurosci Res. 1988;5:273–298. doi: 10.1016/0168-0102(88)90031-4. [DOI] [PubMed] [Google Scholar]
- 93.Yanish-Perron C, Vieira J, Messing J. Improved M13 phage cloning vectors and host strains: nucleotide sequences of the M13mp18 and pUC19 vectors. Gene. 1985;33:103–119. doi: 10.1016/0378-1119(85)90120-9. [DOI] [PubMed] [Google Scholar]
- 94.Zisch AH, D’Alessandri L, Amrein K, Ranscht B, Winterhalter K, Vaughan L. The glypiated neuronal cell adhesion molecule contactin/F11 complexes with src-family protein tyrosine kinase Fyn. Mol Cell Neurosci. 1995;6:263–279. doi: 10.1006/mcne.1995.1021. [DOI] [PubMed] [Google Scholar]