

Abstract
The role of actin filaments in synaptic function has been studied in the CA1 region of the rat hippocampal slice. Bath application (2 hr) of the actin polymerization inhibitor latrunculin B did not substantially affect the shape of dendrites or spines. However, this and other drugs that affect actin did affect synaptic function. Bath-applied latrunculin B reduced the synaptic response. Several lines of evidence indicate that a component of this effect is presynaptic. To specifically test for a postsynaptic role for actin, latrunculin B or phalloidin, an actin filament stabilizer, was perfused into the postsynaptic neuron. The magnitude of long-term potentiation (LTP) was decreased at times when baseline transmission was not yet affected. Longer applications produced a decrease in baseline AMPA receptor (AMPAR)-mediated transmission. The magnitude of the NMDA receptor-mediated transmission was unaffected, indicating a specific effect on the AMPAR. These results suggest that postsynaptic actin filaments are involved in a dynamic process required to maintain AMPAR-mediated transmission and to enhance it during LTP.
Keywords: actin filament, latrunculin B, cytochalasin D, phalloidin, LTP, CA1, hippocampus, AMPAR, NMDAR
Actin is one of the major cytoskeletal proteins. In neurons, the existence of actin filaments in both the presynaptic terminals and postsynaptic spines has been well documented (Kelly and Cotman, 1978; Fifkova and Delay, 1982; Matus et al., 1982; Cumming and Burgoyne, 1983; Drenckhahn and Kaiser, 1983;Cohen et al., 1985; Landis, 1988; Kaech et al., 1997; Fisher et al., 1998). In the presynaptic terminal, actin filaments interact with synaptic vesicles in a process that involves synapsins (Greengard et al., 1993; Sudhof, 1995; Calakos and Scheller, 1996). Postsynaptic dendritic spines contain a much higher concentration of actin than dendrites (Matus et al., 1982; Cohen et al., 1985; Fifkova, 1985). Actin filaments directly contact the postsynaptic density (PSD) and vesicular structures (Gulley and Reese, 1981; Fifkova and Delay, 1982;Matus et al., 1982; Markham and Fifkova, 1986).
Several studies suggest that there may be a functional role of postsynaptic actin filaments in the synaptic function. Stabilization of actin filament blocks the use-dependent rundown of NMDA receptor (NMDAR) current evoked by extracellular NMDA application (Rosenmund and Westbrook, 1993). α-Actinin 2, an actin binding protein, interacts directly with the NR1A/1C/2B subunits of NMDAR (Wyszynski et al., 1997;Allison et al., 1998). The mechanosensitivity of the NMDAR also indirectly suggests the interaction of NMDAR with cytoskeletal structures (Paoletti and Ascher, 1994). Actin also plays an important role in the clustering of AMPA receptor (AMPAR) and NMDAR channels (Allison et al., 1998). Finally, recent work demonstrates that spines undergo continuous submicrometer movements that are dependent on actin (Fisher et al., 1998).
There have also been suggestions that actin filaments may play a role in long-term potentiation (LTP). An increase in actin filament bundles was observed after tetanus-induced LTP in the diffuse cytoskeletal meshwork that connects the dendritic cytoplasm to the spine matrix (Pavlik and Moshkov, 1992). There are indications that LTP produces a segmentation of PSDs into independent regions (Geinisman et al., 1991), and it has been suggested that this and other morphological changes in spines may be actin-dependent (Fifkova and Morales, 1992; Edwards, 1995). Recently, it has been shown that LTP requires a postsynaptic membrane fusion process (Lledo et al., 1998), a process that might depend on actin.
These results suggest that actin may play a dynamic role in synaptic function, but the physiological role of actin in synaptic transmission and LTP has not been previously investigated. We have examined the effects of the actin polymerization inhibitors (APIs) latrunculin B and cytochalasin D (Spector et al., 1983, 1989) and the actin filament stabilizer phalloidin (Cooper, 1987) on synaptic physiology in the CA1 region of the rat hippocampal slice. Our results indicate a requirement for presynaptic and postsynaptic actin function in basal synaptic transmission and synaptic plasticity.
MATERIALS AND METHODS
Hippocampal slices (400 μm) were prepared from 2- to 3-week-old Long–Evans rats as described previously (Otmakhov et al., 1997). In brief, slices were allowed to recover for a minimum of 2 hr on the surface of cell culture inserts in an incubation chamber to which humidified oxygen was continuously supplied (95% O2–5% CO2) and then transferred to a submerged type recording chamber with continuous flow (2.3 ml/min) of oxygenated artificial CSF (ACSF) at 35°C. The ACSF for recording contained (in mm): NaCl 124, NaHCO3 26, NaH2PO4 1.25, KCl 2.5, CaCl2 4, MgSO4 4, d-glucose 20, and picrotoxin 0.05, pH 7.3. Whole-cell recording pipette was filled with (in mm): Cs-methanesulfonate 130, CsCl 20, HEPES 10, MgATP 1, Na3GTP 0.4, EGTA 0.2, and phosphocreatine 15, pH 7.3 (with osmolarity at 300 mOsm). In the phalloidin experiment, 2 mm MgATP was used. In NMDAR-mediated field EPSP (fEPSP) measurement, 0.1 mm Mg2+ and 10 μm CNQX were used in ACSF. In whole-cell NMDAR-mediated EPSC measurement, 2.5 mm Ca2+, 1.3 mmMg2+, and 10 μm CNQX were in ACSF.
In both field and whole-cell experiments, two synaptic pathways were stimulated alternately. One pathway served as the control path and the other as the test path. Stimulation of Schaffer–commissural afferents was performed using two glass electrodes filed with ACSF. The independence of two synaptic pathways was tested by a paired-pulse protocol. Paired-pulse facilitation (PPF) of EPSPs and EPSCs was observed only when two consecutive pulses with an interval 50 msec were applied to the same path. When two consecutive pulses were applied to different pathways, no facilitation was observed. In field recording experiments, the stimulus interval was 1 min. Traces were filtered at 1 kHz. Both the slope and the amplitude of the fEPSP were measured to quantify the magnitude of fEPSP responses. The time window for the slope measurement was 1 msec starting 0.2 msec after the time of minimum voltage between the fiber volley and the fEPSP. This window corresponded to ∼4–65% of the peak-to-peak amplitude of the fEPSP. The slope was calculated by a linear regression method. In the figures, slope measurements are shown, but analysis based on peak amplitude gave the same result. Fiber volley amplitude was measured to monitor axon excitability. Fiber volley was measured as a separation between the peak of fiber volley and the line connecting the beginning and end of the fiber volley. LTP was induced by a 100 Hz theta-burst protocol: 100 Hz, five pulses per burst; 10 bursts at 200 msec intervals. A 25 Hz theta-burst protocol was used for some experiments: 25 Hz, five pulses per burst; 10 bursts at 120 msec interval. During induction, no stimuli were delivered to the control path. After the theta burst, there was a 2 min delay before the first fEPSP response.
In whole-cell experiments, cells were held at −65 mV using an Axopatch 1D (Axon Instruments, Foster City, CA) amplifier. Stimulus interval was 6 sec. Series resistance (5–12 MΩ) and input resistance (70–200 MΩ) were monitored every 6 sec by measuring the peak and steady-state currents in response to 2 mV, 30 msec hyperpolarizing steps. Holding current was also monitored throughout the experiment. For monitoring the stability of the slice responsiveness, the amplitude of fEPSP was recorded simultaneously while measuring the amplitude of EPSC. Data were filtered at 1 kHz. Whole-cell LTP was induced by pairing: 2 Hz, 200 pulses during depolarization to 0 mV. Changing of the internal pipette solution was done as described previously (Otmakhov et al., 1997). Experiments with ≥13 MΩ series resistance were discarded. Responses were averaged at 1 (field) or 2 (whole-cell) min intervals and then normalized to the average of baseline recording before either LTP induction or drug application. The magnitude of LTP was measured as a percentage of LTP path response over that of non-LTP path response at a given time. In miniature EPSC (mEPSC) experiments, 8 mmSr2+ was used instead of 4 mmCa2+ in ACSF, and data were acquired as described byOliet et al. (1996). In brief, after the EPSC amplitude reached a steady level in the presence of Sr2+, each pathway was stimulated alternatively five times (every 30 sec) at 2 Hz for 10 sec. mEPSCs were picked by considering their peak amplitude (approximately >3.5 pA) and duration at half peak amplitude. mEPSC amplitude was measured as difference of average value (4 msec) between the peak and the baseline before the mEPSC. After collecting control data, latrunculin B was applied for 30 min before data collection.
All data acquisition and analysis were done by custom software written in Axobasic 3.1 (Axon Instruments). Mean ± SEM was used for representing average values. Error bars in graphs indicate SEM. When average data were plotted, measurements were normalized to the average of baseline responses unless stated otherwise. In mEPSC frequency analysis, single-factor ANOVA was used. In assessing the significance of effect on LTP of drugs and on mEPSC amplitude, a Kolmogorov–Smirnov (K–S) test was used as described previously (Cohen et al., 1992). Latrunculin B, cytochalasin D, and phalloidin were purchased from Calbiochem (La Jolla, CA). The data were compiled in Microsoft (Seattle, WA) Excel and plotted using Microcal Origin (Microcal Software Inc., Northhampton, MA).
For confocal microscopy (MRC 600; Bio-Rad, Hercules, CA), the COMOS program (Bio-Rad) was used in acquiring pictures, and the Adobe Systems (San Jose, CA) Photoshop program was used to print pictures. DiI (Molecular Probes, Eugene, OR) was used to label the neuronal membrane. DiI was dissolved at saturation level in a commercial vegetable oil. A drop of DiI was applied onto the soma of CA1 pyramidal neurons through pipette. A syringe was used to generate the pressure for dropping DiI. Imaging was done on CA1 pyramidal cells in the slice to which ACSF was perfused continuously. Pictures were taken at 30 min intervals.
RESULTS
Bath-applied APIs reduce the fEPSP
The effect of APIs on synaptic transmission was first studied by recording fEPSPs in the dendritic region of CA1 rat hippocampal slices (Fig. 1). These responses were quantified by measuring the slope of the early rising phase, which is almost exclusively a result of the AMPAR-mediated synaptic transmission (Collingridge et al., 1983; Wigstrom and Gustafsson, 1986). After 30 min of monitoring basal synaptic responses, 2 μm latrunculin B (dissolved in 0.1% DMSO) was applied. It slowly reduced the fEPSP. After 80 min, the fEPSP was reduced by 41% compared with the initial level (n = 7). As a control, ACSF containing 0.1% DMSO was applied; the fEPSP dropped by only 9% (n = 10). This was comparable with the decline we observed without application of any drug. Compared with the effect of DMSO control, latrunculin B thus produced a reduction of the fEPSP of 35%. Another API, cytochalasin D, produced similar effects on basal synaptic transmission after 80 min application. The reduction of the fEPSP compared with the DMSO control was 31% for 5 μm(n = 7) and 37% for 10 μm(n = 4) cytochalasin D. This effect of APIs began ∼10 min after application and continued to increase throughout the application. We were able to obtain some slow reversal of the effect after washout of APIs, but this was never complete within 1 hr (see Fig. 4A). The reduction of fEPSP by APIs was not caused by a drop in axonal excitability because the amplitude of the fiber volley, which was measured simultaneously, was not significantly affected (n = 7; t test;p > 0.05) (Fig. 1B). To determine whether the effect of latrunculin B requires synaptic stimulation, we turned off stimulation for 80 min during the application period (100 min). The results showed that the API effect still occurred under these conditions (n = 3; data not shown).
Fig. 1.

Bath-applied latrunculin B and cytochalasin D decrease fEPSP in CA1 region of hippocampal slice. A, Actin polymerization inhibitors latrunculin B (2 μm;n = 7) or cytochalasin D (5 μm;n = 7; 10 μm; n = 4) were applied extracellularly dissolved in 0.1% DMSO. Control solution contained 0.1% DMSO (n = 10). Thebar indicates the period of drug application. The average fEPSP in the DMSO controls, 2 μm latrunculin B, and 5 μm and 10 μm cytochalasin D experiments, measured at 70–80 min after its application, were 91, 59, 63, and 57% of the baseline, respectively. The small rise at time 0 occurred because LTP was induced in a different pathway.Inset, Examples of average traces before (thin line, 1) and after 2 μm latrunculin B application (thick line,2). Calibration: 2.5 mV, 25 msec. B, Effect of bath-applied APIs on fiber volley amplitude. The same symbols were used as in A. The effect on the amplitude of fiber volley of 0.1% DMSO ACSF (n = 7), 2 μm latrunculin B (n = 7), and cytochalasin D (5 μm; n = 7; 10 μm; n = 4) were indistinguishable, indicating no effect of APIs on presynaptic excitability.
Fig. 4.

Bath-applied latrunculin B and cytochalasin D inhibit LTP induction. In each experiment, after 80 min of drug application, the stimulus strength was increased to produce the same level of fEPSP slope before drug application. A, LTP induction was significantly inhibited by APIs. Arrowindicates the time when the theta-burst stimulus was given. Gray bar indicates the period of the application of drug.a, LTP was induced by a theta burst in 0.1% DMSO (n = 9; filled rectangles). The magnitudes of average fEPSP of LTP and non-LTP pathways measured 50 min after LTP induction was 139 and 87% of the baseline, which gave 160% of potentiation relative to fEPSP of non-LTP path (open rectangles). b, latrunculin B (2 μm) significantly inhibited LTP (n = 8; filled circles). The average fEPSPs of LTP and non-LTP path at 50 min after induction were 104 and 92% of the baseline, which gave 113% potentiation compared with the fEPSP of non-LTP path (open circles). c, Cytochalasin D also inhibited LTP induction. Cytochalasin D at 5 (rectangles; n = 7) and 10 (triangles; n = 4) μmwere tested. The average fEPSPs of LTP (filled) and non-LTP path (open) at 50 min after induction were 111 and 101% of the baseline, which gave 110% relative potentiation in 10 μm cytochalasin D experiment. The relative potentiation at 50 min after LTP induction in 5 μmcytochalasin D experiment was 116%. d, Cumulative distribution of the ratio of LTP path EPSP over non-LTP path EPSP from individual experiments, measured at 45–50 min after LTP induction. Open circles are for DMSO control experiments (n = 9), filled circles are for latrunculin B experiments (n = 5), andtriangles and rectangles are for 5 (n = 7) and 10 (n = 4) μm cytochalasin D, respectively. The shift of the distribution produced by APIs suggests that LTP induction was reduced significantly (K–S test; Q ≪ 0.01). B, Latrunculin did not strongly affect the temporal pattern of vesicle release during 25 Hz theta-burst induction protocol. The slope of each fEPSP during theta burst was normalized to that of first fEPSP of the first burst. a, 1st (thin line) and 10th (thick line) burst average traces from control experiment. Calibration: 5 mV, 200 msec. b, The measurement of slope of fEPSPs during theta burst without latrunculin B (n = 4).c, Example traces of1st (thin line) and 10th(thick line) burst under 2 μm latrunculin B application. These traces are from the same slice as those shown in a. Calibration: 5 mV, 200 msec.d, The measurement of slope of fEPSPs during theta burst with 2 μm latrunculin B (n = 4).
A possible explanation of the effect of APIs is that they produce a structural collapse of dendritic spines because actin filaments are important structural components of spines (Markham and Fifkova, 1986). To explore this possibility, pyramidal cells in the CA1 region of the hippocampal slice were labeled with DiI (see Materials and Methods). Spine and dendritic morphology was visualized in a confocal microscope before and after application of 4 μm latrunculin B (n = 3). Two hours of application did not abolish postsynaptic spines or produce any obvious change in the shape of dendrites (Fig.2A,B). Specifically, of 16 spines (on three dendrites in three different slices) identified before drug application, 15 were clearly visible after drug application and did not show any sign of structural collapse. This stability of spine shape is consistent with other published work. Allison et al. (1998) observed that the actin network within postsynaptic spines of cultured hippocampal neurons was not affected by 2 hr incubation with 5 μm latrunculin A or 24 hr incubation with 20 μm cytochalasin D. Similarly,Fisher et al. (1998) showed that ongoing submicrometer movements of actin filaments within spines are abolished by cytochalasin D or latrunculin B, but the overall structure of the actin network is unaffected.
Fig. 2.
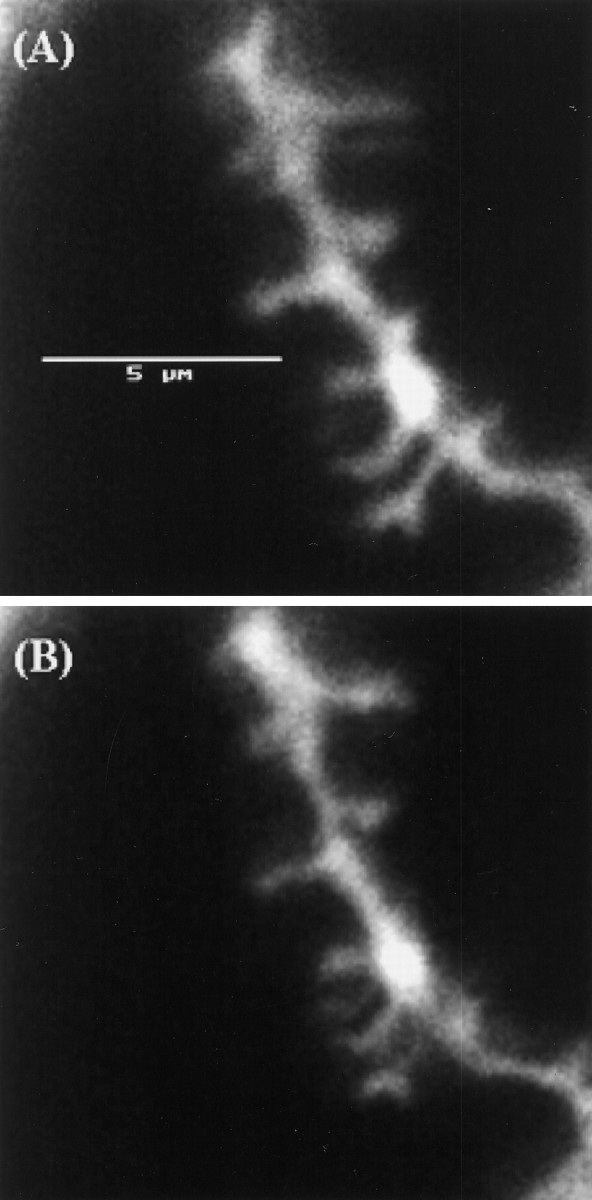
Bath-applied latrunculin B does not abolish postsynaptic spines or dendrites. Confocal image of dendrite of CA1 pyramidal neuron labeled with DiI. Before (A) and after (B) 2 hr application of 4 μmlatrunculin B. Scale bar, 5 μm.
There is a presynaptic locus for the effect of bath-applied APIs on basal synaptic transmission
Several lines of investigation were undertaken to determine whether bath-applied APIs worked presynaptically or postsynaptically. The measurements in Figure 1 indicate that APIs affected the AMPAR-mediated synaptic transmission. If bath-applied APIs affected transmitter release, the NMDAR-mediated synaptic transmission should also be affected. To test this possibility, the area of the NMDAR-mediated fEPSP was measured in 0.1 mmMg2+ and 10 μm CNQX, a blocker of AMPARs (Fig. 3A). Latrunculin B (2 μm) decreased the NMDAR-mediated fEPSP by 40% in 80 min. In interleaved DMSO control experiments, the NMDAR-mediated fEPSP dropped by 9%. The reduction caused by latrunculin B was therefore 35%. This figure is similar to that of the AMPAR-mediated fEPSP (35%; see above). These results would be most simply explained by a reduction in transmitter release but do not rule out a postsynaptic site of action.
Fig. 3.

Experiments indicating that there is a presynaptic site of action of bath-applied latrunculin B. A, The NMDAR-mediated synaptic transmission was also reduced by latrunculin B. The area of the NMDAR-mediated fEPSP was measured with ACSF containing 0.1 mm Mg2+ in which 10 μmCNQX was used to block AMPAR-mediated synaptic transmission. Thebar indicates the period of drug application. Latrunculin B (2 μm) was applied 10 min after baseline recording (n = 6). As a control, 0.1% DMSO ACSF was used (n = 3). Inset, Average fEPSP before (thin trace, 1) and after (thick trace, 2) latrunculin B application. The spiking always appeared at this stimulation condition (0.1 mm Mg2+, 2.5 mmCa2+, 2.5 mm KCl, and 50 μm picrotoxin in ACSF, and without CA3 region in slice) and was blocked by APV (data not shown; Bortolotto and Collingridge, 1998). Calibration: 2 mV, 100 msec. B, Paired-pulse facilitation quantified by the ratio of the initial slopes of two fEPSPs at 50 msec interval. The bar indicates the duration of drug application. Latrunculin B (2 μm) was applied for 50 min after 20 min of baseline recording (n = 7). The average PPF ratios at 5–10 min after washout of DMSO control, 0.3 μm CNQX, and latrunculin B experiments were 1.07 ± 0.009, 1.06 ± 0.02, and 1.25 ± 0.03 (mean ± SE), respectively. Inset a, Examples of average responses before (thin line,1) and after (thick line,2) 2 μm latrunculin B application.Inset b, Before (thin line,1) and after (thick line,2) 0.3 μm CNQX application. Calibration: 3.5 mV, 90 msec. C, Effects of postsynaptically applied latrunculin B on PPF as measured using whole-cell recording. Thebar indicates the duration of drug application to the postsynaptic cell. Latrunculin B (100 μm) was applied after 10 min of baseline recording (n = 7). As a control, 0.2% DMSO internal solution (n = 4) was applied. The effect of latrunculin B on PPF was not significantly different from that of DMSO control 50 min after drug application (t test; p ≫ 0.05).Inset, Two example average traces before (thin line, 1) and after (thick line, 2) 100 μm latrunculin B application. Calibration: 800 pA, 120 msec. D, Effect of bath-applied 4 μm latrunculin B on evoked mEPSCs. a, An evoked EPSC trace is shown. The arrow indicates when the stimulus was given. The period marked by the gray bar was used for analysis (asterisk indicates mEPSCs). One hundred traces were acquired for each experiment. Calibration: 100 pA, 500 msec. A higher concentration of latrunculin B than in Figure 1 was used to speed the onset of the effect. b, Latrunculin B significantly reduced mEPSC frequency by 36%. c, Cumulative distribution of mEPSC amplitude. Latrunculin B reduced the average mEPSC amplitude by 9%. Amplitude was normalized to 50% of cumulative percentage in the control condition.
A second approach was to measure PPF, a classical method for locating the site of drug action (Creager et al., 1980; Charlton et al., 1982;Hess et al., 1987). The PPF ratio of two responses at 50 msec interval was measured. Latrunculin B (2 μm) significantly increased the average PPF measured 56–65 min after application (n = 7; t test; p ≪ 0.01) (Fig.3B). This effect was not seen in the 0.1% DMSO control (n = 4). As an independent control, 0.3 μm CNQX, which reduced the slope of fEPSP by 38% through a postsynaptic action, did not significantly affect PPF (n = 4; t test; p ≫ 0.05 at 56–65 min). The fact that latrunculin B increased PPF but decreased the synaptic response is characteristic of agents that reduce presynaptic release. Consistent with this, we found that intracellular application of 100 μm latrunculin B into the postsynaptic cell through a patch electrode (whole-cell recording; see Materials and Methods) produced a small decline of the synaptic response but did not affect PPF (Fig. 3C). These results therefore indicate that latrunculin B reduces the synaptic response, at least in part, through a presynaptic effect.
As an additional approach to localizing the site of action of bath-applied latrunculin B, we measured the frequency and amplitude of mEPSCs using the whole-cell recording method (Fig. 3D). Sr2+ (instead of Ca2+) was included in the ACSF to produce evoked asynchronous mEPSCs (Miledi, 1966; Goda and Stevens, 1994; Oliet et al., 1996). Thirty minute application of 4 μm latrunculin B significantly decreased the frequency of mEPSCs from 11.70 ± 0.19 to 7.45 ± 0.79, i.e., by 36% (n = 4; ANOVA;p < 0.03) (Fig. 3Db). A change in mini-frequency is usually indicative of a presynaptic site of action. We also found that the average amplitude of mEPSCs was reduced by 9% from 6.05 ± 0.11 to 5.51 ± 0.15 pA (Fig. 3Dc). This small decrease was significant (K–S test; Q ≪ 0.01). The large reduction of mEPSC frequency and the change in PPF suggest that the primary effect of bath-applied latrunculin B (at early times after application) is presynaptic. The results presented later show more clearly that latrunculin B also affects postsynaptic processes.
LTP induction is inhibited by actin polymerization inhibitors
To investigate the effect of bath-applied APIs on LTP, we applied APIs for 90 min before LTP induction. The fEPSP decreased gradually, as shown in Figure 1A. After 80 min of application, stimulus strength was increased to bring the fEPSP to its original level, and 10 min later, LTP was induced using a theta-burst protocol (10 bursts of 100 Hz, five pulses every 200 msec). Washout was done 10 min after LTP induction. This produced a small recovery of the fEPSP. Figure 4A compares the LTP induced under control conditions (0.1% DMSO; average of five experiments) (Fig. 4Aa) with effects of the same theta-burst stimulation done in the presence of either 2 μm latrunculin B (average of eight experiments) (Fig.4Ab) or 5 or 10 μm cytochalasin D (average of seven and four experiments, respectively) (Fig.4Ac). In each case, the response of the LTP pathway is compared with the response from a non-LTP pathway recorded simultaneously. The figure shows a large and obvious reduction in the magnitude of both the initial and maintained LTP. Figure4Aa shows that the non-LTP pathway in DMSO had a small and slow decline (13%/hr). This is comparable with that observed in other experiments without DMSO (11%/hr; n = 6; data not shown). Because of this small drift, it is most accurate to quantify the magnitude of LTP by the ratio of the size of average fEPSP in the LTP pathway compared with that in the non-LTP pathway. The potentiation of LTP path at 50 min after induction was 160% in control and 113% in latrunculin B. Figure4Ad shows the cumulative distribution of ratio of LTP over non-LTP path fEPSPs at 46 min after LTP induction.
One possible explanation of the reduction in LTP in API was the interruption of vesicle release or depletion of a releasable vesicle pool during theta-burst stimulation. To explore this possibility, we measured the fEPSPs for each synaptic response during LTP induction. To resolve individual responses, we used a 25 Hz theta burst rather than a 100 Hz theta burst. In control experiments, we found that the 25 Hz protocol could induce LTP and that 2 μm latrunculin B inhibited it (n = 4; data not shown). Figure4B shows the slope of the synaptic response for each stimulus in a burst, for bursts given several times during the induction. It can be seen that latrunculin B did not cause a substantial rundown of transmission during a theta burst. The sum of all fEPSP slopes during the theta burst was decreased only 6% in the presence of latrunculin B relative to that in its absence (Fig. 4Bc,Bd). There was thus no dramatic rundown of transmission during LTP induction that could explain the reduced LTP magnitude.
The results with bath-applied APIs suggest that LTP induction is inhibited because of an action of APIs on postsynaptic actin. To more specifically study postsynaptic effects, latrunculin B was applied postsynaptically through the patch electrode several minutes after the onset of whole-cell recording. In previous experiments (Otmakhov et al., 1997), it was shown that dye applied in this way can take over 30 min to achieve equilibrium concentration in the distal dendrites. It is not possible to wait for such equilibration before inducing LTP because of problems with LTP “washout.” Thus, when LTP was induced 18 min after application of latrunculin B, its concentration in the dendrites must have been considerably lower than that in the internal solution. LTP was induced by the pairing protocol described in Materials and Methods. Figure5 shows an example of a control experiment (0.1% DMSO applied by internal perfusion) and an example in which 200 μm latrunculin B in 0.1% DMSO was perfused. Fig. 6, A and B, shows summary data for all such experiments (80–100 μm), and Figure 6C shows the cumulative distribution of the LTP pathway relative to the non-LTP pathway at 30 min after LTP induction. Several conclusions can be drawn from these results. First, the magnitude of the initial potentiation (2 min after pairing) was reduced by latrunculin B by 42% (t test;p < 0.05). This reduction occurred at a time when there was little, if any, change in baseline transmission. This indicates an effect on plasticity that cannot be attributed to any generalized reduction in synaptic transmission. Second, within 40–60 min after application of latrunculin B, baseline transmission fell. At 50 min, the reduction was 40%. This is considerably larger than the 17% reduction in the DMSO control. This indicates that latrunculin B produces a decrease in baseline transmission that develops slowly with time. The third conclusion has to do with the magnitude of LTP measured at 50 min after induction. Although the potentiation is clearly smaller in latrunculin B than in controls, one might ask whether this is simply because of the smaller initial LTP and a subsequent decay similar to that which occurs in the non-LTP pathway (40% over 50 min). If the initial potentiation observed in latrunculin B (207%) decays at this rate, the expected final level of potentiation is 124%, close to the observed value (133%). We conclude that latrunculin B reduces potentiation by 42% and that, on a longer time scale, transmission in both LTP and non-LTP pathways decays in a proportional way. Latrunculin B produced little effect on membrane resistance during these experiments (<5% decay; data not shown).
Fig. 5.

Representative experiments in which effects on LTP induction of postsynaptic DMSO or latrunculin B were measured.Gray bar indicates the period of internal perfusion of latrunculin B or DMSO through perfusion pipette. Hatched box indicates the period of pairing. A, An experiment in which 0.1% DMSO internal solution was applied for 18 min, and LTP was then induced by pairing. Inset, Averagetraces for 10 min before (thin line,1) and after (thick line,2) pairing. Calibration: 400 pA, 60 msec. Top panel shows the measurement of series resistance for the recording. Middle panel shows the magnitude of EPSC as a function of time. Bottom panel shows the ratio of amplitude of LTP over non-LTP path synaptic responses. Each point is the average of 20 traces. B, An experiment in which 200 μm latrunculin B (in 0.1% DMSO) was applied postsynaptically. Eighteen minutes later, LTP was induced by pairing.Inset, Average trace 10 min before (thin line, 1) and after (thick line, 2) pairing. Calibration: 250 pA, 60 msec.
Fig. 6.

Postsynaptically applied latrunculin B reduces pairing-induced LTP without affecting NMDAR-mediated EPSC. Gray bar indicates the period of internal perfusion of latrunculin B or DMSO through perfusion pipette. Arrow indicates the pairing. A, In control, ≤0.4% DMSO was applied starting 2 min after the initiation of whole-cell recording (n = 26). Eighteen minutes later, LTP was induced by pairing in one pathway (filled rectangles). The initial average potentiation measured at 2 min after induction was 283% of the baseline. The average EPSCs of LTP path and non-LTP path (open rectangles) at 30 min after pairing were 267 and 85%, respectively. B, Postsynaptic latrunculin B reduced pairing-induced LTP. Latrunculin B (100 μm;n = 16; 80 μm; n= 2) in DMSO (total, n = 18) was internally applied 2 min after whole-cell recording, and then pairing was applied 18 min later. The initial average potentiation measured at 2 min after induction was 207% of the baseline (filled circles). The average EPSCs (n = 18) in the LTP path and in the non-LTP path (open circles) at 30 min after pairing were 156 and 69% of the baseline, respectively (those values with 100 μmlatrunculin B were 150 and 68%; those with 80 μm were 194 and 101%). C, Cumulative distribution of the ratio of EPSC in LTP path over that in non-LTP path from individual experiments, measured 30 min (asterisk in A and B) after LTP induction. Open circles are for DMSO control experiments (n = 26), and filled circles are for latrunculin B experiments (n = 18). The shift of distribution by postsynaptic latrunculin B indicates that LTP induction measured at this time is reduced significantly (K–S test; Q ≪ 0.01).D, NMDAR-mediated EPSC was not significantly changed by postsynaptic latrunculin B. The bath solution contained 10 μm CNQX and 1.3 mm Mg2+. Latrunculin B (100 μm; n = 10; 80 μm; n = 5) was internally perfused starting 6 min after whole-cell recording (total, n= 17). The average EPSC (n = 17) at 40 min after latrunculin B application was 96% (that with 100 μm was 97%; that with 80 μm was 94%). As a control, ≤0.2% DMSO internal solution was perfused (n = 23).Inset, Representative average traces of NMDAR EPSC 8 min before (thin line, 1) and after (thick line, 2) 80 μmlatrunculin B application. Calibration: 60 pA, 90 msec.
Because interaction of postsynaptic actin filaments with NMDARs has been suggested (Rosenmund and Westbrook, 1993; Wyszynski et al., 1997) and because of the requirements of the NMDAR activation for LTP induction, it was important to test whether postsynaptic application of latrunculin B affected the NMDAR current. The results (Fig. 6D) show that latrunculin B (80–100 μm) did not affect the NMDAR component of synaptic transmission isolated by 10 μm CNQX and 1.3 mm Mg2+.
The actin filament stabilizer phalloidin inhibits basal AMPAR-mediated synaptic transmission and the induction and maintenance of LTP
It was of interest to determine whether the postsynaptic effects of interfering with actin could be observed using drugs that affect actin filaments in a very different way. We therefore perfused the actin filament stabilizer phalloidin into the postsynaptic cell. Because this drug is membrane impermeable, any effect of postsynaptic application is unambiguously postsynaptic. When 100 μm phalloidin (0.1% DMSO) was perfused for 50 min, the basal synaptic responses decreased by 51% (n = 20) (Fig. 7A). DMSO alone produced a 23% reduction of EPSC. Therefore, phalloidin produces a 36% drop of the basal EPSC relative to the DMSO control (t test;p < 0.05). This effect began ∼15 min after the onset of perfusion, built up for 20 min, and then saturated. Phalloidin had little or no effect on membrane resistance (Figs.8B,9B).
Fig. 7.

Postsynaptically applied phalloidin reduces the AMPAR-mediated EPSC but does not affect the NMDAR-mediated EPSC.Gray bar indicates the period of internal perfusion of phalloidin or DMSO. A, Effect of 100 μmphalloidin (in 0.1% DMSO; n = 20) on basal AMPAR-mediated synaptic transmission compared with that with 0.1% DMSO alone (n = 14). Results are the average of the number of experiments (n). Drug was applied 10 min after initiation of whole-cell recording. Holding voltage, −65 mV.Insets a and b show the example averagetraces for 10 min before (1) and 50 min after (2) phalloidin or DMSO alone application, respectively. B, Effect of 100 μm phalloidin (in 0.1% DMSO; n = 24) on the NMDAR-mediated EPSC compared with that with 0.1% DMSO alone (n = 18). Membrane potential was held at −50 to −65 mV (adjusted in each experiment to give ∼70 pA response). Drug was applied 10 min after initiation of whole-cell recording. Application (50 min) of phalloidin did not significantly reduce the NMDAR-mediated EPSC amplitude compared with that with DMSO alone (t test; p ≫ 0.05). Insets a and b show the example averagetraces for 10 min before (1) and after (2) phalloidin or DMSO alone application, respectively. Calibration: 70 pA, 150 msec. C, Effect of phalloidin on AMPAR- and NMDAR-mediated EPSCs. The effect of phalloidin was measured as the ratio of the average EPSC with phalloidin application over that with DMSO alone. Thin trace shows the ratio for the NMDAR-mediated EPSC measurements shown inB. Thick broken trace shows the ratio for the AMPAR-mediated EPSC measurements shown in A.
Fig. 8.

Postsynaptically applied phalloidin reduces the LTP induced by pairing. Gray bar indicates the period of internal perfusion of phalloidin or DMSO, and thick arrow indicates pairing. Error bars indicate SEM.A, In controls, 0.1% DMSO was perfused 2 min after the initiation of whole-cell recording (n = 8), and LTP was induced 18 min later. The initial average potentiation measured 4 min after induction was 243% to the baseline (filled rectangles). The average EPSCs in the LTP path and in the non-LTP path (open rectangles) measured at 50 min after induction were 278 and 104% to the baseline, respectively.B, Phalloidin (100 μm) was internally applied 2 min after the initiation of whole-cell recording (n = 7), and LTP was induced by pairing 18 min later. The initial average potentiation measured at 4 min after induction was 178% of the baseline (filled circles). The average EPSCs in the LTP path and in the non-LTP path (open circles) measured at 50 min after induction were 99 and 46% of the baseline, respectively. Bottom traces show the input resistance and the series resistance as a function of time, respectively. C, Cumulative distribution of the ratio of EPSC in the LTP path over that in the non-LTP path at 30 min (asterisks in Band C) after LTP induction. The distribution in phalloidin (filled circles; n= 5) is significantly shifted from that in control DMSO experiment (open circles; n = 8), indicating a significant reduction of LTP at 30 min after induction caused by phalloidin (K–S test; Q ≪ 0.01).
Fig. 9.

Postsynaptically applied phalloidin reduces the maintenance of pairing-induced LTP. Gray bar indicates the period of internal perfusion of phalloidin or DMSO, andthick arrow indicates pairing. Error bars indicate SEM.A, In control (n = 8), 0.1% DMSO was applied 2 min after LTP induction by pairing (filled rectangles). The average EPSCs in the LTP and in the non-LTP pathway (open rectangles) measured 2 min after pairing were 330 and 81% of the baseline. The average EPSCs in the LTP path and in the non-LTP path measured at 50 min after induction were 407 and 114% of the baseline, which gave 357% of relative potentiation.B, Phalloidin (100 μm) was perfused 2 min after pairing (n = 9). The average EPSCs in the LTP path (filled circles) and in the non-LTP path (open circles) measured at 2 min after induction were 311 and 74% of the baseline. The average EPSCs in the LTP path and in the non-LTP path measured at 50 min after induction were 134 and 49% of the baseline, which gave 273% of relative potentiation. Therefore, phalloidin application reduced the potentiation of LTP by 33% at 50 min after induction. Bottom panelshows the input resistance as a function of time. C, Ratio of average EPSC in the LTP path over that in the non-LTP path as a function of time. The ratio was normalized to the ratio at 2 min after induction. The larger decay in the ratio was produced by phalloidin (filled circles; n= 9; from B) compared with that with DMSO control (open circles; n = 8; fromA), which indicates a more selective effect of phalloidin on LTP maintenance. Cumulative distribution of the ratio of EPSC in the LTP path to that in the non-LTP path measured at 30 min after LTP induction (asterisks inA and B). The ratio from phalloidin experiment (filled circles; n= 8) was significantly shifted from that from control DMSO experiment (open circles; n = 8), indicating a significant reduction in LTP at 30 min after induction by postsynaptic phalloidin (K–S test; Q ≪ 0.01).
An important question is whether phalloidin also affects the NMDAR conductance or whether its effect is specific for the AMPAR conductance. Figure 7B shows that the effect of phalloidin (0.1% DMSO) on the isolated NMDAR EPSC is small and comparable with that which occurs in DMSO alone. The ratio of the average NMDAR EPSC in phalloidin to that in the DMSO control is thus close to 1 over the duration of the experiments (Fig. 7C). In contrast, the ratio for AMPAR EPSC is reduced, indicating a specific effect on this component.
To investigate the effects on LTP induction, 100 μmphalloidin was applied postsynaptically for 18 min, and a pairing stimulus was then given. Under control condition (0.1% DMSO), the initial potentiation (4 min after pairing) was 243% (n= 8) (Fig. 8A). In phalloidin, the initial potentiation was much smaller (178%), i.e., a 45% drop of potentiation (n = 7; t test;p < 0.05) (Fig. 8B). Figure8C shows the cumulative distribution of results. Over the next 50 min, the non-LTP pathway decayed by 54%. This decay was not caused by general deterioration of the cell because the membrane resistance during this period decreased <10% (Fig.8B). If the LTP pathway decayed at the same rate as the non-LTP path, the potentiation at 50 min would be 96%, in good agreement with the observed value (99%). Thus, as with latrunculin B, the effect of phalloidin can be understood as a drop in the initial potentiation, followed by a proportional decay of both non-LTP and LTP pathways.
In the next series of experiments (Fig. 9), we tested whether the maintenance of LTP could be affected by phalloidin. First, LTP was induced, and 2 min later phalloidin was internally applied. Over the next 30 min there was a decay in both the LTP and non-LTP pathway followed by little further decrease (Fig. 9B). During this decay, there was no change in membrane resistance (Fig. 9B). Phalloidin caused a drop in the LTP pathway over time that was somewhat larger than in the non-LTP pathway (Fig. 9C). Figure9D shows the distribution of individual experiments.
DISCUSSION
Because of the high concentration of actin in spines and presynaptic terminals and the close association of actin with the postsynaptic density and ion channels, it has been suspected that actin might play a functional role in synaptic transmission and synaptic plasticity (Fifkova and Morales, 1992; Pavlik and Moshkov, 1992;Edwards, 1995). In this paper, we provide the first functional evidence that actin plays an important role in both presynaptic and postsynaptic processes that contribute to basal synaptic transmission. Perhaps the most surprising finding is that postsynaptic actin is required to maintain AMPAR-mediated synaptic transmission but not NMDAR-mediated synaptic transmission. Our results further show that LTP is reduced by interfering with actin, even at times when basal synaptic transmission is not yet affected.
Because actin is so important as a structural protein, there is the concern that the effects of agents that interfere with actin filaments might be a result of nonspecific effects or of gross changes in cell morphology. However, nonspecific effects cannot account for our data because LTP was reduced at a time when baseline transmission was unaffected (Figs. 6B, 8B). Furthermore, with longer applications of latrunculin B or shorter applications of phalloidin, baseline synaptic transmission was affected, but membrane resistance (Figs. 8B,9B) and NMDAR-mediated transmission (Figs.6D, 7B) were not. The effects were thus not a result of a nonspecific decline of cell function. It also appears unlikely that the effects were caused by gross structural change. We examined cell structure in the case of latrunculin B. Although our results cannot exclude small morphological changes, there was certainly no indication of any gross change; spines and dendrites remained clearly identifiable after treatment with latrunculin B (Fig. 2). This is consistent with work from several other laboratories showing that APIs do not strongly affect spine shape on the time scale of a few hours (Allison et al., 1998; Fisher et al., 1998). An additional argument against the involvement of gross structural effects is that latrunculin B, which should depolymerize actin filament, and phalloidin, which should stabilize actin filament and not lead to morphological change, have similar effects on synaptic processes. We conclude that the drugs are not interfering with a static structural process but rather with a dynamic process required for maintaining and potentiating synapses (see below for specific possibilities).
Presynaptic role of actin in basal synaptic transmission
We have found that bath-applied APIs (cytochalasin D and latrunculin B) reduce synaptic transmission in part by acting at a presynaptic site. Both the AMPAR and NMDAR components of the response were reduced nearly to the same extent at early times after bath application (Figs. 1A, 3A), consistent with a presynaptic site of action. Furthermore, bath-applied latrunculin B enhanced paired-pulse facilitation, an enhancement that is typically associated with perturbations that reduce the probability of transmitter release (Creager et al., 1980; Charlton et al., 1982;Hess et al., 1987) (Fig. 3B). Direct evidence that latrunculin B does not affect PPF through postsynaptic action was its failure to affect PPF when applied postsynaptically through a patch electrode (Fig. 3C). Similarly, postsynaptically applied phalloidin did not affect PPF (n = 8; data not shown). We furthermore found that bath-applied latrunculin B produced a large reduction in the frequency of miniature synaptic responses but produced, at most, a small reduction in the amplitude of miniature synaptic responses (30–40 min after API application) (Fig.3D). Together, these results indicate that bath-applied latrunculin B can act at a presynaptic site to reduce basal synaptic transmission.
One possible mechanism of these effects relates to presynaptic Ca2+ channels. It has been shown that actin depolymerization can attenuate Ca2+ entry through calcium channels (Furukawa et al., 1995) and speed the rundown of calcium channels (Johnson and Byerly, 1993). Such effects could account for the decreased transmission and enhancement of PPF that we have observed.
Postsynaptic role of actin in basal synaptic transmission and LTP
Our results with postsynaptically applied actin function inhibitors indicate that there is also a postsynaptic role for actin in maintaining basal synaptic transmission. Postsynaptically applied phalloidin produced a large (∼40%) reduction in synaptic transmission after 30 min (Figs. 7A, 8B,9B). Latrunculin B also reduced transmission, but the effect developed more slowly. These results suggest that basal AMPAR-mediated synaptic transmission is dependent on an actin-mediated process. In contrast, neither postsynaptic application of latrunculin B nor phalloidin affected NMDAR-mediated transmission. Our results with phalloidin are consistent with previous work showing that phalloidin does not inhibit the NMDAR current and in fact prevents its use-dependent rundown (Rosenmund and Westbrook, 1993).
Our result showing that basal AMPAR-mediated synaptic transmission and LTP can be selectively inhibited by interfering with actin function has intriguing similarities to recent work showing that postsynaptic application of a peptide that interferes with the interaction ofN-ethylmaleimide-sensitive factor (NSF) and glutamate receptor subtype 2 produces a decline in basal synaptic transmission within ∼30 min, comparable with the time course we find with actin inhibitors (Nishimune et al., 1998; Song et al., 1998). Furthermore, just as with the NSF inhibitory peptide, the actin inhibitors induce a decline in transmission, which is not complete and appears to plateau at a level of ∼50% (Figs. 7A,8B, 9B). One possible explanation is that there are two components of AMPAR-mediated synaptic transmission: one that is sensitive to NSF inhibitory peptide and actin inhibitors, and one that is not.
One possible mechanism of the effect of NSF inhibitory peptide could be attributable to a change in clustering of AMPARs (Xie et al., 1997;Song et al., 1998), and actin could also be involved in this process. Some evidence for a role of actin in clustering has been provided byAllison et al. (1998), who found that prolonged (24 hr) treatment with 5 μm latrunculin A reduced the number of spines and AMPAR clusters. However, it remains unclear whether declustering occurs on the much faster time scale of our experiments. Another possibility of the role of NSF (Song et al., 1998) and actin is the delivery of AMPARs to the synaptic membrane. There is increasing evidence that AMPARs are undergoing a rapid basal turnover. Specifically, it has been shown that interfering with NSF leads to a rapid decrease in basal synaptic transmission; conversely, enhancing the postsynaptic exocytotic process by adding exogenous solubleN-ethylmaleimidesensitive factor attached protein, another vesicle fusion protein that may deliver new vesicles to the synapse, enhances AMPAR-mediated synaptic transmission within 30 min (Lledo et al., 1998). Interfering with vesicle fusion process blocks LTP induction, perhaps because new AMPARs are required. If rapid turnover of AMPAR is occurring by a vesicle-mediated fusion process, inhibiting actin might interfere with vesicle delivery (Linstedt and Kelly, 1987; Bernstein and Bamburg, 1989; Vitale et al., 1995) and thereby reduce both basal synaptic transmission and LTP. It should be emphasized, however, that relatively little is known about any of these processes. It is not yet clear whether the NSF–exocytosis process occurs near synapses or whether it actually delivers AMPARs to the plasma membrane. Similarly, many possible explanations of the effect of actin inhibitors remain. One actin-dependent process that has been identified is the submicrometer movement of spines (Fisher et al., 1998). These movements are rapidly blocked by APIs and could be related to the physiological effects we have observed.
Interfering with postsynaptic actin also reduces the magnitude of LTP. Similar results were obtained with both latrunculin B and phalloidin (Figs. 4Ab, 4Ac,6B, 8B). Importantly, these effects on LTP occurred at a time after drug application when there was no appreciable effect on basal synaptic transmission. This indicates that LTP induction is more sensitive to actin inhibitors than basal synaptic transmission. We furthermore tested whether phalloidin, when applied after induction, would interfere with LTP maintenance and whether there was any difference in the way it affected the LTP and control pathway. Our results suggest that the LTP pathway is more strongly affected (Fig. 9B,C). In contrast, when phalloidin was applied before LTP induction, the two pathways were reduced proportionally.
There are several explanations for why LTP may be dependent on actin filament. First, as suggested by Edwards (1995), actin filament may be required to split the active zone into multiple independent ones. Second, actin filaments in spines may undergo a reversible gel–sol–gel transition during LTP induction, as suggested by Fifkova and Morales (1992). Block of this transition by API or phalloidin may prevent other changes required for LTP expression. Third, actin might be required to cluster extrasynaptic AMPARs in the synapse (Xie et al., 1997). Fourth, actin filaments may be required for a vesicle fusion process that delivers more AMPAR to the synapse during LTP (see above). Because there are specific agents that interfere with membrane fusion processes, it should now be possible to test whether the fusion-dependent processes and actin-dependent processes are along the same pathway controlling AMPAR-mediated transmission.
Footnotes
This work was supported by the National Institutes of Health Grant 5 RO1 NS27337–09. We gratefully acknowledge the support of the W. M. Keck Foundation. We gratefully thank Dr. Nikolai Otmakhov for providing software and help for whole-cell experiment and helpful discussions throughout the experiment. We also thank Drs. Sacha Nelson and Leslie Griffith for their careful reading of this manuscript. We thank Dr. Ole Jensen, Dr. Nonna A. Otmakhova, Dr. Ed Richard, Natalia Slutskaya, and Lindsay Mortenson for their support.
Correspondence should be addressed to John E. Lisman, Volen Center for Complex Systems, Brandeis University, Waltham, MA 02254.
REFERENCES
- 1.Allison DW, Gelfand VI, Spector I, Craig AM. Role of actin in anchoring postsynaptic receptors in cultured hippocampal neurons: differential attachment of NMDA versus AMPA receptors. J Neurosci. 1998;18:2423–2436. doi: 10.1523/JNEUROSCI.18-07-02423.1998. [DOI] [PMC free article] [PubMed] [Google Scholar]
- 2.Bernstein BW, Bamburg JR. Cycling of actin assembly in synaptosomes and neurotransmitter release. Neuron. 1989;3:257–265. doi: 10.1016/0896-6273(89)90039-1. [DOI] [PubMed] [Google Scholar]
- 3.Bortolotto ZA, Collingridge GL. Involvement of calcium/calmodulin-dependent protein kinases in the setting of a molecular switch involved in hippocampal LTP. Neuropharmacology. 1998;37:535–544. doi: 10.1016/s0028-3908(98)00058-6. [DOI] [PubMed] [Google Scholar]
- 4.Calakos N, Scheller RH. Synaptic vesicle biogenesis, docking, and fusion: a molecular description. Physiol Rev. 1996;76:1–29. doi: 10.1152/physrev.1996.76.1.1. [DOI] [PubMed] [Google Scholar]
- 5.Charlton MP, Smith SJ, Zucker RS. Role of presynaptic calcium ions and channels in synaptic facilitation and depression at the squid giant synapse. J Physiol (Lond) 1982;323:173–193. doi: 10.1113/jphysiol.1982.sp014067. [DOI] [PMC free article] [PubMed] [Google Scholar]
- 6.Cohen GA, Doze VA, Madison DV. Opioid inhibition of GABA release from presynaptic terminals of rat hippocampal interneurons. Neuron. 1992;9:325–335. doi: 10.1016/0896-6273(92)90171-9. [DOI] [PubMed] [Google Scholar]
- 7.Cohen RS, Chung SK, Pfaff DW. Immunocytochemical localization of actin in dendritic spines of the cerebral cortex using colloidal gold as a probe. Cell Mol Neurobiol. 1985;5:271–284. doi: 10.1007/BF00711012. [DOI] [PubMed] [Google Scholar]
- 8.Collingridge GL, Kehl SJ, McLennan H. Excitatory amino acids in synaptic transmission in the Schaffer collateral–commissural pathway of the rat hippocampus. J Physiol (Lond) 1983;334:33–46. doi: 10.1113/jphysiol.1983.sp014478. [DOI] [PMC free article] [PubMed] [Google Scholar]
- 9.Cooper JA. Effects of cytochalasin and phalloidin on actin. J Cell Biol. 1987;105:1473–1478. doi: 10.1083/jcb.105.4.1473. [DOI] [PMC free article] [PubMed] [Google Scholar]
- 10.Creager R, Dunwiddie T, Lynch G. Paired-pulse and frequency facilitation in the CA1 region of the in vitro rat hippocampus. J Physiol (Lond) 1980;299:409–424. doi: 10.1113/jphysiol.1980.sp013133. [DOI] [PMC free article] [PubMed] [Google Scholar]
- 11.Cumming R, Burgoyne RD. Compartmentalization of neuronal cytoskeletal proteins. Biosci Rep. 1983;3:997–1006. doi: 10.1007/BF01121026. [DOI] [PubMed] [Google Scholar]
- 12.Drenckhahn D, Kaiser H-W. Evidence for the concentration of F-actin and myosin in synapses and in the plasmalemmal zone of axons. Eur J Cell Biol. 1983;31:235–240. [PubMed] [Google Scholar]
- 13.Edwards FA. Anatomy and electrophysiology of fast central synapses lead to a structural model for long-term potentiation. Physiol Rev. 1995;75:759–787. doi: 10.1152/physrev.1995.75.4.759. [DOI] [PubMed] [Google Scholar]
- 14.Fifkova E. Actin in the nervous system. Brain Res Rev. 1985;9:187–215. [PubMed] [Google Scholar]
- 15.Fifkova E, Delay RJ. Cytoplasmic actin in neuronal processes as a possible mediator of synaptic plasticity. J Cell Biol. 1982;95:345–350. doi: 10.1083/jcb.95.1.345. [DOI] [PMC free article] [PubMed] [Google Scholar]
- 16.Fifkova E, Morales M. Actin matrix of dendritic spines, synaptic plasticity, and long-term potentiation. Int Rev Cytol. 1992;139:267–307. doi: 10.1016/s0074-7696(08)61414-x. [DOI] [PubMed] [Google Scholar]
- 17.Fischer M, Kaech S, Knutti D, Matus A. Rapid actin-based plasticity in dendritic spines. Neuron. 1998;20:847–854. doi: 10.1016/s0896-6273(00)80467-5. [DOI] [PubMed] [Google Scholar]
- 18.Furukawa K, Smith-Swintosky VL, Mattson MP. Evidence that actin depolymerization protects hippocampal neurons against excitotoxicity by stabilizing [Ca2+]i. Exp Neurol. 1995;133:153–163. doi: 10.1006/exnr.1995.1018. [DOI] [PubMed] [Google Scholar]
- 19.Geinisman Y, deToledo-Morrell L, Morrell F. Induction of long-term potentiation is associated with an increase in the number of axospinous synapses with segmented postsynaptic densities. Brain Res. 1991;566:77–88. doi: 10.1016/0006-8993(91)91683-r. [DOI] [PubMed] [Google Scholar]
- 20.Goda Y, Stevens CF. Two components of transmitter release at a central synapse. Proc Natl Acad Sci USA. 1994;91:12942–12946. doi: 10.1073/pnas.91.26.12942. [DOI] [PMC free article] [PubMed] [Google Scholar]
- 21.Greengard P, Valtorta F, Czernik AJ, Benfenati F. Synaptic vesicle phosphoproteins and regulation of synaptic function. Science. 1993;259:780–785. doi: 10.1126/science.8430330. [DOI] [PubMed] [Google Scholar]
- 22.Gulley RL, Reese TS. Cytoskeletal organization at the postsynaptic complex. J Cell Biol. 1981;91:2998–2302. doi: 10.1083/jcb.91.1.298. [DOI] [PMC free article] [PubMed] [Google Scholar]
- 23.Hess G, Kuhnt U, Voronin LL. Quantal analysis of paired-pulse facilitation in guinea pig hippocampal slices. Neurosci Lett. 1987;77:187–192. doi: 10.1016/0304-3940(87)90584-2. [DOI] [PubMed] [Google Scholar]
- 24.Johnson BD, Byerly L. A cytoskeletal mechanism for Ca2+ channel metabolic dependence and inactivation by intracellular Ca2+. Neuron. 1993;10:797–804. doi: 10.1016/0896-6273(93)90196-x. [DOI] [PubMed] [Google Scholar]
- 25.Kaech S, Fischer M, Doll T, Matus A. Isoform specificity in the relationship of actin to dendritic spines. J Neurosci. 1997;17:9565–9572. doi: 10.1523/JNEUROSCI.17-24-09565.1997. [DOI] [PMC free article] [PubMed] [Google Scholar]
- 26.Kelly PT, Cotman CW. Synaptic proteins. J Cell Biol. 1978;79:173–183. doi: 10.1083/jcb.79.1.173. [DOI] [PMC free article] [PubMed] [Google Scholar]
- 27.Landis DM. Membrane and cytoplasmic structure at synaptic junctions in the mammalian central nervous system. J Electron Microsc Tech. 1988;10:129–151. doi: 10.1002/jemt.1060100203. [DOI] [PubMed] [Google Scholar]
- 28.Linstedt AD, Kelly RB. Overcoming barriers to exocytosis. Trends Neurosci. 1987;10:446–448. [Google Scholar]
- 29.Lledo P-M, Zhang X, Sudof TC, Malenka RC, Nicoll RA. Postsynaptic membrane fusion and long-term potentiation. Science. 1998;279:399–403. doi: 10.1126/science.279.5349.399. [DOI] [PubMed] [Google Scholar]
- 30.Markham JA, Fifkova E. Actin filament organization within dendrite and dendritic spines during development. Dev Brain Res. 1986;27:263–269. doi: 10.1016/0165-3806(86)90253-1. [DOI] [PubMed] [Google Scholar]
- 31.Matus A, Ackermann M, Pehling G, Byers HR, Fujiwara K. High actin concentration in brain dendritic spines and postsynaptic densities. Proc Natl Acad Sci USA. 1982;79:7590–7594. doi: 10.1073/pnas.79.23.7590. [DOI] [PMC free article] [PubMed] [Google Scholar]
- 32.Miledi R. Strontium as a substitute for calcium in the process of transmitter release at the neuromuscular junction. Nature. 1966;212:1233–1234. doi: 10.1038/2121233a0. [DOI] [PubMed] [Google Scholar]
- 33.Nishimune A, Isaac JTR, Molnar E, Noel J, Nash SR, Tagaya M, Collingridge GL, Nakanishi S, Henley JM. NSF binding to GluR2 regulates synaptic transmission. Neuron. 1998;21:87–97. doi: 10.1016/s0896-6273(00)80517-6. [DOI] [PubMed] [Google Scholar]
- 34.Oliet SHR, Malenka RC, Nicoll RA. Bi-directional control of quantal size by synaptic activity in the hippocampus. Science. 1996;271:1294–1297. doi: 10.1126/science.271.5253.1294. [DOI] [PubMed] [Google Scholar]
- 35.Otmakhov N, Griffith LC, Lisman JE. Postsynaptic inhibitors of calcium/calmodulin-dependent protein kinase type II block induction but not maintenance of pairing-induced long-term potentiation. J Neurosci. 1997;17:5357–5365. doi: 10.1523/JNEUROSCI.17-14-05357.1997. [DOI] [PMC free article] [PubMed] [Google Scholar]
- 36.Paoletti P, Ascher P. Mechanosensitivity of NMDA receptors in cultured mouse central neurons. Neuron. 1994;13:645–655. doi: 10.1016/0896-6273(94)90032-9. [DOI] [PubMed] [Google Scholar]
- 37.Pavlik LL, Moshkov DA. Actin in synaptic cytoskeleton during long-term potentiation in hippocampal slice. Acta Histochem Suppl. 1992;41:257–264. [PubMed] [Google Scholar]
- 38.Rosenmund C, Westbrook GL. Calcium-induced actin depolymerization reduced NMDA channel activity. Neuron. 1993;10:805–814. doi: 10.1016/0896-6273(93)90197-y. [DOI] [PubMed] [Google Scholar]
- 39.Song I, Kamboj S, Xia J, Dong H, Liao D, Huganir RL. Interaction of the N-ethylmaleimide-sensitive factor with AMPA receptors. Neuron. 1998;21:393–400. doi: 10.1016/s0896-6273(00)80548-6. [DOI] [PubMed] [Google Scholar]
- 40.Spector I, Shochet NR, Kashman Y, Groweiss A. Latrunculins: novel marine toxins that disrupt microfilament organization in cultured cell. Science. 1983;219:493–495. doi: 10.1126/science.6681676. [DOI] [PubMed] [Google Scholar]
- 41.Spector I, Shochet NR, Blasberger D, Kashman Y. Latrunculins: novel marine macrolides that disrupt microfilament organization and affect cell growth. I. Comparison with cytochalasin D. Cell Motil Cytoskeleton. 1989;13:127–144. doi: 10.1002/cm.970130302. [DOI] [PubMed] [Google Scholar]
- 42.Sudhof TC. The synaptic vesicle cycle: a cascade of protein–protein interactions. Nature. 1995;375:645–653. doi: 10.1038/375645a0. [DOI] [PubMed] [Google Scholar]
- 43.Vitale ML, Seward EP, Trifaro J-M. Chormaffin cell cortical actin network dynamics control the size of the release-ready vesicle pool and the initial rate of exocytosis. Neuron. 1995;14:353–363. doi: 10.1016/0896-6273(95)90291-0. [DOI] [PubMed] [Google Scholar]
- 44.Wigstrom H, Gustafsson B. Postsynaptic control of hippocampal long-term potentiation. J Physiol (Paris) 1986;81:228–236. [PubMed] [Google Scholar]
- 45.Wyszynski M, Lin J, Rao A, Beggs AH, Craig AM, Sheng M. Competitive binding of α-actinin and calmodulin to the NMDA receptor. Nature. 1997;385:439–442. doi: 10.1038/385439a0. [DOI] [PubMed] [Google Scholar]
- 46.Xie X, Liaw J-S, Baudry M, Berger TW. Novel expression mechanism for synaptic potentiation: alignment of presynaptic release site and postsynaptic receptor. Proc Natl Acad Sci USA. 1997;94:6983–6988. doi: 10.1073/pnas.94.13.6983. [DOI] [PMC free article] [PubMed] [Google Scholar]