

Abstract
Voltage-gated chloride channels (ClC) are highly conserved during evolution and appear to participate in a variety of physiological functions. Recently, ClC-2 was proposed to play a role in stabilizing the chloride equilibrium potential near or below the resting membrane potential in neurons expressing ligand-gated chloride channels. Because rod bipolar cells in mammalian retina express three forms of inhibitory ligand-gated chloride channels, we decided to study ClC-2 localization and function in the rat retina. RNA encoding ClC-1, -2, -3, -4, and -5 was detected by reverse transcription-PCR in the rat retina. ClC-2-specific antibodies identified protein on cell bodies and in synaptic layers. Double-immunofluorescence staining revealed that intense ClC-2 immunoreactivity colocalized with PKC-stained rod bipolar cells. Patch-clamp experiments performed with individual rod bipolar cells demonstrated the presence of a time-dependent, inwardly rectified current activated at hyperpolarizing membrane potentials. This current demonstrated selectivity for different anions (Cl− > I− > gluconate), was inhibited by Cd2+, and was minimally reduced by 4,4′-diisothiocyanatostilbene-2,2′-disulphonic acid. These features are consistent with currents generated by ClC-2 channels. Our data indicate that functional ClC-2 channels are present in retinal rod bipolar cells and support a role for ClC-2 in maintaining Cl− homeostasis in neurons with ligand-gated chloride channels.
Keywords: voltage-gated chloride channel, ClC, ligand-gated ion channel, GABA receptor, CNS, retina, rod bipolar cell
The voltage-gated chloride channel (ClC) family in mammals consists of nine different proteins, most of which are of unknown function (Jentsch and Günther, 1997). The third member of this family, ClC-2, is ubiquitously expressed and is associated with a time-dependent, inwardly rectified chloride conductance activated by cell swelling, extracellular acid pH, or membrane hyperpolarization (Gründer et al., 1992; Thiemann et al., 1992; Staley et al., 1996; Jordt and Jentsch, 1997; Schwiebert et al., 1998). Despite the wide distribution of ClC-2, it has been suggested that ClC-2 channels in neurons act in concert with chloride transporters to facilitate neurotransmitter-mediated inhibition (Smith et al., 1995; Staley et al., 1996).
In most mature neurons, outward-directed chloride transporters, such as the potassium–chloride cotransporter or the sodium linked chloride–bicarbonate exchanger, drive the chloride equilibrium potential (ECl) negative relative to the cell resting membrane potential (Em) (Thompson and Gähwiler, 1989b; Staley et al., 1996; Jentsch and Günther, 1997; Jarolimek et al., 1999; Rivera et al., 1999). Under this situation, opening of GABA- or glycine-gated chloride channels results in hyperpolarization of the neuron. However, prolonged stimulation of inhibitory receptors can reduce the degree of hyperpolarization and can even lead to depolarization because of intracellular chloride accumulation (McCarren and Alger, 1985; Thompson and Gähwiler, 1989a,b; Staley et al., 1995). Furthermore, certain neurons are depolarized by activation of GABA receptors, and it has been shown thatECl is positive relative toEm in these cells (Misgeld et al., 1986; Rohrbough and Spitzer, 1996).
Two observations indicate that ClC-2 channels underlie a noninactivating inwardly rectifying chloride conductance that preventsECl from becoming positive relative toEm in cells hyperpolarized by inhibitory neurotransmitters (Staley, 1994; Staley et al., 1996). First, pyramidal neurons that are hyperpolarized by GABA expressed ClC-2 channels, whereas dorsal root ganglion (DRG) neurons that are depolarized by GABA lacked ClC-2 expression (Misgeld et al., 1986;Thompson and Gähwiler, 1989b; Staley, 1994; Smith et al., 1995;Rohrbough and Spitzer, 1996). Second, expression of ClC-2 in DRG neurons using an adenoviral vector reducedECl to levels close toEm and attenuated GABA-mediated depolarization (Staley et al., 1996).
Anatomic, electrophysiological, and molecular studies indicate that activation of GABAA, GABAC, or glycine receptors causes hyperpolarization of retinal bipolar cells (GABAA receptors: Karschin and Wässle, 1990; Grigorenko and Yeh, 1994; Greferath et al., 1995; GABAC receptors: Feigenspan et al., 1993; Enz et al., 1995; Enz et al., 1996; Euler and Wässle, 1998; Fletcher et al., 1998; glycine receptors: Karschin and Wässle, 1990; Enz and Bormann, 1994; Greferath et al., 1994). However, the expression pattern of voltage-gated chloride channels in the retina is unknown. As a first step to explore the possible role of ClC channels in visual signal transduction, we analyzed retinal mRNA for members of the ClC family. Subsequently, the expression of ClC-2 was studied in detail, using ClC-2-specific antibodies in combination with colocalization techniques. Patch-clamp experiments were performed on dissociated retinal neurons to verify the results of the immunocytochemical studies. We conclude that rod bipolar cells express functional ClC-2 chloride channels.
MATERIALS AND METHODS
cDNA synthesis and PCR. Five micrograms of rat retina poly(A+) RNA (Clontech, Palo Alto, CA) were incubated for 30 min at 37°C with 50 U of DNaseI (Boehringer Mannheim, Mannheim, Germany) and 40 U of RNasin (Boehringer Mannheim) in a final volume of 100 μl to remove possible contamination from chromosomal DNA. To remove the enzyme, acid phenol extraction and ethanol precipitation was performed by adding 16 μl of 2m sodium acetate, pH 4.0, 100 μl of acid phenol, and 50 μl of chloroform/isoamylalcohol (49:1) following the protocol of Chomczynski and Sacchi (1987). All chemicals were purchased from Sigma (St. Louis, MO). cDNA synthesis was performed in 40 μl of cDNA synthesis buffer, containing 50 mm Tris-HCl, pH 8.3, 3 mm MgCl2, 75 mm KCl, 10 mmdithiothreitol, and 0.5 mm each dNTP, 250 ng of p(dN)6, 40 U of RNasin (Boehringer Mannheim), and 800 U of SuperscriptII RNaseH− reverse transcriptase (Life Technologies, Grand Island, NY). Incubation times were 15 min at room temperature followed by 2 hr at 42°C. For PCR, oligonucleotides specific for seven members of the rat ClC family were used (Table 1). Amplification was performed with 100 ng of reverse-transcribed RNA in 50 μl of PCR buffer [20 mm Tris-HCl, pH 8.0, 50 mm KCl, 1.5 mmMgCl2, 0.2 mm dNTPs, 0.2 μm each primer, and 5 U ofTaq-polymerase (Life Technologies)] using a programmable thermocycler (Perkin-Elmer Cetus, Norwalk, CT) with the following parameters: 94°C for 3 min followed by 30 cycles at 94°C for 45 sec, 58°C for 60 sec, 72°C for 45 sec, and a final incubation at 72°C for 10 min. To detect splice variants of ClC-2, annealing was performed at 55°C. Ten microliters of each PCR product were separated on a 1.5% agarose gel and stained with ethidium bromide. Controls were treated as described above, except adding reverse transcriptase. To verify the identity of the DNA fragments, PCR solutions were purified using Microcon-100 spin columns (Amicon, Beverly, MA) or geleluted (Qiagen, Hilden, Germany) and subjected to dideoxy sequencing (Sanger, 1977).
Table 1.
Oligonucleotides used for the detection of members of the ClC family
| Primer | Sequence | Length of PCR product | Reference |
|---|---|---|---|
| P1 ClC-K1 | 5′-TTCAGCATCGAGGTCATGTC-3′ | 665 | Uchida et al., 1993 |
| P2 ClC-K1 | 5′-GCCTCTCCCAAGAGGCG-3′ | ||
| P1 ClC-K2 | 5′-TTCAGCATCGAGGTCATGTC-3′ | 661 | Kieferle et al., 1994 |
| P2 ClC-K2 | 5′-CCCCAAAGAGGCGCCCG-3′ | ||
| P1 ClC-1 | 5′-CAGCATCTGTGCTGCTGTC-3′ | 461 | Steinmeyer et al., 1991 |
| P2 ClC-1 | 5′-GTGCTTAGCAAGAAACTGGC-3′ | ||
| P1 ClC-2 | 5′-CAAGTTCCTCTCCCTCTTTG-3′ | 499 | Thiemann et al., 1992 |
| P2 ClC-2 | 5′-GAACTGTCCAAAGCCAGGG-3′ | ||
| P1 ClC-3 | 5′-CCTCTTTCCAAAGTATAGCAC-3′ | 552 | Kawasaki et al., 1994 |
| P2 ClC-3 | 5′-TTACTGGCATTCATGTCATTTC-3′ | ||
| P1 ClC-4 | 5′-GGTACATGGCTGAACTCTTC-3′ | 297 | Jentsch et al., 1995 |
| P2 ClC-4 | 5′-GAGTCATGTTGGGGTCATTG-3′ | ||
| P1 ClC-5 | 5′-GGAACATCCTGTGCCACTG-3′ | 543 | Sakamoto et al., 1996 |
| P2 ClC-5 | 5′-AATCACAGAGCTTGGAGGAG-3′ | ||
| P1 ClC-2S | 5′-GCCTCTTCTGTGGCAGTCC-3′ | 142/202 | Chu et al., 1996 |
| P2 ClC-2S | 5′-ACCCGCTTCAGCTTGC-3′ |
P1 ClC-2S and P2 ClC-2S were used to analyze different splice variants of ClC-2. P1, Sense primer, P2, antisense primer.
Immunohistochemistry. After intramuscular injection of ketamine (87 mg/kg; Sigma) and xylazine (13 mg/kg; Sigma), the deeply anesthetized adult Wistar rats were euthanized via transcardiac puncture and exsanguination. The eyes were enucleated, and the lens, cornea, and vitreous body were removed. Eyecups were fixed for 1 hr in 4% paraformaldehyde, cryoprotected in 30% sucrose, embedded in O.C.T. compound (Sakura Finetek, Torrance, CA), and frozen in isopentane chilled with dry ice. Subsequently, 12 μm cryosections were collected on siliconized slides. Immunostaining was performed using the indirect fluorescence method with rat anti ClC-2 (1:100) (Staley et al., 1996) and mouse anti-PKC (1:50; Amersham Pharmacia Biotech, Arlington Heights, IL) as primary antibodies and goat anti-rat conjugated to Cy3 (1:1000; Sigma) and goat anti-mouse conjugated to FITC (1:50; Sigma) as secondary antibodies. For double-label experiments, sections were first incubated in a mixture of primary antibodies, followed by a mixture of secondary antibodies. Controls were prepared by using only secondary antibodies or by omitting one of the two primary antibodies. In this case, only immunoreactivity of the remaining primary antibody was detected. Immunofluorescence was accomplished using an epifluorescence microscope (Axiophot; Zeiss, Jena, Germany) equipped with a 40 × 1.3 fluorite objective, a filter wheel (Sutter, Novato, CA), a cooled coupling device (CCD camera CH350; Photometrics, Tucson, AZ), and Metamorph software (Universal Imaging Corp., West Chester, PA). Horizontal sections were analyzed using a confocal laser-scanning microscope (LSM 410; Zeiss) and Zeiss LSM software (version 3.80). Images were reproduced with Adobe Photoshop (Adobe Systems, San Jose, CA) and a color printer (NP-1600M; Codonics, Middleburg Heights, OH).
Cell preparation and electrophysiological recordings.Retinas of adult Wistar rats (8 weeks) were dissociated using a combination of enzymatic and mechanical procedures as described previously (Huba and Hofmann, 1988; Karschin and Wässle, 1990). One hour after plating on glass coverslips coated with poly-l-lysine (Sigma) and concanavalin A (Sigma), bipolar cells were visually identified under phase-contrast optics of an inverted microscope (Nikon, Melville, NY) with a CF plan flour 20× objective. Cells were continuously superfused with an extracellular bath solution at a rate of 1 ml/min containing (in mm): 137 NaCl, 5.4 KCl, 1.8 CaCl2, 1 MgCl2, and 5 HEPES, pH 7.4. NaCl was replaced by NaI and sodium gluconate in anion selectivity experiments. Patch pipettes were made from borosilicate glass (Warner Instruments, Hamden, CT) using a two-stage electrode puller (Narashige, East Meadow, NY) and had pipette resistances of 3.7–5.2 MΩ (mean of 4.3 MΩ; n = 5) when filled with an intracellular solution containing (in mm): 120 CsCl, 20 TEA-Cl, 1 CaCl2, 2 MgCl2, 11 EGTA, and 10 HEPES, pH 7.2. Electrode holder and head stage were mounted on a piezo-electric remote-controlled device attached to a three-dimensional mechanical micromanipulator (Burleigh Instruments, Fishers, NY). Membrane currents were recorded in the whole-cell configuration of the patch-clamp method (Hamill et al., 1981) using an Axopatch amplifier (Axon Instruments, Foster City, CA) and PCLAMP 6.0 software (Axon Instruments). Currents were low-pass filtered at 2 kHz (four-pole Bessel filter) and sampled with 20 Hz. The recorded data were corrected for errors resulting from series resistance, estimated to be in the range of 15 MΩ (two to five times the pipette resistance) (Marty and Neher, 1995) and from liquid junction potential, calculated to be + 3.37 mV for NaCl, −2.42 mV for NaI, and −7.31 mV for sodium gluconate (Barry, 1994). Leak subtraction was not applied, because the data presented in this paper are qualitative in nature. CdSO4, 4,4′-diisothiocyanatostilbene-2,2′-disulphonic acid (DIDS), NaI, and sodium gluconate (all from Sigma) were applied in the bath solution with the U-tube application system (Bormann, 1992). To generate current-voltage plots, amplitude values measured at 200 msec were normalized to 1 for each cell and plotted against the applied voltage. Error bars represent ±SEM. A modified version of the Goldman–Hodgin–Katz equation was used to calculate permeation ratios (pAnion/pChloride= (e−(Erev *F/RT) − ([Chloride]o/[Chloride]i))/([Anion]o/[Chloride]i).
RESULTS
Expression of voltage-gated chloride channels in the rat retina
The presence of mRNA transcripts encoding seven members of the ClC family in the adult rat retina was studied using reverse transcription (RT)-PCR. Single strand cDNA obtained after reverse transcription of retinal mRNA was amplified with oligonucleotides specific for the seven ClC genes (Table 1). DNA fragments were amplified from ClC-1,-2,-3,-4, and -5 mRNA transcripts but not from ClC-K1 or ClC-K2 (Fig.1A). Alternative splicing of ClC-2 in rat brain has been reported. Skipping of exon 20 produced mRNA transcripts that were 60 nucleotides shorter (Chu et al., 1996; Chu and Zeitlin, 1997). DNA fragments of the expected size for the exon 20 splice variant were amplified from rat retina (Fig.1B). For all PCR experiments, control reactions without adding reverse transcriptase excluded contamination.
Fig. 1.

Expression of RNA encoding voltage-gated chloride channels in the rat retina. Ethidium bromide stained RT-PCR products amplified from rat retina RNA using primers specific for seven different ClC genes (A) and primers flanking exon 20 of the rat ClC-2 gene (B). The identity of all PCR products was determined by DNA sequencing. A, The ClC type is indicated above the agarose gel, and the 600 bp fragment of a 100 bp ladder (lane M) is shown on the left. The faintly stained fragments inlane K2 and lane 5 are attributable to nonspecific amplification. B, The exon 20 splice variant of rat ClC-2 was detected in retinal RNA (+ lane). The expected sizes of fragments amplified from ClC-2 transcripts with exon 20 (202 bp) and without exon 20 (142 bp) are indicated on theright. The fragment without an indicated size is because of formation of a heteroduplex of the two smaller DNA fragments. Absence of amplified product in the reaction without reverse transcriptase (− lane) excluded contamination.
Immunohistochemical localization of ClC-2 in rod bipolar cells
A polyclonal immunoserum raised in rabbit that specifically recognizes ClC-2 (Staley et al., 1996) was applied to vertical cryostat sections of the adult rat retina. Immunoreactivity could be detected in all retinal layers (Fig.2A). Cell bodies in the outer nuclear layer (ONL) were faintly labeled, whereas cell bodies present in the inner nuclear layer (INL) and ganglion cell layer (GCL) were intensely stained. Within the INL, ClC-2 immunoreactivity was visible as bright regions in cell bodies lying at the outer half of the INL, presumably being bipolar cell bodies. In addition, fluorescence could be detected in both the outer plexiform layer (OPL) and the inner plexiform layer (IPL). The strong staining of photoreceptor inner segments was nonspecific, because it was also visible in sections that were incubated without primary antibodies (Fig. 2B). To indicate the position of retinal layers, a Nomarski photograph is shown in Figure 2C.
Fig. 2.

Immunohistochemical detection of ClC-2 in the rat retina. A, A fluorescence micrograph of a vertical cryostat section through the rat retina was incubated with antibodies specific for ClC-2 and visualized using secondary antibodies coupled to Cy3. Immunofluorescence could be seen throughout the retina, most prominent at cell bodies present in the outer half of the INL and in the IPL. Scale bar, 25 μm. B, Control experiment in which only the secondary antisera was used. Nonspecific staining of photoreceptor inner segments can be seen. C, Retinal layers are shown using Nomarski optics. IS, Inner segments of photoreceptors; ONL, outer nuclear layer; OPL, outer plexiform layer; INL, inner nuclear layer; IPL, inner plexiform layer;GCL, ganglion cell layer.
To determine which type of neurons stained brightly in the outer half of the INL, we performed double-immunofluorescence experiments. Labeling for ClC-2 was visualized with secondary antibodies coupled to Cy3 (Fig. 3A, red fluorescence). Intense staining was visible in the outer half of the INL, as well as throughout the IPL. The same section was also incubated with an antibody against the α isoform of PKC, which is used to identify rod bipolar cells (Greferath et al., 1990). Binding of this antibody was visualized with secondary antibodies coupled to FITC (Fig. 3B, green fluorescence). Rod bipolar cell bodies were seen in the outer half of the INL. Their dendrites terminated in the OPL, and their axons proceeded vertically to the lower border of the IPL in which they ended in a broad band of varicose swellings. Double exposure of this section superimposed the red staining for ClC-2 in the upper half of the INL on nearly every green-labeled rod bipolar cell body. The resulting yellow signals were visible as bright regions in the upper part of the INL and appeared to be within the rod bipolar cell bodies (Fig. 3C). In addition, intense ClC-2 immunoreactivity was colocalized with the axon terminal systems of rod bipolar cells in the IPL (stars).
Fig. 3.

Localization of ClC-2 on rod bipolar cells.A, Fluorescence micrographs of a vertical cryostat section labeled with a ClC-2-specific antiserum (Cy3-coupled secondary antisera, red fluorescence). B, Incubation of the same section as in A with antisera specific for the α subunit of PKC, which identifies rod bipolar cells (FITC-coupled secondary antisera, green fluorescence).C, Double exposure of the section revealed staining for ClC-2 on the upper half of rod bipolar cell bodies (yellow fluorescence) and on rod bipolar cell axon terminal systems (stars). Scale bar, 25 μm.
Further studies were performed to determine the location of the ClC-2 immunoreactivity in the INL and the IPL. An enlarged vertical section of the outer half of the INL is shown in Figure4A. Every rod bipolar cell body (identified by green PKC immunoreactivity) was also labeled with the ClC-2 antiserum, seen as intense costaining (yellow). ClC-2 was also present on neurons other than rod bipolar cells (Fig. 4A, star). To evaluate whether the ClC-2 immunoreactivity on rod bipolar cell bodies was localized to the membrane or whether the protein was present in intracellular structures, a horizontal plane of a double-labeled rod bipolar cell body was visualized by confocal laser-scanning microscopy (Fig. 4B). Superimposure of the PKC immunoreactivity (left, green fluorescence) with the ClC-2 staining (middle,red fluorescence) suggested that ClC-2 is localized in or near the cell membrane of rod bipolar cell bodies (right,yellow fluorescence). An enlarged view of the IPL is shown in Figure 4C. The left shows vertically oriented axons of rod bipolar cells terminating in their terminal systems at the lower border of the IPL (green fluorescence). The ClC-2 immunofluorescence of the same section is shown in theright of Figure 4C (red fluorescence). Colocalization of rod bipolar cell axon terminals with ClC-2 staining was evident (stars). In summary, ClC-2 seems to be expressed at axon–terminal systems of rod bipolar cells, thus being in the vicinity of GABA and glycine receptors. In addition, we found ClC-2 to be expressed in surprisingly high concentrations in rod bipolar cell bodies, most likely present in the membrane of these neurons.
Fig. 4.
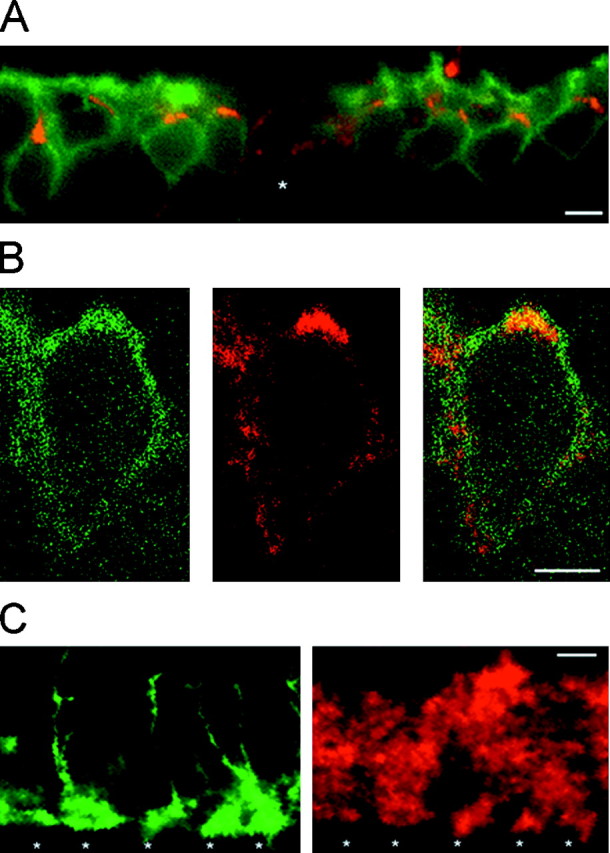
Subcellular distribution of ClC-2 on rod bipolar cells. A, Enlarged view of a vertical cryostat section immunolabeled as in Figure 3. Cell bodies of rod bipolar cells were located in the outer half of the inner nuclear layer (green fluorescence). ClC-2 immunoreactivity (red fluorescence) was present on every cell body, resulting in yellow signals. In addition, ClC-2 staining outlined other cells (star). B, Horizontal single-section confocal fluorescence micrographs of a rod bipolar cell body double-immunolabeled as described in Figure 3. PKC immunoreactivity was predominantly localized to the cell membrane (left, green fluorescence). Expression of ClC-2 is shown in the middle (red fluorescence). The double exposure demonstrated that ClC-2 immunoreactivity seemed to be mostly present within or near the cell membrane (right, yellow).C, Enlarged view of the lower border of the IPL of double-labeled vertical cryostat sections. Axon terminal systems of rod bipolar cells were double-immunolabeled with antibodies recognizing PKC (left, green fluorescence). ClC-2 immunoreactivity (red fluorescence) was present at identical positions (stars). Furthermore, ClC-2 immunoreactivity was observed at other regions within the IPL. Scale bars: A, C, 10 μm; B, 5 μm.
Hyperpolarization-activated chloride currents in rod bipolar cells
To investigate whether functional ClC-2 chloride channels are present in cell membranes of rod bipolar cells, we performed whole-cell patch-clamp studies on isolated rod bipolar cells. It has been shown previously that cells in retinal dissociates that have the appearance of bipolar cells (Fig. 3B) are rod bipolar cells, because they can be stained with an antibody against the α subunit of PKC (Greferath et al., 1990; Karschin and Wässle, 1990). Rod bipolar cells were visually identified under an inverted microscope, and voltage-activated currents were recorded using a specific protocol: initial depolarization from 0 to +40 mV, than voltage steps in −20 mV increments to a potential of −140 mV (Fig.5, left). Maximal currents at −140 mV were between 1000 and 3000 pA. A representative current tracing is shown in Figure 5 (middle). At negative voltages, the chloride channel opened in a time-dependent manner over a 250 msec interval and showed inward rectification, characteristics typical of ClC-2 recorded in mammalian cells (Carew and Thorn, 1996; Ferroni et al., 1997; Park et al., 1998; Schwiebert et al., 1998). To compare current-voltage relationships of different bipolar cells, current values for each cell were normalized by dividing the current recorded at each voltage step by the current recorded at −140 mV. Normalized data from 12 different cells are shown in a current–voltage plot (Fig.5, right). Inward rectification of the observed chloride conductance was observed at potentials negative to −60 mV.
Fig. 5.

Hyperpolarization-activated chloride currents on isolated rod bipolar cells. A hyperpolarizing voltage step protocol (left) generated inwardly rectified, noninactivating currents from an isolated rod bipolar cell (middle). Data recorded from 12 different bipolar cells are summarized in a current–voltage plot (right). The current amplitudes have been normalized (I/Ic) to the currents at −140 mV (Ic; see Materials and Methods for details).
To characterize the nature of the observed currents, hyperpolarization-activated currents were recorded in bath solutions containing different anions. The relative anion selectivity for ClC-2 has been shown to be Cl− > I− > gluconate (Thiemann et al., 1992;Ferroni et al., 1997; Jordt and Jentsch, 1997; Clark et al., 1998;Schwiebert et al., 1998). When 137 mm NaCl was substituted with sodium iodide or sodium gluconate, the amplitudes of the recorded currents decreased in the order Cl− > I− > gluconate at all potentials (Fig.6A). Normalized data are shown in a current–voltage plot. Mean reductions at −100 mV were 38.6 ± 10.7% (iodide) and 60.1 ± 3.3% (gluconate) and were statistically significant (chloride–iodide, p = 3.5 × 10⁻⁴; iodide–gluconate,p = 3.8 × 10⁻²). The reversal potentials (Erev) were +0.29 ± 0.4 mV for symmetrical chloride, +3.3 ± 0.25 mV, and + 16.6 ± 4.2 mV after substituting 137 mm chloride with iodide or gluconate. From the mean values, permeation ratios relative to chloride were calculated for iodide (0.85) and for gluconate (0.47).
Fig. 6.

Electrophysiological characterization of hyperpolarization-activated currents in rod bipolar cells. A, Representative current tracings of a single rod bipolar cell recorded in different anionic solutions. Current amplitudes and the degree of inward rectification decreased in NaI, further decreased in Na gluconate, and returned to original levels in NaCl. The current–voltage plot on the rightrepresents calculated mean data. Currents were normalized (I/Ic) using current amplitudes at −120 mV in NaCl (Ic). The voltage protocol was the same as described in Figure 5, except that the applied potentials ranged from + 60 to −120 mV. B, Representative current tracings of a single rod bipolar cell exposed to extracellular DIDS or CdSO4. The first and fourth recordings were performed in symmetrical chloride solutions alone. The voltage-activated currents were partially inhibited by the application of 500 μm DIDS and substantially reduced by 500 μm CdSO4. Inhibition of each compound was reversible. The current–voltage plot of normalized mean data are shown at the right. Currents have been normalized as described in A.
To further characterize the hyperpolarization-activated currents in isolated bipolar cells, Cd2+ or DIDS were applied in the external solution. Cadmium has been shown to be a potent reversible inhibitor of ClC-2-mediated chloride currents, whereas DIDS only minimally affects ClC-2 currents (Madison et al., 1986;Chesnoy-Marchais and Fritsch, 1994; Fritsch and Edelmann, 1996; Ferroni et al., 1997; Clark et al., 1998; Schwiebert et al., 1998). Application of 500 μm Cd2+ reduced the voltage-activated current by 86.4 ± 2.7% at −120 mV (Fig.6B). In contrast, the application of 500 μm DIDS had a minor effect on the recorded current traces (−26.3 ± 10.1% at −120 mV). Normalized data from five different cells are shown in a current–voltage plot. Thus, rod bipolar cells generated time-dependent inwardly rectifying currents at hyperpolarizing voltages that showed anion-selectivity (Cl− > I−> gluconate), sensitivity to Cd2+, and minimal inhibition by DIDS.
DISCUSSION
Very little is known of the expression pattern of voltage-gated chloride channels in the retina. Using RT-PCR, we detected transcripts for ClC-1,-2,-3,-4, and -5 in the adult rat retina. ClC-1 is considered to be muscle-specific; thus, our observations on the expression of ClC-1 outside muscle suggests a broader distribution of this channel than previously thought. Indeed, ClC-1 has also been detected in hair cells of the rat cochlea (Kawasaki et al., 1999). Considering the potential importance of ClC-2 in inhibitory neurotransmission, we decided to perform an extensive study on its cellular distribution in the retina. Incubation of vertical cryostat sections of retina with ClC-2-specific antibodies revealed the presence of ClC-2 protein on the cell bodies of all nuclear layers, as well as in both synaptic layers, consistent with the wide tissue distribution of ClC-2 (Thiemann et al., 1992). However, intense staining was consistently noted in the outer half of the INL that colocalized with PKC-stained rod bipolar cells.
Confocal microscopy revealed that the ClC-2 staining appeared to be in, or near, the cell membranes of rod bipolar cells. ClC-2 has been found in the proximity of cell membranes in airway epithelia of the rat and human embryonic kidney cells (HEK 293) and in secretory granules at the apical pole of pig pancreatic cells (Murray et al., 1995; Carew and Thorn, 1996; Park et al., 1998). In the IPL of the rat retina, axon terminals of rod bipolar cells were intensely stained by the ClC-2 antibodies. Many subunits of glycine and GABA receptors are present at the axon terminal systems of these cells (Karschin and Wässle, 1990; Greferath et al., 1995; Enz et al., 1996). Therefore, ClC-2 seems to be present in a region of bipolar cells in which massive chloride influx is predicted to occur. However, we cannot rule out the possibility that localization in the IPL is a result of expression of ClC-2 on amacrine cells that form reciprocal synapses with bipolar cell terminals. This issue might be solved using electron microscopy.
Patch-clamp experiments were performed on single rod bipolar cells to corroborate the anatomical localization of ClC-2 to these neurons. The isolated cells exhibited time-dependent inwardly rectified currents that activated within milliseconds at hyperpolarizing membrane potentials. The anion selectivity (Cl− > I− > gluconate) of these currents indicated that a chloride selective ion channel was responsible for a substantial fraction of the currents. Furthermore, the observed reversal potential (Erev) in symmetrical chloride (+0.3 mV) was close to the predictedErev for a chloride current under these conditions (0 mV). Substitution of extracellular chloride with iodide or gluconate caused a shift ofErev to positive voltages as expected, but the magnitude of the shift was less than predicted by the Nernst equation. The muted shift in reversal potential may be caused by inactivation of ClC-2 at depolarizing voltages, as reported previously (Jordt and Jentsch, 1997). This concept is supported by the observation that ClC-2 channels activated by acidic pH remain open at positive voltages and display more substantial shifts ofErev in iodide and gluconate solutions (Jordt and Jentsch, 1997; Schwiebert et al., 1998).
The characteristics and anion selectivity of the chloride currents were consistent with those reported previously for ClC-2. Exchange of extracellular chloride with other anions reduced the current amplitudes at negative and positive membrane potentials, indicating an effect that was independent of the direction of ion flow (Thiemann et al., 1992;Ferroni et al., 1997; Clark et al., 1998; Schwiebert et al., 1998). Furthermore, ClC-2 expressed in mammalian cells has been shown to activate in milliseconds, as observed in the rat bipolar cells (Carew and Thorn, 1996; Ferroni et al., 1997; Schwiebert et al., 1998). In contrast, mammalian forms of ClC-2 have considerably slower activation kinetics when expressed in Xenopus oocytes (Thiemann et al., 1992; Jordt and Jentsch, 1997). To further characterize the observed chloride conductance, we applied Cd2+ and DIDS, two compounds used to study ClC-2 in other cell systems (Ferroni et al., 1997; Clark et al., 1998; Schwiebert et al., 1998). Extracellular Cd2+ substantially reduced the voltage-activated chloride current, whereas DIDS had a minor effect, most likely because of its negative charge, consistent with previous studies of ClC-2 (Ferroni et al., 1997; Clark et al., 1998;Schwiebert et al., 1998). Therefore, our electrophysiological studies appear consistent with ClC-2 immunoreactivity in, or near, the cell membrane of rod bipolar cells (Fig. 4B) and support the idea that at least a fraction of ClC-2 protein is located within the membrane.
The hyperpolarization-activated currents we observed in the rod bipolar cells have characteristics similar to a potassium conductance studied by Karschin and Wässle (1990). The authors reported that addition of cesium in the patch pipette blocked the potassium current completely. Although shape and activation characteristics of the potassium currents were similar to the traces presented in this paper, it is unlikely that the conductance we described was caused by potassium. First, all recordings were performed with 120 mmCsCl and 20 mm TEA-Cl in the patch-pipette; thus, potassium-mediated currents should be completely blocked. Second, all recordings were performed with symmetrical chloride concentrations without potassium inside the cell. Under these conditions, a potassium current would reverse at a very positive voltage. In contrast, the observed reversal potential of our currents was close to 0 mV, consistent with the predicted reversal potential of a chloride current under our recording conditions. We cannot, however, exclude the possibility that a minor portion of the voltage-activated current could be carried by an inwardly rectified potassium current because of an incomplete block by Cs+ and TEA+, and/or by a Cd2+-sensitive nonselective cation conductance.
Among retinal neurons, only rod bipolar cells express three ligand-gated chloride channels (glycine, GABAA, and GABAC, receptors). It has been shown that GABA and glycine can be coreleased from individual synaptic vesicles in interneuron–motoneuron synapses of the rat spinal cord, producing simultaneous activation of GABA and glycine receptors (Jonas et al., 1998). Although the same phenomenon has not been observed in the retina, simultaneous release of both neurotransmitters may occur at a single synapse using different vesicles. Thus, GABA and glycine receptors might be activated simultaneously, which could result in a substantial chloride influx into rod bipolar cells. Reduction of the chloride gradient could lower the inhibitory effect of GABA and glycine on the bipolar cells (Adams and Brown, 1975; Barker and Ransom, 1978;Segal and Barker, 1984).
Our results suggest that two mechanisms operate to maintain the chloride gradient and, in turn, the inhibitory effect of GABA and glycine on retinal bipolar cells. First, outward-directed chloride transporters, such as KCC2, could actively transport chloride out of cells to establish a strong inward driving force for chloride (Jarolimek et al., 1999; Rivera et al., 1999). Indeed, it has been shown that bipolar cells in primary cultures of the chick retina express the KCC2 isoform of the potassium–chloride cotransporter (Williams et al., 1999). Localization of functional ClC-2 channels to bipolar cells in this report suggests that a second mechanism may operate in situations of substantial chloride influx. Based on the proposition that ClC-2 channels clampECl at or nearEm in cortical neurons, it is possible that these channels play the same role in retinal neurons (Smith et al., 1995; Staley et al., 1996). In this way, ClC-2 could act as a “safety” valve for chloride ions. The characteristics of ClC-2, inwardly rectified chloride channels that open at hyperpolarizing membrane potentials without time-dependent inactivation would be well suited for this task.
Footnotes
Received ; revised ; accepted.
This work was supported by the Deutsche Forschungsgemeinschaft (R.E.), the Reproductive Scientist Development Program through National Institutes of Health Grant 2K12HD00849 (B.J.R.), and National Institutes of Health Grants EY 09531 and DK 48977 (G.R.C.). We thank Drs. R. Smith and K. Staley for the ClC-2 immunoserum, Dr. S. Chu for ClC-2 oligonucleotides, Dr. M. Milewski for help with the confocal microscope, and Drs. J. Wright, W. B. Guggino, and D. Dawson for helpful discussions.
Correspondence should be addressed to Dr. Garry R. Cutting, Institute of Genetic Medicine, CMSC 9–123, The Johns Hopkins University School of Medicine, 600 North Wolfe Street, Baltimore, MD 21287. E-mail:gcutting@jhmi.edu.
REFERENCES
- 1.Adams PR, Brown DA. Actions of gamma-aminobutyric acid on sympathetic ganglion cells. J Physiol (Lond) 1975;250:85–120. doi: 10.1113/jphysiol.1975.sp011044. [DOI] [PMC free article] [PubMed] [Google Scholar]
- 2.Barker JL, Ransom BR. Amino acid pharmacology of mammalian central neurons grown in tissue culture. J Physiol (Lond) 1978;280:331–354. doi: 10.1113/jphysiol.1978.sp012387. [DOI] [PMC free article] [PubMed] [Google Scholar]
- 3.Barry PH. JPCalc, a software for calculating liquid junction potential corrections in patch-clamp, intracellular epithelial and bilayer measurements and for correcting junction potential measurements. J Neurosci Methods. 1994;51:107–116. doi: 10.1016/0165-0270(94)90031-0. [DOI] [PubMed] [Google Scholar]
- 4.Bormann J. U-tube drug application. In: Kettenmann H, Grantyn R, editors. Practical electrophysiological methods. Wily-Liss; New York: 1992. pp. 136–140. [Google Scholar]
- 5.Carew MA, Thorn P. Identification of ClC-2-like chloride currents in pig pancreatic acinar cells. Pflügers Arch. 1996;433:84–90. doi: 10.1007/s004240050252. [DOI] [PubMed] [Google Scholar]
- 6.Chesnoy-Marchais D, Fritsch J. Activation by hyperpolarization and atypical osmosensitivity of a Cl− current in rat osteoblastic cells. J Membr Biol. 1994;140:173–188. doi: 10.1007/BF00233706. [DOI] [PubMed] [Google Scholar]
- 7.Chomczynski P, Sacchi N. Single-step method of RNA isolation by guanidinium thiocyanate-phenol-chloroform extraction. Anal Biochem. 1987;162:156–159. doi: 10.1006/abio.1987.9999. [DOI] [PubMed] [Google Scholar]
- 8.Chu S, Zeitlin PL. Alternative mRNA splice variants of the rat ClC-2 chloride channel gene are expressed in lung: genomic sequence and organization of ClC-2. Nucleic Acids Res. 1997;25:4153–4159. doi: 10.1093/nar/25.20.4153. [DOI] [PMC free article] [PubMed] [Google Scholar]
- 9.Chu S, Murray CB, Liu MM, Zeitlin PL. A short ClC-2 mRNA transcript is produced by exon skipping. Nucleic Acids Res. 1996;24:3453–3457. doi: 10.1093/nar/24.17.3453. [DOI] [PMC free article] [PubMed] [Google Scholar]
- 10.Clark S, Jordt S-E, Jentsch TJ, Mathie A. Characterization of the hyperpolarization-activated chloride current in dissociated rat sympathetic neurons. J Physiol (Lond) 1998;506:665–678. doi: 10.1111/j.1469-7793.1998.665bv.x. [DOI] [PMC free article] [PubMed] [Google Scholar]
- 11.Enz R, Bormann J. Expression of glycine receptor subunits and gephyrin in single bipolar cells of the rat retina. Vis Neurosci. 1994;12:501–507. doi: 10.1017/s0952523800008403. [DOI] [PubMed] [Google Scholar]
- 12.Enz R, Brandstätter JH, Hartveit E, Wässle H, Bormann J. Expression of GABA receptor subunits ρ1 and ρ2 in the retina and brain of the rat. Eur J Neurosci. 1995;7:1495–1501. doi: 10.1111/j.1460-9568.1995.tb01144.x. [DOI] [PubMed] [Google Scholar]
- 13.Enz R, Brandstätter JH, Wässle H, Bormann J. Immunocytochemical localization of GABAC receptor ρ subunits in the mammalian retina. J Neurosci. 1996;16:4479–4490. doi: 10.1523/JNEUROSCI.16-14-04479.1996. [DOI] [PMC free article] [PubMed] [Google Scholar]
- 14.Euler T, Wässle H. Different contributions of GABAA and GABAC receptors to rod and cone bipolar cells in a rat retinal slice preparation. J Neurophysiol. 1998;79:1384–1395. doi: 10.1152/jn.1998.79.3.1384. [DOI] [PubMed] [Google Scholar]
- 15.Feigenspan A, Wässle H, Bormann J. Pharmacology of GABA receptor Cl− channels in rat retinal bipolar cells. Nature. 1993;361:159–162. doi: 10.1038/361159a0. [DOI] [PubMed] [Google Scholar]
- 16.Ferroni S, Marchini C, Nobile M, Rapisarda C. Characterization of an inwardly rectifying chloride conductance expressed by cultured rat cortical astrocytes. Glia. 1997;21:217–227. doi: 10.1002/(sici)1098-1136(199710)21:2<217::aid-glia5>3.0.co;2-3. [DOI] [PubMed] [Google Scholar]
- 17.Fletcher EL, Koulen P, Wässle H. GABAA and GABAC receptors on mammalian rod bipolar cells. J Comp Neurol. 1998;396:351–365. doi: 10.1002/(sici)1096-9861(19980706)396:3<351::aid-cne6>3.0.co;2-1. [DOI] [PubMed] [Google Scholar]
- 18.Fritsch J, Edelmann A. Modulation of the hyperpolarization-activated Cl− current in human intestinal T84 epithelial cells by phosphorylation. J Physiol (Lond) 1996;490:115–128. doi: 10.1113/jphysiol.1996.sp021130. [DOI] [PMC free article] [PubMed] [Google Scholar]
- 19.Greferath U, Grünert U, Wässle H. Rod bipolar cells in the mammalian retina show protein kinase C-like immunoreactivity. J Comp Neurol. 1990;301:433–442. doi: 10.1002/cne.903010308. [DOI] [PubMed] [Google Scholar]
- 20.Greferath U, Brandstätter JH, Wässle H, Kirsch J, Kuhse J, Grünert U. Differential expression of glycine receptor subunits in the retina of the rat: a study using immunohistochemistry and in situ hybridization. Vis Neurosci. 1994;11:721–729. doi: 10.1017/s0952523800003023. [DOI] [PubMed] [Google Scholar]
- 21.Greferath U, Grünert U, Fritschy JM, Stephenson A, Möhler H, Wässle H. GABAA receptor subunits have differential distributions in the rat retina: in situ hybridization and immunohistochemistry. J Comp Neurol. 1995;353:553–571. doi: 10.1002/cne.903530407. [DOI] [PubMed] [Google Scholar]
- 22.Grigorenko EV, Yeh HH. Expression profiling of GABAA receptor β-subunits in the rat retina. Vis Neurosci. 1994;11:379–387. doi: 10.1017/s0952523800001723. [DOI] [PubMed] [Google Scholar]
- 23.Gründer S, Thiemann A, Pusch M, Jentsch TJ. Regions involved in the opening of ClC-2-chloride channel by voltage and cell volume. Nature. 1992;360:759–762. doi: 10.1038/360759a0. [DOI] [PubMed] [Google Scholar]
- 24.Hamill OP, Marty A, Neher E, Sakmann B, Sigworth FJ. Improved patch-clamp techniques for high resolution current recording from cells and cell-free membrane patches. Pflügers Arch. 1981;391:85–100. doi: 10.1007/BF00656997. [DOI] [PubMed] [Google Scholar]
- 25.Huba R, Hofmann HD. Tetanus toxin binding to and cultured rat retinal glia cells. Glia. 1988;1:156–164. doi: 10.1002/glia.440010208. [DOI] [PubMed] [Google Scholar]
- 26.Jarolimek W, Lewen A, Misgeld U. A furosemide-sensitive K+-Cl− cotransporter counteracts intracellular Cl− accumulation and depletion in cultured rat midbrain neurons. J Neurosci. 1999;19:4695–4704. doi: 10.1523/JNEUROSCI.19-12-04695.1999. [DOI] [PMC free article] [PubMed] [Google Scholar]
- 27.Jentsch TJ, Günther W. Chloride channels: an emerging molecular picture. BioEssays. 1997;19:117–126. doi: 10.1002/bies.950190206. [DOI] [PubMed] [Google Scholar]
- 28.Jentsch TJ, Günther W, Pusch M, Schwappach B. Properties of voltage-gated chloride channels of the ClC gene family. J Physiol (Lond) 1995;482:19S–25S. doi: 10.1113/jphysiol.1995.sp020560. [DOI] [PMC free article] [PubMed] [Google Scholar]
- 29.Jonas P, Bischofberger J, Sandkühler J. Corelease of two fast neurotransmitters at a central synapse. Science. 1998;281:419–424. doi: 10.1126/science.281.5375.419. [DOI] [PubMed] [Google Scholar]
- 30.Jordt SE, Jentsch TJ. Molecular dissection of gating in the ClC-2 chloride channel. EMBO J. 1997;16:1582–1592. doi: 10.1093/emboj/16.7.1582. [DOI] [PMC free article] [PubMed] [Google Scholar]
- 31.Karschin A, Wässle H. Voltage- and transmitter-gated currents in isolated rod bipolar cells of rat retina. J Neurophysiol. 1990;63:860–876. doi: 10.1152/jn.1990.63.4.860. [DOI] [PubMed] [Google Scholar]
- 32.Kawasaki E, Hattori N, Miyamoto E, Yamashita T, Inagaki C. Single-cell RT-PCR demonstrates expression of voltage-dependent chloride channels (ClC-1, ClC-2 and ClC-3) in outer hair cells of the rat cochlea. Brain Res. 1999;838:166–170. doi: 10.1016/s0006-8993(99)01730-8. [DOI] [PubMed] [Google Scholar]
- 33.Kawasaki M, Uchida S, Monkawa T, Miyawaki A, Mikoshiba K, Marumo F, Sasaki S. Cloning and expression of a protein kinase C-regulated chloride channel abundantly expressed in rat brain neuronal cells. Neuron. 1994;12:597–604. doi: 10.1016/0896-6273(94)90215-1. [DOI] [PubMed] [Google Scholar]
- 34.Kieferle S, Fong P, Bens M, Vandewalle A, Jentsch TJ. Two highly homologous members of the ClC chloride channel family in both rat and human kidney. Proc Natl Acad Sci USA. 1994;91:6943–6947. doi: 10.1073/pnas.91.15.6943. [DOI] [PMC free article] [PubMed] [Google Scholar]
- 35.Madison DV, Malenka RC, Nicoll RA. Phorbol esters block a voltage-sensitive chloride current in hippocampal pyramidal cells. Nature. 1986;321:695–697. doi: 10.1038/321695a0. [DOI] [PubMed] [Google Scholar]
- 36.Marty A, Neher E. Tight-seal whole-cell recording. In: Sakmann B, Neher E, editors. Single-channel recording. Plenum; New York: 1995. pp. 31–51. [Google Scholar]
- 37.McCarren M, Alger BE. Use-dependent depression of IPSPs of rat hippocampal pyramidal cells in vitro. J Neurophysiol. 1985;54:557–571. doi: 10.1152/jn.1985.53.2.557. [DOI] [PubMed] [Google Scholar]
- 38.Misgeld U, Deisz RA, Dodt HU, Lux HD. The role of chloride transport in postsynaptic inhibition of hippocampal neurons. Science. 1986;232:1413–1415. doi: 10.1126/science.2424084. [DOI] [PubMed] [Google Scholar]
- 39.Murray CB, Morales MM, Flotte TR, McGrath-Morrow SA, Guggino WB, Zeitlin PL. ClC-2: a developmentally dependent chloride channel expressed in the fetal lung and downregulated after birth. Am J Respir Cell Mol Biol. 1995;12:597–604. doi: 10.1165/ajrcmb.12.6.7766424. [DOI] [PubMed] [Google Scholar]
- 40.Park K, Arreola J, Begenisich T, Melvin JE. Comparison of voltage-activated Cl− channels in rat parotid acinar cells with ClC-2 in a mammalian expression system. J Membr Biol. 1998;163:87–95. doi: 10.1007/s002329900373. [DOI] [PubMed] [Google Scholar]
- 41.Rivera C, Voipio J, Payne JA, Ruusuvuori E, Lahtinen H, Lamsa K, Pirvola U, Saarma M, Kaila K. The K+/Cl− co-transporter KCC2 renders GABA hyperpolarizing during neonatal maturation. Nature. 1999;397:251–255. doi: 10.1038/16697. [DOI] [PubMed] [Google Scholar]
- 42.Rohrhough J, Spitzer NC. Regulation of intracellular Cl− levels by Na+ dependent Cl− cotransport distinguishes depolarizing from hyperpolarizing GABA receptor-mediated responses in spinal neurons. J Neurosci. 1996;16:82–91. doi: 10.1523/JNEUROSCI.16-01-00082.1996. [DOI] [PMC free article] [PubMed] [Google Scholar]
- 43.Sakamoto H, Kawasaki M, Uchida S, Sasaki S, Marumo F. Identification of a new outwardly rectifying Cl− channel that belongs to a subfamily of the ClC Cl− channels. J Biol Chem. 1996;271:10210–10216. doi: 10.1074/jbc.271.17.10210. [DOI] [PubMed] [Google Scholar]
- 44.Sanger F. Determination of nucleotide sequences in DNA. Science. 1977;214:1205–1210. doi: 10.1126/science.7302589. [DOI] [PubMed] [Google Scholar]
- 45.Schwiebert EM, Cid-Soto LP, Stafford D, Carter M, Blaisdell CJ, Zeitlin PL, Guggino WB, Cutting GR. Analysis of ClC-2 channels as an alternative pathway for chloride conduction in cystic fibrosis airway cells. Proc Natl Acad Sci USA. 1998;95:3879–3884. doi: 10.1073/pnas.95.7.3879. [DOI] [PMC free article] [PubMed] [Google Scholar]
- 46.Segal M, Barker JL. Rat hippocampal neurons in culture: properties of GABA-activated Cl− conductance. J Neurophysiol. 1984;51:500–515. doi: 10.1152/jn.1984.51.3.500. [DOI] [PubMed] [Google Scholar]
- 47.Smith RL, Clayton GH, Wilcox CL, Escuerdo KW, Staley KJ. Differential expression of an inwardly rectifying chloride conductance in rat brain neurons: a potential mechanism for cell-specific modulation of post-synaptic inhibition. J Neurosci. 1995;15:4057–4067. doi: 10.1523/JNEUROSCI.15-05-04057.1995. [DOI] [PMC free article] [PubMed] [Google Scholar]
- 48.Staley K. The role of an inwardly rectifying chloride conductance in postsynaptic inhibition. J Neurophysiol. 1994;72:273–284. doi: 10.1152/jn.1994.72.1.273. [DOI] [PubMed] [Google Scholar]
- 49.Staley K, Smith R, Schaack J, Wilcox CL, Jentsch TJ. Alteration of GABAA receptor function following gene transfer of the ClC-2 chloride channel. Neuron. 1996;17:543–551. doi: 10.1016/s0896-6273(00)80186-5. [DOI] [PubMed] [Google Scholar]
- 50.Staley KJ, Soldo BL, Proctor WR. Ionic mechanisms of neuronal excitation by inhibitory GABAA receptors. Science. 1995;269:977–981. doi: 10.1126/science.7638623. [DOI] [PubMed] [Google Scholar]
- 51.Steinmeyer K, Ortland C, Jentsch TJ. Primary structure and functional expression of a developmentally regulated skeletal muscle chloride channel. Nature. 1991;354:301–304. doi: 10.1038/354301a0. [DOI] [PubMed] [Google Scholar]
- 52.Thiemann A, Gründer S, Pusch M, Jentsch TJ. A chloride channel widely expressed in epithelial and non-epithelial cells. Nature. 1992;356:57–60. doi: 10.1038/356057a0. [DOI] [PubMed] [Google Scholar]
- 53.Thompsom SM, Gähwiler BH. Activity-dependent disinhibition. I. Repetitive stimulation reduces IPSP driving force and conductance in hippocampus in vitro. J Neurophysiol. 1989a;61:501–511. doi: 10.1152/jn.1989.61.3.501. [DOI] [PubMed] [Google Scholar]
- 54.Thompsom SM, Gähwiler BH. Activity-dependent disinhibition. II. Effects of extracellular potassium, furosemide and membrane potential on ECl− in hippocampal CA3 neurons. J Neurophysiol. 1989b;61:512–523. doi: 10.1152/jn.1989.61.3.512. [DOI] [PubMed] [Google Scholar]
- 55.Uchida S, Sasaki S, Furukawa T, Hiraoka M, Imai T, Hirata Y, Marumo F. Molecular cloning of a chloride channel that is regulated by dehydration and expressed predominantly in kidney medulla. J Biol Chem. 1993;268:3821–3824. [PubMed] [Google Scholar]
- 56.Williams JR, Sharp JW, Kumari VG, Wilson M, Payne JA. The neuron-specific K-Cl cotransporter, KCC2. J Biol Chem. 1999;274:12656–12664. doi: 10.1074/jbc.274.18.12656. [DOI] [PubMed] [Google Scholar]