Significance
We have discovered a species-specific feature of the aging process: significantly slowed division rates in self-renewing tissues of humans. In contrast, we found only small to no decrease in division rates in self-renewing tissues of mice, for whom cancer incidence does not decelerate with age. This discovery has important implications for the process of aging itself, particularly given that there is so little known about this ubiquitous process. It additionally provides a potential explanation, supported by experimental data, for the enigmatic decrease of cancer in the oldest (and most rapidly growing) segment of Western populations.
Keywords: cell division, aging, cancer, mutation rate
Abstract
A new evaluation of previously published data suggested to us that the accumulation of mutations might slow, rather than increase, as individuals age. To explain this unexpected finding, we hypothesized that normal stem cell division rates might decrease as we age. To test this hypothesis, we evaluated cell division rates in the epithelium of human colonic, duodenal, esophageal, and posterior ethmoid sinonasal tissues. In all 4 tissues, there was a significant decrease in cell division rates with age. In contrast, cell division rates did not decrease in the colon of aged mice, and only small decreases were observed in their small intestine or esophagus. These results have important implications for understanding the relationship between normal stem cells, aging, and cancer. Moreover, they provide a plausible explanation for the enigmatic age-dependent deceleration in cancer incidence in very old humans but not in mice.
Somatic mutation rates have been measured in several human cell types with a variety of techniques (1–5). For both nuclear and mitochondrial genomes, somatic mutations appear to increase in a linear fashion throughout life. On the surface, this accumulation is consistent with the increase in tumor incidence with age that forms one of the cornerstones of our understanding of cancer (6, 7). This relationship between age and cancer incidence has important practical and conceptual ramifications, given that the proportion of very old individuals in the population is expected to increase. As noted by many investigators, however, there is a blemish in this otherwise satisfying picture: In very old individuals, cancer incidence rates often decelerate (8–11). Although hypotheses for this deceleration have been proposed, understanding of the deceleration of cancer incidence with age remains incomplete (8, 10–13). This conundrum led us to question whether the expected linear accumulation of mutations with age continues throughout life, even in old individuals. While evaluating the literature on this topic (4, 14, 15), we noted that it was generally assumed, rather than demonstrated, that the mutations continued to accumulate in a linear fashion over time. When we removed the assumption of linearity from such regression analyses, a different picture often seemed to emerge: a trend toward slowing in the rate at which somatic mutations accumulate with age (SI Appendix, Figs. S1–S3). This observation is supported by the analyses provided by Podolskiy et al. (16)
How could this occur? It is unlikely that the DNA polymerases responsible for replicating DNA acquire increased fidelity or that DNA repair processes improve in aged individuals, and no evidence for such beneficial changes in repair has emerged. We considered it more likely that cell division rates decrease with age. There is little known about division of stem cells in human self-renewing tissues over time except that the number (rather than division rate) of hematopoietic stem cells and epidermal stem cells appear not to decrease with age (17, 18).
Results
Cell Division Rates Decelerate in Human Tissues.
To test the hypothesis that cell division rates may actually decrease with age, histologically normal colon samples were obtained from 13 individuals in each of 2 age cohorts: 20 to 29 y of age and 80 to 89 y of age. We used the Ki67 antibody, a well-established proliferation marker, to label sections from these tissues (Materials and Methods). Ki67 labels nuclei during all active phases of the cell cycle (G1, S, G2, and mitosis), but is absent from resting cells (G0).
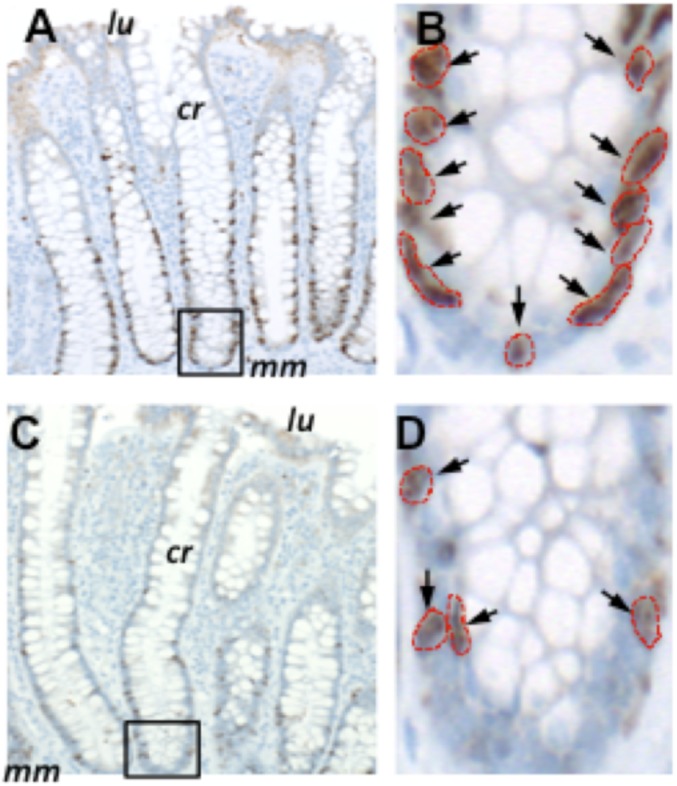
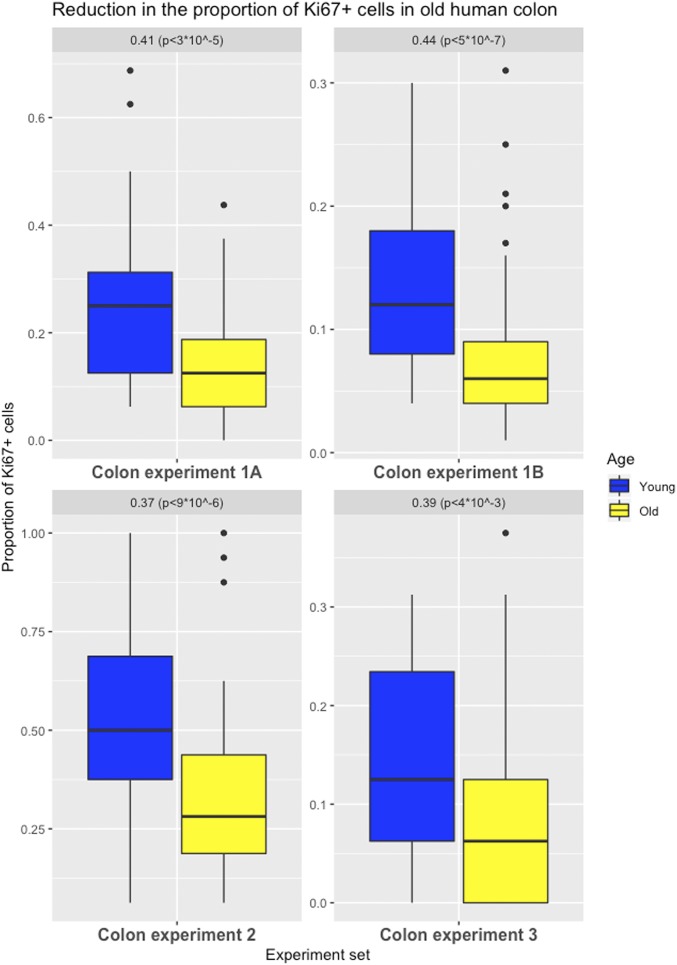
We identified 151 labeled cells (15% of the 992 analyzed cells) in the older cohort at positions 1 to 8 from the crypt bases—the region where the stem cells are thought to reside, whereas in the younger cohort, 219 labeled cells were found (26% of the 848 analyzed cells) (Fig. 1). The difference in Ki67 labeling was highly significant (P < 3 ⋅10−5), with the proliferation rate in the older group reduced by 41% of that in the younger group (95% confidence interval [CI] = 23 to 59%) (experiment 1A, Fig. 2).
Fig. 1.
Ki67 labeling of normal colon resections. Shown are examples of Ki67 labeling in a 26-y-old individual (A and B) compared with an 80-y-old individual (C and D). cr, properly oriented crypt; lu, location of the colonic lumen; mm, muscularis mucosae. The crypts outlined in A and C are magnified in B and D, respectively. Arrows indicate antibody-labeled nuclei, which are outlined in red. Images in A and C were taken at a magnification of 100×, while those in B and D were taken at a magnification of 400×.
Fig. 2.
Effects of aging on cell proliferation in the human colon. Differences in the proportion of Ki67-labeled cells (positions 1 to 8 from a crypt’s base for experiments 1A, 2, and 3; full crypt for experiment 1B) in colon (with first and third quartiles of the overall distribution) are illustrated.
Moreover, a similar pattern was observed throughout the replicating portion of the colonic epithelium (Dataset S1, referring to experiment 1A).
A reanalysis performed by a second pathologist, using an automated imaging method for the counting of labeling in the same samples along the full crypt, confirmed these results: a highly significant 44% reduction (P < 5 ⋅ 10−7) in the older group (95% CI = 28 to 60%) (experiment 1B, Fig. 2 and Materials and Methods).
To further validate these findings, experiments were performed on 2 independent sets of histologically normal human colon tissues using the same labeling technique (experiments 2 and 3, Fig. 2). In experiment 3, an antibody that recognizes the lamin A/C protein was utilized to better visualize the outline of each nucleus, particularly the regions that have high cellularity (Materials and Methods and SI Appendix, Fig. S4). Again, a significant decrease in cell proliferation at the first 8 positions from the crypt basis was found in the older cohorts in both experiments: a 37% (95% CI = 21 to 52%; P < 9 ⋅ 10−6) reduction and a 39% (95% CI = 13 to 65%; P < 4 ⋅ 10−3) reduction, respectively. These results, highly significant even when controlling for multiple testing, document that colonic crypt epithelial cell proliferation is reduced in older individuals.
We also performed a fourth experiment where the colonic tissues were double-stained for Ki67 as well as Lgr5, a marker associated with colonic stem cells. The double-positive cells were too few to obtain a statistically significant result, but a trend was found for the younger colons having higher proliferation than the older cohort, with 16 double-stained cells (out of 14,400 total cells counted [i.e., 0.001%]) in the old cohort vs. 56 double-stained cells (out of 18,416 total cells counted [i.e., 0.003%]) in the young cohort (Materials and Methods and SI Appendix, Fig. S5).
Finally, in colon, we performed a fifth experiment on 46 paraffin-embedded sections of histologically normal colon (20 samples in the younger cohort and 26 in the older cohort), where the colonic tissues were labeled using an antibody raised against the mitosis-specific phosphorylation of histone H3 protein (pHH3); this protein identifies dividing cells within the late G2 phase to M phase of the cell cycle (19), and represents an alternative marker of cell proliferation. By analyzing the first 8 cell positions from the base of the crypts on each side, we identified 14 labeled cells (1.02% of 1,376 cells analyzed) in the younger cohort, and we identified 10 labeled cells (0.53% of the 1,872 cells analyzed) in the older cohort, using 2 to 7 widely separated sections of tissue from each case (Materials and Methods and SI Appendix, Fig. S6). Although these differences did not reach statistical significance due to the very low number of positive cells (P = 0.084), they suggest a 48% decrease in labeling in the older cohort compared with the younger cohort, again supporting our findings using Ki67.
We next evaluated histologically normal human esophageal biopsies from another 20 individuals in each age cohort (Materials and Methods).
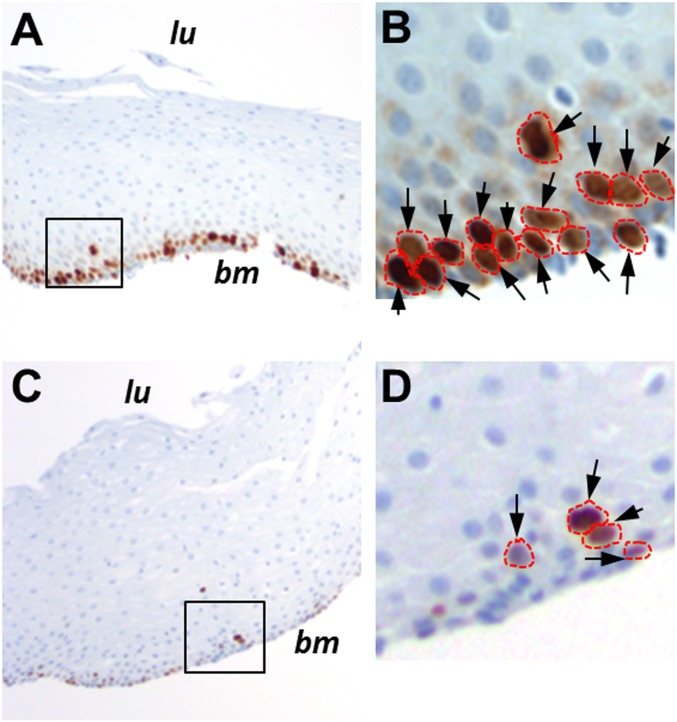
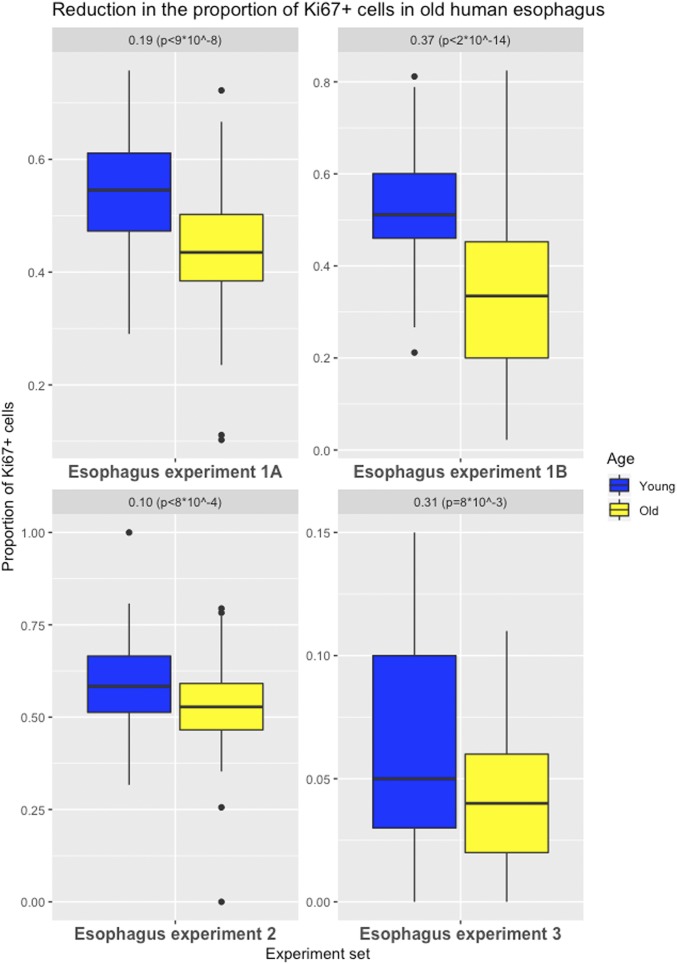
The esophagus is lined by nonkeratinizing squamous epithelium; therefore, the organization of cells in the esophagus differs from that in the intestines. Thus, a slightly different strategy was used to assess the proportion of labeled cells in this tissue type. The stem cells in the esophagus are confined to the basal layer, so only the basal layer was analyzed, and sections were chosen in which the basal layer was consistently oriented with respect to the long axes of the embedded tissue (Fig. 3). A mean of 54% of the basal layer cells was labeled with Ki67 in the younger cohort compared with 44% in the older cohort. Thus, the older cohort group had a significant 19% decrease (95% CI = 12 to 25%; P < 9 ⋅ 10−8) in proliferation activity compared with the younger group (experiment 1A, Fig. 4).
Fig. 3.
Ki67 labeling of normal esophageal biopsies. Shown are examples of Ki67 labeling in a 25-y-old individual (A) compared with an 81-y-old individual (C). bm, basement membrane; lu, location of the esophageal lumen. The areas outlined in A and C are magnified in B and D, respectively. Arrows indicate antibody-labeled nuclei, which are outlined in red. Images in A and C were taken at a magnification of 100×, while those in B and D were taken at a magnification of 400×.
Fig. 4.
Effects of aging on cell proliferation in human esophagus. Differences in the proportion of Ki67-labeled cells (basal layer for experiments 1A, 2, and 3; full tissue for experiment 1B) in esophagus (with first and third quartiles of the overall distribution) are illustrated.
Using an automated imaging method, a second pathologist reanalyzed these tissues, without restricting the analysis to the basal layer. A mean of 33% and 52% labeled cells per 40× field were identified as positive in the older and younger cohorts, respectively. Thus, the older cohort group had a significant 37% decrease (95% CI = 29 to 45%; P < 2 ⋅ 10−14) of the proliferation activity of the younger group (experiment 1B, Fig. 4 and Materials and Methods).
To further validate these findings, experiments were performed on 2 independent sets of human esophageal samples using the same labeling technique (experiments 2 and 3, Fig. 4). In experiment 3, an antibody that recognizes the lamin A/C protein was utilized to better visualize the outline of each nucleus, particularly the regions that have high cellularity (Material and Methods). Again, a significant decrease in cell proliferation in the basal layer of the esophagus was found in the older cohorts in both experiments: a 10% (95% CI = 4 to 16%; P < 8 ⋅ 10−4) decrease and 31% (95% CI = 8 to 53%; P < 8 ⋅ 10−3) decrease, respectively. These results remain significant even when controlling for multiple testing and document that esophageal cell turnover is also reduced in older individuals.
Next, we evaluated histologically normal human duodenum biopsies from 20 individuals in each age cohort (Materials and Methods).
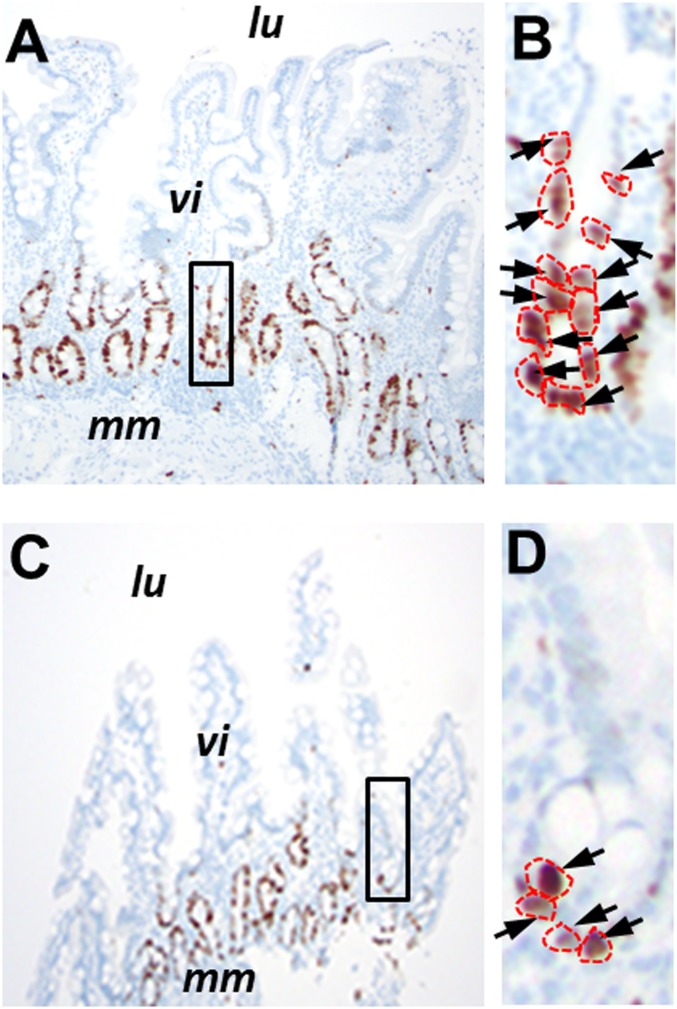
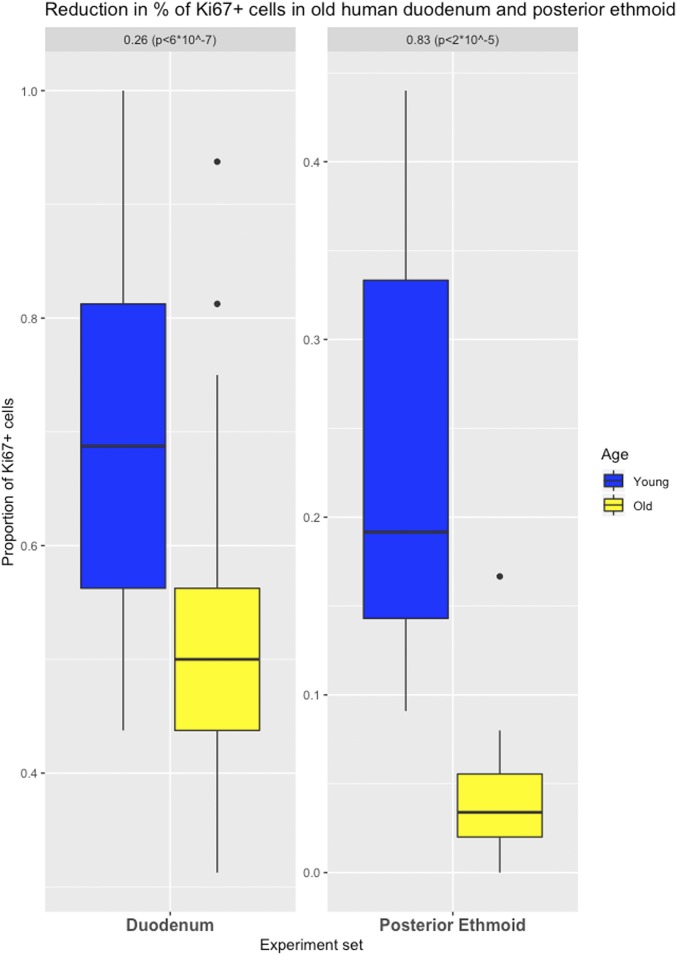
The epithelial cell organization of the duodenum is similar to that of the colon, and the stem cells are located within the first several positions of the crypts that separate one villus from the next (Fig. 5). We found that the older cohort had significantly fewer Ki67-labeled cells in this portion of the crypt (359 labeled cells [52% of 688 analyzed]) than the younger cohort (404 labeled cells [70% of 576 analyzed cells]; P < 6 ⋅ 10−7). Thus, the older cohort exhibited a 26% (95% CI = 16 to 35%) reduction in cell proliferation (Fig. 6).
Fig. 5.
Ki67 labeling of normal duodenal biopsies. Shown are examples of Ki67 labeling in a 27-y-old individual (A) compared with an 84-y-old individual (C). lu, location of the duodenal lumen; mm, muscularis mucosae; vi, villus structures. The areas outlined in A and C are magnified in B and D, respectively. Arrows indicate antibody-labeled nuclei, which are outlined in red. Images in A and C were taken at a magnification of 100×, while images in B and D were taken at a magnification of 400×.
Fig. 6.
Effects of aging on cell proliferation in human duodenum and posterior ethmoid. Differences in the proportion of Ki67-labeled cells in duodenum (positions 1 to 8 from a crypt’s base) and in posterior ethmoid (with first and third quartiles of the overall distribution) are illustrated.
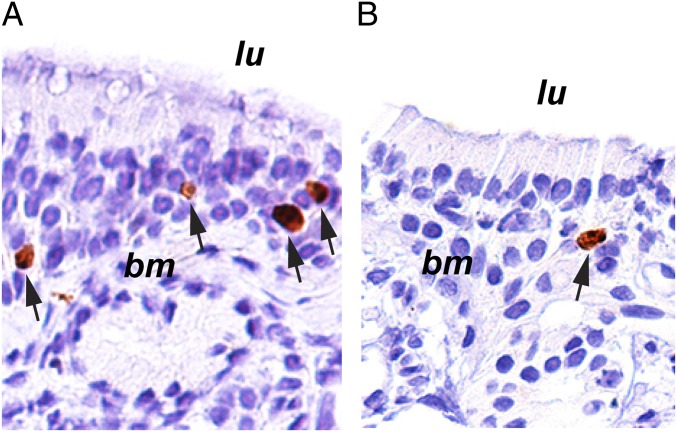
We then evaluated histologically normal posterior ethmoid sinonasal biopsies from 7 individuals. The epithelial cell organization of the posterior ethmoid is similar to that of the esophagus and shows a proliferative basal cell layer in a pseudostratified respiratory epithelium. Means of 4% and 24% cells were identified as positive in the older and younger cohorts, respectively. Thus, the older cohort exhibited an 83% (95% CI = 54 to 100%; P = 2 ⋅ 10−5) reduction in cell proliferation (Figs. 6 and 7).
Fig. 7.
Ki67 labeling of normal posterior ethmoid sinonasal biopsies. Shown are examples of Ki67 labeling in a 32-y-old individual (A) compared with an 83-y-old individual (B). bm, basement membrane; lu, location of the sinus lumen. Arrows indicate antibody-labeled nuclei. Images were taken at a magnification of 20×.
Cell Division Rates Do Not Decelerate in Laboratory Mice.
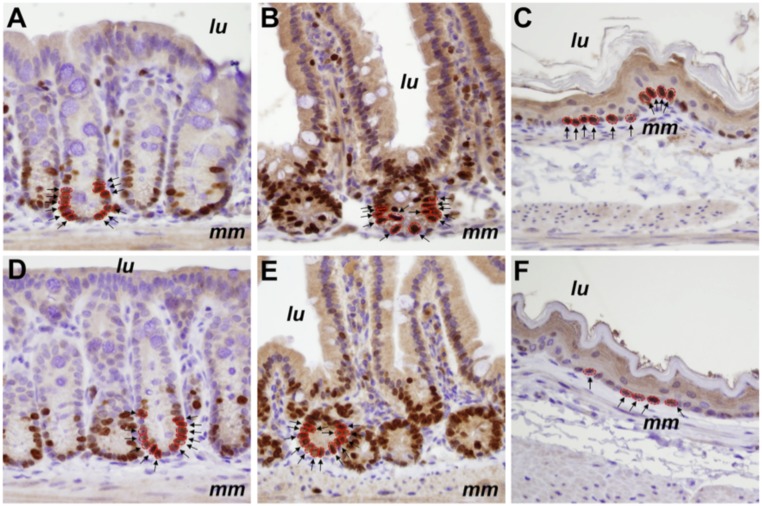
Although cancer incidence decelerates at advanced age in humans, no deceleration occurs in mice (20). We wondered whether this difference might reflect differences in stem cell division rates in older individuals of the 2 species (21, 22). In rodents, there is published information about changes in cell division with aging in a few tissue types, although conflicting results have been reported depending on the tissue type, strain, and technique used (Materials and Methods). We compared the proliferation rates in colon, small intestine, and esophagus of mice that were either 1 or 25 mo old (5 male C57BL/6 mice per cohort). Nuclei were assessed for Ki67 positivity, counting the basal layer of the esophagus and positions 1 to 8 of the colon and small intestine crypts, as we did in human tissues (Fig. 8).
Fig. 8.
Ki67 labeling of normal murine colon, small intestine, and esophagus. Shown are examples of Ki67 labeling in 1-mo-old (A–C) compared with 25-mo-old (D–F) male C57BL/6 mice. Images of colon (A and D), small intestine (B and E), and esophagus (C and F) were taken at a magnification of 400×. Both positively labeled (brown) and unlabeled (blue) nuclei can be seen in the photomicrographs. lu, location of the luminal surface; mm, muscularis mucosae. Examples of positive nuclei, either in crypts or in the basal layer, are indicated by arrows and are outlined in red.
In the colon, 64.1% of 3,758 analyzed cells were labeled in the older cohort, while 66.2% of 3,984 analyzed cells were labeled in the younger cohort, for a 3.6% reduction (95% CI = 0 to 4%), and the difference was not statistically significant (Fig. 8 and Dataset S2). Similarly, we observed a small, nonsignificant 3.9% (95% CI = 0 to 4%) reduction in labeling in the small intestine in the older cohort (80.8% of 4,116 analyzed cells in the old cohort and 84.1% of 3,255 analyzed cells in the young cohort). In the esophagus, the older cohort had a smaller proportion of labeled cells (67.2% of 3,401 analyzed cells) than the younger cohort (77.3% of 2,852 analyzed cells) (95% CI = 0 to 13%; P < 4 ⋅ 10−4) (Fig. 8 and Dataset S2). However, the relative decrease in esophageal proliferation in old mice (13%; Dataset S2) was smaller than the 25% median decrease observed in old humans across the 4 experiments (10 to 37%; Fig. 4).
In sum, the colon, small intestine, and esophagus of the older cohort of mice had 97%, 96%, and 87% of the proliferation activity of the corresponding tissues of the younger cohort, respectively. In the colon, the difference was not statistically significant, and in all tissues, the relative decrease in proliferation in old mice was far less than the decrease observed in old humans (Dataset S2).
Discussion
Evidence for decreased function of human and mouse stem cells with age, such as a reduced ability to maintain homeostasis, has been previously provided (23, 24). Our data do not contradict these studies, but show that there is a decrease in the rate of cell division with age, an observation that may or may not be related to the function of these cells. Previous evidence for an age effect on cell proliferation has been very limited (25–27) (Materials and Methods). The data presented here establish that younger individuals have a higher fraction of dividing cells than older individuals in the regions considered for all 4 self-renewing tissues analyzed (colon, duodenum, esophagus, and posterior ethmoid). The results were highly significant, even when correcting for multiple testing. A detailed analysis of colorectal cell proliferation showed that, in addition to more slowly dividing cells in the lower region of the crypt, overall crypt turnover is reduced in older humans. This decreased turnover could conceivably affect physiological and pathological processes, such as those involving nutrition, immunity, and bacterial colonization.
We infer from the cell division data that mutation rates (measured in units of time) are equivalently lower in the cells of older individuals. For this inference to be false, polymerases or repair enzymes would have to become less accurate in elderly individuals. The inference is also supported by the reanalysis of published data on mutation rates in normal stem cells, where a decelerating trend was apparent in several of the datasets analyzed (SI Appendix). For example, from an indirect analysis of the mutation rates in normal stem cells of the colon (SI Appendix), we estimated a 42% decrease in mutation rates, remarkably similar to the 40% median decrease in proliferation observed in old humans across the 4 experiments (37 to 44% decrease; Fig. 2).
Other factors thought to be involved in tumorigenesis, such as decreased immune cell function, would increase rather than decrease cancer incidence in the elderly. Our data and analyses suggest that part of the enigmatic deceleration in cancer incidence in humans may be due to a decrease in replicative mutation rate (per unit time) caused by a decrease in cell division as we age. These data do not exclude other potential causes, such as the “weeding out of the susceptible” (8, 10, 11). It is also notable that cancer incidence rates do not decelerate in mice (20). This fact, combined with our discovery of a major difference between mice and humans with respect to normal cell division rates, provides further evidence for the causal relationship between cancer incidence and the replicative mutations that occur when normal stem cells divide (22, 28–31).
Our findings also have important implications for the aging process itself and suggest several questions that can be addressed in the future. For example, does the decreased cell division rate apply to all stem cell types, including those of non–self-renewing tissues that must repopulate after injury (e.g., muscle)? Is the difference really human-specific, or does it apply only to species with relatively long lifetimes? As it is known that short telomeres cause replicative senescence (32, 33), does the rate of telomere loss slow with age, thereby preserving telomere lengths? Are species-specific and individual-specific differences in stem cell dynamics attributable to differences in telomere lengths? Is the implied lower turnover of cells responsible for some of the phenotypic attributes of aging, such as changes in appearance and cognitive function? Perhaps most importantly, what is the biochemical basis for the decreased division rates in the stem cells of older individuals?
Materials and Methods
Labeling with Ki67 in Human Tissues.
All human samples reported in this paper were deidentified prior to use in our study. The experiments were performed under Johns Hopkins Institutional Review Board (IRB) no. 00166559 and Tissue Banking Protocol NA_031006340. All samples were formally deidentified and informed consent was obtained whenever the IRB deemed it necessary. Formalin-fixed, paraffin-embedded (FFPE) tissue blocks of surgically resected normal colon were selected from 13 individuals in each age cohort (20 to 29 y old and 80 to 89 y old) who had undergone bowel resection for nonneoplastic (e.g., trauma, diverticulitis) or neoplastic indications. Care was taken to use normal tissues (confirmed to be normal by histopathology) that were at least 10 cm away from any diseased tissue. Tissue blocks containing histologically normal esophagus and normal duodenum biopsies were obtained from an additional 40 individuals in each age cohort (20 for each esophageal age cohort and a different 20 for each duodenal age cohort). Histologically normal posterior ethmoid sinonasal biopsies from 7 individuals were also obtained. Patients with normal sinonasal cavities underwent an endoscopic endonasal transethmoid approach for resection of a nonsecreting pituitary adenoma. Ethmoid tissue was collected and immediately placed into 4% paraformaldehyde, after which specimens were paraffin-embedded.
Slides were reviewed to confirm the complete absence of neoplastic epithelium or other pathology in slides adjacent to those used for immunohistochemistry.
Ki67 (rabbit polyclonal; Novocastra, NCL-KI67p, lot no. 6013874) immunohistochemistry was performed in the Immunohistochemistry Laboratory at Johns Hopkins Hospital using standard clinical pathology laboratory procedures. The Ki67 immunohistochemistry on posterior ethmoid tissues was performed using the antibody Ki67 (rabbit monoclonal; Abcam, Ab16667, lot no. GR3185488-1).
All stained slides were reviewed by a single pathologist without knowledge of the age of the individual contributing the sample. A random set of 10 slides per age cohort was independently reviewed by a second pathologist to ensure uniformity of Ki67 scoring. We scored any cell that showed any Ki67 positivity as positive. The colon crypts chosen for scoring were those with well-oriented, open lumen from surface to base. The number of positive cells per crypt and location of each positive cell within the crypts were noted.
Duodenal villi chosen for scoring were well oriented vertically, with the number of positive cells per villus and location of each positive cell (positions 1 to 8) within the villus noted. Esophageal and posterior ethmoid biopsies were scored as the number of positive cells out of the total number of cells per well-oriented 40× field; only cells in the basal layer of the stratified epithelia were counted.
Further experiments were conducted for the colon and the esophagus. A total of 127 crypts in 44 patients and 95 crypts in 13 patients were analyzed, respectively, for the 2 further experiments on colonic tissue (colon experiments 2 and 3, Fig. 2).
A total of 231 well-oriented 40× fields in 23 patients and 95 well-oriented 40× fields in 32 patients were analyzed, respectively, for the 2 further experiments on esophageal tissue (esophagus experiments 2 and 3, Fig. 4).
The smaller fraction of dividing cells in the lower compartment of the colonic crypt in older individuals has implications for crypt dynamics. If the fraction of dividing cells higher up in the crypt—the “transiently amplifying cells” (34)—is the same in the younger and older cohorts, then the length of time required for all epithelial cells of the crypt to be replaced by new cells would be higher in older individuals (i.e., crypt turnover would be reduced). Conversely, if the fraction of dividing cells higher up in the crypt is lower in the younger than the older cohort, then crypt turnover could be the same, independent of age. To distinguish between these possibilities, we assessed Ki67 labeling throughout each crypt, dividing them into equally sized compartments, each with a length of 8 cells, starting from the base of the crypt and continuing to the edge of the transiently amplifying region (position 32). We found that the younger cohort had a much higher proportion of proliferating cells in each section of the crypt, and that the differences were highly statistically significant (Dataset S1). Thus, cellular turnover, as well as cellular proliferation in colonic crypts, is significantly different in older individuals.
Ki67 staining actually reflects the fraction of cells in a population that are not quiescent, and these cells are assumed to be replicating. Ki67 is therefore generally used as a measure of proliferation rate, although the proliferation rate in a tissue can only be accurately determined through sequential rather than static measurements. This is obviously impossible in studies of retrospective human tissues such as ours.
Ki67 plus Lamin A/C Immunolabeling.
For experiment 3 (in both human colon and human esophagus, Figs. 2 and 4 and SI Appendix, Fig. S4), tissue slides were deparaffinized, rehydrated, and steamed for 30 min in target retrieval citrate buffer (Vector Labs) and then incubated with protein blocking reagent (Dako) for 20 min. Ki67 primary antibody was incubated for 2 h, followed by Alexa Fluor 488-labeled secondary antibody detection. Simultaneously, to easily delineate adjacent nuclei, a monoclonal lamin A/C primary antibody was incubated for 2 h, followed by Alexa Fluor 568-labeled secondary antibody detection. After appropriate washing, the slides were stained with DAPI, mounted with ProLong Gold antifade (Thermo Fisher Scientific), and coverslipped. An antibody that recognizes the lamin A/C protein was utilized to better visualize the outline of each nucleus, particularly the regions that have high cellularity. The specific information on the antibodies is as follows: lamin A/C (rabbit monoclonal; Abcam, clone no. EPR4100, catalog no. ab108595, lot no. GR257223-12) and Ki67 (mouse monoclonal; Life Technologies, clone no. 7B11, catalog no. 180192Z, lot no. 1766903A).
Ki67 plus Lgr5 Stainings.
Combined immunofluorescence staining for LGR5 and Ki67 was performed on FFPE tissue sections (SI Appendix, Fig. S5). Briefly, following dewaxing and rehydration, slides were immersed in 1% Tween-20 for 60 s, and heat‐induced antigen retrieval was then performed in a steamer using a citrate-saline pH 6.0 buffer (Vector Laboratories; catalog no. H-3300) for 25 min. Slides were rinsed in phosphate-buffered saline with Tween-20 (PBST), and endogenous peroxidase and phosphatase were inactivated with a commercial dual-enzyme blocking reagent (Dako; catalog no. S2003). Sections were then incubated for 15 h at 4 °C with a combination of 2 primary antibodies; goat-derived anti‐LGR5 (1:50 dilution; Santa Cruz Biotechnology, catalog no. 68580) and rabbit-derived anti-Ki67 (1:50 dilution; Neomarkers, catalog no. RB-1510-PO). Following PBST washings, the primary antibodies were detected by 45 min of incubation with combined species-appropriate fluorescent secondary antibodies, Alexa Fluor 488 donkey anti-goat and Alexa Fluor 568 donkey anti-rabbit, diluted 1:100 in phosphate-buffered saline (Molecular Probes; catalog no. A11055 and catalog no. A10042). Nuclear counterstaining with DAPI (Sigma–Aldrich) was conducted, coverslips were then applied with antifade mounting medium (Thermo Fisher Scientific; ProLong Gold, catalog no. P36934), and slides were stored in the dark at 4 °C until viewed.
PHH3 Stainings.
PHH3 staining (Cell Signaling) was performed in the Immunohistochemistry Laboratory at Johns Hopkins Hospital using standard clinical pathology laboratory procedures.
Automated Imaging Method.
Two pixel-level classifiers were trained in Ilastik (https://www.ilastik.org): (1) The first segmented only immunohistochemistry-positive nuclei, and (2) the second segmented all nuclei independent of immunohistochemistry staining status. The Ilastik classifiers were then used in CellProfiler (https://cellprofiler.org) to extract the individual areas of (1) and (2) for a given region of interest in Ki67 immunohistochemistry-stained tissue. The ratio of the total areas calculated for (1) relative to (2) served as the Ki67%-positive estimate. All segmentation masks that were produced were visually reviewed by a pathologist (A.B.). All data are available on GitHub (https://github.com/cristomasetti/).
Immunolabeling with Ki67 in Mice.
Conflicting results have been reported on cell division rates in mice depending on the tissue, strain, and technique used (refs. 35, 36 and references therein). To obtain an estimate of the division rates in mouse tissues that would be directly analogous to those obtained in humans, we used the approach described above, based on Ki67 labeling, to evaluate the same 3 tissue types in mice. Accordingly, we compared the proliferation rates in colon, small intestine, and esophagus of mice that were either 1 or 25 mo old (5 male C57BL/6 mice per cohort). All animal experiments were approved by the Johns Hopkins Institutional Animal Care and Use Committee. One- and 25-mo-old male C57BL/6 mice were purchased from Hilltop Labs. Five mice from each age group were euthanized, and appropriate tissues were fixed in 10% neutral buffered formalin before being embedded in paraffin. For Ki67 immunohistochemistry, tissues were sectioned at 4 μm, deparaffinized in xylene, and rehydrated through graded alcohols. Slides were placed in citrate unmasking solution (catalog no. H-3300; Vector Laboratories), steamed for 45 min with Target Retrieval Solution (catalog no. S1699; Dako), and then placed in PBST (catalog no. P3563-10PAK; Sigma Life Sciences). Slides were then incubated in blocking solution (catalog no. S2003; Dako) for 5 min. Ki67 primary antibody (catalog no. Ki67P-CE; Leica) was diluted 1:500 in Antibody Dilution Buffer (catalog no. ADB250; Ventana) before staining slides for 45 min at room temperature. After washing, slides were incubated with a secondary antibody (catalog no. PV6119; Leica) for 30 min at room temperature. They were then incubated with DAB (3,3'-diaminobenzidine) reagent (catalog no. D4293-50SET; Sigma Life Sciences) and counterstained with hematoxylin. Ten regions of esophagus, small intestine, and colon were randomly chosen from the slides of each mouse. The nuclei within these regions were assessed for Ki67 positivity, counting the basal layer of the esophagus or the crypt cells (positions 1 to 8) of the intestines, using well-oriented crypts as described above (Fig. 8).
Scoring Pathologist Information.
The slides were scored by the following pathologists: colon experiment 1A (J.P.), colon experiment 1B (A.B.), colon experiment 2 (C.A.I.-D.), and colon experiment 3 (C.A.I.-D.); esophagus experiment 1A (M.E.P.), esophagus experiment 1B (A.B.), esophagus experiment 2 (M.E.P.), and esophagus experiment 3 (C.A.I.-D.); duodenum (J.P.); posterior ethmoid (M.C.H.); colon Ki67 and Lgr5 (M.E.P.); colon Ki67 and lamin A/C (C.A.I.-D.); colon pHH3 (J.P.); and all countings on mice samples (J.P. and M.E.P.).
All datasets are provided in Datasets S1–S11.
Statistical Analysis of Ki67 Labeling.
The significance of the differences in the number of positive cells among all tissue samples from humans, as well as for all tissues from mice, was determined by the Welch t test, providing an estimate for the difference in the means between the 2 groups and the CI. All statistical analyses were performed using R software, version 3.5.1 (R Development Core Team).
Previous Literature on the Effect of Aging on Cell Proliferation.
There have been a few attempts in the past to estimate the effect of aging on cell proliferation, and we comment briefly on them.
Corazza et al. (26) used proliferating cell nuclear antigen (PCNA), which we do not consider as good as Ki67 as a cell division marker because PCNA is important for both DNA synthesis and DNA repair (DNA polymerase epsilon is involved in resynthesis of excised damaged DNA strands during DNA repair).
Ciccocioppo et al. (25) used MIB-1 and showed an increase of apoptosis as well as an increase in cell proliferation in older people in the crypt, in contrast to our findings, but not in the villi. They state: “It should be underlined that, as far as MIB-1 expression is concerned, the present results are slightly at variance from those of a previous study of ours in which a different marker of enterocyte proliferation (PCNA) was used [Corazza et al. (26)]. Both PCNA and MIB-1 expression was increased in aged crypt enterocytes, but only PCNA turned out to be raised at the villous level.”
Roncucci et al. (27) used [3H]thymidine in rectal mucosa and concluded that proliferation is higher in older people. However, when considering the 5 compartments in which the crypts have been divided (with 1 being the lowest, the base of the crypt [figure 1 in ref. 27]), we find 2 results consistent with ours and 1 that is not: (1) The lowest compartment (base of the crypt) had a higher proliferation than the higher compartments, independent of age, precisely as we show in our Dataset S2, and (2) the lowest compartment 1 had more proliferation in young patients than in old patients in agreement with our results and contrary to their overall claim; thus, in the stem cell range, their results agree with ours. (3) In the upper compartment, however, they find more proliferation in old than young patients. Here, we think that since the signal, as demonstrated in point 1 by both us and them, gets smaller and smaller in the upper compartments, noise is probably confounding the results. We cannot explain, however, the difference with our results in the intermediate compartments (II and III).
Potential limitations of all these studies are a lack of technical and biological experiment replicates, a small number of slides and crypts analyzed per sample (not reported), and the fact that only 1 tissue was considered.
Supplementary Material
Acknowledgments
We thank David L. Huso, who tragically passed away during the preparation of this manuscript, for his contribution to the experiments. This work was supported by The John Templeton Foundation; The Maryland Cigarette Restitution Fund; The Virginia and D. K. Ludwig Fund for Cancer Research; The Lustgarten Foundation for Pancreatic Cancer Research; The Sol Goldman Pancreatic Cancer Research Center; and NIH Grants P30-CA006973, R37-CA43460, R01-CA57345, R01-CA179991, R00-CA190889, and P50-CA62924.
Footnotes
The authors declare no conflict of interest.
Data deposition: All data are available on GitHub (https://github.com/cristomasetti/).
This article contains supporting information online at www.pnas.org/lookup/suppl/doi:10.1073/pnas.1905722116/-/DCSupplemental.
References
- 1.Araten D. J., et al. , A quantitative measurement of the human somatic mutation rate. Cancer Res. 65, 8111–8117 (2005). [DOI] [PubMed] [Google Scholar]
- 2.DeMars R., Held K. R., The spontaneous azaguanine-resistant mutants of diploid human fibroblasts. Humangenetik 16, 87–110 (1972). [DOI] [PubMed] [Google Scholar]
- 3.Drake J. W., Charlesworth B., Charlesworth D., Crow J. F., Rates of spontaneous mutation. Genetics 148, 1667–1686 (1998). [DOI] [PMC free article] [PubMed] [Google Scholar]
- 4.Tomasetti C., Vogelstein B., Parmigiani G., Half or more of the somatic mutations in cancers of self-renewing tissues originate prior to tumor initiation. Proc. Natl. Acad. Sci. U.S.A. 110, 1999–2004 (2013). [DOI] [PMC free article] [PubMed] [Google Scholar]
- 5.Welch J. S., et al. , The origin and evolution of mutations in acute myeloid leukemia. Cell 150, 264–278 (2012). [DOI] [PMC free article] [PubMed] [Google Scholar]
- 6.Armitage P., Doll R., The age distribution of cancer and a multi-stage theory of carcinogenesis. Br. J. Cancer 8, 1–12 (1954). [DOI] [PMC free article] [PubMed] [Google Scholar]
- 7.Nordling C. O., A new theory on cancer-inducing mechanism. Br. J. Cancer 7, 68–72 (1953). [DOI] [PMC free article] [PubMed] [Google Scholar]
- 8.Burch P. R., Natural and radiation carcinogenesis in man. I. Theory of initiation phase. Proc. R. Soc. Lond. B Biol. Sci. 162, 223–239 (1965). [DOI] [PubMed] [Google Scholar]
- 9.Frank S. A., Dynamics of Cancer: Incidence Inheritance, and Evolution (Princeton University Press, Princeton, NJ, 2007). [PubMed] [Google Scholar]
- 10.Hanson H. A., Smith K. R., Stroup A. M., Harrell C. J., An age-period-cohort analysis of cancer incidence among the oldest old, Utah 1973-2002. Popul. Stud. (Camb.) 69, 7–22 (2015). [DOI] [PMC free article] [PubMed] [Google Scholar]
- 11.Horiuchi S., Wilmoth J. R., Deceleration in the age pattern of mortality at older ages. Demography 35, 391–412 (1998). [PubMed] [Google Scholar]
- 12.Cook P. J., Doll R., Fellingham S. A., A mathematical model for the age distribution of cancer in man. Int. J. Cancer 4, 93–112 (1969). [DOI] [PubMed] [Google Scholar]
- 13.Vaupel J. W., et al. , Biodemographic trajectories of longevity. Science 280, 855–860 (1998). [DOI] [PubMed] [Google Scholar]
- 14.Albertini R. J., Nicklas J. A., O’Neill J. P., Robison S. H., In vivo somatic mutations in humans: Measurement and analysis. Annu. Rev. Genet. 24, 305–326 (1990). [DOI] [PubMed] [Google Scholar]
- 15.Cole J., Skopek T. R., International Commission for Protection Against Environmental Mutagens and Carcinogens. Working paper no. 3. Somatic mutant frequency, mutation rates and mutational spectra in the human population in vivo. Mutat. Res. 304, 33–105 (1994). [DOI] [PubMed] [Google Scholar]
- 16.Podolskiy D. I., Lobanov A. V., Kryukov G. V., Gladyshev V. N., Analysis of cancer genomes reveals basic features of human aging and its role in cancer development. Nat. Commun. 7, 12157 (2016). [DOI] [PMC free article] [PubMed] [Google Scholar]
- 17.Raveh-Amit H., Berzsenyi S., Vas V., Ye D., Dinnyes A., Tissue resident stem cells: Till death do us part. Biogerontology 14, 573–590 (2013). [DOI] [PMC free article] [PubMed] [Google Scholar]
- 18.Giangreco A., Qin M., Pintar J. E., Watt F. M., Epidermal stem cells are retained in vivo throughout skin aging. Aging Cell 7, 250–259 (2008). [DOI] [PMC free article] [PubMed] [Google Scholar]
- 19.Hendzel M. J., et al. , Mitosis-specific phosphorylation of histone H3 initiates primarily within pericentromeric heterochromatin during G2 and spreads in an ordered fashion coincident with mitotic chromosome condensation. Chromosoma 106, 348–360 (1997). [DOI] [PubMed] [Google Scholar]
- 20.Harding C., Pompei F., Wilson R., Corrections to: “Age distribution of cancer in mice”. Toxicol. Ind. Health 27, 265–270 (2011). [DOI] [PubMed] [Google Scholar]
- 21.Crossan G. P., Garaycoechea J. I., Patel K. J., Do mutational dynamics in stem cells explain the origin of common cancers? Cell Stem Cell 16, 111–112 (2015). [DOI] [PubMed] [Google Scholar]
- 22.Tomasetti C., Vogelstein B., Cancer etiology. Variation in cancer risk among tissues can be explained by the number of stem cell divisions. Science 347, 78–81 (2015). [DOI] [PMC free article] [PubMed] [Google Scholar]
- 23.Florian M. C., et al. , A canonical to non-canonical Wnt signalling switch in haematopoietic stem-cell ageing. Nature 503, 392–396 (2013). [DOI] [PMC free article] [PubMed] [Google Scholar]
- 24.Sinha M., et al. , Restoring systemic GDF11 levels reverses age-related dysfunction in mouse skeletal muscle. Science 344, 649–652 (2014). [DOI] [PMC free article] [PubMed] [Google Scholar]
- 25.Ciccocioppo R., et al. , Small bowel enterocyte apoptosis and proliferation are increased in the elderly. Gerontology 48, 204–208 (2002). [DOI] [PubMed] [Google Scholar]
- 26.Corazza G. R., et al. , Proliferating cell nuclear antigen expression is increased in small bowel epithelium in the elderly. Mech. Ageing Dev. 104, 1–9 (1998). [DOI] [PubMed] [Google Scholar]
- 27.Roncucci L., et al. , The influence of age on colonic epithelial cell proliferation. Cancer 62, 2373–2377 (1988). [DOI] [PubMed] [Google Scholar]
- 28.Tomasetti C., et al. , Role of stem-cell divisions in cancer risk. Nature 548, E13–E14 (2017). [DOI] [PubMed] [Google Scholar]
- 29.Tomasetti C., Li L., Vogelstein B., Stem cell divisions, somatic mutations, cancer etiology, and cancer prevention. Science 355, 1330–1334 (2017). [DOI] [PMC free article] [PubMed] [Google Scholar]
- 30.Tomasetti C., Vogelstein B., Cancer risk: Role of environment—Response. Science 347, 729–731 (2015). [DOI] [PubMed] [Google Scholar]
- 31.Tomasetti C., Vogelstein B., On the slope of the regression between stem cell divisions and cancer risk, and the lack of correlation between stem cell divisions and environmental factors-associated cancer risk. PLoS One 12, e0175535 (2017). [DOI] [PMC free article] [PubMed] [Google Scholar]
- 32.Hao L. Y., et al. , Short telomeres, even in the presence of telomerase, limit tissue renewal capacity. Cell 123, 1121–1131 (2005). [DOI] [PubMed] [Google Scholar]
- 33.Shay J. W., Wright W. E., Hallmarks of telomeres in ageing research. J. Pathol. 211, 114–123 (2007). [DOI] [PubMed] [Google Scholar]
- 34.Barker N., van Oudenaarden A., Clevers H., Identifying the stem cell of the intestinal crypt: Strategies and pitfalls. Cell Stem Cell 11, 452–460 (2012). [DOI] [PubMed] [Google Scholar]
- 35.Cameron I. L., Cell proliferation and renewal in aging mice. J. Gerontol. 27, 162–172 (1972). [DOI] [PubMed] [Google Scholar]
- 36.Wolf N. S., Penn P. E., Jiang D., Fei R. G., Pendergrass W. R., Caloric restriction: Conservation of in vivo cellular replicative capacity accompanies life-span extension in mice. Exp. Cell Res. 217, 317–323 (1995). [DOI] [PubMed] [Google Scholar]
Associated Data
This section collects any data citations, data availability statements, or supplementary materials included in this article.


