Abstract
Control of fatty acid storage and release in adipose tissue is fundamental in energy homeostasis and the development of obesity and type 2 diabetes. We here take the whole signalling network into account to identify how insulin and β-adrenergic stimulation in concert controls lipolysis in mature subcutaneous adipocytes obtained from non-diabetic and, in parallel, type 2 diabetic women. We report that, and show how, the anti-lipolytic effect of insulin can be fully explained by protein kinase B (PKB/Akt)-dependent activation of the phosphodiesterase PDE3B. Through the same PKB-dependent pathway β-adrenergic receptor signalling, via cAMP and PI3Kα, is anti-lipolytic and inhibits its own stimulation of lipolysis by 50%. Through this pathway both insulin and β-adrenergic signalling control phosphorylation of FOXO1. The dose–response of lipolysis is bell-shaped, such that insulin is anti-lipolytic at low concentrations, but at higher concentrations of insulin lipolysis was increasingly restored due to inhibition of PDE3B. The control of lipolysis was not altered in adipocytes from diabetic individuals. However, the release of fatty acids was increased by 50% in diabetes due to reduced reesterification of lipolytically liberated fatty acids. In conclusion, our results reveal mechanisms of control by insulin and β-adrenergic stimulation — in human adipocytes — that define a network of checks and balances ensuring robust control to secure uninterrupted supply of fatty acids without reaching concentrations that put cellular integrity at risk. Moreover, our results define how selective insulin resistance leave lipolytic control by insulin unaltered in diabetes, while the fatty acid release is substantially increased.
Keywords: beta-adrenergic signalling, human adipocytes, insulin resistance, insulin signalling, lipolysis, type 2 diabetes
Introduction
In the wake of pandemic overweight, type 2 diabetes (T2D) with its sequelae pose a serious threat to health globally. Insulin resistance and T2D are closely associated with overweight and obesity and appear to originate in an expanding adipose tissue. As a result of limited storage capacity in the adipocytes of the body, and/or increased lipolysis of stored triacylglycerol, fatty acids are stored elsewhere, in particular in muscles and the liver. This ectopic deposition of fat is believed to cause insulin resistance also in those tissues [1]. Indeed, the limited storage capacity of fat in the adipose tissue has been identified as a major trait of human insulin resistance and insulin-resistant cardiometabolic disease [2]. T2D, the metabolic syndrome, and insulin resistance are traditionally associated with increased circulating levels of fatty acids, although this has been challenged [3]. It has variously been reported that the ability of insulin to inhibit lipolysis — the anti-lipolytic effect of insulin — is impaired or not impaired in T2D: impaired in isolated adipocytes [4], but not in vivo [5]. Insulin inhibition of fatty acid release has, however, been found impaired in vivo [6–8]. To understand the pathogenesis of insulin resistance and T2D, it is necessary to know how insulin regulates storage and release of fatty acids in the adipocytes, and how this regulation integrates into the insulin signalling network that mediates the pleiotropic effects of the hormone — in the non-diabetic as well as diabetic states of human beings.
Insulin is the major regulator of energy homeostasis and its pleiotropic effects emanate from a highly branched intracellular signalling network in its metabolic target cells and tissues; primarily liver, muscle, and adipose tissue. In adipocytes, a major function of insulin is to control lipid storage and mobilization of fatty acids. These processes are controlled by insulin in conjunction with or in opposition to many other hormones, in particular, the catecholamines noradrenaline and adrenaline. The fat cell stores fatty acids esterified to glycerol as triacylglycerol in a cellular lipid droplet that in the mature adipocyte occupies >95% of the cell volume. Fatty acids are mobilized from the lipid droplet in the process of lipolysis. In lipolysis triacylglycerol is sequentially hydrolyzed by adipose tissue triacylglycerol lipase (ATGL, also referred to as PNPLA2), hormone-sensitive lipase (HSL) and monoacylglycerol lipase, reviewed in [9]. The hormonal control of lipolysis has been extensively examined in isolated murine adipocytes and 3T3-L1 adipocytes, and to some extent also in isolated human adipocytes. The primary stimulatory signal in this control is β-adrenergic receptor (βAR)-induced activation of adenylate cyclase to increase cellular concentrations of cAMP, which activates cAMP-dependent protein kinase (PKA) to phosphorylate a major constituent protein of the surface of the lipid droplet — perilipin-1 [10]. Phosphorylated perilipin-1 dissociates from the regulatory protein CGI58 and allows CGI58 (also referred to as ABHD5) to interact with ATGL and release its catalytic prowess to hydrolyze triacylglycerol to diacylglycerol [11]. PKA also phosphorylates HSL to enhance its catalytic activity [12–14] and, in conjunction with the phosphorylation of perilipin-1 at the lipid droplet surface, allows HSL to bind and with high efficiency hydrolyze the diacylglycerol. Thus produced monoacylglycerol is subsequently hydrolyzed to release glycerol by the constitutively active monoacylglycerol lipase [15].
Insulin counteracts the stimulation of lipolysis, and favours fatty acid storage as triacylglycerol, mainly by reversing the cAMP-induced phosphorylation of HSL and perilipin-1 by PKA [13,14,16]. Protein kinase B (PKB, also known as Akt) has been considered to mediate the anti-lipolytic effect of insulin by phosphorylation and activation of the phosphodiesterase-3B (PDE3B) that hydrolyzes cAMP to AMP [17,18]. The phosphorylation and activity of PKB are regulated upstream by mTORC2 (mammalian/mechanistic target of rapamycin in complex with rictor) and phosphoinositide-dependent protein kinase-1 (PDK1) that phosphorylate PKB at Ser473 and Thr308, respectively. However, this role of PKB has been challenged [19]: in PKBβ/Akt2-null adipocytes generated from immortalized mouse fibroblasts [20] and in differentiated mouse brown adipocytes expressing PDE3B mutants lacking the PKB phosphorylation site [21]. Also, fatty acid levels in serum were unaffected in mice lacking PKBβ/Akt2 [22]. The role of PKB in the control of lipolysis by insulin in human adipocytes remains a critical issue for our understanding of how fatty acid storage versus mobilization is regulated — normally and in T2D.
We have previously investigated the insulin signalling network, in isolated primary human adipocytes obtained from non-diabetic subjects and in parallel from patients with T2D, for control of glucose uptake [23,24], protein synthesis [25,26], ribosomal biogenesis [27], autophagy [26] and for transcriptional control mediated by Elk1 [25], and FOXO1 [24,27]. We have identified how attenuated signalling through mTORC1 (mammalian/mechanistic target of rapamycin in complex with raptor) [28] in conjunction with reduced abundance of specific signalling proteins, can explain the impaired signalling by insulin — network-wide — in T2D [23–27].
We have herein embarked on a systematic experimental analysis of the interactions between insulin and β-adrenergic signalling in the control of lipolysis in human primary adipocytes. This holistic approach revealed an unparalleled integration and complexity of control mechanisms that apparently serve to make fatty acids readily available, while containing lipolysis within boundaries. Our findings also revealed how the identified signalling network is affected in adipocytes from patients with T2D.
Materials and methods
Subjects
Informed consent was obtained from all participants. The procedures have been approved by the Regional Ethical Board, Linköping University, and were performed in accordance with the WMA Declaration of Helsinki. Adult women who were undergoing elective gynaecological abdominal surgery under general anaesthesia at the Department of Obstetrics and Gynaecology at the University Hospital in Linköping were recruited consecutively during the period April 2014–April 2019. A slice of subcutaneous tissue from the skin to muscle fascia was excised.
To ensure inclusion only of subjects with T2D related to obesity (diabesity), they were selected when diagnosed with T2D and obese/overweight (BMI ≥ 28). In the comparison group, the only selection criteria for non-diabetic subjects were that they were not diagnosed with diabetes and not obese (BMI ≤ 28). Thus, there may be overweight insulin-resistant subjects in the non-diabetic comparison group (patient data are given in the respective figure legend). The investigation is based on an analysis of freshly isolated adipocytes from many different subjects that each constitute a separate experiment. Each reported figure is therefore based on a set of experiments, the donor subjects of which are different. The subjects were all female and findings may therefore not in its entirety be applied to male subjects [29,30].
Materials
Monoclonal mouse anti-β-tubulin (T5201) was from Sigma–Aldrich (Stockholm, Sweden). Polyclonal rabbit anti-HSL-Ser552-P (#4139), anti-FOXO1-Ser256-P (#9461), anti-FOXO1 (#2880), anti-PKB-Ser473-P (#9271), anti-PKB-Thr308-P (#9275), anti-PKB (#9272) and anti-S6K1-Thr389-P (#9205) antibodies were from Cell Signaling Techn. (Danvers, MA, U.S.A.). Mouse monoclonal anti-HSL antibodies (sc-74489) were from Santa Cruz Biotechnology (Dallas, TX, U.S.A.). Isoproterenol (I5627), rapamycin (R0395), akti1/2 (A6730), wortmannin (W3144), A66 (SML1213), and 8-Br-cAMP (B7880) were from Sigma–Aldrich. TGX221 (10007349) was from Cayman Chem. (Ann Arbor, MI, U.S.A.). Torin-1 (#4247, Tocris Biosc. Oxford, U.K.), cilostamide (ab141273, Abcam, Cambridge, U.K.), and IPI549 (B-1971, Biovision Inc., Milpitas, CA, U.S.A.). Other chemicals were from Sigma–Aldrich unless otherwise stated.
Isolation and incubation of adipocytes
Adipocytes were isolated from subcutaneous adipose tissue by collagenase (type 1, Worthington, NJ, U.S.A.) digestion as described [13]. Cells, at 9% (vol/vol) in supplemented Krebs–Ringer solution, were incubated in a shaking water bath as described [31]. Experiments with the cells were initiated 20–40 min after cells were transferred to the incubation medium, introducing a variable background accumulation of glycerol and fatty acids that we have not corrected for. In all experiments (except when indicated) involving stimulation of lipolysis with 10 nM isoproterenol, the incubation time was limited to 10 min after addition of isoproterenol, because we found that isoproterenol-stimulated glycerol release was linear only up to 20 min of incubation. All controls were incubated with the vehicle.
SDS–PAGE and immunoblotting
Cell incubations were terminated by separating cells from the medium using centrifugation through dinonylphtalate. To minimize post-incubation signalling and protein modifications cells were immediately dissolved in SDS and β-mercaptoethanol with protease and protein phosphatase inhibitors, frozen within 10 s, and later thawed in boiling water for further processing, as described [13].
Immunoblotting after SDS–PAGE was evaluated by chemiluminescence imaging (Chemidoc Touch Imaging System, Bio-Rad, Hercules, CA, U.S.A.), or by near-infrared fluorescence imaging (Odyssey, Li-cor Biosciences, Lincoln, NE, U.S.A.). After adjusting the concentration of primary and secondary antibodies, the linearity of the signal to the amount of each specific protein or protein modification was ascertained in the respective imaging system. β-tubulin was used as a loading control and all samples were normalized for the amount of β-tubulin, which is not different between cells from non-diabetic and diabetic individuals [27]. In some cases blotting membranes were re-probed after stripping away bound antibodies (membranes incubated in 2% sodium dodecyl sulfate, 100 mM β-mercaptoethanol in 62.5 mM Tris–HCl, pH 6.7 at 60°C for ∼20 min). The efficacy of the stripping procedure was always checked by incubating the stripped membrane with the same secondary antibody. We present the phosphorylation of HSL and PKB, without normalizing for the amount of corresponding protein, in order to determine the total cellular abundance of the respective phosphorylated protein and not their fractional phosphorylation (in some cases, when relevant for understanding the mechanism of signalling, the total amount of the protein was determined). For comparison of the level of phosphorylation between cells from non-diabetic and diabetic subjects, a standard mix of adipocyte proteins was run in duplicate on each gel so that all samples were normalized to the mean intensity of the corresponding phosphorylated protein in the standard mix. We have expressed the phosphorylation as % of the phosphorylation after stimulation of the cells with isoproterenol only. In some cases we have expressed the phosphorylation relative the basal phosphorylation obtained in each individual experiment, the averages of these values are then reported as fold-over basal or control.
Determination of glycerol and fatty acids
Cell incubations were terminated by separating cells from the medium using centrifugation through dinonylphtalate and cell media were collected. The concentration of glycerol was measured in a coupled enzymatic colorimetric assay (Free Glycerol Reagent, F6428, Sigma–Aldrich) and the concentration of fatty acids was measured in an enzymatic colorimetric assay (Free Fatty Acid Quantification Kit, ab65341, Abcam), according to the manufacturers’ instructions. All samples were run in at least triplicates.
Determination of cyclic AMP
Cell incubations were terminated by separating cells from the medium using centrifugation through dinonylphtalate. To the cells, 0.1 M HCl was added to avoid degradation of cAMP, and samples were rapidly frozen. After thawing, cells were lysed by vortexing and sonication for 5 s in a sonicator bath. To remove cell debris and fat, the whole cell lysate was centrifuged for 5 min at 20 000×g and the infranatant was filtered through a 0.45-µm cellulose acetate membrane (centrifugation for 2 min at 10 000×g). cAMP was then measured in an ELISA assay (cAMP complete ELISA kit, ADI-901-163, Enzo Life Sciences, Farmingdale, NY, U.S.A.) according to manufacturer's instructions. All samples were run in triplicates.
Statistical analysis
We analyzed batches of adipocytes and results thus represent the average behaviour of the adipocytes. Every data point presented is the average of the indicated number of separate experiments/subjects (n). All experimental values are mean ± S.E. for the in figure legends indicated number (n) of different subjects (unless stated otherwise). Student's t-test or ANOVA was used with P < 0.05 considered significant. All statistical analyses were done with GraphPad Prism.
Results
We examined the responses to isoproterenol and insulin of freshly isolated mature human adipocytes. In the first part of this report, we define the structure of the complex interaction between insulin and β-adrenergic signalling in adipocytes from non-obese/non-diabetic women. In the last part, we proceed to identify how the control of lipolysis is affected in adipocytes obtained from obese women with T2D.
Bell-shaped lipolytic dose–response to insulin
We examined the ability of insulin to block isoproterenol-stimulated lipolysis. In order to stimulate βARs only, we used isoproterenol and not the physiological hormone noradrenalin/adrenalin. We examined lipolysis in the presence of varying concentrations of insulin against a fixed sub-maximal 10 nM concentration of isoproterenol [32].
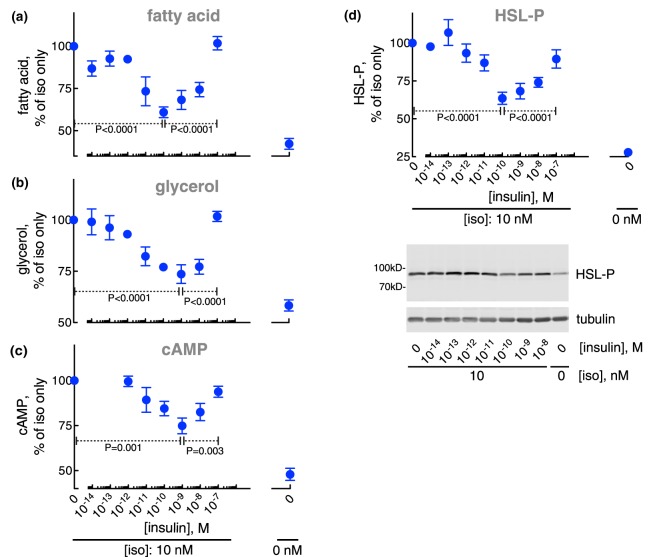
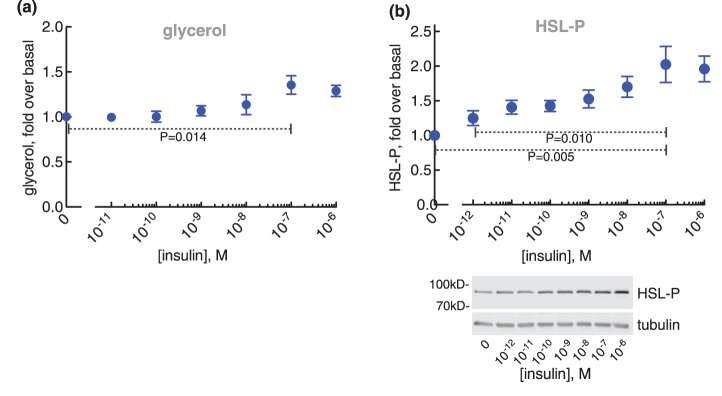
The anti-lipolytic effect of insulin was maximal at ∼0.1 nM with a half-maximal effect at ∼0.01 nM. At higher concentrations of insulin, the anti-lipolytic effect ceased and lipolysis was progressively restored (Figure 1a,b)1 with half-maximal effect at ∼10 nM insulin. At 100 nM insulin lipolysis was restored. The bell-shaped response to insulin of fatty acid and glycerol release mirrored the accumulation of cAMP (Figure 1c) and the phosphorylation of HSL (Figure 1d). This indicates that both phases of insulin control of lipolysis are exerted via control of the levels of cAMP. A biphasic response to insulin inhibition of glycerol release has previously been reported in explants of human adipose tissue, and in intact and digitonin-permeabilized rat adipocytes [33–37].
Figure 1. Control of lipolysis.
Adipocytes from non-diabetic subjects were incubated with the indicated concentration of insulin for 15 min, when 10 nM isoproterenol (iso) was added and cells incubated for another 10 min. Cells were then separated from medium and fatty acids (n = 26) (a), and glycerol (n = 37) (b) were determined in the medium, and cAMP (n = 20) (c) and the phosphorylation of HSL (n = 19) (d) were determined in the cells. Indicated are P-values for the effect of 0.1 nM insulin compared with no insulin, and to 100 nM insulin, respectively, on isoproterenol-stimulated cells (a–d). Representative immunoblots of one experiment are shown (d).
To understand the integrated insulin and isoproterenol signalling network in control of lipolysis, as revealed in the dose–response curves of Figure 1, we proceed to dissect the network using inhibitors of specific signal mediators. We begin to analyze how isoproterenol alone affects the signalling network, and proceed to analyze the anti-lipolytic effect of insulin, and then we analyze the mechanisms behind the restoration of lipolysis by high concentrations of insulin.
mTORC2 mediates an anti-lipolytic effect of β-adrenergic signalling, but mTORC1 is not involved in the control of lipolysis
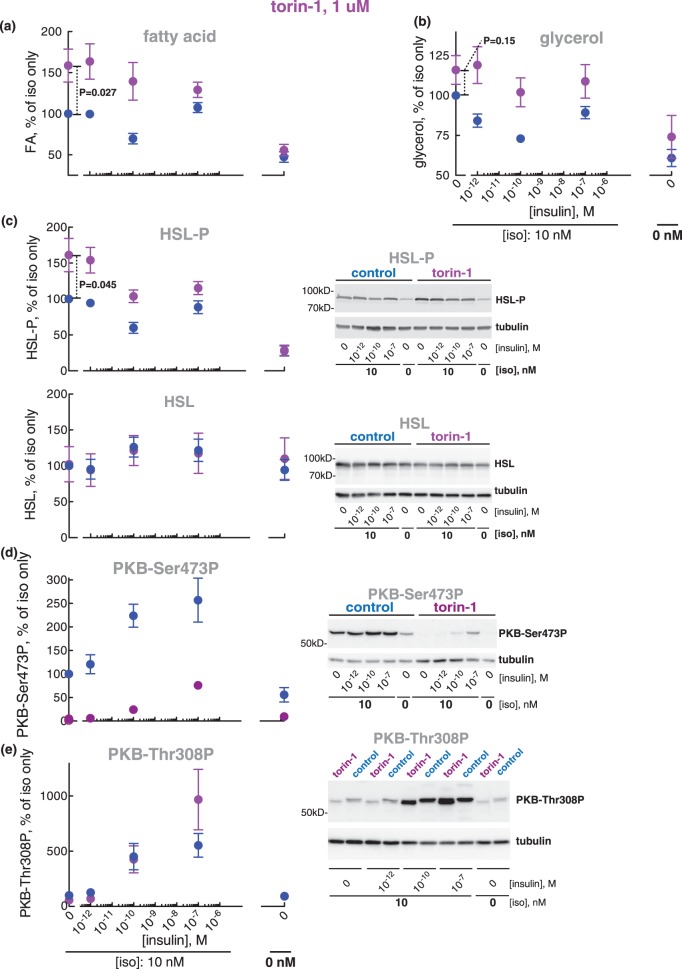
Torin-1 is an ATP-competing inhibitor of mTOR (the catalytic protein kinase subunit common to mTORC1 and mTORC2) that inhibits both mTORC1 and mTORC2. Unexpectedly, torin-1 appeared to enhance lipolysis in response to isoproterenol (Figure 2a,b)1,2 and correspondingly increase the phosphorylation of HSL (Figure 2c). Torin-1 did, however, not affect basal lipolysis (Figure 2a,b) or basal level of HSL phosphorylation (Figure 2c).
Figure 2. Effect of torin-1 at 1 µM on lipolysis.
Adipocytes were pre-incubated without (blue) or with 1 µM torin-1 for 30 min (magenta), when the indicated concentration of insulin was added and cells incubated for 15 min before incubation with 10 nM isoproterenol (iso) for another 10 min. Cells were then separated from medium and fatty acids (n = 7) (a) and glycerol (n = 5) (b) were determined in the medium. The phosphorylation of HSL (n = 6) (c, upper panel) and HSL protein (n = 4) (c, lower panel), the phosphorylation of PKB at Ser473 (n = 7) (d) and of PKB at Thr308 (n = 3) (e) were determined in the cells. Indicated are P-values for the effect of torin-1 in isoproterenol-stimulated cells (a–c). Representative immunoblots of one experiment are shown (c–e).
In contrast, rapamycin (a specific inhibitor of mTORC1) had no effect on the release of fatty acids or glycerol, or on the phosphorylation of HSL, or on the cellular concentration of cAMP in adipocytes stimulated with isoproterenol, with or without insulin at different concentrations (Supplementary Figure S1a–d). We ascertained the efficacy of rapamycin to inhibit the insulin-induced phosphorylation of ribosomal protein S6 kinase (S6K1) by mTORC1 under these conditions (Supplementary Figure S1e).
These findings suggest that β-adrenergic stimulation of human fat cells simultaneously stimulates and inhibits lipolysis, such that inhibition of mTORC2, but not mTORC1, releases the inhibition and thus exposes a — novel — inhibitory aspect of β-adrenergic control of lipolysis (the anti-lipolytic effect of β-adrenergic signalling).
PKB mediates the anti-lipolytic effect of β-adrenergic signalling
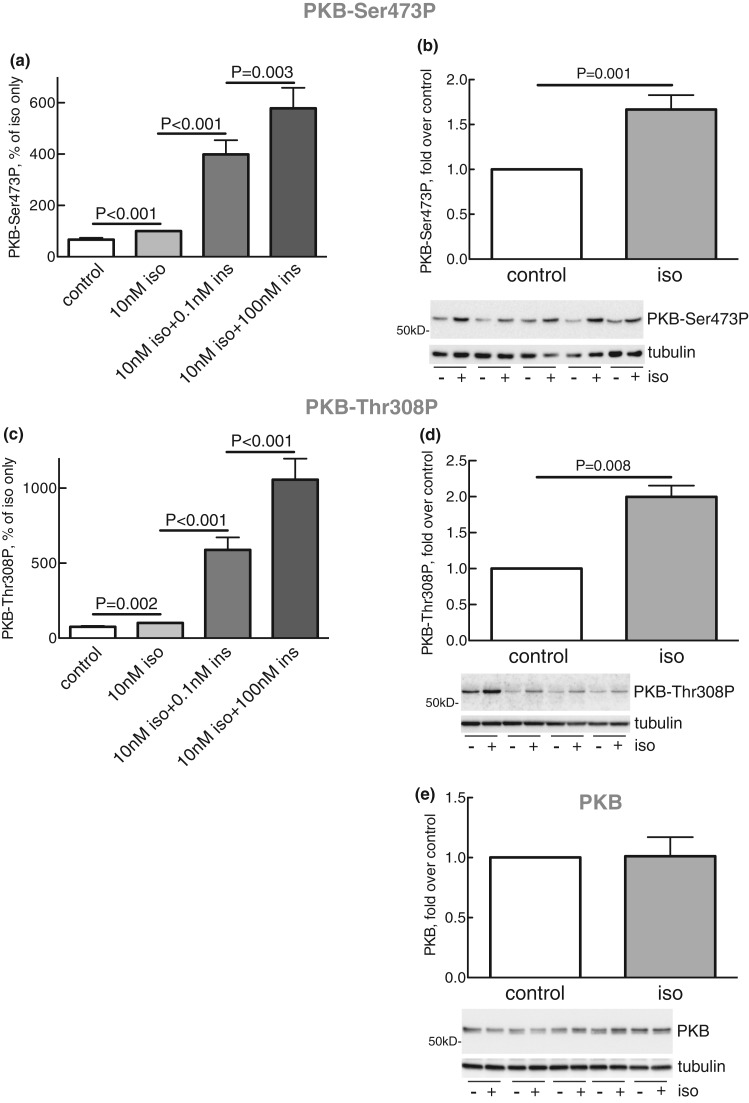
Isoproterenol stimulated the phosphorylation of PKB both at Ser473 (Figure 3a,b) and Thr308 (Figure 3c,d),3 and insulin further strongly increased the phosphorylation at both sites (Figure 3a,c). It can be noted that isoproterenol, compared with the maximal effect of isoproterenol + insulin, increased the phosphorylation at Ser473 markedly more than at Thr308. The phosphorylation of PKB at Ser473 (Figure 2d) in response to isoproterenol was completely blocked by inhibition of mTORC2 with torin-1, and the phosphorylation at Thr308 (Figure 2e) was also reduced. In contrast, inhibition of mTORC1 with rapamycin had no effect on the phosphorylation of PKB at Ser473 (Supplementary Figure S1f). Our findings thus indicate that PKB is involved in mediating the anti-lipolytic effect of isoproterenol. We therefore directly examined the involvement of PKB in mediating the anti-lipolytic effect of isoproterenol using the akti1/2 inhibitor of PKB.
Figure 3. Effects of isoproterenol on phosphorylation of PKB.
The phosphorylation of PKB at Ser473 (a) and Thr308 (c) in adipocytes in response to 10 nM isoproterenol (iso) and the indicated concentration of insulin (ins) was obtained from the experiments in Figures 2d, 4d, 6c, 7b, 10a, 11a,d and Supplementary Figures S1f and S2b,d (n = 47) (a), and Figures 2e, 4e, 6d, 7c, 10b, and 11b,e (n = 32) (c). The phosphorylation of PKB at Ser473 (n = 13) (b) and Thr308 (n = 4) (d), and the amount of PKB protein (n = 5) (e) were also separately determined in response to 10 nM isoproterenol (iso) for 10 min, when the adipocytes were separated from the medium and the phosphorylation of PKB or the amount of PKB protein determined in the cells. Representative immunoblots are shown from five (b), four (d) and five (e) separate experiments/subjects (underlined).
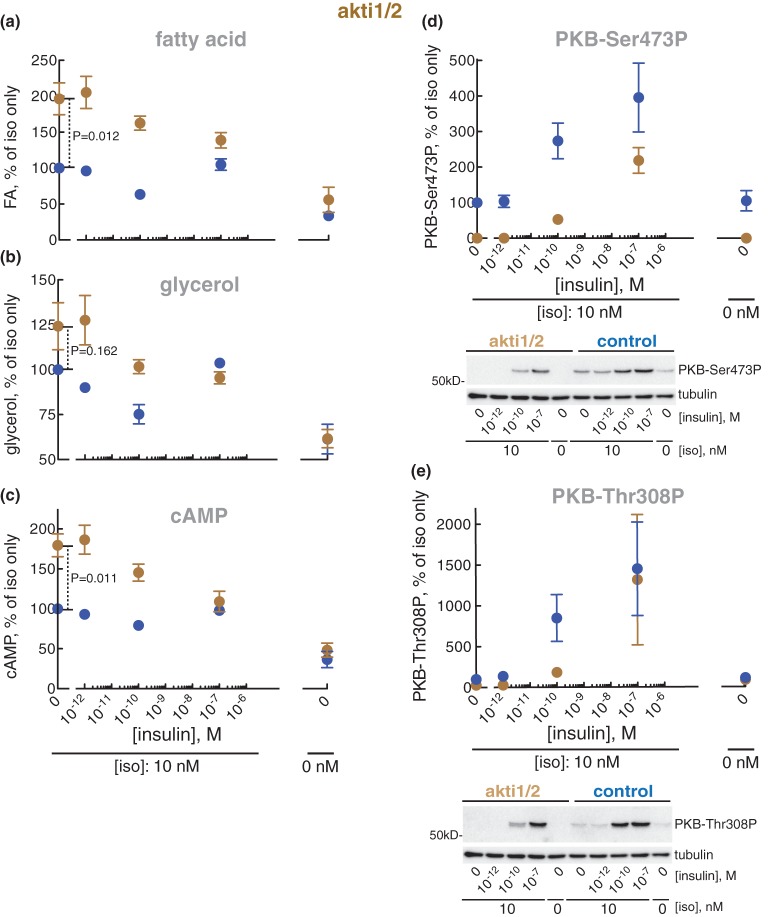
Inhibition of PKB with akti1/2 blocked the anti-lipolytic effect of isoproterenol (i.e. akti1/2 enhanced the isoproterenol-stimulated lipolysis just as torin-1-inhibition of mTORC2) (Figure 4a,b), as well as the accumulation of cAMP in the adipocytes (Figure 4c). Akti1/2 likewise completely blocked the phosphorylation of PKB at Ser473 and Thr308 in response to isoproterenol (Figure 4d,e). The anti-lipolytic action of isoproterenol can thus be accounted for by activation of mTORC2 and the downstream activation of PKB by its phosphorylation at Ser473, although phosphorylation at Thr308 likely contributes.
Figure 4. Effect of akti1/2 on lipolysis.
Adipocytes were pre-incubated without (blue) or with 20 µM akti1/2 for 60 min (brown), when the indicated concentration of insulin was added and cells incubated for 15 min before incubation with 10 nM isoproterenol (iso) for another 10 min. Cells were then separated from medium and fatty acids (n = 5) (a) and glycerol (n = 4) (b) were determined in the medium, and cAMP (n = 4) (c), phosphorylation of PKB at Ser473 (n = 4) (d) and Thr308 (n = 4) (e) were determined in the cells. Indicated are P-values for the effect of akti1/2 in isoproterenol-stimulated cells (a–c). Representative immunoblots of one experiment are shown [blots in (d) and (e) are from the same experiment, hence identical β-tubulin blots].
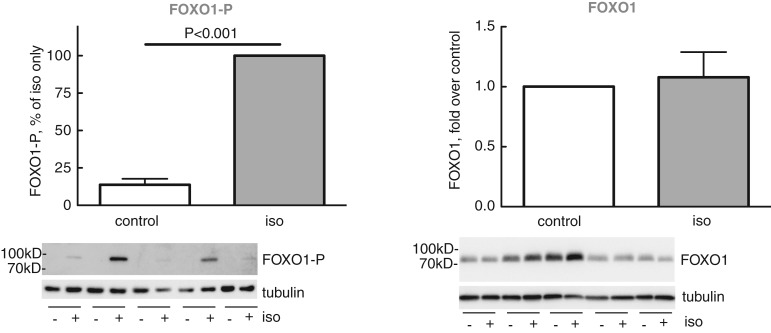
Activation of mTORC2 → PKB-Ser473 constitutes a major branch of the insulin signalling network, mediating insulin's control of transcription factor FOXO1 in human adipocytes and thereby transcriptional control of metabolism ([24,27] and references therein). We, therefore, examined if stimulation of this pathway by isoproterenol, similar to insulin, enhances the phosphorylation of FOXO1. Indeed, isoproterenol enhanced the state of phosphorylation of FOXO1 at Ser256 (Figure 5), demonstrating that isoproterenol stimulates the same mTORC2 → PKB-Ser473 signalling branch as insulin does. This finding also extends the function of β-adrenergic control of human adipocytes to transcriptional control via FOXO1 — the physiological role which remains to be investigated.
Figure 5. Effect of isoproterenol on phosphorylation of FOXO1.
Adipocytes were incubated without or with 10 nM isoproterenol (iso) for 10 min. Cells were then separated from medium and phosphorylation of FOXO1 at Ser256 was determined in the cells (n = 8) (left panel). The amount of FOXO1 protein was determined separately (n = 5) (right panel). Representative immunoblots of five experiments/subjects (underlined) are shown (left panel, from the same experiment as in Figure 3a right panel, hence identical β-tubulin blots).
In aggregate, so far, our findings demonstrate an anti-lipolytic action of β-adrenergic signalling, which is mediated by phosphorylation of PKB. Importantly, insulin and β-adrenergic signalling share the pathway mTORC2 → PKB-Ser473 for control of FOXO1.
PI3Kα mediates the anti-lipolytic activity of β-adrenergic signalling
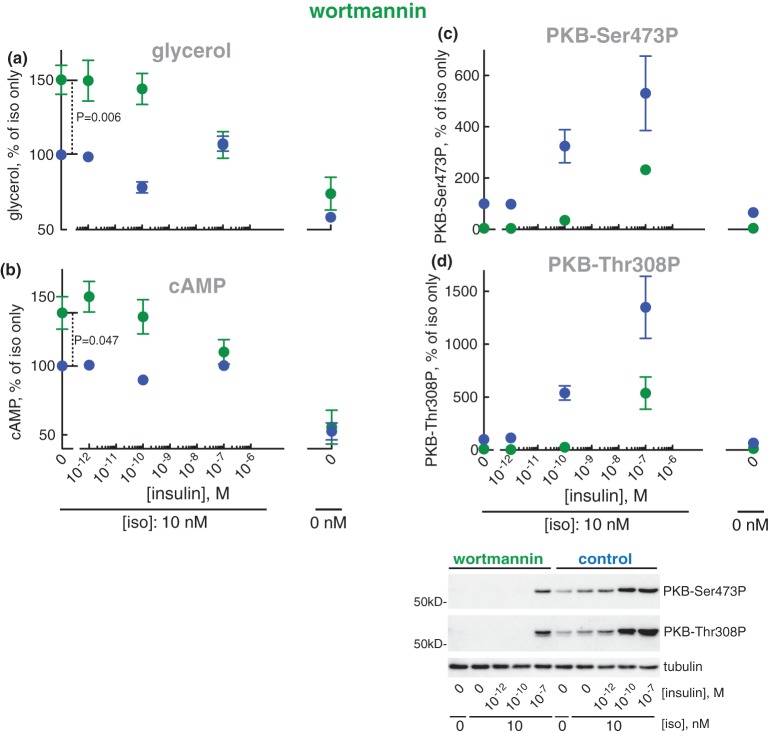
We next examined the effect of inhibiting phosphatidyl inositol 3-kinases (PI3Ks) with wortmannin (a pan-class I PI3K inhibitor [38]). Inhibition of PI3Ks with wortmannin increased lipolysis (Figure 6a) and the concentration of cAMP (Figure 6b) in response to isoproterenol. It should be noted that wortmannin increased lipolysis and the cAMP level in response to isoproterenol in the same way as inhibition of mTOR (Figure 2) or inhibition of PKB (Figure 4). Wortmannin inhibits PI3K upstream mTORC2 → PKB, as wortmannin inhibited the phosphorylation of PKB at Ser473 in response to isoproterenol (Figure 6c) as well as the effect of isoproterenol on phosphorylation of PKB at Thr308 (Figure 6d).
Figure 6. Effect of wortmannin on lipolysis.
Adipocytes were pre-incubated without (blue) or with 0.5 µM wortmannin for 30 min (green), when the indicated concentration of insulin was added and cells incubated for 15 min before incubation with 10 nM isoproterenol (iso) for another 10 min. Cells were then separated from medium and glycerol released to the medium was determined (n = 5) (a), and cAMP (n = 9) (b), phosphorylation of PKB at Ser473 (n = 6) (c) and Thr308 (n = 6) (d) were determined in the cells. Indicated are P-values for the effect of wortmannin in isoproterenol-stimulated cells (a and b). Representative immunoblots of one experiment are shown (c and d).
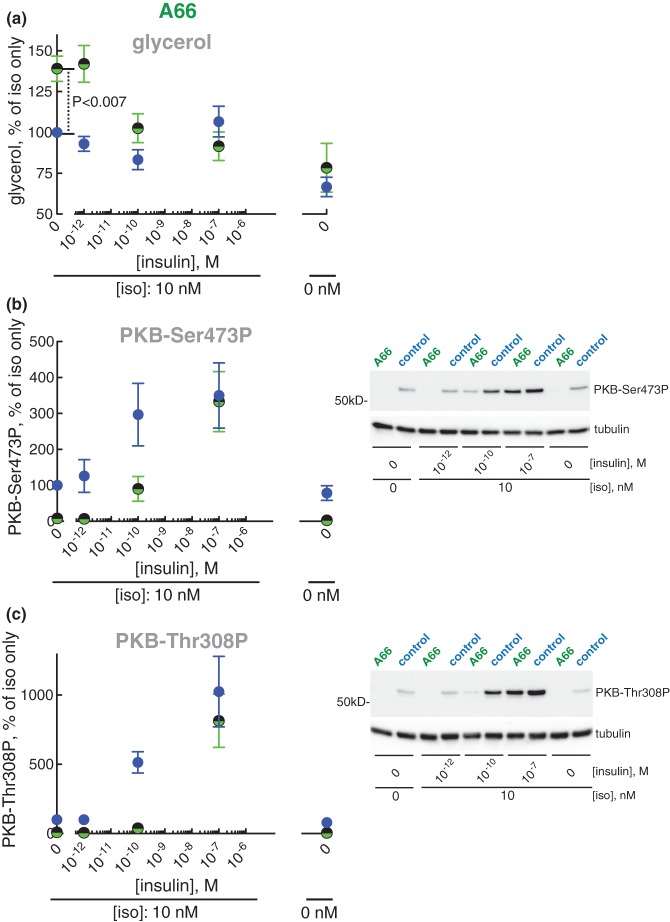
Wortmannin is a potent inhibitor of class I PI3Ks, but poorly inhibits PI3Ks of class II and III. To reveal the identities of the specific isoform(s) of class I PI3K responsible for mediating the anti-lipolytic effect of isoproterenol we examined the role of class I PI3Kα, -β and -γ using inhibitors that preferentially inhibit one of the isoforms. Inhibition of PI3Kα by A66 increased lipolysis stimulated by isoproterenol, i.e. the inhibitor inhibited the anti-lipolytic effect of isoproterenol (Figure 7a), while inhibitors of the β- or γ-isoform (TGX221 and IPI549, respectively) had no effect (Supplementary Figure S2a,c). Interestingly, these effects of the inhibitors on lipolysis were mirrored in their effect, or lack of effect, on the downstream phosphorylation of PKB (Figure 7b,c and Supplementary Figure S2b,d).
Figure 7. Effect of PI3K-inhibitor A66 on lipolysis.
Adipocytes were pre-incubated without (blue) or with 10 µM inhibitor A66 of PI3Kα (green/black) for 30 min when the indicated concentration of insulin was added and cells incubated for 15 min before incubation with 10 nM isoproterenol (iso) for another 10 min. Cells were then separated from medium and glycerol released to the medium was determined (n = 5) (a), and the phosphorylation of PKB at Ser473 (n = 6) (b) and Thr308 (n = 4) (c) was determined in the cells. Indicated is P-value for the effect of A66 in isoproterenol-stimulated cells (a). Representative immunoblots of one experiment are shown (b and c).
Our findings thus show that activation of mTORC2/PDK1 → PKB in response to isoproterenol is mediated by class I PI3Kα with no or little involvement of PI3Kβ or -γ.
The anti-lipolytic mechanism of β-adrenergic signalling is mediated by cAMP
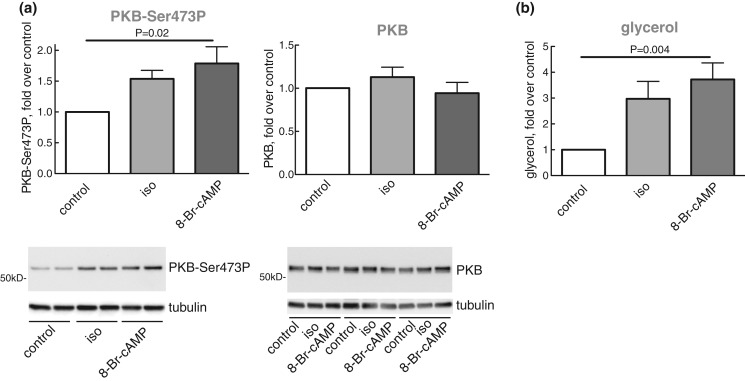
To examine the role of cAMP in mediating the anti-lipolytic mechanism of β-adrenergic signalling, we incubated the adipocytes with the cell-permeable cAMP analogue 8-Br-cAMP. Indeed, similar to isoproterenol, 8-Br-cAMP enhanced the phosphorylation of PKB at Ser473 (Figure 8a), as well as lipolysis (Figure 8b), which is compatible with cAMP → PI3Kα → mTORC2 → PKB-Ser473 mediating the anti-lipolytic activity of isoproterenol. Both PKA and guanine exchange factor directly activated by cAMP (Epac) are known to mediate effects of cAMP. We have, however, not further examined how cAMP controls PI3Kα.
Figure 8. Effects of isoproterenol and 8-Br-cAMP on lipolysis and phosphorylation of PKB.
Adipocytes were pre-incubated without or with 10 nM isoproterenol (iso) or with 4 mM 8-Br-cAMP, as indicated, (n = 8) for 10 min. Cells were then separated from medium and phosphorylation of PKB at Ser473 and the abundance of PKB protein (a), and the release of glycerol (b) were determined in cells and medium, respectively. Representative immunoblots of one experiment in duplicate (underlined, PKB-Ser473P) or three experiments (underlined, PKB protein) are shown.
We can thus summarize the mechanism of the anti-lipolytic action of β-adrenergic signalling as enhanced degradation of cAMP according to the following scheme: cAMP → PI3Kα → mTORC2/PDK1 → PKB.
Anti-lipolysis by isoproterenol and by insulin is dependent on PDE3B to hydrolyze cAMP
Under all circumstances that we have examined, the concentration of cAMP covaried with lipolysis and with the phosphorylation of HSL, indicating that decreased phosphorylation of HSL, which is not driven by reduced cAMP concentration cannot explain the correlation between lipolysis and cAMP. To examine the role of PDE3B in the anti-lipolytic action of insulin and isoproterenol in human adipocytes we next inhibited this enzyme in the cells.
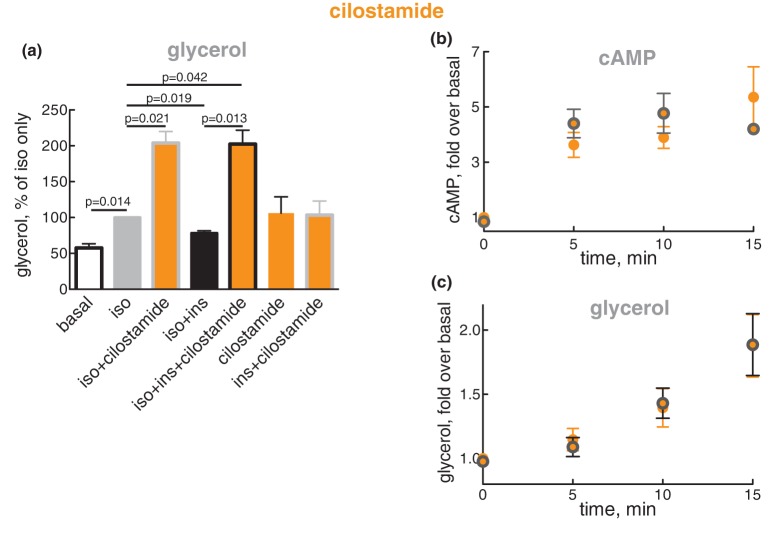
Cilostamide is specific for inhibition of PDE3 [39], and PDE3B is the dominant isoform in adipose tissue [40,41]. Cilostamide by itself, or in the presence of insulin, appeared to increase glycerol release (Figure 9a), indicating basal production and hydrolysis by PDE3 of cAMP. Isoproterenol increased lipolysis, which in the presence of cilostamide was increased even further — due to blockade of the anti-lipolytic action of isoproterenol by cilostamide. This demonstrates that the anti-lipolytic action of β-adrenergic signalling is largely mediated by PDE3. Insulin, as expected, inhibited the isoproterenol-stimulated lipolysis, but had no effect on lipolysis when PDE3 was inhibited by cilostamide — demonstrating that also the anti-lipolytic activity of insulin is largely mediated by PDE3.
Figure 9. Effect of insulin on the accumulation of cAMP and lipolysis in the presence of PDE3B inhibitor cilostamide.
(a) Adipocytes were pre-incubated without or with 10 µM cilostamide for 30 min, and then without or with 0.1 nM insulin (ins) for 15 min, followed by without or with 10 nM isoproterenol (iso) for a further 10 min, as indicated. After the separation of cells and medium, glycerol was determined in the medium (n = 5). The significance of selected comparisons is indicated. (b and c) Adipocytes were pre-incubated with 10 µM cilostamide for 30 min, and then without (orange) or with (orange with grey border) 0.1 nM insulin for 15 min, when 10 nM isoproterenol (iso) was added and the cells incubated for the indicated time. After separation of cells and medium, cAMP was determined in the cells (n = 5) (b) and glycerol in the medium (n = 5) (c).
We then inhibited PDE3 and examined the time-course for the accumulation of cAMP in response to isoproterenol in the absence or presence of 10−10 M insulin (concentration of maximal anti-lipolysis). Within 5 min of isoproterenol addition, the concentration of cAMP in the cells rose to a maximum and then remained at that level, and this was not affected by the presence of insulin (Figure 9b). Within 5 min, also lipolysis proceeded at a maximal rate of glycerol release, sustained for at least 15 min (the longest time examined), and insulin did not affect this process either (Figure 9c). The inability of insulin — at its maximal anti-lipolytic concentration and in the presence of cilostamide — to affect the concentration of cAMP or the rate of lipolysis, excludes insulin-regulation of adenylate cyclase or any other non-cilostamide-affected process as a mechanism of insulin to reduce the concentration of cAMP and inhibit lipolysis.
We can conclude that in human adipocytes the anti-lipolytic activity of both β-adrenergic signalling and insulin is dependent on the disposal of cAMP by PDE3 — likely PDE3B, which for insulin is in accordance with PDE3B-null mice [42].
We next proceed to analyze the mechanisms of the anti-lipolytic effect of insulin in human adipocytes.
PKB and PI3Kα mediates the anti-lipolytic effect of insulin
Inhibition of phosphorylation of PKB with akti1/2 failed to affect anti-lipolysis at 10−10 M insulin (Figure 4a–c). However, akti1/2 also failed to completely inhibit PKB at both Ser473 and Thr308 under these conditions (Figure 4d,e).
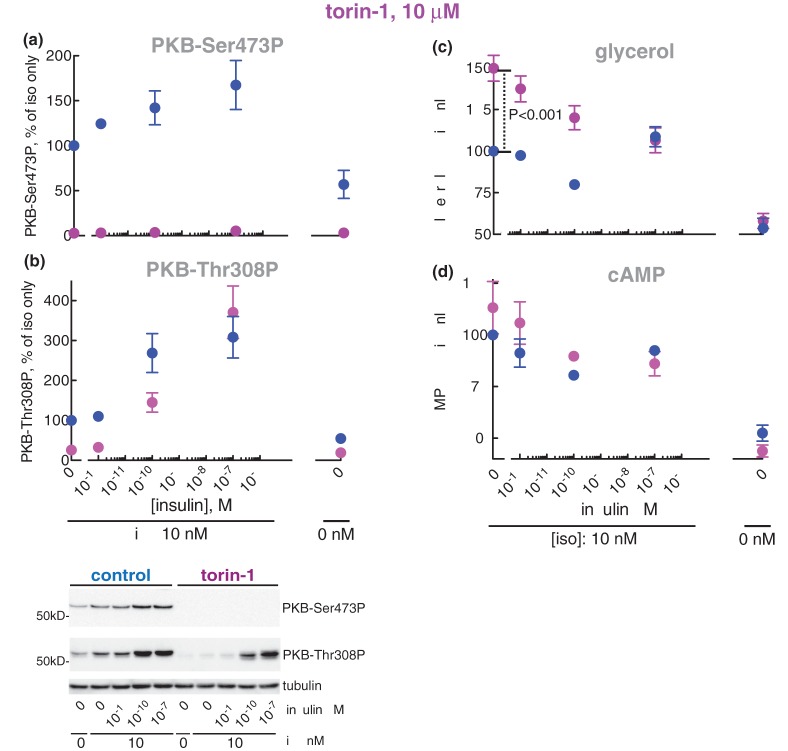
Inhibition of mTORC2 with torin-1 did not block the anti-lipolytic effect of insulin at 10−10 M (Figure 2a,b) nor the reduced phosphorylation of HSL (Figure 2c). Although torin-1 at 1 µM completely blocked the increased phosphorylation of PKB at Ser473 in response to isoproterenol (Figure 2d), torin-1 did not completely inhibit mTORC2 and the phosphorylation of PKB at Ser473 in the combined presence of isoproterenol and insulin (Figure 2d). We thus increased the concentration of torin-1, and at 10 µM torin-1 completely inhibited mTORC2-catalyzed phosphorylation of PKB at Ser473 (Figure 10a), but the phosphorylation of PKB at Thr308 in response to 10−10 M insulin was only partially inhibited (Figure 10b). The anti-lipolytic action (Figure 10c) and the reduction of cAMP concentration (Figure 10d) in response to insulin remained unperturbed by the mTORC2 inhibition.
Figure 10. Effect of torin-1 at 10 µM on lipolysis.
Adipocytes were pre-incubated without (blue) or with 10 µM torin-1 (magenta) for 30 min, when the indicated concentration of insulin was added and cells incubated for 15 min before incubation with 10 nM isoproterenol (iso) for another 10 min. Cells were then separated from medium and the phosphorylation of PKB at Ser473 (n = 4) (a) and Thr308 (n = 5) (b), and cAMP (n = 3) (d) was determined in the cells, and glycerol (n = 8) (c) determined in the medium. Indicated is P-value for the effect of torin-1 in isoproterenol-stimulated cells (c). Representative immunoblots of one experiment are shown (a and b).
However, inhibition of PI3Ks with wortmannin blocked anti-lipolysis in response to 10−10 M insulin (Figure 6a) as well as the inhibition of accumulation of cAMP (Figure 6b). Importantly, inhibition of PI3Ks with wortmannin also inhibited the downstream phosphorylation of PKB at Ser473 (Figure 6c) and Thr308 (Figure 6d) at 10−10 M insulin. This demonstrates that the anti-lipolytic effect of insulin is mediated by a class I PI3K, and that complete inhibition of the phosphorylation of PKB at both Ser473 and Thr308 is associated with inhibition of anti-lipolysis by insulin.
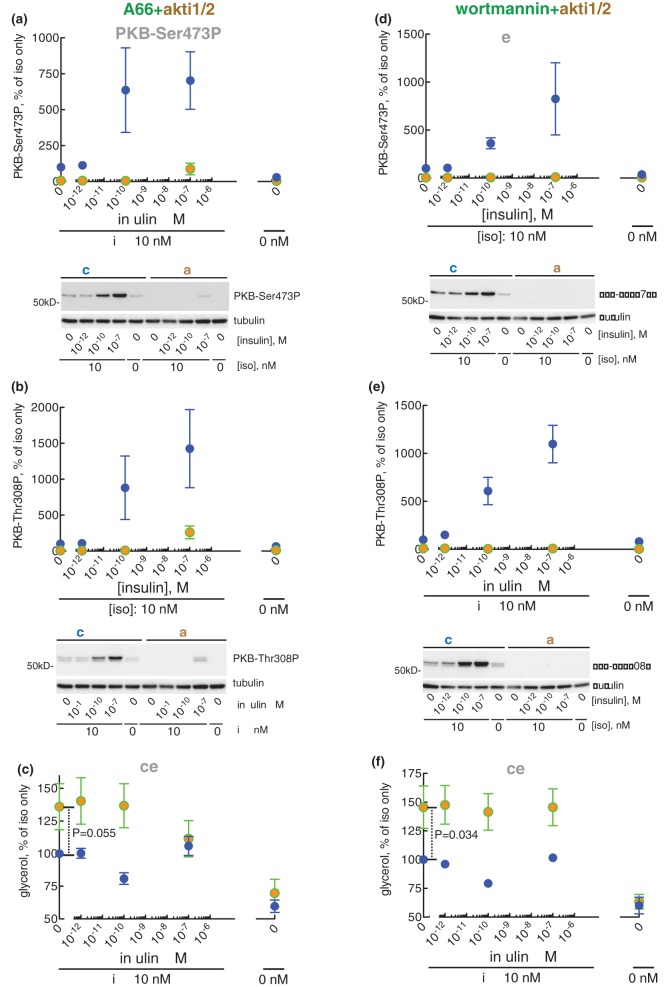
Separate inhibition of the α-, β- and γ-isoform of PI3K (with A66, TGX221, and IPI549, respectively) did not affect anti-lipolysis (Figure 7a and Supplementary Figure S2a,c) in response to insulin. Inhibition of PI3Kβ or -γ also had no effect on the phosphorylation of PKB (Supplementary Figure S2b,d). In contrast, inhibition of PI3Kα with A66 inhibited the phosphorylation of PKB (Figure 7b,c), but not completely at 10−10 M insulin. This prompted us to combine A66-inhibition of PI3Kα with akti1/2-inhibition of PKB, which turned out to completely inhibit the phosphorylation of PKB at both Ser473 and Thr308 (Figure 11a,b) although neither compound alone was effective. Consequent to the complete inhibition of PKB phosphorylation, also the anti-lipolytic activity of insulin at 10−10 M was inhibited (Figure 11c), again although neither compound alone was effective. It is interesting that the complete inhibition of phosphorylation of PKB at either Ser473 by torin-1 (Figure 10a) or Thr308 by A66 (Figure 7c) was insufficient to block anti-lipolysis in response to 10−10 M insulin (Figures 10c and 7a, respectively). Taken together this suggests a complete dependence on phosphorylation/activation of PKB for the anti-lipolytic action of insulin. Moreover, either phosphorylation site can support anti-lipolytic signalling, with very low levels of phosphorylated PKB being sufficient.
Figure 11. Effect of A66 + akti1/2 and wortmannin + akti1/2 on lipolysis.
Adipocytes were pre-incubated without (blue) (a–f), with 10 µM A66 + 20 µM akti1/2 (a–c) (green and brown), or with 0.5 µM wortmannin + 20 µM akti1/2 (d–f) (green and brown) for 30 min, when the indicated concentration of insulin was added and cells incubated for 15 min before incubation with 10 nM isoproterenol (iso) for another 10 min. Cells were then separated from medium and the phosphorylation of PKB at Ser473 (a and d) or Thr308 (b and e) was determined in the cells, and glycerol released to the medium was determined (c and f) (n = 5). Indicated are P-values for the effect of indicated inhibitors in isoproterenol-stimulated cells (c and f). Representative immunoblots of one experiment are shown [blots in (a) and (b), and in (d) and (e), respectively, are from the same experiment, hence identical β-tubulin blots].
In aggregate, our findings demonstrate that in human adipocytes the anti-lipolytic action of insulin is mediated by PI3Kα activation of mTORC2 and likely PDK1 to phosphorylate PKB at Ser473 and Thr308, respectively. Low levels of phosphorylated PKB, in turn, activates PDE3B, which is required for anti-lipolysis in response to insulin: PI3Kα → mTORC2/PDK1 → PKB-Ser473/Thr308 → PDE3B.
Maximal lipolysis at all concentrations of insulin with completely inhibited PKB
Inhibition of the phosphorylation of PKB maximized the lipolytic response to isoproterenol (Figures 2b, 4b, 6a, 7a, 10c, 11c, 11f). On average, inhibition of PKB (with akti1/2, torin-1, A66 or wortmannin) increased isoproterenol-stimulated lipolysis 2.0 ± 0.1 fold (mean ± S.E., n = 7, P < 0.001). It should be noted that without any inhibitor (direct or indirect) of PKB, isoproterenol-stimulated lipolysis was never maximal (Figure 1). Inhibition of the phosphorylation of PKB (with wortmannin or with A66 + akti1/2) led also to maximal lipolysis at the maximally anti-lipolytic (10−10 M) concentration of insulin (Figures 6a and 11c). However, none of the inhibitors managed to increase lipolysis, which remained sub-maximal, at 10−7 M insulin. Likewise, none of the inhibitors completely blocked the phosphorylation/activation of PKB at this concentration of insulin. In order to block phosphorylation of PKB at 10−7 M insulin, we combined wortmannin with akti1/2. Indeed, the combined presence of the two inhibitors completely blocked the phosphorylation of PKB at Ser473 (Figure 11d) and at Thr308 (Figure 11e), and led to maximal lipolysis at all concentrations of insulin (Figure 11f). Expressed the other way around, the anti-lipolytic action of insulin and of isoproterenol requires phosphorylation/activation of PKB.
We can now conclude that phosphorylated PKB uniquely mediates inhibition of lipolysis in response to β-adrenergic and insulin stimuli, and that very low levels of phosphorylated PKB are sufficient to inhibit lipolysis.
The bell-shaped dose–response to insulin
We sought to understand how the lipolytic activity is restored at high concentrations of insulin (apparent at concentrations of insulin ≥ 10−9 M): the bell-shaped dose–response in Figure 1. This is clearly an insulin-driven and cAMP-mediated process as the restoration of lipolysis is paralleled by an increased cellular concentration of cAMP (Figures 1c, 4c, 6b, 10d and Supplementary Figure S1c). The cAMP/PKA-dependent activation of PDE3B may contribute but cannot explain the bell-shaped dose–response. Neither can the restoration of lipolysis be explained by dephosphorylation of PKB, as PKB was highly/maximally phosphorylated under these conditions (e.g. Figure 11d,e).
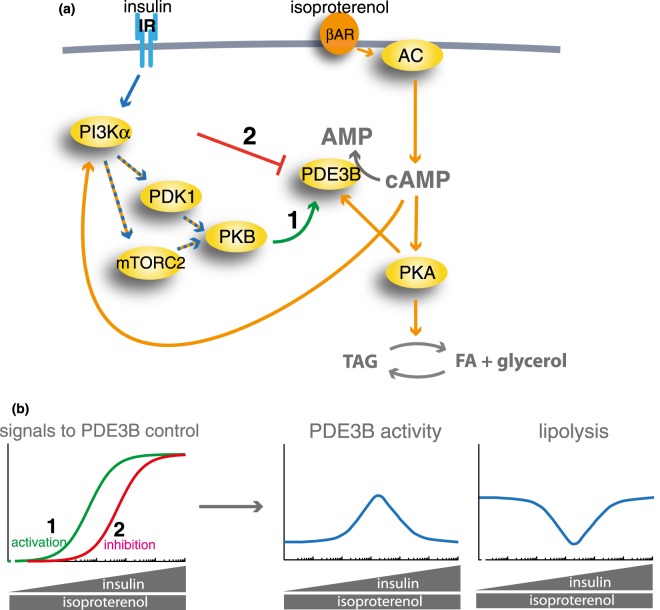
To illustrate how insulin could produce a bell-shaped lipolytic response, we made a simple model (Figure 12a). Increasing concentration of insulin activates PDE3B (signal 1) and independently inhibits PDE3B at high concentrations (signal 2) (Figure 12b, left panel). Increased signalling for activation (signal 1) and at higher concentrations of insulin for inhibition (signal 2) of PDE3B collectively produce a bell-shaped activation-inhibition of PDE3B, and the corresponding lipolytic response (Figure 12b, right panels) that mirrors the experimental data (Figure 1).
Figure 12. Complex regulation of cAMP controls lipolysis in response to insulin and βAR signalling.
(a) Pathways for control of intracellular cAMP levels and lipolysis by isoproterenol and insulin in human adipocytes. Blue arrows denote insulin signalling and orange arrows denote βAR signalling. 1 and 2 denote the specific indicated signals. (b) A model analysis of the control of PDE3B activity and lipolysis by signals 1 and 2 in (a). The activation of PDE3B by signal 1 (green), and the inhibition of PDE3B by signal 2 (red), were modelled as shown in the left panel. Expression of this model on the activity of PDE3B and lipolysis is shown in the right panels.
We found that insulin alone, congruent with the restoration of lipolysis, increased lipolysis (Figure 13a) and in parallel the phosphorylation of HSL (Figure 13b). The rate of lipolysis was a fraction of that in the presence of isoproterenol: ∼0.1 nmol glycerol per h per µl adipocytes, compared with 0.7 nmol in the presence of isoproterenol. Insulin alone could achieve this by inhibition of PDE3B-catalyzed hydrolysis of basal cAMP production, thus slightly cranking up the steady-state level of cAMP and lipolysis [c.f. the increased lipolysis in response to inhibition of PDE3B by cilostamide (Figure 9a)]. We propose that inhibition of PDE3B is responsible for the restoration of lipolysis at 10−7 M insulin. Under these conditions, with stimulated production and hydrolysis of cAMP, inhibition of PDE3B by insulin would enhance lipolysis considerably compared with the lipolytic enhancement by insulin alone.
Figure 13. At high concentration insulin alone stimulates lipolysis.
Adipocytes were incubated for 25 min with the indicated concentration of insulin Cells were then separated from the medium. Indicated are P-values for the effect of the indicated concentration of insulin. Glycerol was determined in the medium (n = 7) (a) and the phosphorylation of HSL (n = 11) (b) was determined in the cells. A representative immunoblot is shown.
Having laid out the framework for the structure of the integrated signalling network of β-adrenergic and insulin control of lipolysis, we next demonstrate how this is affected in type 2 diabetes.
Lipolysis and lipolytic control by insulin and β-adrenergic signalling are not altered in T2D
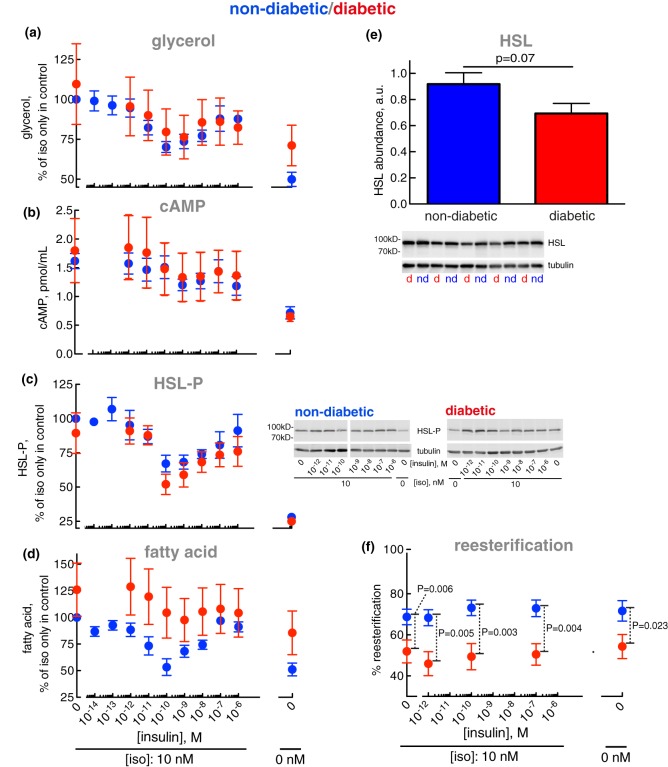
We examined adipocytes isolated from non-obese, non-diabetic (blue in Figure 14) and in parallel from obese women with a T2D diagnosis (red) (Supplementary Table S1). Again, we examined lipolysis in the presence of increasing concentrations of insulin against a fixed 10 nM concentration of isoproterenol.
Figure 14. Control of lipolysis — normally and in T2D.
Adipocytes from non-diabetic control subjects (blue) or patients with T2D (red) were incubated with the indicated concentration of insulin for 15 min, when 10 nM isoproterenol (iso) was added and cells incubated for another 10 min. The indicated analyte was then determined in the medium (glycerol and fatty acids) or in the cells (cAMP, HSL phosphorylation). Individual subject characteristics and clinical data are presented in Supplementary Table S1. (a) Glycerol: six non-diabetic control subjects [mean age 65 years (range 46–86); mean BMI 24 kg/m2 (range 18–28)] and seven subjects with T2D [mean age 67 years (range 45–77); mean BMI 32 kg/m2 (range 28–40)]. The non-diabetic control subjects had a mean fasting plasma concentration of glucose of 6.2 mM (range 4.9–7.3); and a mean concentration of insulin of 5.8 mIU/l (range 2.0–11.0). The diabetic subjects had a mean fasting plasma concentration of glucose of 9.2 mM (range 6.3–12); and a mean concentration of insulin of 22 mIU/l (range 5.9–69). Because absolute levels of fatty acid and glycerol released from the adipocytes varied between donors, in order to compare non-diabetic and diabetic cells, data are presented as % of release in the presence of isoproterenol only, in the non-diabetic cells; and in diabetic cells as % of the average release, of all experiments, in the presence of isoproterenol only in the non-diabetic cells. (b) cAMP: seven non-diabetic control subjects [mean age 65 years (range 40–78); mean BMI 26 kg/m2 (range 20–28)] and 10 subjects with T2D [mean age 69 years (range 45–83); mean BMI 33 kg/m2 (range 28–40)]. The non-diabetic control subjects had a mean fasting plasma concentration of glucose of 6.3 mM (range 5.0–8.7); and a mean concentration of insulin of 8.6 mIU/l (range 1.9–22). The diabetic subjects had a mean fasting plasma concentration of glucose of 8.9 mM (range 5.4–12); and a mean concentration of insulin of 15 mIU/l (range 5.9–39). (c) HSL phosphorylation: nine non-diabetic control subjects [mean age 64 years (range 44–86); mean BMI 25 kg/m2 (range 18–28)] and seven subjects with T2D [same as in (a)]. The non-diabetic control subjects had a mean fasting plasma concentration of glucose of 6.1 mM (range 4.9–7.3); and a mean concentration of insulin of 6.2 mIU/l (range 2.0–13.0). The diabetic subjects had a mean fasting plasma concentration of glucose and insulin the same as in (a). Representative immunoblots of HSL-P in (c) are shown for one non-diabetic and one diabetic subject. (d) Fatty acids: seven non-diabetic control subjects [mean age 69 years (range 53–86); mean BMI 24 kg/m2 (range 18–28)] and seven subjects with T2D [same as in (a)]. The non-diabetic control subjects had a mean fasting plasma concentration of glucose of 6.6 mM (range 4.9–7.5); and a mean concentration of insulin of 6.7 mIU/l (range 2.0–13.0). The diabetic subjects had a mean fasting plasma concentration of glucose and insulin the same as in (a). (e) The abundance of HSL was determined by SDS–PAGE and immunoblotting in adipocytes from 10 non-diabetic control subjects (blue) [mean age 46 years (range 34–73); mean BMI 24 kg/m2 (range 20–28)] and 10 subjects with T2D (red) [mean age 55 years (range 45–83); mean BMI 37 kg/m2 (range 31–43)]. The non-diabetic control subjects had a mean fasting plasma concentration of glucose of 6.0 mM (range 4.8–7.6); and a mean concentration of insulin of 3.9 mIU/l (range 1.6–9.1). The diabetic subjects had a mean fasting plasma concentration of glucose of 9.0 mM (range 5.4–12.3); and a mean concentration of insulin of 31 mIU/l (range 6.0–173). d, diabetic; nd, non-diabetic. (f) Re-esterification was determined. Adipocytes from 18 non-diabetic control subjects (blue) [mean age 62 years (range 43–86); mean BMI 24 kg/m2 (range 20–28)] or seven subjects with T2D (red) [mean age 67 years (range 45–77); mean BMI 32 kg/m2 (range 28–40)] were incubated with the indicated concentration of insulin for 15 min, when 10 nM isoproterenol was added and cells incubated for another 10 min. Cells were then separated from medium and fatty acids and glycerol were determined in the medium. The difference between glycerol and fatty acids released (triacylglycerol → 1 glycerol + 3 fatty acids) is defined as reesterification. The reesterification is calculated as % of released fatty acids that were reesterified: 100 × [(3 × glycerol − fatty acids)/3 × glycerol]. The non-diabetic control subjects had a mean fasting plasma concentration of glucose of 6.1 mM (range 4.9–8.0); and a mean concentration of insulin of 7.0 mIU/l (range 2.0–16). The diabetic subjects had a mean fasting plasma concentration of glucose of 9.2 mM (range 6.3–12.3); and a mean concentration of insulin of 22 mIU/l (range 5.9–69).
Interestingly, control of lipolysis — determined as the release of glycerol from the cells — by isoproterenol or by insulin in the presence of isoproterenol, was not markedly altered in the diabetic adipocytes (Figure 14a). Similarly, neither were the cellular levels of cAMP (Figure 14b) nor the abundance of phosphorylated HSL (Figure 14c) altered in the diabetic state. However, the abundance of HSL protein appeared to be reduced by ∼25% (Figure 14e), in line with a previous estimate [43]. It is interesting that although the abundance of HSL may be reduced in diabetes, this does not affect the level of phosphorylated HSL — i.e. active HSL — at basal conditions or after addition of isoproterenol or after the further addition of insulin (Figure 14c). Evidently, in human adipocytes, the amount of HSL is not rate-limiting in the control of lipolysis.
As our non-diabetic cohort consists of subjects exhibiting varying insulin sensitivity, we subdivided a larger cohort of non-diabetic subjects according to HOMA-IR and QUICKI indices, and examined the anti-lipolytic responses to insulin in their adipocytes. The insulin sensitive (HOMA-IR = 0.91, QUICKI = 0.40) and insulin resistant (HOMA-IR = 3.20, QUICKI = 0.32) subgroups (Supplementary Table S2) exhibited identical responses to insulin in the presence of isoproterenol (Supplementary Figure S3). We, therefore, conclude that lipolysis and the regulation of lipolysis are not altered in adipocytes from obese subjects with T2D.
However, the release of fatty acids appeared to be increased in the diabetic adipocytes (Figure 14d). Increased fatty acid release in diabetic adipocytes in spite of unchanged lipolysis indicates that reesterification [44,45] of liberated fatty acids is reduced in the diabetic state.
Reesterification of fatty acids is decreased in T2D
When we compared the release of glycerol with that of fatty acids from the same cells, on average about one molecule fatty acid was released per molecule of glycerol (Figure 14f, blue), demonstrating that two-thirds of the lipolytically liberated fatty acids were reesterified to re-form triacylglycerol.
In the diabetic adipocytes, the extent of reesterification was substantially and significantly decreased (Figure 14f, red). The reesterification was reduced by 25% in T2D, such that every second, instead of normally every third, lipolytically formed fatty acid was released from the cells. Which translates to an average 50% increase in the rate of fatty acid release in the diabetic state.
Neither insulin nor isoproterenol had any effect on the reesterification — normally or in T2D — and irrespective of the rate of triacylglycerol hydrolysis, roughly the same fraction of liberated fatty acids was reesterified, emphasizing that acute control of reesterification by insulin or isoproterenol is of limited importance and cannot explain the reduced reesterification in T2D (Figure 14f).
Discussion
Mechanisms of insulin and β-adrenergic signalling in the integrated control of lipolysis
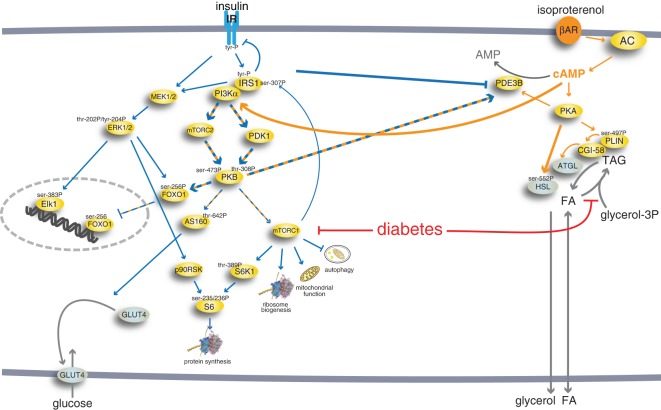
Stimulation of the βAR enhances lipolysis through the generation of cAMP and phosphorylation of HSL and perilipin-1 by PKA. Interestingly, PKA also inhibits lipolysis by phosphorylation and activation of PDE3B [46–48]. Our findings now show that the βAR simultaneously also markedly inhibits lipolysis via control of cAMP → PI3Kα → mTORC2/PDK1 → PKB to control PDE3B that hydrolyzes cAMP and quells lipolysis (Figure 15). This is at odds with findings that isoproterenol in 3T3-L1 adipocytes inhibited insulin stimulation of mTORC2 [49]. On the other hand, isoproterenol or 8-Br-cAMP have been reported to stimulate mTORC2 in murine brown adipocytes, however, apparently without affecting PKB [50]. PI3Kα-mediation of anti-lipolysis by insulin in human adipocytes is in line with the role for PI3Kα as a key mediator of insulin signalling in murine 3T3-L1 adipocytes [51]. Our findings in human adipocytes are corroborated in a very recent report of PI3Kα-dependent activation of PKB by isoproterenol for inhibition of lipolysis in mice [52].
Figure 15. Lipolytic control by βAR integrated in the insulin signalling network of human adipocytes.
The integrated comprehensive signalling network of insulin and β-adrenergic acute signalling in human adipocytes that we have defined in isolated primary human adipocytes, normally and in T2D [23,25–28,31,62,80,81] and herein. Blue arrows denote insulin signalling and orange arrows denote signalling by the βAR. Hatched blue and orange arrows denote joint signalling by insulin and βAR. The thicker arrows represent signalling investigated herein. The red arrows indicate that the impaired signalling in T2D is due to attenuated mTORC1 signalling and attenuated fatty acid esterification. Long term regulation of protein levels via transcriptional or translational control is not included in the scheme, and it can be noted that in type 2 diabetes maximal stimulation of glucose uptake is reduced in type 2 diabetes, because of down-regulated levels of GLUT4 [82] that apparently is due to reduced levels of the transcription factor FOXO1 in T2D [24,27]. FOXO1, in turn, appears to be reduced by the attenuated mTORC1 signalling in T2D [27].
Our findings show that both insulin and β-adrenergic signalling are anti-lipolytic via the activation of PDE3B by PKB and that this mechanism can fully explain the anti-lipolytic action of insulin in human adipocytes. It is critical that the anti-lipolytic effect of insulin is mediated sufficiently by low levels of PKB phosphorylated at either Ser473 or Thr308 or both sites. Moreover, anti-lipolysis in human adipocytes is very sensitive to insulin, half-maximal at 0.01 nM insulin (herein), while glucose uptake is half-maximal at 0.04 nM [23]. Taken together, this strongly suggests that earlier reports, which have found anti-lipolysis in response to insulin in PKBβ/Akt2-null mice or cells to be independent of PKB [20,22], can now be explained by failure to recognize that a very low level of PKB activity is required for anti-lipolysis by insulin. This is corroborated in 3T3-L1 adipocytes, where knockdown of PKBα and -β to <20% of normal total levels of phosphorylation still supported anti-lipolysis by insulin, while anti-lipolysis was blocked when combined with chemical inhibitors of PKB [53]. However, our results do not demonstrate that PKB controls PDE3B through its phosphorylation (c.f. reference [21] demonstrating that deletion on PDE3B of the PKB phosphorylation sites does not block anti-lipolysis by insulin), it is thus quite possible that PKB controls PDE3B activity via a mediator such as α/β-hydrolase domain-containing-15 (ABHD15), a HSL and CGI58 related protein, that has been demonstrated to enhance anti-lipolysis by insulin in mouse cell lines [54,55].
Our findings also reveal how at high concentrations the anti-lipolytic activity of insulin is reversed and lipolysis restored, tentatively through insulin-induced inhibition of PDE3B. It can be argued that the inhibition of PDE3B at high concentrations of insulin is mediated by the insulin-like growth factor-1 (IGF1) receptor. This is, however, unlikely as insulin poorly affects the IGF1 receptor in human preadipocytes [56], and mature human adipocytes express much lower levels of IGF1 receptor than human preadipocytes [57]. The exact molecular mechanism for inhibition of PDE3B by insulin remains unresolved, but the inhibition may result from an inhibitory phosphorylation of PDE3B or from formation/breaking of the interaction of PDE3B with other proteins at high concentrations of insulin, it is in this context interesting that ABHD15 has been reported to associate with and stabilize PDE3B, and to be required for full anti-lipolytic activity of insulin in mice [54].
The control of lipolysis is obviously a very central function in human energy homeostasis and is the reason we can function as human beings sustained by eating meals. So fatty acids need always be available from the adipocyte stores, but fatty acids are also acutely cytotoxic. Fatty acids will rapidly lyse cells if allowed to accumulate: endogenously by lipolysis in isolated rat adipocytes [58] or exogenously in cultured melanoma cells [59]. It is therefore paramount to avoid the accumulation of free fatty acids. In human adipocytes, this appears to be ensured as the stimulation of lipolysis by β-adrenergic agonists increases cAMP and activation of PKA, while also limiting the cAMP concentration by a simultaneous increase in cAMP-hydrolysis via the direct activation of PDE3B by PKA [46–48] and, indirectly, via cAMP → PI3Kα → PKB to activate PDE3B (Figure 15). While insulin at low physiological levels will reduce fatty acid release; at high levels of insulin, the signalling network is protected from completely quelling fatty acid availability to the body. Especially as a response to hyperinsulinemia in the diabetic state, this may also protect adipocytes from triacylglycerol over-load and consequential break-down of cellular integrity [60]. As a further check on cellular levels of fatty acids, a large fraction of lipolytically released fatty acids are reesterified in the adipocytes. It was recently reported that in mice the reesterification during lipolysis was critically dependent on DGAT1 and that the reesterification serves to protect the endoplasmic reticulum from the toxicity of fatty acids [61]. The endoplasmic reticulum may thus provide a response system for potentially deleterious accumulation of fatty acids. All this is an interesting demonstration of how complex regulation by checks and balances provide robustness to living systems. In vivo, in the whole body, this is further strengthened by β-adrenergic stimulation and α2-adrenergic inhibition of lipolysis by the catecholamines, and control by a wide range of other hormones and metabolites acting at different levels, such as e.g. natriuretic peptides, growth hormone, cortisol, lactate, and numerous cytokines.
Enhanced fatty acid release in T2D due to reduced reesterification
Our findings reveal that fatty acid output was elevated 1.5-fold in diabetic adipocytes, because of impaired reesterification of lipolytically liberated fatty acids. In contrast, the hormonal control of lipolysis was not altered by insulin resistance and in T2D.
In a series of investigations, we have previously demonstrated the mechanisms whereby the insulin resistance is spread throughout the insulin signalling network in human adipocytes [23–28,62]. Insulin signalling downstream mTORC1 is attenuated in the diabetic state (Figure 15). In contrast, signalling downstream mTORC2 remains unimpaired in diabetes. This ‘constitutive’ insulin-sensitive signalling, mediated by mTORC2-catalyzed phosphorylation of PKB at Ser473 [23], encompasses insulin control of FOXO1 and downstream transcriptional control ([24,27] and references therein), and can now be extended to control of lipolysis by a PKB-dependent pathway, which does not directly involve mTORC1. A pathway fully sustained by low levels of phosphorylated PKB — at either Ser473 or Thr308 — a pathway thus insensitive to large variations in cellular levels of PKB or phosphorylatable PKB or PKB phosphorylated at Thr308. Because anti-lipolysis can be fully sustained by mTORC2-catalyzed phosphorylation of PKB at Ser473, control of lipolysis by insulin will not be affected in T2D. Our findings describe and expand, as well as provide a molecular explanation to, ‘selective insulin resistance’ in adipocytes from subjects with type 2 diabetes. Such phenomena have earlier been described for 3T3-L1 adipocytes made insulin resistant by chronic insulin stimulation or treatment with TNFα [53] and for mouse liver [63].
While insulin signalling for control of lipolysis was not altered by insulin resistance or in T2D, attenuated reesterification is the basis for a 50% increased release of fatty acids from the diabetic adipocytes. This finding is supported by studies in vivo: during an oral glucose tolerance test circulating level of glycerol was not affected by T2D, while the level of fatty acids was increased in diabetic compared with non-diabetic subjects [5]. Also, substantially reduced uptake and esterification of dietary fat has been found in the adipose tissue of obese versus lean subjects [64], and impaired synthesis of triacylglycerol has been reported in overweight/obese individuals [65]. It appears that reduced triacylglycerol synthesis, during lipolysis or otherwise, is associated with obesity/T2D. It has indeed been reported that fatty acids are reesterified after release and reuptake by the cells [66,67] and, hence, also by neighbour cells [68].
In agreement with a shortage of evidence for acute effects of insulin on triacylglycerol synthesis in adipocytes [69], the lack of acute effects of the hormone on the reesterification (herein) indicates that the decreased reesterification in T2D is not the result of changes in the short-term signalling in response to insulin. Neither is it likely the result of changes in the availability of the glycerol-3P precursor glucose, as there is no correlation with the concentration of insulin (Figure 14e), which enhances glucose uptake and availability. It has indeed been suggested that in vivo, under normal conditions, the extent of reesterification in the adipose tissue is un-coupled from the rate of glucose uptake [70].
In spite of early evidence to the contrary, it appears that human adipocytes are capable of de novo fatty acid synthesis, albeit at a low level. Although a formal possibility, we consider it highly unlikely that de novo synthesis of fatty acids significantly contributed to the increased release of fatty acids in T2D [65,71–74]. Moreover, fatty acid synthesis has been reported as reduced, not increased, in adipocytes or adipose tissue of insulin resistant compared with insulin sensitive individuals [65,75].
The metabolic pathway of triacylglycerol synthesis is well characterized, but much less is known about how insulin controls it in the adipocyte [69]. Insulin is able to control the transcription of involved enzymes, in particular, the acylation of glycerol-3-phosphate by glycerol-3-phosphate acyltransferase (GPAT). This enzyme exists in four isoforms of which GPAT1 transcripts decrease in adipose tissue of rats during fasting and increase with refeeding [76], in line with their regulation by insulin. GPAT1 in rat adipocytes has been shown to be affected by insulin [77]. Also, transcripts for the acyl-CoA:acylglycerol-3-phosphate acyltransferase (AGPAT), the enzyme catalyzing the addition of the second fatty acid of triacylglycerol, have been found lowered in the adipose tissue of T2D [5]. Transcripts for the acylCoA:diacylglycerol acyltransferase-1 (DGAT1) and DGAT2 have also been found to be markedly reduced in human adipose tissue of subjects with T2D [5]. Furthermore, DGAT1 transcripts have been reported to increase in the adipose tissue of subjects with impaired glucose tolerance when treated with pioglitazone [78]. In 3T3-L1 adipocytes, total DGAT activity has been found to increase in response to insulin, and DGAT2 transcripts to increase in adipose tissue during feeding but decrease during fasting of mice [79]. Hence, there is ample opportunity for long-term control by insulin of triacylglycerol synthesis and reesterification, as well as reduced responses to insulin in T2D. It will be particularly interesting to examine the effects of long-term inhibition of mTORC1 and FOXO1 on reesterification and triacylglycerol synthesis [27].
Conclusion
We have taken the whole signalling network into account in order to lay down a framework for how insulin and β-adrenergic stimulation in concert controls lipolysis in human adipocytes (Figure 15). We have revealed the integrated network structure for control of lipolysis — normally and in type 2 diabetes. We have shown how the control of lipolysis evades impairment in diabetes and that increased fatty acid output in diabetes results from reduced esterification of fatty acids in the adipocytes. Control of lipolysis and fat storage in the adipose tissue is at the centre of lipid homeostasis, but it is also at the centre of the pathogenesis of T2D. Our findings thus define the foundation of the ectopic deposition of triacylglycerol in diabetes that have direct implications for treatment of the disease and its sequelae.
Acknowledgements
We are humbly and immensely grateful to the many patients who altruistically donated adipose tissue biopsies and to the staff at the department of gynaecology at the University hospital in Linköping who was engaged in the procedures to provide the adipose tissue during the course of several years of this investigation.
Abbreviations
- ABHD15
α/β-hydrolase domain-containing-15
- AGPAT
acylglycerol-3-phosphate acyltransferase
- ATGL
adipose tissue triacylglycerol lipase
- FOXO1
forkhead box protein O1
- GPAT
glycerol-3-phosphate acyltransferase
- HOMA-IR
homeostatic model assessment for insulin resistance
- HSL
hormone-sensitive lipase
- IGF1
insulin-like growth factor-1
- IRS1
insulin receptor substrate-1
- mTOR
mammalian/mechanistic target of rapamycin
- mTORC1
mTOR in complex with raptor
- mTORC2
mTOR in complex with rictor
- PDE3B
phosphodiesterase 3B
- PDK1
phosphoinositide-dependent protein kinase-1
- PI3K
phosphatidyl inositol 3-kinase
- PI3Ks
phosphatidyl inositol 3-kinases
- PKA
cAMP-dependent protein kinase
- PKB
protein kinase B (or Akt)
- QUICKI
quantitative insulin sensitivity check index
- S6K1
p70 ribosomal S6-kinase-1
- T2D
type 2 diabetes
Footnotes
1In the graphs with insulin dose–response against a constant concentration of isoproterenol, zero at the right end of the x-axis denotes basal conditions, i.e. no insulin and no isoproterenol; zero at the left end of the x-axis denotes 10 nM isoproterenol with no insulin added.
2Inhibition of insulin-induced anti-lipolysis involves inhibition of inhibition by insulin, and similarly for inhibition of inhibition-of-stimulation by isoproterenol, as well as with the combined effects. The data graphs are therefore necessarily difficult to interpret at a glance.
3Phosphorylation sites Ser473 and Thr308 in PKBα, correspond to Ser474 and Thr309 in PKBβ. Isoform, we do not distinguish between the two isoforms of PKB.
Author Contribution
C.J. and P.S. conceived and co-ordinated the study. C.J. and P.S. wrote the paper. C.J. performed the experiments, except A.P.C.B. performed experiments with effects of insulin alone. P.K. provided adipose tissue biopsies. C.J. and P.S. analyzed the experiments. All authors approved the final version of the manuscript.
Funding
This study was supported by the University of Linköping, a 3-years program at the Swedish Diabetes Fund, and a 5-years program at the Swedish Research Council.
Competing Interests
The Authors declare that there are no competing interests associated with the manuscript.
Supplementary Material
References
- 1.Shulman G.I. (2014) Ectopic fat in insulin resistance, dyslipidemia, and cardiometabolic disease. N. Engl. J. Med. 371, 1131–1141 10.1056/NEJMra1011035 [DOI] [PubMed] [Google Scholar]
- 2.Lotta L.A., Gulati P., Day F.R., Payne F., Ongen H., van de Bunt M. et al. (2017) Integrative genomic analysis implicates limited peripheral adipose storage capacity in the pathogenesis of human insulin resistance. Nat Genet 49, 17–26 10.1038/ng.3714 [DOI] [PMC free article] [PubMed] [Google Scholar]
- 3.Karpe F., Dickmann J.R. and Frayn K.N. (2011) Fatty acids, obesity, and insulin resistance: time for a reevaluation. Diabetes 60, 2441–2449 10.2337/db11-0425 [DOI] [PMC free article] [PubMed] [Google Scholar]
- 4.Yki-Järvinen H., Kubo K., Zawadzki J., Lillioja S., Young A., Abbott W. et al. (1987) Dissociation of in vitro sensitivities of glucose transport and antilipolysis to insulin in NIDDM. Am J Physiol 253, E300–E304 10.1152/ajpendo.1987.253.3.E300 [DOI] [PubMed] [Google Scholar]
- 5.Pereira M.J., Skrtic S., Katsogiannos P., Abrahamsson N., Sidibeh C.O., Dahgam S. et al. (2016) Impaired adipose tissue lipid storage, but not altered lipolysis, contributes to elevated levels of NEFA in type 2 diabetes. Degree of hyperglycemia and adiposity are important factors. Metabolism 65, 1768–1780 10.1016/j.metabol.2016.09.008 [DOI] [PubMed] [Google Scholar]
- 6.Groop L.C., Saloranta C., Shank M., Bonadonna R.C., Ferrannini E. and DeFronzo R.A. (1991) The role of free fatty acid metabolism in the pathogenesis of insulin resistance in obesity and noninsulin-dependent diabetes mellitus. J. Clin. Endocrinol. Metab. 72, 96–107 10.1210/jcem-72-1-96 [DOI] [PubMed] [Google Scholar]
- 7.Basu A., Basu R., Shah P., Vella A., Rizza R.A. and Jensen M.D. (2001) Systemic and regional free fatty acid metabolism in type 2 diabetes. Am. J. Physiol. Endocrinol. Metab. 280, E1000–E1006 10.1152/ajpendo.2001.280.6.E1000 [DOI] [PubMed] [Google Scholar]
- 8.Mook S., Halkes C.J.M., Bilecen S. and Cabezas M.C. (2004) In vivo regulation of plasma free fatty acids in insulin resistance. Metabolism 53, 1197–1201 10.1016/j.metabol.2004.02.023 [DOI] [PubMed] [Google Scholar]
- 9.Kolditz C.-I. and Langin D. (2010) Adipose tissue lipolysis. Curr. Opin. Clin. Nutr. Metab. Care 13, 377–381 10.1097/MCO.0b013e32833bed6a [DOI] [PubMed] [Google Scholar]
- 10.Greenberg A.S., Egan J.J., Wek S.A., Garty N.B., Blanchette-Mackie E.J. and Londos C. (1991) Perilipin, a major hormonally regulated adipocyte-specific phosphoprotein associated with the periphery of lipid storage droplets. J. Biol. Chem. 266, 11341–11346 PMID: [PubMed] [Google Scholar]
- 11.Granneman J.G., Moore H.P., Krishnamoorthy R. and Rathod M. (2009) Perilipin controls lipolysis by regulating the interactions of AB-hydrolase containing 5 (Abhd5) and adipose triglyceride lipase (Atgl). J. Biol. Chem. 284, 34538–34544 10.1074/jbc.M109.068478 [DOI] [PMC free article] [PubMed] [Google Scholar]
- 12.Strålfors P. and Belfrage P. (1983) Phosphorylation of hormone-sensitive lipase by cyclic AMP-dependent protein kinase. J. Biol. Chem. 258, 15146–15142 PMID: [PubMed] [Google Scholar]
- 13.Strålfors P. and Honnor R.C. (1989) Insulin-induced dephosphorylation of hormone-sensitive lipase. Correlation with lipolysis and cAMP-dependent protein kinase activity. Eur. J. Biochem. 182, 379–385 10.1111/j.1432-1033.1989.tb14842.x [DOI] [PubMed] [Google Scholar]
- 14.Strålfors P., Björgell P. and Belfrage P. (1984) Hormonal regulation of hormone-sensitive lipase in intact adipocytes: identification of phosphorylated sites and effects on the phosphorylation by lipolytic hormones and insulin. Proc. Natl Acad. Sci. U.S.A. 81, 3317–3321 10.1073/pnas.81.11.3317 [DOI] [PMC free article] [PubMed] [Google Scholar]
- 15.Tornqvist H., Nilsson-Ehle P. and Belfrage P. (1978) Enzymes catalyzing the hydrolysis of long-chain monoacylglycerols in rat adipose tissue. Biochim. Biophys. Acta 530, 474–486 10.1016/0005-2760(78)90167-4 [DOI] [PubMed] [Google Scholar]
- 16.Nilsson N.O., Strålfors P., Fredrikson G. and Belfrage P. (1980) Regulation of adipose tissue lipolysis: effects of noradrenaline and insulin on phosphorylation of hormone-sensitive lipase and on lipolysis in intact rat adipocytes. FEBS Lett. 111, 125–130 10.1016/0014-5793(80)80776-9 [DOI] [PubMed] [Google Scholar]
- 17.Kitamura T., Kitamura Y., Kuroda S., Hino Y., Ando M., Kotani K. et al. (1999) Insulin-induced phosphorylation and activation of cyclic nucleotide phosphodiesterase 3B by the serine-threonine kinase Akt. Mol. Cell. Biol. 19, 6286–6296 10.1128/MCB.19.9.6286 [DOI] [PMC free article] [PubMed] [Google Scholar]
- 18.Berggreen C., Gormand A., Omar B., Degerman E. and Goransson O. (2009) Protein kinase B activity is required for the effects of insulin on lipid metabolism in adipocytes. Am. J. Physiol. Endocrinol. Metab. 296, E635–E646 10.1152/ajpendo.90596.2008 [DOI] [PubMed] [Google Scholar]
- 19.Petersen M.C. and Shulman G.I. (2018) Mechanisms of insulin action and insulin resistance. Physiol. Rev. 98, 2133–2223 10.1152/physrev.00063.2017 [DOI] [PMC free article] [PubMed] [Google Scholar]
- 20.Choi S.M., Tucker D.F., Gross D.N., Easton R.M., DiPilato L.M., Dean A.S. et al. (2010) Insulin regulates adipocyte lipolysis via an Akt-independent signaling pathway. Mol. Cell. Biol. 30, 5009–5020 10.1128/MCB.00797-10 [DOI] [PMC free article] [PubMed] [Google Scholar]
- 21.DiPilato L.M., Ahmad F., Harms M., Seale P., Manganiello V. and Birnbaum M.J. (2015) The role of PDE3B phosphorylation in the inhibition of lipolysis by insulin. Mol. Cell. Biol. 35, 2752–2760 10.1128/MCB.00422-15 [DOI] [PMC free article] [PubMed] [Google Scholar]
- 22.Koren S., DiPilato L.M., Emmett M.J., Shearin A.L., Chu Q., Monks B. et al. (2015) The role of mouse Akt2 in insulin-dependent suppression of adipocyte lipolysis in vivo. Diabetologia 58, 1063–1070 10.1007/s00125-015-3532-9 [DOI] [PMC free article] [PubMed] [Google Scholar]
- 23.Brännmark C., Nyman E., Fagerholm S., Bergenholm L., Ekstrand E.-M., Cedersund G. et al. (2013) Insulin signalling in type 2 diabetes – experimental and modeling analyses reveal mechanisms of insulin resistance in human adipocytes. J. Biol. Chem. 288, 9867–9880 10.1074/jbc.M112.432062 [DOI] [PMC free article] [PubMed] [Google Scholar]
- 24.Rajan M.R., Nyman E., Brännmark C., Olofsson C.S. and Strålfors P. (2018) Inhibition of FOXO1 transcription factor in primary human adipocytes mimics the insulin-resistant state of type 2 diabetes. Biochem. J. 475, 1807–1820 10.1042/BCJ20180144 [DOI] [PubMed] [Google Scholar]
- 25.Nyman E., Rajan M.R., Fagerholm S., Brännmark C., Cedersund G. and Strålfors P. (2014) A single mechanism can explain network-wide insulin resistance in adipocytes from obese patients with type 2 diabetes. J. Biol. Chem. 289, 33215–33230 10.1074/jbc.M114.608927 [DOI] [PMC free article] [PubMed] [Google Scholar]
- 26.Öst A., Svensson K., Ruishalme I., Brännmark C., Franck N., Krook H. et al. (2010) Attenuated mTOR signaling and enhanced autophagy in adipocytes from obese patients with type 2 diabetes. Mol. Med. 16, 235–246 10.2119/molmed.2010.00023 [DOI] [PMC free article] [PubMed] [Google Scholar]
- 27.Rajan M.R., Nyman E., Kjølhede P., Cedersund G. and Strålfors P. (2016) Systems-wide experimental and modeling analysis of insulin signaling through forkhead box protein O1 (FOXO1) in human adipocytes, normally and in type 2 diabetes. J. Biol. Chem. 291, 15806–15819 10.1074/jbc.M116.715763 [DOI] [PMC free article] [PubMed] [Google Scholar]
- 28.Danielsson A., Öst A., Nystrom F.H. and Strålfors P. (2005) Attenuation of insulin-stimulated insulin receptor substrate-1 serine 307 phosphorylation in insulin resistance of type 2 diabetes. J. Biol. Chem. 280, 34389–34392 10.1074/jbc.C500230200 [DOI] [PubMed] [Google Scholar]
- 29.de Vries G.J. and Forger N.G. (2015) Sex differences in the brain: a whole body perspective. Biol. Sex Differ. 6, 15 10.1186/s13293-015-0032-z [DOI] [PMC free article] [PubMed] [Google Scholar]
- 30.Arner P., Andersson D.P., Backdahl J., Dahlman I. and Ryden M. (2018) Weight gain and impaired glucose metabolism in women are predicted by inefficient subcutaneous fat cell lipolysis. Cell Metab. 28, 45–54.e3 10.1016/j.cmet.2018.05.004 [DOI] [PubMed] [Google Scholar]
- 31.Danielsson A., Öst A., Lystedt E., Kjolhede P., Gustavsson J., Nystrom F.H. et al. (2005) Insulin resistance in human adipocytes occurs downstream of IRS1 after surgical cell isolation, but at the level of phosphorylation of IRS1 in type 2 diabetes. FEBS J. 272, 141–151 10.1111/j.1432-1033.2004.04396.x [DOI] [PubMed] [Google Scholar]
- 32.Burns T.W., Terry B.E., Langley P.E. and Robison G.A. (1979) Insulin inhibition of lipolysis of human adipocytes: the role of cyclic adenosine monophosphate. Diabetes 28, 957–961 10.2337/diab.28.11.957 [DOI] [PubMed] [Google Scholar]
- 33.Arner P., Bolinder J., Engfeldt P. and Ostman J. (1981) The antilipolytic effect of insulin in human adipose tissue in obesity, diabetes mellitus, hyperinsulinemia, and starvation. Metabolism 30, 753–760 10.1016/0026-0495(81)90020-2 [DOI] [PubMed] [Google Scholar]
- 34.Renner R., Kemmler W. and Hepp K.D. (1974) Antagonism of insulin and lipolytic hormones in the control of adenylate-cyclase activity in fat cells. Eur. J. Biochem. 49, 129–141 10.1111/j.1432-1033.1974.tb03818.x [DOI] [PubMed] [Google Scholar]
- 35.Desai K.S., Li K.C. and Angel A. (1973) Bimodal effect of insulin on hormone-stimulated lipolysis: relation to intracellular 3′,5′-cyclic adenylic acid and free fatty acid levels. J. Lipid Res. 14, 647–655 PMID: [PubMed] [Google Scholar]
- 36.Mooney R.A., Ebersohl R.D. and McDonald J.M. (1984) Insulin-mediated antilipolysis in permeabilized rat adipocytes. J. Biol. Chem. 259, 7701–7704 PMID: [PubMed] [Google Scholar]
- 37.Lavis V.R. and Williams R.H. (1973) Lipolytic effects of high concentrations of insulin on isolated fat cells: enhancement of the response to lipolytic hormones. Diabetes 22, 629–636 10.2337/diab.22.8.629 [DOI] [PubMed] [Google Scholar]
- 38.Wymann M.P. and Schultz C. (2012) The chemical biology of phosphoinositide 3-kinases. Chembiochem 13, 2022–2035 10.1002/cbic.201200089 [DOI] [PubMed] [Google Scholar]
- 39.Beavo J.A. and Reifsnyder D.H. (1990) Primary sequence of cyclic nucleotide phosphodiesterase isozymes and the design of selective inhibitors. Trends Pharmacol. Sci. 11, 150–155 10.1016/0165-6147(90)90066-H [DOI] [PubMed] [Google Scholar]
- 40.Hagstrom-Toft E., Bolinder J., Eriksson S. and Arner P. (1995) Role of phosphodiesterase III in the antilipolytic effect of insulin in vivo. Diabetes 44, 1170–1175 10.2337/diab.44.10.1170 [DOI] [PubMed] [Google Scholar]
- 41.Degerman E., Belfrage P. and Manganiello V.C. (1997) Structure, localization, and regulation of cGMP-inhibited phosphodiesterase (PDE3). J. Biol. Chem. 272, 6823–6826 10.1074/jbc.272.11.6823 [DOI] [PubMed] [Google Scholar]
- 42.Choi Y.H., Park S., Hockman S., Zmuda-Trzebiatowska E., Svennelid F., Haluzik M. et al. (2006) Alterations in regulation of energy homeostasis in cyclic nucleotide phosphodiesterase 3B-null mice. J. Clin. Invest. 116, 3240–3251 10.1172/JCI24867 [DOI] [PMC free article] [PubMed] [Google Scholar]
- 43.Watt M.J., Carey A.L., Wolsk-Petersen E., Kraemer F.B., Klarland-Pedersen B. and Febbraio M.A. (2005) Hormone-sensitive lipase is reduced in the adipose tissue of patients with type 2 diabetes mellitus: influence of IL-6 infusion. Diabetologia 48, 105–112 10.1007/s00125-004-1598-x [DOI] [PubMed] [Google Scholar]
- 44.Vaughan M. (1962) The production and release of glycerol by adipose tissue incubated in vitro. J. Biol. Chem. 237, 3354–3358 PMID: [PubMed] [Google Scholar]
- 45.Coppack S.W., Frayn K.N., Humphreys S.M., Dhar H. and Hockaday T.D.R. (1989) Effects of insulin on human adipose tissue metabolism in vivo. Clin. Sci. (Lond) 77, 663–670 10.1042/cs0770663 [DOI] [PubMed] [Google Scholar]
- 46.Gettys T.W., Vine A.J., Simonds M.F. and Corbin J.D. (1988) Activation of the particulate low Km phosphodiesterase of adipocytes by addition of cAMP-dependent protein kinase. J. Biol. Chem. 263, 10359–10363 PMID: [PubMed] [Google Scholar]
- 47.Palmer D., Jimmo S.L., Raymond D.R., Wilson L.S., Carter R.L. and Maurice D.H. (2007) Protein kinase A phosphorylation of human phosphodiesterase 3B promotes 14-3-3 protein binding and inhibits phosphatase-catalyzed inactivation. J. Biol. Chem. 282, 9411–9419 10.1074/jbc.M606936200 [DOI] [PubMed] [Google Scholar]
- 48.Lindh R., Ahmad F., Resjo S., James P., Yang J.S., Fales H.M. et al. (2007) Multisite phosphorylation of adipocyte and hepatocyte phosphodiesterase 3B. Biochim. Biophys. Acta 1773, 584–592 10.1016/j.bbamcr.2007.01.010 [DOI] [PubMed] [Google Scholar]
- 49.Mullins G.R., Wang L., Raje V., Sherwood S.G., Grande R.C., Boroda S. et al. (2014) Catecholamine-induced lipolysis causes mTOR complex dissociation and inhibits glucose uptake in adipocytes. Proc. Natl Acad. Sci. U.S.A. 111, 17450–17455 10.1073/pnas.1410530111 [DOI] [PMC free article] [PubMed] [Google Scholar]
- 50.Olsen J.M., Sato M., Dallner O.S., Sandstrom A.L., Pisani D.F., Chambard J.C. et al. (2014) Glucose uptake in brown fat cells is dependent on mTOR complex 2-promoted GLUT1 translocation. J. Cell Biol. 207, 365–374 10.1083/jcb.201403080 [DOI] [PMC free article] [PubMed] [Google Scholar]
- 51.Knight Z.A., Gonzalez B., Feldman M.E., Zunder E.R., Goldenberg D.D., Williams O. et al. (2006) A pharmacological map of the PI3-K family defines a role for p110α in insulin signaling. Cell 125, 733–747 10.1016/j.cell.2006.03.035 [DOI] [PMC free article] [PubMed] [Google Scholar]
- 52.Araiz C., Yan A., Bettedi L., Samuelson I., Virtue S., McGavigan A.K. et al. (2019) Enhanced β-adrenergic signalling underlies an age-dependent beneficial metabolic effect of PI3K p110α inactivation in adipose tissue. Nat. Commun. 10, 1546 10.1038/s41467-019-09514-1 [DOI] [PMC free article] [PubMed] [Google Scholar]
- 53.Tan S.-X., Fisher-Wellman K.H., Fazakerley D.J., Ng Y., Pant H., Li J. et al. (2015) Selective insulin resistance in adipocytes. J. Biol. Chem. 290, 11337–11348 10.1074/jbc.M114.623686 [DOI] [PMC free article] [PubMed] [Google Scholar]
- 54.Xia W., Pessentheiner A.R., Hofer D.C., Amor M., Schreiber R., Schoiswohl G. et al. (2018) Loss of ABHD15 impairs the anti-lipolytic action of insulin by altering PDE3B stability and contributes to insulin resistance. Cell Rep. 23, 1948–1961 10.1016/j.celrep.2018.04.055 [DOI] [PMC free article] [PubMed] [Google Scholar]
- 55.Stöckli J., Zadoorian A., Cooke K.C., Deshpande V., Yau B., Herrmann G. et al. (2019) ABHD15 regulates adipose tissue lipolysis and hepatic lipid accumulation. Mol. Metab. 25, 83–94 10.1016/j.molmet.2019.05.002 [DOI] [PMC free article] [PubMed] [Google Scholar]
- 56.Bäck K., Brännmark C., Strålfors P. and Arnqvist H.J. (2011) Differential effects of IGF-I, IGF-II and insulin in human preadipocytes and adipocytes – role of insulin and IGF-I receptors. Mol. Cell. Endocrinol. 339, 130–135 10.1016/j.mce.2011.04.005 [DOI] [PubMed] [Google Scholar]
- 57.Bäck K. and Arnqvist H.J. (2009) Changes in insulin and IGF-I receptor expression during differentiation of human preadipocytes. Growth Horm. IGF Res. 19, 101–111 10.1016/j.ghir.2008.06.004 [DOI] [PubMed] [Google Scholar]
- 58.Strålfors P. (1990) Autolysis of isolated adipocytes by endogenously produced fatty acids. FEBS Lett. 263, 153–154 10.1016/0014-5793(90)80726-Y [DOI] [PubMed] [Google Scholar]
- 59.de Sousa Andrade L.N., de Lima T.M., Curi R. and Castrucci A.M. (2005) Toxicity of fatty acids on murine and human melanoma cell lines. Toxicol. In Vitro 19, 553–560 10.1016/j.tiv.2005.02.002 [DOI] [PubMed] [Google Scholar]
- 60.Cinti S., Mitchell G., Barbatelli G., Murano I., Ceresi E., Faloia E. et al. (2005) Adipocyte death defines macrophage localization and function in adipose tissue of obese mice and humans. J. Lipid Res. 46, 2347–2355 10.1194/jlr.M500294-JLR200 [DOI] [PubMed] [Google Scholar]
- 61.Chitraju C., Mejhert N., Haas J.T., Diaz-Ramirez L.G., Grueter C.A., Imbriglio J.E. et al. (2017) Triglyceride synthesis by DGAT1 protects adipocytes from lipid-induced ER stress during lipolysis. Cell Metab. 26, 407–418.e403 10.1016/j.cmet.2017.07.012 [DOI] [PMC free article] [PubMed] [Google Scholar]
- 62.Nyman E., Brännmark C., Palmér R., Brugård J., Nyström F.H., Strålfors P. et al. (2011) A hierarchical whole body modeling approach elucidates the link between in vitro insulin signaling and in vivo glucose homeostasis. J. Biol. Chem. 286, 26028–26041 10.1074/jbc.M110.188987 [DOI] [PMC free article] [PubMed] [Google Scholar]
- 63.Shimomura I., Matsuda M., Hammer R.E., Bashmakov Y., Brown M.S. and Goldstein J.L. (2000) Decreased IRS-2 and increased SREBP-1c lead to mixed insulin resistance and sensitivity in livers of lipodystrophic and ob/ob mice. Mol. Cell. 6, 77–86 10.1016/S1097-2765(05)00010-9 [DOI] [PubMed] [Google Scholar]
- 64.McQuaid S.E., Hodson L., Neville M.J., Dennis A.L., Cheeseman J., Humphreys S.M. et al. (2011) Downregulation of adipose tissue fatty acid trafficking in obesity: a driver for ectopic fat deposition? Diabetes 60, 47–55 10.2337/db10-0867 [DOI] [PMC free article] [PubMed] [Google Scholar]
- 65.Allister C.A., Liu L.-F., Lamendola C.A., Craig C.M., Cushman S.W., Hellerstein M.K. et al. (2015) In vivo 2H2O administration reveals impaired triglyceride storage in adipose tissue of insulin-resistant humans. J. Lipid Res. 56, 435–439 10.1194/jlr.M052860 [DOI] [PMC free article] [PubMed] [Google Scholar]
- 66.Edens N.K., Leibel R.L. and Hirsch J. (1990) Mechanism of free fatty acid re-esterification in human adipocytes in vitro. J. Lipid Res. 31, 1423–1431 PMID: [PubMed] [Google Scholar]
- 67.Shadid S., Koutsari C. and Jensen M.D. (2007) Direct free fatty acid uptake into human adipocytes in vivo: relation to body fat distribution. Diabetes 56, 1369–1375 10.2337/db06-1680 [DOI] [PubMed] [Google Scholar]
- 68.Arner P., Bernard S., Salehpour M., Possnert G., Liebl J., Steier P. et al. (2011) Dynamics of human adipose lipid turnover in health and metabolic disease. Nature 478, 110–113 10.1038/nature10426 [DOI] [PMC free article] [PubMed] [Google Scholar]
- 69.Czech M.P., Tencerova M., Pedersen D.J. and Aouadi M. (2013) Insulin signalling mechanisms for triacylglycerol storage. Diabetologia 56, 949–964 10.1007/s00125-013-2869-1 [DOI] [PMC free article] [PubMed] [Google Scholar]
- 70.Ruge T., Hodson L., Cheeseman J., Dennis A.L., Fielding B.A., Humphreys S.M. et al. (2009) Fasted to fed trafficking of Fatty acids in human adipose tissue reveals a novel regulatory step for enhanced fat storage. J. Clin. Endocrinol. Metab. 94, 1781–1788 10.1210/jc.2008-2090 [DOI] [PubMed] [Google Scholar]
- 71.Shrago E., Spennetta T. and Gordon E. (1969) Fatty acid synthesis in human adipose tissue. J. Biol. Chem. 244, 2761–2766 [PubMed] [Google Scholar]
- 72.Patel M.S., Owen O.E., Goldman L.I. and Hanson R.W. (1975) Fatty acid synthesis by human adipose tissue. Metabolism 24, 161–173 10.1016/0026-0495(75)90017-7 [DOI] [PubMed] [Google Scholar]
- 73.Galton D.J. (1968) Lipogenesis in human adipose tissue. J. Lipid Res. 9, 19–26 PMID: [PubMed] [Google Scholar]
- 74.Strawford A., Antelo F., Christiansen M. and Hellerstein M.K. (2004) Adipose tissue triglyceride turnover, de novo lipogenesis, and cell proliferation in humans measured with 2H2O. Am J. Physiol. Endocrinol. Metab. 286, E577–E588 10.1152/ajpendo.00093.2003 [DOI] [PubMed] [Google Scholar]
- 75.Eissing L., Scherer T., Tödter K., Knippschild U., Greve J.W., Buurman W.A. et al. (2013) De novo lipogenesis in human fat and liver is linked to ChREBP-β and metabolic health. Nat. Commun. 4, 1528 10.1038/ncomms2537 [DOI] [PMC free article] [PubMed] [Google Scholar]
- 76.Palou M., Priego T., Sánchez J., Villegas E., Rodríguez A.M., Palou A. et al. (2008) Sequential changes in the expression of genes involved in lipid metabolism in adipose tissue and liver in response to fasting. Pflugers Arch 456, 825–836 10.1007/s00424-008-0461-1 [DOI] [PubMed] [Google Scholar]
- 77.Bronnikov G., Aboulaich N., Vener A. and Strålfors P. (2008) Acute effects of insulin on the activity of mitochondrial GPAT1 in primary adipocytes. Biochem. Biophys. Res. Commun. 367, 201–207 10.1016/j.bbrc.2007.12.127 [DOI] [PubMed] [Google Scholar]
- 78.Ranganathan G., Unal R., Pokrovskaya I., Yao-Borengasser A., Phanavanh B., Lecka-Czernik B. et al. (2006) The lipogenic enzymes DGAT1, FAS, and LPL in adipose tissue: effects of obesity, insulin resistance, and TZD treatment. J. Lipid Res. 47, 2444–2450 10.1194/jlr.M600248-JLR200 [DOI] [PMC free article] [PubMed] [Google Scholar]
- 79.Meegalla R.L., Billheimer J.T. and Cheng D. (2002) Concerted elevation of acyl-coenzyme A:diacylglycerol acyltransferase (DGAT) activity through independent stimulation of mRNA expression of DGAT1 and DGAT2 by carbohydrate and insulin. Biochem. Biophys. Res. Commun. 298, 317–323 10.1016/S0006-291X(02)02466-X [DOI] [PubMed] [Google Scholar]
- 80.Brännmark C., Palmér R., Glad S.T., Cedersund G. and Strålfors P. (2010) Mass and information feedbacks through receptor endocytosis govern insulin signaling as revealed using a parameter-free modeling framework. J. Biol. Chem. 285, 20171–20179 10.1074/jbc.M110.106849 [DOI] [PMC free article] [PubMed] [Google Scholar]
- 81.Rajan M.R., Fagerholm S., Karlsson C., Kjølhede P., Turkina M. and Strålfors P. (2013) Phosphorylation of IRS1 at serine 307 in response to insulin in human adipocytes is not likely to be catalyzed by p70 ribosomal S6 kinase. PLoS ONE 8, e59725 10.1371/journal.pone.0059725 [DOI] [PMC free article] [PubMed] [Google Scholar]
- 82.Garvey W.T., Huecksteadt T.P., Matthaei S. and Olefsky J.M. (1988) The role of glucose transporters in the cellular insulin resistance of type II non-insulin-dependent diabetes mellitus. J. Clin. Invest. 81, 1528–1536 10.1172/JCI113485 [DOI] [PMC free article] [PubMed] [Google Scholar]
Associated Data
This section collects any data citations, data availability statements, or supplementary materials included in this article.


