

Abstract
When the Japanese quail is held in constant darkness, retinal responses (ERG b-waves) increase during the animal’s subjective night and decrease during its subjective day. Rod photoreceptors dominate the b-wave responses (λmax = 506 nm) to all stimulus intensities at night but only to those intensities below the cone threshold during the day. Above the cone threshold, cones dominate b-wave responses (λmax, ∼550–600 nm) during the day regardless of the state of retinal adaptation. Apparently a circadian oscillator enables cone signals to block rod signals during the day but not at night. The ERG b-wave reflects the activity of bipolar cells that are postsynaptic to rods and cones. The ERG a-wave reflects the activity of both rods and cones. The amplitude of the isolated a-wave (PIII) changes with time of day, as does that of the b-wave, but its spectral sensitivity does not. The PIII responses are maximal at ∼520 nm both day and night and may reflect multiple receptor mechanisms. The shift in rod–cone dominance detected with the ERG b-wave resembles the Purkinje shift of human vision but, unlike the Purkinje shift, does not require a change in ambient light intensity. The shift occurs in constant darkness, with a period of ∼24 hr indicative of a circadian rhythm in the functional organization of the retina.
Keywords: circadian rhythm, retina, ERG, quail, rod–cone dominance, photoreceptor
Animals can see over wide ranges of light intensity from sunlit days to starlit nights–more than a 1,000,000-fold change in illumination. In most vertebrate retinas, two types of photoreceptors, rods and cones, provide visual sensitivity throughout this range. Rods mediate vision in dim light, whereas cones operate in bright light and provide color vision. Rods, cones, and the cells they innervate have important roles in setting the sensitivity of the retina (Dowling, 1987). In many animals, the retina adapts in response to changes in ambient illumination; in others, it anticipates them.
For example, a circadian clock in the brain of Limulustransmits efferent optic nerve activity to the lateral eyes, increasing their sensitivity at night (Barlow et al., 1977; Barlow, 1988) and enabling them to see nearly as well at night as they do during the day (Powers et al., 1991; Herzog et al., 1996). Circadian rhythms have been detected in numerous invertebrate visual systems but are not unique to them (Block et al., 1993). These rhythms characterize many vertebrate visual systems that possess circadian oscillators in the suprachiasmatic nucleus, in the pineal gland, and in the eyes themselves (Hamm and Menaker, 1980; Besharse and Iuvone, 1983; Terman and Terman, 1985; Remé et al., 1991) (L. Li and J. E. Dowling, in press).
At the level of the retina, circadian rhythms have been detected in such cellular and molecular processes as photoreceptor disk shedding [chick (Young, 1978); mammals (LaVail and Ward, 1978)], retinomotor movements [amphibians (Pierce and Besharse, 1985); fish (Dearry and Burnside, 1988)], enzyme activities [amphibian (Besharse and Iuvone, 1983)], and gene transcription [chick (Pierce et al., 1993); amphibian (Green and Besharse, 1994)]. Circadian rhythms have also been reported in the light sensitivity of retinas in mammals (Brandenburg et al., 1983; Terman and Terman, 1985), fish (Bassi and Powers, 1987), and birds (Barattini et al., 1981; Schaeffel et al., 1991; Uchiyama et al., 1991). It is not known whether the rhythms in cellular and metabolic processes of the retina are related to those in sensitivity.
Here we report circadian changes in the functional organization of the quail retina. We show that both photoreceptor (PIII) and postphotoreceptor (b-wave) responses exhibit circadian rhythms. An endogenous clock seems to modulate PIII responses by influencing the sensitivities of both rods and cones. The clock modulates b-wave responses by shifting the relative weight of rod and cone inputs to the inner retina. When an animal remains in constant darkness, cones dominate retinal sensitivity during the day, and rods dominate at night. Circadian oscillators located in the eyes themselves may control the circadian rhythms we report here (Underwood et al., 1988,1990).
MATERIALS AND METHODS
Animal maintenance. Sexually mature Japanese quail (Coturnix coturnix japonica) were purchased from Bruckner poultry laboratory (Cornell University, Ithaca, NY) and maintained in a 12/12 hr light/dark cycle at least 1 week before experimentation. Birds were anesthetized initially with an intraperitoneal injection of Rompun (2 mg/kg) and an intramuscular injection of Ketamine (5 mg/kg). A tracheotomy was performed, and one caudal thoracic air sac was punctured to ensure one-way air flow. Animals were then given an intraperitoneal injection of urethane (10%; 1.0 ml/100 gm body weight) and an intramuscular injection of curare (0.1%; 0.3–0.4 ml/100 gm body weight) and placed on moisturized air (95% O2; 5% CO2; 140 ml/min). The bird was then transferred to a stereotactic holder within a light-tight cage. Heart rate was monitored (Global Specialties oscilloscope; Realistic speakers) via intramuscular electrodes placed in the breast muscles, and body temperature was maintained with a heating pad (38–40°C). Animals were maintained under deep anesthesia with either an intramuscular or an intraperitoneal infusion of Ringer’s solution, urethane (4.0–8.1 mg/hr), curare (0.16–0.32 mg/hr), and glucose (2.5%).
Recording techniques. A teflon-coated silver-chloride wire (A-M Systems; 0.005“ bare) electrode was threaded into a 30 gauge needle and passed through the sclera into the vitreous of each eye. The experimental eye was sutured open, and the cornea was covered with high viscosity clear silicone to prevent drying (Dow Corning); the other eye served as a reference. A light pipe was positioned ∼5 mm from the corneal surface of the experimental eye to ensure full-field illumination; the reference eye was closed. Stimuli for spectral sensitivity data were generated with a xenon light source fitted with a 0.125 m, single-grating monochromator and 10 nm bandpass (Oriel Corporation). For some experiments (see Figs. 6, 7), the unattenuated output (Log I = 0.0) of the light pipe was ∼1014 photons sec−1cm−2 (Photodiode Model 211; Graseby Optronics). Flashes delivered from a tungsten source (λ = 610 nm) were used for long-term experiments (see Fig. 3). The light intensities of both light sources were attenuated by neutral density filters.
Fig. 6.

Intensity–response functions of the ERG b-wave measured day and night in constant darkness. A–D, The amplitude of the ERG response is plotted as a function of Log I for four wavelengths. The stimulus intensity at Log I equals 0.0 is 1014 photons sec−1cm−2 that for a 50 msec flash is 5 × 10¹² photons cm−2flash−1. The intensity–response functions change with time of day for all wavelengths tested. They grow monotonically with increasing stimulus intensity at night (filled circles) but exhibit plateau regions at lower light stimuli during the day (open circles). The plateaus become less prominent at longer wavelengths.
Fig. 7.

Average intensity–response functions over the plateau region (n = 3). Data from individual experiments were scaled vertically to adjust for differences in sensitivity. As indicated in Figure 6, the plateau in the daytime function is most prominent at shorter wavelengths (λ = 470 nm). It is not detectable at λ equals 610 nm, which is an isosbestic point for most experiments. Error bars give SDs.
Fig. 3.
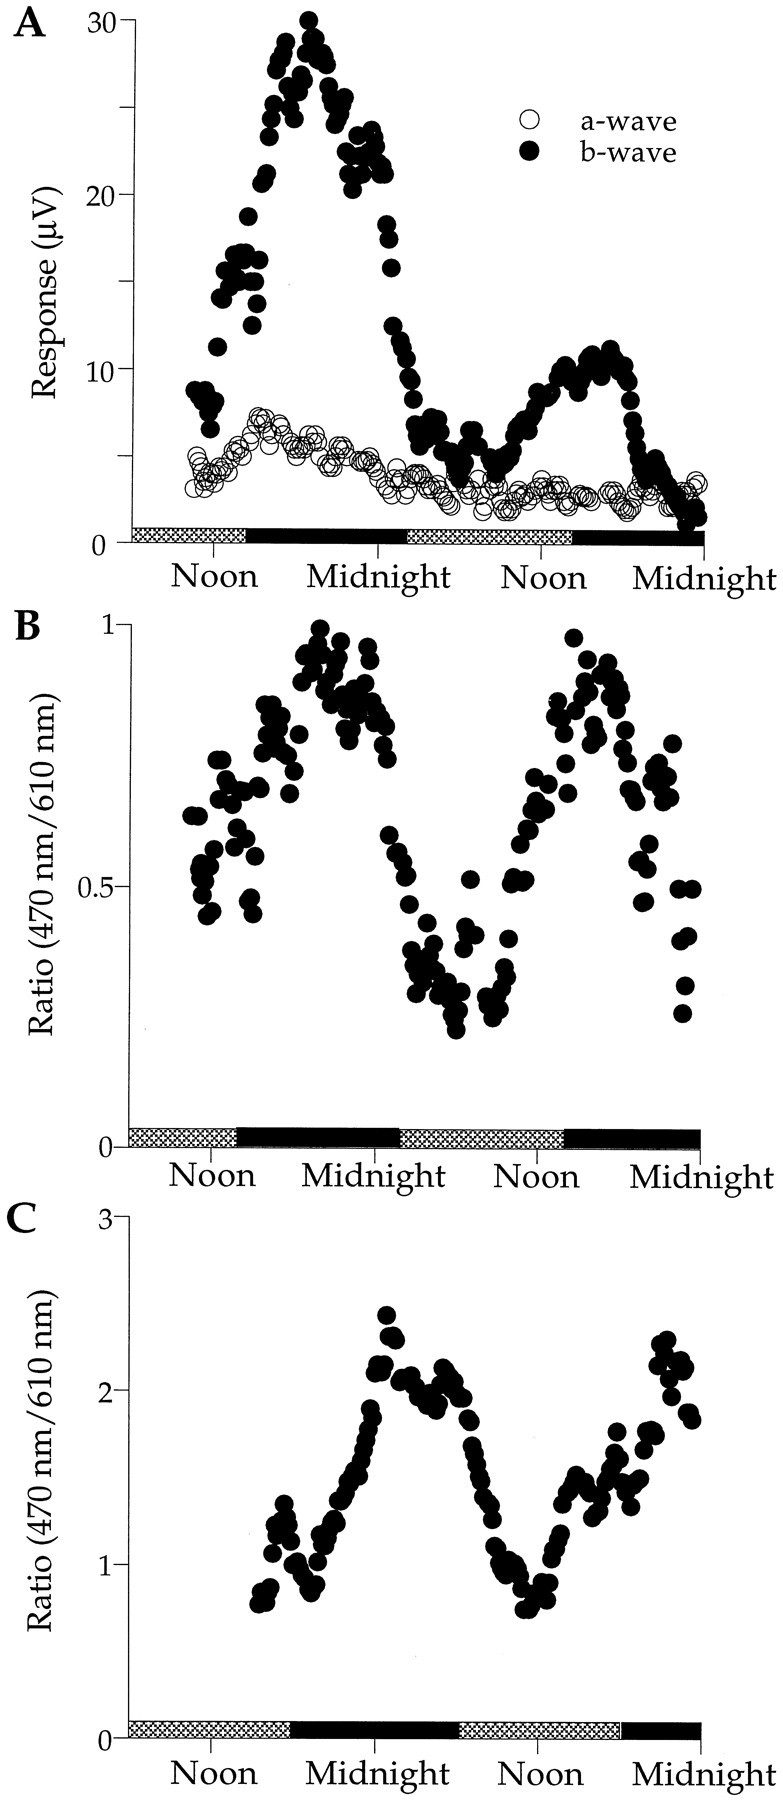
ERGs recorded over several days in constant darkness. A, ERG a- and b-waves in response to 470 nm flashes are shown. The b-wave amplitude is high during the subjective night (black bars) and low during the subjective day (gray bars). After reaching a stable level early in the experiment, the a-wave amplitude decayed slowly without the day–night changes exhibited by the b-wave. B-waves in response to longer wavelength (610 nm) flashes (data not shown) followed the same time course as the a-wave, indicating a slow loss of retinal sensitivity over the course of the experiment. B, The ratio of b-wave amplitude in response to a 470 nm flash to that in response to a 610 nm flash is shown. Under ideal conditions, b-wave responses to 610 nm light flashes do not change over the course of the experiment. The ratio provides a convenient means for normalizing the data when retinal sensitivity decreases during long-term experiments.C, A 4 hr delayed entrainment cycle shifts the rhythmic changes in the b-wave relative to those shown in B. Over nine experiments, the period of this rhythm ranges from 20 to 28 hr with an average of 24.4 ± 3.0 hr.
Electroretinograms (ERGs) were elicited with a 50 msec flash of light, amplified (WPI Dam 50; filter settings of 0.1 Hz to 3 kHz), and recorded on a Gould chart recorder (Gould Model 220) and/or a Hewlett Packard Signal Averager or Tektronix Oscilloscope (TDS 310). Reducing flash duration to 10 msec did not significantly alter the shape and/or amplitude of the ERG b-wave, but extending the duration beyond 50 msec decreased its amplitude. Figure 1(top) shows the waveform of an ERG. The corneal positive b-wave is a convenient measure of retinal sensitivity (Dowling, 1960). It reflects the responses of ON bipolar cells and thus represents postsynaptic activity in the retina (Stockton and Slaughter, 1989). The b-wave amplitude is defined as the voltage difference between the trough of the a-wave and the peak of the b-wave (Arden et al., 1960). The amplitude of the b-wave was tracked for up to 50 hr while animals were maintained in constant darkness. Throughout the period, light flashes of constant intensity were delivered once every 10 or 15 min, alternating between 470 and 610 nm. Spectral sensitivities of the b-wave responses were measured day and night for wavelengths ranging from 425 to 700 nm while the animal remained dark-adapted. To improve the signal-to-noise ratio of responses to low intensity stimuli (Log I = −4.5 to Log I = −3.0), we averaged up to 100 b-waves. A criterion response amplitude was established for each experiment in the range of 40–60 μV, and the intensities (photons sec−1 cm−2) required to elicit that response were plotted as a function of wavelength to yield the spectral sensitivities reported here.
Fig. 1.

ERGs recorded from the Japanese quail eye.Top, An ERG evoked by a 50 msec flash of light (λ = 520 nm). The a-wave amplitude is measured from the baseline to the trough of the a-wave, and the b-wave amplitude is measured from the trough of the a-wave to the peak of the b-wave. Bottom, An ERG after APB was injected in the vitreous to block the b-wave. The isolated a-wave (PIII) was evoked by a 50 msec flash of light (λ = 520 nm). The photoreceptor response (PIII) is measured from the baseline to thebottom of the trough. Each waveform is the average of eight responses to light flashes of Log I equals −2.0.
In addition to the b-wave, we also examined the characteristics of the photoreceptor component of the ERG or PIII that is the isolated a-wave (Granit, 1947). The PIII often exhibits two components, fast PIII and slow PIII, both of which reflect photoreceptor activity (Steinberg et al., 1991). We isolated PIII with 2-amino-4-phosphonobutyric acid (APB) that blocks ON bipolar cell responses, thereby eliminating the b-wave (Slaughter and Miller, 1981, 1983). After ensuring the retina had a normal ERG, we injected APB into the vitreous (20 mm; 10 μl) under dim red light. Although APB generally blocked the b-wave within 20 min, the animal was allowed to dark adapt at least 30 min before testing. PIII amplitude (Fig. 1, bottom) was measured as the difference between the baseline and the trough of the corneal negative deflection of the waveform. The PIII was evoked by brief flashes of light (λ = 520 nm) presented every 10 or 15 min for up to 50 hr. We measured the spectral sensitivity of PIII at various times during the 50 hr period using the same technique described above for the b-wave but with a lower criterion response (10 μV).
RESULTS
Retinal sensitivity changes with time of day
Figure 2A displays ERGs recorded day and night from the dark-adapted quail eye in situ in response to 520 nm light flashes. At night, the b-wave amplitude was larger than it was during the day, especially in response to intermediate and high light intensities. At the highest intensity flash, the b-wave was 41% higher at night, reaching an amplitude of 105 μV versus 62 μV during the day (Fig. 2A). The latency of the peak of the b-wave response decreased as intensity increased but did not change significantly from day to night. It was minimal at the highest intensity (∼40 msec) and maximal at the lowest intensity (∼80 msec). The b-wave is a measure of responses generated by second order cells in the inner nuclear layer of the retina. Figure2A shows that the a-wave, which reflects photoreceptor activity, was also greater in amplitude at night. To study its properties in greater detail, we isolated it by blocking the b-wave with APB.
Fig. 2.

ERGs recorded in response to a wide range of light stimuli (λ = 520 nm) day and night. A, The ERG b-wave, which is a postphotoreceptor response, is larger at night than it is during the day. Light flashes (50 msec) occurred at the beginning of each trace. B, The PIII component, which is a photoreceptor response, is also larger at night. Light flashes (50 msec) occurred ∼50 msec after the beginning of each trace. Animals were maintained in constant darkness for all recordings. Oscillatory potentials are apparent near the peak of the b-wave during the day and on the falling phase at night. The exact origin of these components of the b-wave is not known (Dowling, 1987).
Photoreceptor sensitivity changes with time of day
Figure 2B shows isolated a-waves (PIII) recorded from the dark-adapted quail eye in situ in response to 520 nm light flashes. The PIII component was first detected at Log I equals −3.5. Its amplitude increased with flash intensity and was larger at night for all test intensities. At the highest intensity (Log I = 0.0), the PIII was 34% larger at night, reaching 170 μV versus a daytime amplitude of 110 μV (Fig. 2B). Latency to the peak of the PIII decreased as intensity increased from ∼135 msec at Log I equals −3.5 to ∼75 msec at Log I equals 0.0 during the day and from ∼135 msec at Log I equals −3.5 to ∼50 msec at night.
The robust change in PIII amplitude with time of day shown in Figure2B was not observed in every experiment. Most yielded significant changes in PIII amplitude over the first 24 hr period, but not during the second day in constant darkness when rhythmic changes were often highly damped or nonexistent. In experiments that did not isolate the PIII, day–night changes in a-wave amplitude were occasionally detected as in Figure 2A but were not seen in most cases (see Fig. 3A). It is not known why the magnitude of the circadian rhythm of the photoreceptor response varies from one preparation to the next.
In summary, the results in Figure 2 show that both photoreceptor and postphotoreceptor components of the ERG change with time of day, high at night and low during the day. Are these changes indicative of an endogenous rhythm in retinal function?
A circadian oscillator seems to control day–night changes in the retina
Figure 3A plots a- and b-wave responses to 470 nm flashes recorded over a period of 2 d in constant darkness. The amplitude of the b-wave increases during the first subjective night, decreases during the following subjective day, and again increases during the second night. The rhythmic behavior of the b-wave amplitude is damped with ∼60% reduction in maximum amplitude on the second night relative to the first night. The a-wave amplitude does not exhibit such rhythmic changes but also does not remain constant over the 2 d period. It decays slowly after the beginning of the first subjective night. B-wave responses to 610 nm flashes (data not shown) also were nonrhythmic and decayed slowly over the 2 d period. The slow decay of the a- and b-waves over several days characterizes the majority of our experiments and seems to represent a gradual decline in retinal sensitivity. Short-term experiments were more stable, and b-wave responses to 610 nm flashes did not change with time of day, indicating that 610 nm is an isosbestic point for b-wave sensitivity (see Fig. 5A). We used this isosbestic behavior of 610 nm responses to compensate for long-term changes in retinal sensitivity. For example, Figure3B plots the ratio of 470 to 610 nm responses as a function of time of day.
Fig. 5.

Spectral sensitivity of the retina changes with time of day. A, Spectral sensitivity of the b-wave is high at night (filled circles; λmax, ∼500 nm) and low during the day (open circles; λmax, ∼550–600 nm). Retinal sensitivity does not change with time of day in the region of 610 nm, which is an isosbestic point. Criterion responses were 40–60 μV for individual experiments (n = 7).B, Spectral sensitivity of the PIII component also increases at night but shows no spectral shift (λmax, ∼520 nm during both day and night). Criterion responses were 10 μV (n = 3).C, Changes in b-wave spectral sensitivity of a single retina over a 2 d period are shown. As in A, sensitivity is low during the day (open symbols) and high at night (filled circles). D, Changes in PIII spectral sensitivity of a single retina during 2 d in constant darkness are shown. Again, sensitivity is high at night (filled circles) and low during the day (open symbols). Day data were taken from 10 A.M. to 3 P.M., and night data are from 8 P.M. to midnight. Solid curves are rhodopsin nomograms (λmax = 506 nm). Error bars in A indicate SEMs and in Bindicate SDs.
The light intensity used to track long-term changes in the ERG in Figure 3A was sufficiently high to evoke a medium amplitude b-wave and a small but discernible a-wave. Because the a-wave did not change significantly with time of day, it does not interfere with measurements of the b-wave. In other experiments in which the light intensity used to track the ERG was too low to evoke a detectable a-wave, the b-wave exhibited robust day–night rhythms similar to those shown in Figure 3, B and C. The intensity required to evoke a measurable a-wave is generally 2 log units greater than that for evoking a detectable b-wave.
Figure 3B plots the ratio of 470 to 610 nm b-wave responses from the data in Figure 3A. Normalizing the data in this manner yields nearly equal nighttime increases in retinal sensitivity. After the first night in darkness, retinal sensitivity decreases, reaching its lowest levels during the middle of the second subjective day, and then increases in anticipation of the second subjective night, reaching peak amplitudes several hours after subjective dusk.
Figure 3C plots the ratio of 470 to 610 nm responses recorded from an animal exposed to a light/dark entrainment cycle that was shifted by 4 hr with respect to that for the experiment shown in Figure 3, A and B. Lights were turned on at 6 A.M. and off at 6 P.M. in synchrony with the solar day. Here again the b-wave is maximal around the middle of the first subjective night (black bars) and decreases throughout the early morning hours, with the smallest responses recorded around noon the following day. These experiments show that the day–night changes in retinal sensitivity continue in constant darkness and can be entrained to a new light cycle, two hallmarks of an endogenous circadian rhythm.
The photoreceptor response (PIII) also changes with time of day. In the experiment shown in Figure 4, an animal was maintained in constant darkness while the isolated a-wave (PIII) was recorded continuously over ∼48 hr. During the subjective night, the PIII amplitude grows, reaching peak amplitudes near midnight, and then declines rapidly to a trough during the subjective day. The PIII amplitude begins to grow again after noon, just before the projected time of sunset. The amplitude of the response does not reach the heights recorded during the first subjective night. Because there is no isosbestic point for the PIII (see Fig. 5B), we cannot normalize the data to adjust for long-term decline in the sensitivity of the preparation, as was done for the b-wave. However, the circadian changes in PIII amplitude are similar to those detected for the unnormalized b-wave data (Fig. 3A). To explore the possible mechanisms underlying these day–night changes, we measured the spectral sensitivity of both b-wave and PIII day and night.
Fig. 4.

Photoreceptor responses change with time of day while an animal remains in constant darkness. In response to a 50 msec flash (λ = 520 nm), the amplitude of the isolated a-wave (PIII) increases during the subjective night (black bars), decreases during the subjective day (gray bars), and again increases during the subjective night.
Spectral sensitivity changes with time of day
ERG responses to test wavelengths spanning the visible spectrum were measured in dark-adapted animals day and night (Fig.5). The spectral sensitivity of the b-wave shifts from day to night with its amplitude peaking at intermediate wavelengths (∼500 nm; filled circles) at night and at longer wavelengths (∼550–600 nm; open circles) during the day (Fig. 5A). The smooth curve is a nomogram for a rod photopigment (λmax = 506 nm) based on our microspectrophotometric measurements (see Discussion). In the vicinity of 610 nm, the spectral sensitivity of the b-wave does not change significantly from day to night, indicating that this is an isosbestic region. The shift of peak spectral sensitivity to longer wavelengths during the day is associated with an approximately sixfold or 0.8 log unit decrease in sensitivity. More than 100-fold decreases in sensitivity were detected for the responses to shorter wavelength flashes (≤470 nm).
Figure 5B shows the day and night spectral sensitivities of photoreceptor responses measured with the APB-isolated a-wave (PIII). Regardless of time of day, spectral sensitivity of PIII peaks at ∼520 nm with the greatest day–night changes occurring at middle wavelengths. What receptor mechanisms underlie PIII spectral sensitivity? The 506 nm nomogram for the rod pigment does not fit either the daytime (open circles) or nighttime data (filled circles) well. This is also the case for a 510 nm nomogram that we derived from our microspectrophotometric measurements of cones (curve not shown). In view of the variability of the data, it is not possible to determine whether rods, cones, or their combination generate the PIII. Generally, avian retinas contain relatively few rods (Walls, 1963). In the chicken, rods comprise 14% of the photoreceptor population in the central retina and just 30% in the periphery (Morris, 1976). Assuming that quail has a similar distribution of photoreceptors, it is not surprising that cones may contribute to the PIII response. The changes in photoreceptor sensitivity with time of day measured with PIII do not parallel the overall changes in retinal sensitivity detected with the b-wave. Whereas retinal sensitivity decreases and shifts to longer wavelengths during the day, the photoreceptor response decreases without a corresponding spectral shift.
The day–night changes in spectral sensitivity of the b-wave and PIII for individual animals (Fig. 5C,D) match the average data shown in Figure 5, A and B. During Day 1, the spectral sensitivity of the b-wave (Fig. 5C) peaked at long wavelengths (open circles; 550–600 nm) and appears cone dominated. At night, sensitivity increased (0.8 log units) and shifted to shorter wavelengths (filled circles; ∼500 nm) and appears to be dominated by rod responses. On Day 2, the retinal sensitivity returned to its low daytime state, with the peak sensitivity around 600 nm (open squares). This experiment was repeated for the PIII response in another animal (Fig.5D). The sensitivity of the PIII response was low during the day and increased at night (∼0.8 log units). During Day 2, its sensitivity decreased to the Day 1 level. Unlike the b-wave, the spectral sensitivity of PIII does not shift with time of day.
Amplitude of circadian rhythms depends on stimulus intensity
The growth of the ERG b-wave in Figure 2Aincreases monotonically with light intensity at night but not during the day. Note that during the day, the b-wave amplitude increases with increasing intensity from Log I equals −4.5 to Log I equals −3.5 but remains nearly unchanged over the 30-fold increase in light intensity from Log I equals −3.5 to Log I equals −2.0. For intensities greater than Log I equals −1.5, the b-wave again grows monotonically with light intensity. Plotting the ERG amplitude as a function of light intensity (Fig. 6) reveals a dramatic day–night difference in the behavior of the b-wave, especially at shorter wavelengths. All daytime intensity–response functions exhibit a plateau corresponding to b-wave amplitudes in the range of 4 to 8 μV. The plateau is most pronounced at λ equals 470 nm and minimal at λ equals 610 nm. The long wavelength part of the spectrum generally represents an isosbestic region in which day–night changes in sensitivity are minimal. Unlike daytime responses, the b-wave increases smoothly at night with light intensity, and the intensity–response functions generally do not exhibit distinct plateaus. The slight suggestion in the data of a plateau at 520 nm (Log I, −3.5 to −3.0) was observed only in this experiment (see Fig.7).
We further explored the plateau region in the intensity–response function by averaging the results from several experiments for intermediate light levels (Fig. 7). In the low to intermediate intensity range (Log I, −4.5 to −2), a plateau is clear in the daytime responses at short wavelengths (λ = 470 nm) and decreases with increasing wavelength until it is indistinguishable at λ equals 610 nm. Although a plateau was detectable at long wavelengths in the experiment shown in Figure 6, this is not the case for the averaged data shown in Figure 7. The averaged nighttime responses grow monotonically with light intensity, with no clear plateau detectable at any wavelength. Daytime and nighttime responses nearly overlay at λ equals 610 nm, confirming this to be an isosbestic region for retinal sensitivity. The PIII grows monotonically with light intensity both day and night for all wavelength stimuli, i.e., no plateaus are evident. Only the intensity–response functions of the postsynaptic b-wave response exhibits this characteristic plateau region.
Responses at low light levels do not exhibit robust circadian rhythms
In Figure 6, responses at low light intensities exhibit little or no changes from day to night. To explore the possible underlying mechanisms, we analyzed the spectral sensitivity of the dark-adapted retina at both low and high light levels. Figure8 plots spectral sensitivities of b-wave responses above and below the cone threshold. At low light intensities, spectral sensitivity for a criterion of 3 μV is approximately the same day and night and matches the rhodopsin nomogram (λmax = 506 nm) well. However, at intensities required to produce a 30 μV response, spectral sensitivity shows distinct day–night changes, also shown in Figure 5. The rhodopsin nomogram (λmax = 506 nm) matches well the nighttime data regardless of the criterion level, indicating that nighttime responses are dominated by rod activity at all stimulus levels. This is not the case during the day. Spectral sensitivity shifts from rod dominance (λmax = 506 nm) at low light intensities to what appears to be cone dominance (λmax, 550–600 nm) at higher intensities. We conclude that a circadian oscillator does not strongly influence retinal responses to low intensity stimuli during either the day or night. Responses to these low intensities are rod-dominated regardless of the time of day.
Fig. 8.

Circadian rhythms in retinal sensitivity are most prominent above the cone threshold. Sensitivity of the retina below the cone threshold (criterion = 3 μV) does not change with time of day and matches a rhodopsin nomogram (λmax = 506 nm;solid line) reasonably well. Sensitivity above the cone threshold (criterion = 30 μV) is greater at night and is also well fit by a rhodopsin nomogram (λmax = 506 nm). However, during the day, sensitivity decreases and shifts to longer wavelengths (λmax, ∼550 nm) and no longer matches a rhodopsin nomogram.
Cones dominate the light-adapted retina regardless of time of day
Figure 9 plots b-wave spectral sensitivity day and night in both light- and dark-adapted animals. During the day, maximal sensitivity was between 550 and 600 nm regardless of the state of adaptation, indicative of cone dominance (filled and open circles). Light adaptation at night reduced sensitivity by ∼30-fold and shifted the peak sensitivity from λmax equals 506 nm (filled squares) to a λmax between ∼550 and 600 nm (open squares). Light adaptation during the day decreased b-wave sensitivity by 2.5-fold from the dark-adapted state but remained cone-dominated. Thus, regardless of time of day, the sensitivity of the light-adapted retina is cone-dominated. A circadian clock shifts the retina from cone to rod dominance at night in constant darkness. However, light adaptation at night can override the clock and shift the retina to cone dominance.
Fig. 9.

Light adaptation of the retina at night produces a daytime-like spectral sensitivity. Dark-adapted spectral sensitivity (filled symbols) exhibits rod dominance at night. Light adaptation (open symbols) reduces nighttime sensitivity and shifts peak spectral sensitivity to longer wavelengths (λmax, ∼550–600 nm). Light adaptation was achieved by opening the cage to ambient room light. (Daytime light,n = 2; nighttime light, n = 3; daytime and nighttime dark data replotted from Fig.5A).
DISCUSSION
Circadian rhythms in the Japanese quail retina
The ERG of the Japanese quail undergoes daily changes in both photoreceptor (PIII) and retinal (b-wave) sensitivity. These persist when the animal is held in complete darkness and thus represent endogenous circadian rhythms. The changes in retinal sensitivity are more robust, ∼100-fold greater, at shorter wavelengths than are those in photoreceptor sensitivity. The rhythmic changes in the amplitude of the b-wave depend on both time of day and stimulus intensity, whereas those in the amplitude of PIII depend only on time of day. These circadian rhythms may be related to that of melatonin synthesis controlled by an intraocular oscillator (Underwood et al., 1988, 1990). Recent studies have explored a possible link between the circadian changes reported here and the retinal neuromodulators that drive these changes (Kelly et al., 1996).
Rod and cone contributions to the ERG
What receptor mechanisms generate the PIII response? Figure5B plots a nomogram for the 506 nm rod pigment as well as the spectral sensitivity of the PIII response recorded day and night. The nomogram does not fit either the daytime (open circles) or nighttime (filled circles) data well. Neither does a 510 nm nomogram derived from our microspectrophotometric measurements of cones (curve not shown). The substantial variability of the spectral sensitivity values in Figure 5B precludes our making any firm conclusions regarding the photoreceptor origin of the PIII response. We note, however, that cones generally outnumber rods in the avian retina (Walls, 1963). For example, in the chick retina, cones comprise 86% of the photoreceptors in the central retina and 70% in the periphery (Morris, 1976). If quail has a similar photoreceptor distribution, then cones would be expected to contribute to the PIII response.
What receptor mechanisms generate the b-wave? Figure10 replots from Figure 5Athe spectral sensitivity of the b-wave measured day and night. The nighttime data (filled circles) peak in the region of 500 nm, suggesting rod dominance. Preliminary experiments using microspectrophotometry show that rods in the Japanese quail retina contain rhodopsin with λmax equal to 506 nm (F. Harosi and M. Manglapus, unpublished observations). Figure 5A shows that a rhodopsin nomogram (λmax = 506 nm) fits the data reasonably well up to 600 nm but not beyond. Higher relative sensitivity at these long wavelengths suggests that red cones may be contributing to the ERG b-wave both day and night. Microspectrophotometric results reveal four different types of cone pigments and at least three types of oil droplets. The oil droplets act as cutoff filters to narrow the spectrum of light reaching the cone pigment. Different oil droplets associate with cones containing different pigments. Red cones (λmax, ∼570 nm) are associated with either red (λmax, ∼560 nm) or green (λmax, ∼440 nm) oil droplets. Combining spectral properties of the red pigment with that of the red oil droplet yields an absorption spectrum with a λmax of ∼590 nm that is nearly identical to that calculated by Bowmaker (1980) for this pigment–oil droplet combination (λmax = 589 nm) in pigeon. Combining the spectral properties of rods (λmax = 506 nm) with red cones having red oil droplets (λmax, ∼590 nm) yields a spectral sensitivity (Fig. 10, solid line) that fits the nighttime data well.
Fig. 10.

Day–night spectral sensitivities can be modeled with the properties of visual pigments found in the Japanese quail retina. Nighttime spectral sensitivity of the b-wave (Fig.5A, filled circles) is fit well by thesolid curve that combines a rod nomogram (λmax = 506 nm) with that of a red visual pigment (λmax = 570 nm) associated with a red oil droplet (λmax = 560 nm). Although the retina is rod-dominated at night, red cones may contribute to its sensitivity. Daytime spectral sensitivity (Fig. 5A, open circles) is fit well by a red visual pigment (λmax = 570 nm) associated with a green oil droplet (λmax = 440 nm) that yields the dotted curve. A red visual pigment associated with a red oil droplet (dashed curve) does not fit the daytime sensitivities at middle and short wavelengths well. Other cone types may contribute to the spectral sensitivity of the retina.O.D., Oil droplet.
Can the spectral sensitivity of the daytime state be modeled by pigment and oil droplet properties measured by microspectrophotometry? The quail retina contains rods, cones, and double cones. Based on oil droplet–visual pigment combinations detected with microspectrophotometry, we generated two spectral sensitivity functions. One of them (dashed line) combines a nomogram for a red pigment (λmax, ∼570 nm) and its red oil droplet (λmax, ∼560 nm) and the other (dotted line) combines a red pigment and green oil droplet (λmax ∼440 nm). Note that the red pigment–red oil droplet combination matches the long wavelength portion of the daytime spectral sensitivity of the b-wave but not the short wavelength portion (<570 nm). However, the red pigment–green oil droplet combination matches the daytime spectral sensitivity well at all wavelengths (Fig.10). More accurate modeling of the daytime spectral sensitivity will require further microspectrophotometric analyses as well as more precise knowledge of the relative abundance of each cone type in the retina.
Red cones at night?
Red cones can contribute to retinal sensitivity at night only when stimulus intensities are above the cone threshold. Our best estimate places human cone threshold in the range of Log I from −5.0 to −4.5. Cone threshold may be higher in birds because the oil droplets reduce the maximal pigment absorption by up to 30% (Bowmaker and Knowles, 1977). We estimate the cone threshold to be Log I ≤ −4.0. Figure8 plots retinal sensitivity for stimulus intensities above and below the cone threshold. Intensities below the estimated cone threshold correspond to b-wave amplitudes of 3 μV, whereas intensities above the cone threshold correspond to amplitudes of 30 μV. The solid line representing a rhodopsin nomogram (λmax = 506 nm) fits the low criterion data reasonably well (circles) but not the high criterion data (squares) that exhibit greater sensitivity at long wavelengths. As described above, a combination of rod and red cone pigments (Fig. 10, solid line) fits the nighttime data well, indicating that red cones probably contribute to the nighttime b-wave response at intensities above the cone threshold. It is interesting that in goldfish, red cones also contribute to the nighttime spectral sensitivity of the ERG (Nussdorf and Powers, 1988) and to cone horizontal cell responses (Wang and Mangel, 1996). When the goldfish is in the dark-adapted nighttime state, the spectral sensitivity of L-type cone horizontal cells matches that of rod horizontal cells below λmax equals 610 nm but not at longer wavelengths where sensitivity is enhanced 30-fold [see Wang and Mangel (1996), their Fig. 5]. Thus in both goldfish and Japanese quail, red cones seem to contribute to the sensitivity of the retina at night.
Day–night changes in spectral sensitivity resemble a Purkinje shift
The shift in spectral sensitivity of the retina (b-wave) to shorter wavelengths at night is reminiscent of the Purkinje shift in human vision after dark adaptation. The Purkinje phenomenon in humans reflects a switch from cone (λmax = 550 nm) to rod (λmax = 510 nm) vision. The Purkinje shift in the Japanese quail does not require a change in background illumination but persists in constant darkness with rods dominating retinal sensitivity at night and cones dominating during the day. It seems that a circadian oscillator generates a Purkinje-like shift in the quail retina, adapting it for dim light vision at night.
Cones block rod signals to the inner retina during the day
Although cone threshold is not known in the quail, we estimate human cone threshold to be in the range of Log I from −5.0 to −4.5 in our experiments. A plateau in the daytime intensity–response functions begins ∼1 log unit above this level and seems to represent a transition from rod to cone dominance of retinal sensitivity (Fig. 6). Below the plateau, rods dominate b-wave responses, whereas above the plateau, cones do. The plateau extends over ∼1.5 log units of light intensity at λmax equals 470 nm and is minimal or barely detectable at λmax > 600 nm where the retinal responses are dominated by cones.
Where in the retina does the clock modulate rod–cone dominance? Studies in other vertebrates show that the b-wave reflects activity of ON bipolar cells. Assuming the same is true in the Japanese quail retina, shifts in rod–cone dominance may occur at or before the synaptic input to ON bipolar cells. Because there is no significant rod–cone shift in the photoreceptor-generated PIII (Fig.5B), cone responses must block rod signals before they reach the inner retina. This blockade occurs only during the day in the dark-adapted state. Detection of these rod–cone interactions with ERG recordings is facilitated by the large complement of cones in the duplex quail retina. If similar circadian changes occur in the dark-adapted mammalian retina, they may be obscured by the large contribution of rods to the ERG.
Circadian rhythms have been reported in the outer retina of other vertebrates. Rod and cone inputs to the inner retina are modulated by a circadian clock in fish (Wang and Mangel, 1996). Light responses of L-type horizontal cells were studied in intact goldfish retina day and night. At night, responses of cone horizontal cells resembled those of rod horizontal cells with regard to waveform, threshold, and spectral sensitivity (Wang and Mangel, 1996). During the day, cone-like responses dominated regardless of the state of adaptation, and the spectral sensitivity curve closely matches those of red cones. However, at night when responses were rod-like, light would shift horizontal cell responses to cone dominance (Wang and Mangel, 1996). Such results are strongly reminiscent of those reported here for the Japanese quail and suggest that circadian clocks and environmental lighting cues control visual sensitivity by influencing rod and cone pathways in both species (Wang and Mangel, 1996).
Xenopus photoreceptors also show modulation of rod–cone coupling (Witkovsky et al., 1996). Intracellular rod responses can follow flicker stimulation of >10 Hz by application of a D2 dopaminergic agonist, indicating that rods and cones are coupled by gap junctions in the photoreceptor layer (Witkovsky et al., 1996). Recent evidence suggests that dopamine modulates the rod–cone shifts we report here (Kelly et al., 1996).
What retinal cells contain circadian oscillators?
Day–night changes in overall retinal sensitivity measured with the b-wave are approximately the same as those in photoreceptor sensitivity measured with PIII (Fig. 5), suggesting that circadian rhythms originate in photoreceptors. Analysis of photoreceptor-generated a-waves recorded from rabbit andAnolis has not revealed circadian rhythms (Brandenburg et al., 1983; Fowlkes et al., 1984), but such rhythms, if they exist, may have been masked by the b-wave. However, the excisedXenopus retina stripped of all neural elements except photoreceptors exhibits rhythmic synthesis of melatonin, indicating that the underlying circadian oscillators reside in the photoreceptors (Cahill and Besharse, 1992). The quail retina in situ also synthesizes melatonin rhythmically and does so independently of the fellow retina (Underwood et al., 1988), indicating that each retina possesses independent circadian oscillators. The cellular location of the oscillators is not known.
Rod–cone shifts in other avian systems
Diurnal changes in avian retinal sensitivity were first identified by Barattini et al. (1981). The spectral sensitivities they report for pigeon are similar to those we report here for the Japanese quail. Both reveal a rod–cone shift from day to night. Pigeons show increased sensitivity at night with a shift toward short wavelength stimuli with an isosbestic point at λmax equals 590 nm (Barattini et al., 1981). Although Barattini et al. (1981) did not comment on changes in intensity–response functions at various wavelengths, they suggest that a circadian clock may control the way in which photoreceptors or postsynaptic elements analyze light and that cones may yield to rod dominance at night. In a later study, Schaeffel et al. (1991) measured the spectral sensitivity of the dark-adapted ERG in chickens at various times of the day and night. Animals tested at night exhibited a rod-dominated retina, and those tested during the day exhibited a cone-dominated retina. Although the day–night spectral sensitivities they report in chicken resemble those reported here for quail, it is difficult to reconcile these changes in spectral sensitivity with the intensity–response functions they report. Specifically, the amplitude of the criterion response (60 μV) they used to measure spectral sensitivity does not change from day to night [see Schaeffel et al. (1991), their Fig. 7].
Role of circadian clocks in vision
Although we have noted the existence of circadian rhythms in avian, fish, and amphibian retinas, they are also prevalent in species ranging from horseshoe crabs to humans. In some cases the role of circadian rhythmicity is clear; in others it is not. For example, a circadian clock in the Limulus brain changes the structure and function of the retina, increasing its sensitivity at night and allowing the animal to see mates at night as well as it does during the day (Barlow et al., 1977, 1989; Powers et al., 1991; Herzog et al., 1996; Passaglia et al., 1997). Ocular clocks have been detected in several marine mollusks, but their role in vision is not clear (Block et al., 1993). Vertebrates such as rabbit and Anolis exhibit circadian rhythms in retinal sensitivity (Brandenburg et al., 1983;Fowlkes et al., 1984), and the rat exhibits a rhythm in visual sensitivity (Terman and Terman, 1985). Also, circadian changes in human visual sensitivity have been detected (Bassi and Powers, 1986; Barlow et al., 1997).
Footnotes
This research was supported in part by National Institutes of Health Grant EY 00667 and National Science Foundation Grant IBN 9696208 to R.B.B. We thank Dr. Mary Pierce for critical reading of this manuscript.
Correspondence should be addressed to Dr. Mary K. Manglapus, Center for Vision Research, State University of New York Health Science Center, 750 East Adams Street, Syracuse, NY 13210.
REFERENCES
- 1.Arden G, Granit R, Ponte F. Phase of suppression following each retinal b-wave in flicker. J Neurophysiol. 1960;23:305–314. doi: 10.1152/jn.1960.23.3.305. [DOI] [PubMed] [Google Scholar]
- 2.Barattini S, Battisti B, Cervetto L, Marroni P. Diurnal changes in the pigeon electroretinogram. Rev Can Biol. 1981;40:133–137. [PubMed] [Google Scholar]
- 3.Barlow RB. Circadian rhythm in sensitivity of the Limulus retina nearly compensates for day–night changes in ambient illumination. Invest Ophthalmol Vis Sci [Suppl] 1988;29:350. [Google Scholar]
- 4.Barlow RB, Bolanowski SJ, Brachman ML. Efferent optic nerve fibers mediate circadian rhythms in the Limulus eye. Science. 1977;197:86–89. doi: 10.1126/science.867057. [DOI] [PubMed] [Google Scholar]
- 5.Barlow RB, Chamberlain SC, Lehman HK. Circadian rhythms in the invertebrate retina. In: Stavenga D, Hardie R, editors. Facets of vision. Springer; Berlin: 1989. pp. 257–280. [Google Scholar]
- 6.Barlow RB, Boudreau EA, Moore DC, Huckins SC, Lindstrom AM. Glucose and time of day modulate human contrast sensitivity and fMRI signals from visual cortex. Invest Ophthalmol Vis Sci. 1997;38:S735. [Google Scholar]
- 7.Bassi CJ, Powers MK. Daily fluctuations in the detectability of dim lights by humans. Physiol Behav. 1986;38:871–877. doi: 10.1016/0031-9384(86)90056-9. [DOI] [PubMed] [Google Scholar]
- 8.Bassi CJ, Powers MK. Circadian rhythm in goldfish visual sensitivity. Invest Ophthalmol Vis Sci. 1987;28:1811–1815. [PubMed] [Google Scholar]
- 9.Besharse J, Iuvone PM. Circadian clock in Xenopus eye controlling retinal serotonin N-acetyltransferase. Science. 1983;305:133–135. doi: 10.1038/305133a0. [DOI] [PubMed] [Google Scholar]
- 10.Block G, Khalsa SBS, McMahon DG, Michel S, Guesz GM. Biological clocks in the retina: cellular mechanisms of biological timekeeping. Int J Cytol. 1993;146:83–144. doi: 10.1016/s0074-7696(08)60381-2. [DOI] [PubMed] [Google Scholar]
- 11.Bowmaker J. Colour vision in birds and the role of oil droplets. Trends Neurosci. 1980;3:196–199. [Google Scholar]
- 12.Bowmaker J, Knowles A. The visual pigments and oil droplets of the chicken retina. Vision Res. 1977;17:755–764. doi: 10.1016/0042-6989(77)90117-1. [DOI] [PubMed] [Google Scholar]
- 13.Brandenburg J, Bobbert AC, Eggelmeyer F. Circadian changes in the response of the rabbit’s retina to flashes. Behav Brain Res. 1983;7:113–123. doi: 10.1016/0166-4328(83)90008-6. [DOI] [PubMed] [Google Scholar]
- 14.Cahill GM, Besharse JC. Light sensitive melatonin synthesis by Xenopus photoreceptors after destruction of the inner retina. Vis Neurosci. 1992;8:487–490. doi: 10.1017/s0952523800005009. [DOI] [PubMed] [Google Scholar]
- 15.Dearry A, Burnside B. Stimulation of distinct D2 dopaminergic and alpha 2-adrenergic receptors induces light-adaptive pigment dispersion in teleost retinal pigment epithelium. J Neurochem. 1988;51:1516–1523. doi: 10.1111/j.1471-4159.1988.tb01120.x. [DOI] [PubMed] [Google Scholar]
- 16.Dowling J. The chemistry of visual adaptation in the rat. Nature. 1960;188:114–118. doi: 10.1038/188114a0. [DOI] [PubMed] [Google Scholar]
- 17.Dowling J. The retina: an approachable part of the brain. Harvard UP; Cambridge, MA: 1987. [Google Scholar]
- 18.Fowlkes D, Karwoski CJ, Proenza LM. Endogenous circadian rhythm in electroretinogram of free-moving lizards. Invest Ophthalmol Vis Sci. 1984;25:121–124. [PubMed] [Google Scholar]
- 19.Granit R. Sensory mechanisms of the retina. Oxford UP; New York: 1947. [Google Scholar]
- 20.Green C, Besharse JC. Tryptophan hydroxylase is regulated by a circadian clock in Xenopus laevis retina. J Neurochem. 1994;62:2420–2428. doi: 10.1046/j.1471-4159.1994.62062420.x. [DOI] [PubMed] [Google Scholar]
- 21.Hamm H, Menaker M. Retinal rhythms in chicks: circadian variation in melatonin and serotonin N-acetyltransferase activity. Proc Natl Acad Sci USA. 1980;77:4998–5002. doi: 10.1073/pnas.77.8.4998. [DOI] [PMC free article] [PubMed] [Google Scholar]
- 22.Herzog ED, Powers MK, Barlow RB., Jr Limulus vision in the ocean day and night: effects of image size and contrast. Vis Neurosci. 1996;13:31–41. doi: 10.1017/s0952523800007100. [DOI] [PubMed] [Google Scholar]
- 23.Kelly M, Barlow R, Pierce M. Japanese quail as a model for studying retinal circadian rhythms. Invest Ophthalmol Vis Sci. 1996;37:S636. [Google Scholar]
- 24.LaVail MM, Ward PA. Studies on the hormonal control of circadian outer segment disc shedding in the rat retina. Invest Ophthalmol Vis Sci. 1978;17:1189–1193. [PubMed] [Google Scholar]
- 25.Li L, Dowling JE (1998) Zebrafish visual sensitivity is regulated by a circadian clock. Vis Neurosci, in press. [DOI] [PubMed]
- 26.Morris V. Symmetry in a receptor mosaic demonstrated in the chick from the frequencies, spacing and arrangement of the types of retina receptor. J Comp Neurol. 1976;140:359–398. doi: 10.1002/cne.901400308. [DOI] [PubMed] [Google Scholar]
- 27.Nussdorf J, Powers MK. Spectral sensitivity of the electroretinogram b-wave in dark adapted goldfish. Vis Neurosci. 1988;1:159–168. doi: 10.1017/s0952523800001437. [DOI] [PubMed] [Google Scholar]
- 28.Passaglia C, Dodge F, Herzog E, Jackson S, Barlow R. Deciphering a neural code for vision. Proc Natl Acad Sci USA. 1997;94:12649–12654. doi: 10.1073/pnas.94.23.12649. [DOI] [PMC free article] [PubMed] [Google Scholar]
- 29.Pierce M, Besharse JC. Circadian regulation of retinomotor movements I: interaction of melatonin and dopamine in the control of cone length. J Gen Physiol. 1985;86:671–689. doi: 10.1085/jgp.86.5.671. [DOI] [PMC free article] [PubMed] [Google Scholar]
- 30.Pierce M, Sheshberadaran H, Zhang Z, Fox LE, Applebury ML, Takahashi JS. Circadian regulation of iodopsin gene expression in embryonic photoreceptors in retinal cell culture. Neuron. 1993;10:579–584. doi: 10.1016/0896-6273(93)90161-j. [DOI] [PubMed] [Google Scholar]
- 31.Powers MK, Barlow RB, Jr, Kass L. Visual performance of horseshoe crabs day and night. Vis Neurosci. 1991;7:179–189. doi: 10.1017/s0952523800004016. [DOI] [PubMed] [Google Scholar]
- 32.Remé C, Wirz-Justice A, Terman M. The visual input stage of the mammalian circadian pacemaking system. I. Is there a clock in the mammalian eye? J Biol Rhythms. 1991;6:5–29. doi: 10.1177/074873049100600104. [DOI] [PubMed] [Google Scholar]
- 33.Schaeffel F, Rohrer B, Lemmer T, Zrenner E. Diurnal control of rod function in the chicken. Vis Neurosci. 1991;6:641–653. doi: 10.1017/s0952523800002637. [DOI] [PubMed] [Google Scholar]
- 34.Slaughter M, Miller RF. 2-Amino-4-phosphonobutyric acid: a new pharmacological tool for retina research. Science. 1981;211:182–185. doi: 10.1126/science.6255566. [DOI] [PubMed] [Google Scholar]
- 35.Slaughter M, Miller RF. An excitatory amino acid antagonist blocks cone input to sign-conserving second-order retinal neurons. Science. 1983;219:1230–1232. doi: 10.1126/science.6131536. [DOI] [PubMed] [Google Scholar]
- 36.Steinberg RH, Frishman LJ, Seiving PA. Negative components of the electroretinogram from proximal retina and photoreceptor. In: Osborne NN, Chader GJ, editors. Progress in retinal research. Pergamon; Oxford: 1991. pp. 121–160. [Google Scholar]
- 37.Stockton RA, Slaughter MM. B-wave of the electroretinogram. A reflection of ON bipolar cell activity. J Gen Physiol. 1989;93:101–122. doi: 10.1085/jgp.93.1.101. [DOI] [PMC free article] [PubMed] [Google Scholar]
- 38.Terman M, Terman J. A circadian pacemaker for visual sensitivity? Ann NY Acad Sci. 1985;453:147–161. doi: 10.1111/j.1749-6632.1985.tb11807.x. [DOI] [PubMed] [Google Scholar]
- 39.Uchiyama H, Buelow N, Barlow R. A circadian clock regulates rod–cone shift in the retina of the Japanese quail. Soc Neurosci Abstr. 1991;16:1333. [Google Scholar]
- 40.Underwood H, Siopes T, Barrett RK. Does a biological clock reside in the eye of quail? J Biol Rhythms. 1988;3:323–331. doi: 10.1177/074873048800300402. [DOI] [PubMed] [Google Scholar]
- 41.Underwood H, Barrett RK, Siopes T. The quail’s eye: a biological clock. J Biol Rhythms. 1990;5:257–265. doi: 10.1177/074873049000500307. [DOI] [PubMed] [Google Scholar]
- 42.Walls GL. The vertebrate eye and its adaptive radiation. Hafner; New York: 1963. [Google Scholar]
- 43.Wang Y, Mangel SC. A circadian clock regulates rod and cone input to fish retinal cone horizontal cells. Proc Natl Acad Sci USA. 1996;93:4655–4660. doi: 10.1073/pnas.93.10.4655. [DOI] [PMC free article] [PubMed] [Google Scholar]
- 44.Witkovsky P, Gabriel R, Krizaj D. Modulation of rod–cone coupling in the Xenopus retina. Invest Ophthalmol Vis Sci [Suppl] 1996;37:S675. [PMC free article] [PubMed] [Google Scholar]
- 45.Young R. The daily rhythm of shedding and degradation of rod and cone outer segment membranes in the chick retina. Invest Ophthalmol Vis Sci. 1978;17:105–116. [PubMed] [Google Scholar]