

Abstract
Abnormal protein processing and modification is associated with Alzheimer’s disease (AD) pathology. The role of phosphorylation in AD has been studied extensively because the presumed abnormal phosphorylation of tau protein is believed to play a role in the formation of paired helical filaments. Glycosylation with O-linkedN-acetylglucosamine (O-GlcNAc) to serine and threonine residues is a dynamic protein modification of intracellular proteins, and it shares similar features with protein phosphorylation. In this study, O-GlcNAc glycosylation of proteins from autopsied human brains with confirmed AD and non-AD age-matched controls was examined.O-GlcNAcylation was demonstrated by labeling protein extracts with [3H]galactose in the presence of galactosyltransferase and subsequent analyses of saccharide–protein linkage and saccharide structure. The number ofO-GlcNAc-containing proteins and the overallO-GlcNAc level do not appear to be different between AD and control brain tissues. The only significant change observed is a marked reduction of O-GlcNAcylated clathrin assembly protein-3 (AP-3) in AD. The reduction is more evident in brain neocortical regions, and there appears to be a negative correlation between O-glycosylated AP-3 and the density of neurofibrillary tangles. These data suggest a possible association between the O-glycosylated AP-3 and AD pathology.
Keywords: Alzheimer’s disease, neurofibrillary tangles, phosphorylation, O-linked glycosylation, N-acetylglucosamine, galatosyltransferase labeling, clathrin assembly protein AP-3
Alzheimer’s disease (AD) is a neurodegenerative disorder characterized by progressive dementia (Alzheimer, 1907). One of the distinctive pathologies in brains affected by AD is the presence of neurofibrillary tangles (NFTs) in selected populations of neurons (Tomlinson et al., 1970; Arriagada et al., 1992; Callahan and Coleman, 1995). NFTs are composed largely of hyperphosphorylated tau protein (Goedert 1993 and references within). Abnormal tau phosphorylation may cause NFT formation and cytoskeletal disruption and may ultimately lead to neuronal malfunction and death. Recent observations of glycation and glycosylation products in AD brains (Ledesma et al., 1994; Griffith and Schmitz, 1995; Smith et al., 1995; Wang et al., 1996) suggest that protein modifications other than phosphorylation may also contribute to AD pathology.
Glycosylation by N-acetylglucosamine monosaccarides, Olinked to the hydroxyls of serine or threonine residues (O-GlcNAc), is a unique type of protein modification (Torres and Hart, 1984; Hart et al., 1995; Haltiwanger et al., 1997). Unlike most other types of glycosylation, the majority ofO-GlcNAc-modified proteins are found within the nucleoplasm and cytoplasm of cells (Hart et al., 1995) O-GlcNAcylation has much in common with phosphorylation. Both are highly dynamic. The turnover rate of O-GlcNAc is faster than that of the proteins it modifies (Chou et al., 1992). Both are regulated by a pair of enzymes. Analogous to phosphorylation reactions catalyzed by kinases and phosphatases, O-GlcNAc transferase andOGlcNAcase are responsible for the addition and removal of O-GlcNAc, respectively (Haltiwanger et al., 1992; Dong and Hart, 1994). Virtually all O-GlcNAc proteins are also phosphoproteins (Hart et al., 1995; Haltiwanger et al., 1997), and at least for some of them, the degree of O-GlcNAcylation appears to be reciprocal to phosphorylation (Kelly et al., 1993). Thus,O-GlcNAc may play a role in regulating protein phosphorylation, or it may regulate proteins in a manner analogous to phosphorylation.
Changes in O-GlcNAc level have been observed in cells under various stimuli. Activation of T-lymphocytes by mitogens or by phorbol esters resulted in rapid changes in O-GlcNAc levels in many nuclear and cytosolic proteins (Kearse and Hart, 1991). When HT29 cells, a human colon cancer cell line, were treated with okadaic acid or microtubule-destabilizing agents, O-GlcNAc glycosylation of many proteins in crude cell extracts was altered (Chou and Omary, 1994). Furthermore, after colcemid-induced mitotic arrest, keratin proteins from HT29 cells showed a significant change in bothO-GlcNAc glycosylation and phosphorylation (Chou and Omary, 1993). These results suggest that the level of O-GlcNAc, like phosphorylation, could be a widespread event in cells that respond to stimuli.
As a beginning to elucidating the possible involvement ofO-GlcNAc in AD, in which abnormal phosphorylation occurs, we have been examining the O-GlcNAc level in brain tissues affected by AD. In this study, using galactosyltransferase as a probe, we compared the levels of O-GlcNAc in crude extracts of AD brains with neurologically normal age-matched controls. The overall GlcNAc level was not much different in AD brains when compared with controls except for a substantial decrease in the level of a 160 kDaO-GlcNAc-modified protein in AD. We have identified this 160 kDa O-GlcNAcylated protein as clathrin assembly protein-3 (AP-3) and obtained quantitative information on its reduction in several brain regions of AD.
MATERIALS AND METHODS
Reagents. Human milk galactosyltransferase was obtained from Boehringer Mannheim (Indianapolis, IN). The enzyme was autogalactosylated by the manufacturer and shown to contain negligible amounts of GlcNAc sites (see Fig. 1). PeptideN-glycosidase F (PNGase F) was also from Boehringer Mannheim. Uridine diphosphate [1-3H]galactose (8.1 Ci/mmol) and EN3HANCE were obtained from DuPont NEN (Boston MA). Ovalbumin, galactose, and disaccharide standards were from Sigma (St. Louis, MO). F1–20 antibody and CLAP3 antibodies were generously provided by Dr. Eileen M. Lafer (Center for Molecular Medicine, University of Texas Health Science Center) (Sousa et al., 1990) and Dr. James H. Keen (Department of Pharmacology, Thomas Jefferson University) (Murphy et al., 1991), respectively. Anti-AP-3 antibody (clone AP180-I) (Ahle and Ungewickell, 1986) and anti-AP-2 antibody (clone 100/2) (Ahle et al., 1988) were purchased from Sigma. Anti-clathrin heavy chain antibody (clone CHC 5.9) was purchased from ICN Biomedicals (Aurora, OH). All chemicals and reagents used were of the highest quality available.
Fig. 1.

Optimal conditions for the galactosyltransferase-mediated galactosylation of brain proteins. Labeling as a function of enzyme concentration (A), substrate concentration (B), and time (C). For each parameter, certain variables were held constant as needed: 100 μg of total proteins, 20 mU of enzyme, and 60 min. A andB were repeated three times, and C was repeated twice, and similar profiles were obtained.
Human brain tissues. Postmortem human brain tissues were provided by the Alzheimer’s Disease Center, University of Rochester. All cases were well characterized based on specific clinical and neuropathological criteria (Khachaturian, 1985). All cases were judged in a consensus conference of neurologists, psychiatrists, neuropsychologists, and neuropathologists on the basis of clinical history and neuropathological survey of the brain with adherence to the National Institutes of Health consensus age-adjusted criteria for definition of AD (Khachaturian, 1985). Information regarding clinical history, mental status, age, gender, the interval between death and autopsy, and pertinent pathology have all been documented in detail.
Postmortem tissues from three brain regions of both AD and age-matched controls were used for this study: (1) frontal cortex, including gray and white matter of neocortex at the level of the olfactory bulb; all deep structures were removed; 1-cm-thick slabs of frontal cortex from five controls and five AD cases were used for one part of the study (Table 1 provides information about each case); (2) middle frontal gyrus; and (3) anterior cerebellum. Middle frontal gyrus and anterior cerebellum from 11 individuals with AD and 10 age-matched controls were used for another part of the study. Table2 provides information related to each case.
Table 1.
Clinical and pathological information of cases of frontal cortex
| Age (years) | Gender (M/F) | Disease length1-a(years) | PMD1-b(hr) | NFT1-c (n) |
|---|---|---|---|---|
| Control | ||||
| 82 | F | NA | 13.50 | 0 |
| 76 | F | NA | 14.75 | 0 |
| 87 | F | NA | 14.25 | 0 |
| 64 | F | NA | 13.33 | 0 |
| 75 | M | NA | 9.33 | 0 |
| AD | ||||
| 90 | F | 14 | 10.00 | 17.82 |
| 75 | F | 21 | 13.10 | 32.67 |
| 62 | F | 7 | 6.10 | 22.14 |
| 90 | F | 23 | 7.20 | 16.47 |
| 84 | F | 5 | 13.20 | 11.64 |
Disease length, years from AD diagnosis to death. NA, Not applicable.
PMD, Postmortem delay.
NFT, Number of neurofibrillary tangles in middle frontal gyrus.
Table 2.
Clinical and pathological information of cases of middle frontal gyrus
| Age (years) | Gender (M/F) | Disease length2-a(years) | PMD2-b(hr) | NFT2-c (n) |
|---|---|---|---|---|
| Control | ||||
| 76 | F | NA | 14.75 | 0 |
| 84 | M | NA | 8.75 | 0 |
| 87 | F | NA | 14.25 | 0 |
| 83 | M | NA | 17.25 | 0 |
| 64 | F | NA | 13.33 | 0 |
| 99 | F | NA | 8.75 | 0 |
| 75 | M | NA | 9.33 | 0 |
| 79 | M | NA | 18.50 | 0 |
| 74 | M | NA | 4.00 | 0 |
| 80 | M | NA | 8.00 | 0 |
| AD | ||||
| 94 | F | 12 | 13.50 | 7.83 |
| 90 | F | 11 | 11.00 | 17.28 |
| 62 | F | 15 | 7.25 | 23.76 |
| 67 | F | 11 | 11.50 | 7.56 |
| 86 | F | 15 | 16.50 | 20.79 |
| 90 | F | 14 | 10.00 | 17.82 |
| 90 | F | 23 | 7.20 | 16.47 |
| 75 | F | 21 | 13.10 | 32.67 |
| 62 | F | 7 | 6.10 | 22.14 |
| 78 | F | 7 | 4.70 | 16.20 |
| 79 | F | 14 | 4.25 | 20.79 |
Disease length, years from AD diagnosis to death. NA, Not applicable.
PMD, Postmortem delay.
NFT, Number of neurofibrillary tangles in middle frontal gyrus.
NFT density was determined for each case by manual counting and averaging of the five most severely affected (for AD) or random (for non-AD controls) microscopic fields at 200× total magnification (1.29 mm2 viewing area).
Preparation of brain extracts. All tissues were collected directly at autopsy with postmortem delays indicated in Tables 1 and 2. The samples were immediately frozen on dry ice and then transferred to liquid nitrogen for storage. The tissues were maintained in their frozen state until processing for protein extraction.
Human brain extract was obtained by homogenizing frozen brain tissue with a homogenizer (Ultra-Turrax T25) in buffer (in mm: morpholinoethanesulfonic acid, 20; NaCl, 80; EGTA, 2; and MgCl2, 1, pH 6.75) containing a mixture of protease inhibitors (Lindwall and Cole, 1984; Murphy, 1991). The homogenate was centrifuged at 3000 × g for 20 min at 4°C, and the pellet was discarded. The total protein concentration in this extract was measured using a BCA protein assay (Pierce, Rockford, IL).
Galactosyltransferase labeling of human brain extracts and immunoprecipitation. Galactosyltransferase labeling was performed as described (Roquemore et al., 1994; Haltiwanger and Philipsberg, 1997). Protein aliquots (100 μg of total protein) were precipitated overnight with 8 volumes of acetone at −20°C. After centrifugation, protein pellets were heated (100°C) in 1% SDS for 5 min. The protein samples were then mixed with labeling buffer (in mm: MnCl2, 5; galactose, 10; and HEPES, 50, pH 7.4), followed by adding 10% Triton X-100, 4 μCi of UDP-[3H]galactose in 5′-AMP solution (the final concentration of 5′-AMP was 2.5 mm), and 20 mU of galactosytransferase. After 1 hr of incubation at 37°C, the reaction was stopped by adding 50 μl of stop solution (100 mm EDTA and 10% SDS). The [3H]galactose-labeled products were separated from unincorporated UDP-[3H]galactose by fractionation over a Sephadex G-50 column (1 × 30 cm) in 50 mm ammonium formate and 0.1% SDS. Proteins eluted from the void volume (v0) of the column were pooled and lyophilized. After resuspension in a small volume of water, the samples were acetone-precipitated. Precipitates were resuspended again in water and stored at −80°C for further analysis.
Immunoprecipitation was performed as described (Harlow and Lane, 1988). Briefly, monoclonal antibody AP180-I (IgG2, mouse ascites fluid) was used, because it recognizes AP-3 specifically (Ahle and Ungewickell, 1986). Monoclonal antibody 100/2 (anti-AP-2) was used as a control antibody, because it is also IgG2 from mouse ascites fluid (Ahle et al., 1988). A 0.5 ml aliquot of human brain extracts (total protein concentration was 1.2–1.5 mg/ml) was preabsorbed with protein A–agarose (50% v/v) and then mixed with 10 μl of AP180-I antibody with gentle agitation overnight at 4°C. After incubation for an additional 1 hr with protein A–agarose beads, immunoprecipitates were washed and labeled with galactosyltransferase for 1 hr at 37°C as described above. The labeled immunoprecipitates were washed again, boiled in sample buffer containing 2% SDS and 10% glycerol, and then analyzed by one- or two-dimensional SDS-PAGE and fluorography.
SDS-PAGE, fluorography, and immunoblot analysis. SDS-PAGE was performed according to the method of Laemmli (1970). For fluorography, gels were stained with Coomassie blue, treated with EN3HANCE, dried, and exposed to Eastman Kodak (Rochester, NY) x-ray film at −80°C for an appropriate length of time. Some gels were silver stained by the method of Blum et al. (1987).
For immunoblot analysis, 3H-labeled samples were separated on SDS-PAGE and transferred to polyvinylidene difluoride (PVDF) membranes. The membranes were blocked with 5% nonfat dry milk in PBS containing 1% Tween 20 at 4°C for 6 hr. The membranes were then incubated with AP180-I monoclonal antibody (mAb) (1:5000), F1–20 mAb (1:1000), CLAP3 mAb (1:1000), or anti-clathrin antibody (1:500) at 4°C overnight, followed with an appropriate secondary antibody conjugated with horseradish peroxidase. The antibody was then detected with an enhanced chemiluminescence (ECL) system using luminol and H2O2. Negative controls consisted of membranes incubated in the absence of primary antibodies.
Two-dimensional electrophoresis. Two-dimensional electrophoresis was performed according to the method of O’Farrell (1975) by Kendrick Labs, Inc. (Madison, WI). Isoelectric focusing was performed using 2% pH 4–8 ampholines for 9600 volumes/hr. Ten percent acrylamide gels were used for the second dimension for SDS-PAGE analysis. After slab gel electrophoresis, one gel was stained with Coomassie blue, and a duplicate gel was transblotted to a PVDF membrane. The Coomassie blue-stained gel was treated with EN3HANCE followed by fluorography. The PVDF membrane was immunoanalyzed using AP180-I mAb as described above.
Protein–saccharide linkage and saccharide structure analysis. For PNGase F digestion, [3H]galactosylated proteins were denatured in solution containing 1% SDS and 1% β-mercaptoethanol. After adding a solution containing 75 mm Tris-HCl, pH 8.6, 10 mm EDTA, 0.7% (w/v) NP-40, and protease inhibitor mixtures (in mg/ml: leupeptin, 1; antipain, 2; benzamidine, 10; aprotinin, 1; chemystatin, 1; and pepstatin, 1), PNGase F (5 μl, 200 mU/μl determined by the manufacturer) was added and incubated at 37°C for 16–24 hr. An additional 5 μl of PNGase F was added and incubated for 16–24 hr further. The same digestion condition was also used for [3H]galactose-labeled ovalbumin to serve as a control. The reaction was stopped by heating for 5 min. After fractionation over a Sephadex G-50 column (1 × 60 cm), products eluted at v0 were pooled, lyophilized, and analyzed by SDS-PAGE followed by fluorography. In some cases, the bands of interest were cut from gels (using the corresponding fluorographs as guides), and the amount of radioactivity on the gel slices was determined by scintillation counting.
For β-elimination experiments, the [3H]galactose-labeled protein samples were first resolved in SDS-PAGE and transferred to a PVDF membrane. The membrane was sprayed with EN3HANCE and exposed to a Kodak x-ray film. Using the film as a guide, the membrane areas corresponding to the bands of interest were cut out and subjected to β-elimination by incubating the membrane strips in 0.5 ml of β-elimination buffer (1 m NaBH4 in 0.1 m NaOH) at 37°C for 24 hr. After the β-elimination reaction, membrane strips were counted. β-elimination products in the reaction solution were neutralized with acetic acid and passed through a 3 ml Dowex 50 × 8 (hydrogen form) column. Lyophilized samples were then washed three times with methanol with 0.1% acetic acid, dried, suspended in H2O, and analyzed by ascending thin layer chromatography using cellulose plastic plates and ethyl acetate/pyridine/H2O (10:4:3) (Chou et al., 1992). The lanes of interest were cut into 0.5 cm strips and counted. Reduced disaccharide standards were prepared using the same protocol as the β-elimination reaction of the samples and visualized by silver nitrate staining (Travelyan et al., 1950).
Densitometry scanning and statistical analysis. The [3H]galactosylated protein band patterns shown on fluorographs were analyzed with laser densitometry using ImageQuant analysis software (Molecular Dynamics, Sunnyvale, CA). The number of bands, the intensity of all bands, and the intensity of individual bands were compared between AD and controls. Densitometric values gathered from two bands on the scanned fluorographs, the intensity of which was consistent among all AD and control samples, were used for normalization between fluorographs. Statistical significance was tested by two-tailed Student’s t test. A significant difference between two data sets was defined as p < 0.01.
RESULTS
Optimization of galactosyltransferase labeling conditions for proteins from crude lysates of human brains
GlcNAc β-(1–4) galactosyltransferase is a specific enzyme that adds galactose covalently to terminal N-acetylglucosamine residues of both N- and O-linked carbohydrate structures (Wallenfels, 1979; Beyer et al., 1981; Torres and Hart, 1984). By using UDP-[3H]galactose as a sugar donor, terminal GlcNAc residues of glycoproteins accessible to the enzyme can be labeled. The [3H]galactosylated products are stable and allow for further protein–saccharide linkage analysis.
In this study, we used galactosyltransferase as a probe to examineO-GlcNAc-modified proteins in the crude lysates from autopsied human brains of confirmed AD and neurologically normal age-matched controls. The optimal amount of galactosyltransferase required was determined by incubating proteins (100 μg of total proteins) with UDP-[3H]galactose and increasing concentrations of galactosyltransferase as described (Roquemore et al., 1994; Haltiwanger and Philipsberg, 1997). The [3H]galactosylated products were then fractionated over a Sephadex G-50 column. The quantity of protein-bound [3H]galactose, eluting in the v0 of the column, was determined at each transferase concentration (Fig.1A). The amount of label incorporated was undetectable when no enzyme was added, indicating a negligible amount of endogenous galactosyltransferase activity present in the sample. The human milk galactosyltransferase (Boehringer Mannheim) used in the study contained an insignificant amount of terminal GlcNAc sites. Because these brain proteins demonstrated saturated 3H label incorporation at a galactosyltransferase concentration of ≤20 mU (defined by the manufacturer), all the subsequent analyses were conducted at a galactosyltransferase concentration of 20 mU.
To compare the galactosyltransferase-accessible sites on proteins in the samples quantitatively, it was necessary that the protein concentration be within the linear range of the galactosyltransferase labeling. Various amounts of proteins (25–400 μg) were labeled with UDP-[3H]galactose and 20 mU of galactosyltransferase (Fig. 1B). Between 25 and 200 μg of protein, the amount of radiolabeling was proportional to the amount of protein in the samples. The labeling continued to rise when 400 μg of protein was used but at a slower rate. Because 100 μg of protein was within the linear range of the assay, the remaining studies were conducted using 100 μg of total proteins. Figure 1Cshows that maximal [3H]galactosylation occurred at 1 hr of incubation. Results shown in Figure 1 are obtained from control brain proteins. Similar profiles were seen in proteins from AD brains (data not shown).
Analysis of galactosyltransferase-labeled proteins from selected brain regions of AD
Frontal cortex
To evaluate O-GlcNAc-containing proteins in AD brains, extracts from frontal cortices of end-stage, confirmed AD, and age-matched controls were labeled with galactosyltransferase under the conditions in which all accessible terminal GlcNAc was labeled with [3H]galactose (see above). The labeled products were equally divided and resolved separately on the same SDS-PAGE gel to determine which proteins contain terminal GlcNAc residues for galactosylation. Half of the gel was silver-stained (Fig.2A), and the other half was subjected to fluorography (Fig. 2B). It is apparent that many major silver-stained protein bands were not radiolabeled by galactosyltransferase, indicating the specificity of the enzyme. The silver-stained gel also shows that total amount of protein and overall protein pattern were similar in control and AD extracts. Figure 2 represents the results from two of the five AD and two of the five control brains examined. All five yielded similar results.
Fig. 2.
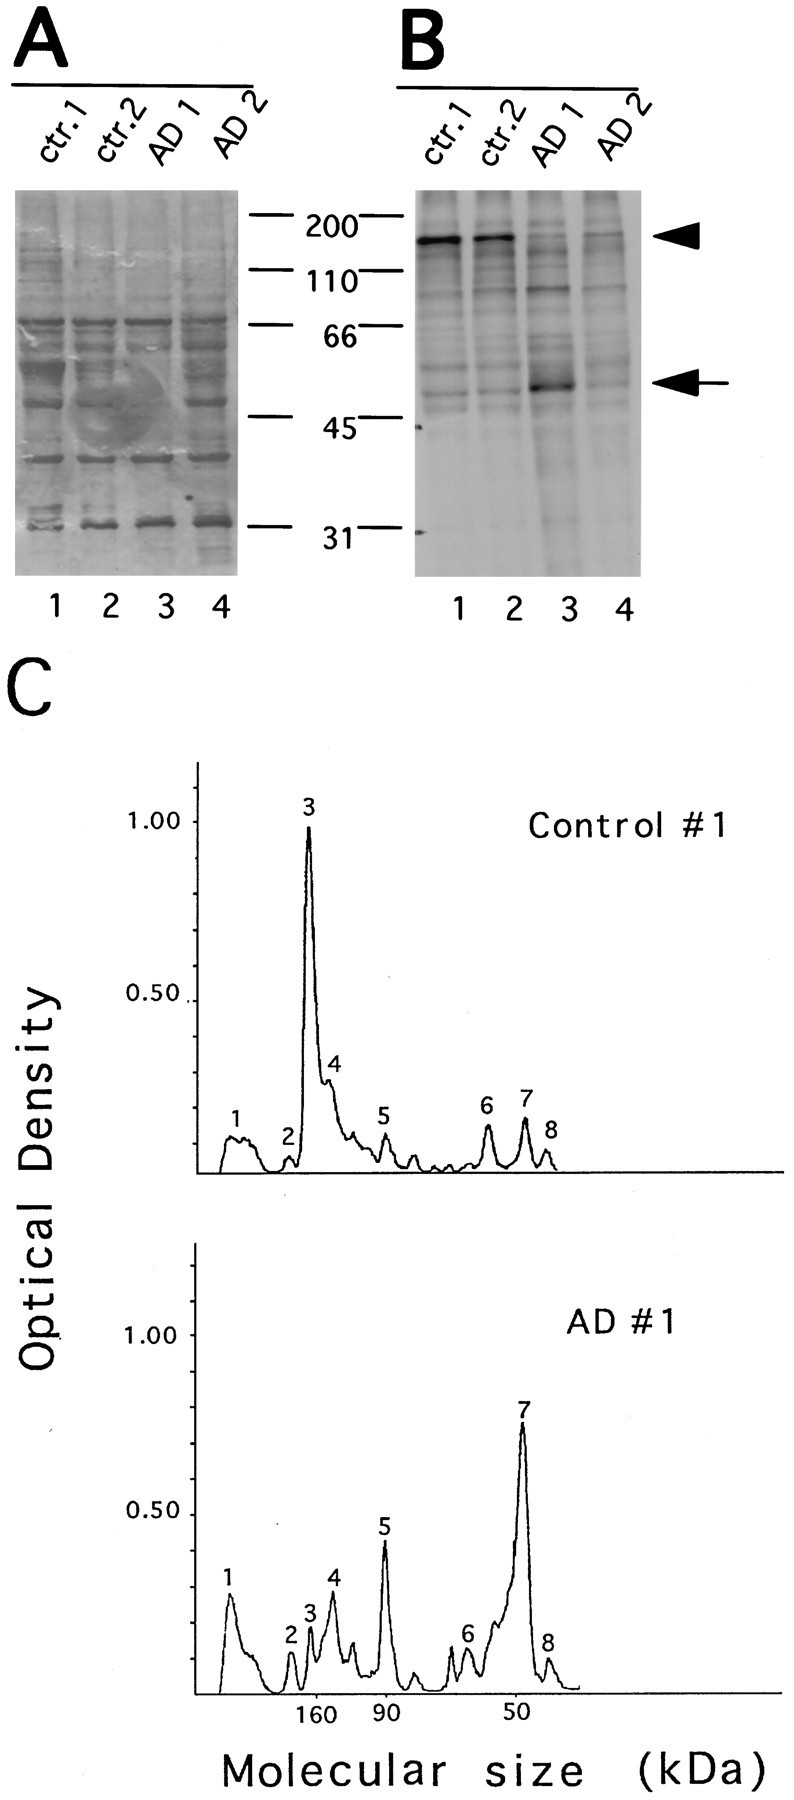
Comparison of galactosyltransferase labeling of AD and control brain proteins. Proteins from frontal cortex extract of AD and age-matched controls were labeled with galactosyltransferase. Radiolabeled samples were then equally divided and resolved separately on the same 10% SDS-PAGE. The half of the gel visualized by silver staining (A) shows both labeled and unlabeled proteins. The other half of the gel that was subject to fluorography (B) reveals labeled proteins. Positions of molecular weight standards (kilodaltons) are indicated in the middle. Densitometric scanning of lanes 1 and 3of B (the fluorograph) is shown in C. Peak 3, 160 kDa; peak 7, 50 kDa, as mentioned in the text.
In the control tissues, a protein with a molecular size of ∼160 kDa was labeled more intensely with [3H]galactose than any other labeled protein band (Fig. 2B, lanes 1,2, arrowhead). A striking difference between control and AD brain tissues was that the intensity of the radiolabeling for the same 160 kDa protein was decreased in AD tissues (Fig. 2B, lanes 3,4). This considerable reduction is more evident from densitometric scanning of the fluorograph and an example of the densitometric profiles is shown in Figure 2C. By comparing the number and the height of peaks corresponding to the major labeled protein bands on the fluorograph, we did not observe a difference in number of peaks between control and AD. However, the height of the 160 kDa peak is significantly lower in AD (Fig.2C, peak 3), confirming the visual inspection of the fluorograph. A similar reduction in the radiolabeled 160 kDa band was seen in all five AD frontal cortexes examined (data not shown).
A protein with an ∼50 kDa size was among other proteins labeled by [3H]galactose (Fig. 2B, indicated with arrow). In some of the AD cases studied, the intensity of this band was increased, and the band appeared smeared. However, this finding was not seen in every AD case and did not seem to be related to the age or postmortem delay of the cases used for the study (n = 5; Table 1). Moreover, this 50 kDa protein seems unlikely to be modified by O-linked GlcNAc (see description below for Fig. 5). Therefore, it was not investigated further in this study.
Fig. 5.

The 160 kDa protein is modified by O-linked singleN-acetylglucosamine residues. [3H]Galactose-labeled proteins were deglycosylated by PNGase F and resolved on 10% SDS-PAGE. A, Fluorographs demonstrate labeled proteins that are resistant to PNGase F digestion. The arrowhead indicates the 160 kDa protein, and the arrow indicates the 50 kDa protein.B, Coomassie blue-stained gels reveal the overall protein pattern. The migration positions of molecular weight standards (kilodaltons) are indicated. C, The 160 kDa band and ovalbumin band in each group were cut out and counted.D, [3H]Galactose-labeled sample proteins were separated by SDS-PAGE and transferred to a PVDF membrane. The membrane strip corresponding to the position of 160 kDa was cut out, subjected to alkaline-induced β-elimination, and counted. Ovalbumin was used as a control. E, G-50 Sephadex column profile of β-elimination products released from the PVDF membrane.F, Saccharides released by β-elimination were also analyzed by thin layer chromatography using a cellulose-coated plastic plate. The lanes of 160 kDa protein from AD and control were cut separately into 0.5-cm-wide strips and counted. Disaccharide standards were revealed by AgNO3 staining, and their migration positions are indicated by arrows. Closed circles, Control; open circles, AD. All above analyses were performed at least twice on proteins from all three brain regions examined from both AD and controls. These data demonstrate that the 160 kDa protein is modified by O-linked single GlcNAc residues.
Middle frontal gyrus
The above-observed reduction of glycosylated 160 kDa protein in AD was apparent in the frontal cortex, a grossly defined brain region. To confirm this observation, O-GlcNAc-modified proteins from a more limited brain area, the middle frontal gyrus, were studied. The middle frontal gyrus is among the brain regions significantly affected by AD (Arriagada et al., 1992; Braak and Braak, 1995). As shown in Figure 3, A and B, the overall pattern of [3H]galactosylated proteins was similar in normal control middle frontal gyrus to those found in the frontal cortex (Fig. 2). Among them, the 160 kDa protein band was labeled intensely with [3H]galactose. Whereas most galactosylated proteins were no different in the AD middle frontal gyrus, the intensity of the radiolabeled 160 kDa protein was considerably and significantly lower than that of controls (Fig.3, A, arrowheads, B, peak3). Based on a statistical sample size analysis, middle frontal gyrus from 11 cases of confirmed AD and 10 cases of age-matched controls were further examined (see Table 2 for information related to the cases). All 11 cases of AD demonstrated various degrees of decrease in the radiolabeling of the 160 kDa protein when compared with the controls. After normalization to two unchanging bands on the same lanes of the scanned fluorographs, the 2.5-fold reduction was found to be statistically significant (p < 0.01,t test; Fig. 3C). A similar analysis was conducted on six major galactosylated protein bands other than the 160 kDa protein. None of the six proteins showed any statistically significant change in AD tissues (Fig. 3D), suggesting that the 160 kDa protein is a major altered glycoprotein in AD brains.
Fig. 3.

A marked and significant reduction of glycosylated 160 kDa protein occurs in AD middle frontal gyrus. Proteins from middle frontal gyrus of AD and age-matched controls were analyzed with galactosyltransferase labeling. The labeled products were revealed with SDS–PAGE followed by fluorography. A, Fluorographs of labeled proteins from two representative AD and control cases.Arrowheads indicate the 160 kDa protein.B, Densitometric scanning profiles of control case 1 and AD case 1 shown in A. Peak 3 represents the 160 kDa protein band. C, Densitometric values gathered from two bands on the scanned autofluorographs, the intensity of which was relatively consistent among all AD and control samples (peaks 4, 8), were used for normalization between fluorographs. Densitometric values (optical density) for the 160 kDa 3H-galactosylated protein from all 11 cases of AD and 10 cases of non-AD controls were analyzed by Student’st test. Data are expressed as mean ± SEM.D, Densitometric values of six major3H-galactosylated protein bands other than the 160 kDa protein from the same cases were also analyzed by Student’st test. None of the AD versus control comparisons were statistically significant. E, Relation betweenO-glycosylated 160 kDa protein and NFT density of the same tissues.
Regression analyses revealed that there is an association between reduced O-3H-labeled 160 kDa protein and the density of NFTs present in the middle frontal gyrus (Fig.3E; r = −0.75; p < 0.01). In the cases with higher NFT density, there is a greater decline inO-3H-labeled 160 kDa protein. Correlation analysis does not show any relation between reducedO-3H-labeled 160 kDa protein and the postmortem delay of the tissues used (data not shown).
Anterior cerebellum
The cerebellar cortex is one of the brain regions in AD that is generally spared of certain characteristic AD pathologies. It has selected aspects of the AD pathology such as diffuse plaques and gliosis but does not contain NFTs (Braak et al., 1989). We examined theO-GlcNAcylated 160 kDa protein in the anterior cerebella from the same 11 AD and 10 control cases. Figure4A illustrates the fluorograph results from two of these cases, and Figure4B shows a typical densitometric scanning profile of the fluorographs. Unlike the frontal cortex (Fig. 2) and the middle frontal gyrus (Fig. 3), the 160 kDa protein was not the major galactosylated protein even in non-AD normal cerebellum (Fig. 4,A, arrowhead, B, peak 3). Furthermore, in AD cerebellum, neither overall GlcNAc level nor glycosylated 160 kDa protein are significantly affected (Fig.4C).
Fig. 4.

Anterior cerebella of AD do not show a significant reduction in the glycosylated 160 kDa protein. Proteins from the anterior cerebella of 11 AD cases and 9 age-matched control cases were analyzed with galactosyltransferase labeling. A, Representative fluorographs of two AD and two controls, witharrowheads indicating the 160 kDa protein band.B, Densitometric scanning profiles of fluorograph from both one representative AD and one control case. Peak 3represents the 160 kDa protein band. C, After normalizing to two unchanging bands on the scanned fluorographs, densitometric values (optical density) for the 160 kDa3H-galactosylated protein from all 11 cases of AD and 9 cases of non-AD controls were analyzed by Student’s ttest. Data are expressed as mean ± SEM.
Characterization of the saccharides that modify the 160 kDa protein
The above results suggested that among a number of GlcNAc-containing proteins from brain extracts, the level of the 160 kDa glycoprotein was reduced considerably and was inversely correlated to the number of NFTs. We therefore chose to focus on the 160 kDa protein and further characterized its glycosylation.
Galactosylated brain proteins were first digested with PNGase F that cleaves N-linked structures at an asparagine–GlcNAc bond (Plummer and Tarentino, 1981). Figure 5Ashows that heavily labeled 160 kDa glycoprotein was unaffected by PNGase F treatment in either AD or control samples (arrowhead), suggesting it is not N-linked glycosylation. In contrast, several other labeled glycoproteins in the samples, including the 50 kDa glycoprotein (arrow), contained N-linked radiolabeled saccharides, because they were no longer visible after PNGase treatment. Longer fluorographic exposures of the gel substantiated this observation (data not shown). Ovalbumin, containing N-linked terminal GlcNAc moieties, was used as a positive control for the PNGase F digestion. Figure 5B shows the lack of proteases in the PNGase F digestion, because the amount of protein shown on Coomassie blue-stained gels was not reduced with PNGase F treatment. Counts of gel slices corresponding to ovalbumin and to the 160 kDa protein revealed that 94% of the [3H]galactose-labeled ovalbumin was released by PNGase F, whereas only 4% of labeling was released from the 160 kDa glycoprotein (Fig. 5C).
To confirm that the sugar moieties that modify the 160 kDa protein were in the form of O-linked GlcNAc, the samples were subjected to alkaline-induced β-elimination, a common method used to releaseO-linked saccharides from protein backbones (Zinn et al., 1977). The 3H-labeled 160 kDa protein resolved by SDS-PAGE was transferred to a PVDF membrane, and the corresponding membrane strip was cut out and subjected to β-elimination as described in Materials and Methods. The radioactivity from the 160 kDa PVDF membrane strip had essentially disappeared at the end of β-elimination compared with non-β-eliminated sample, whereas 3H labeling of ovalbumin remained unchanged (Fig. 5D). The β-elimination products released from the PVDF membrane strips were further analyzed on a Sephadex G-50 gel filtration column, revealing the 160 kDa protein as a single included volume peak (Fig.5E). The released products by β-elimination also comigrated with a disaccharide standard, Galβ1,4GlcNAcitol in thin-layer chromatography (Fig. 5F, standard b). These analyses demonstrated that the 160 kDa protein is modified byO-linked single GlcNAc residues. Analyses of saccharide–protein linkage and saccharide structure of all three brain regions (frontal cortex, middle frontal cortex, and cerebella cortex) of both control and AD demonstrated the same results.
Identification of the 160 kDa O-GlcNAcylated protein
The unidentified 160 kDa O-GlcNAcylated protein demonstrated several characteristics: it was enriched in the soluble fraction of the brain extracts; it migrated at ∼160 kDa on SDS–PAGE; it was weakly stained with Coomassie blue; and it was extensively modified by O-GlcNAc. These features appear to be shared by a known neuronal O-GlcNAcylated protein, the clathrin assembly protein AP-3 (Murphy et al., 1991). When [3H]galactose-labeled proteins from brain extracts were analyzed with immunoblotting using an AP-3-specific antibody, AP180-I mAb (Ahle and Ungewickell, 1986), a major immunoreactive protein band was revealed at 160 kDa (Fig.6A, left panel). Fluorographing of the same blot (Fig.6A, right panel) showed that the 160 kDa 3H-labeled protein band was superimposed with the major AP180-I mAb-immunoreactive protein band (Fig.6A, arrowheads). AD tissues demonstrated a similar result, although the immunoreactive signal to the antibody was much weaker.
Fig. 6.

The [3H]galactose-labeled 160 kDa protein is immunoreactive to AP-3 specific antibodies.A, 3H-labeled proteins were analyzed by Western blotting using an AP-3-specific monoclonal antibody, AP180-I, and detected by ECL (shown on the left). A strong immunoreactive band was revealed at 160 kDa (arrowhead). After disappearance of the ECL signals, the same blot was sprayed with EN3HANCE, dried, and subjected to fluorography (shown on the right). The major AP180-I mAb-immunoreactive band is superimposed with the 3H-labeled 160 kDa protein band (arrowheads). B, Aliquots of the same 3H-labeled sample were also analyzed with Western blotting using two other AP-3-specific antibodies, CLAP3 mAb and F1–20 mAb. Both antibodies revealed a 160 kDa protein as a major band. In contrast, an AP-2-specific monoclonal antibody (100/2 mAb) and a clathrin heavy-chain-specific monoclonal antibody (CHC 5.9) did not react with the 3H-labeled 160 kDa protein.C, With secondary antibodies alone, no immunoreactive band was detected. Lane 1, Anti-mouse IgG; lane 2, anti-mouse IgM. F1–20 mAb is mouse IgM; all other antibodies used are mouse IgG. For B andC, results from only control tissues are shown.
Two other AP-3-specific monoclonal antibodies, CLAP3 and F1–20, were also used in immunoblotting of 3H-labeled proteins. Both CLAP3 mAb (Murphy et al., 1991) and F1–20 mAb (Sousa et al., 1990;Zhou et al., 1993) have been shown to react with AP-3 specifically, and both, in this study, revealed a prominent band at 160 kDa (Fig.6B, lanes 1,2,arrowhead). Several minor bands that migrated faster than the 160 kDa band are seen to a variable extent with different antibodies and likely represent degradation products of AP-3. AP-3 is known to be very susceptible to proteolysis (Ahle and Ungewickell, 1986; Zhou et al., 1993).
The same 3H-labeled samples were also immunoblotted with an antibody that specifically recognizes a subunit of another clathrin assembly protein, AP-2 (Ahle et al., 1988). As seen in Figure6B (lane 3), the AP-2-specific antibody (100/2 mAb) failed to react with the 160 kDa glycoprotein. Although it is often difficult to distinguish between AP-3 and clathrin heavy chain protein on SDS-PAGE (Ahle and Ungewickell, 1986; Murphy et al., 1991; Zhou et al., 1993), the 160 kDa glycoprotein is unlikely clathrin heavy chain, because a heavy chain-specific monoclonal antibody (CHC 5.9) did not reveal an immunoreactive protein band that can be superimposed with the 3H-labeled 160 kDa protein (Fig. 6B, lane 4). Finally, no band was detectable when primary antibodies were omitted in immunoblotting (Fig. 6C). Together, these results suggested that the 160 kDa glycoprotein may be the clathrin assembly protein AP-3.
To confirm that the 160 kDa 3H-labeled glycoprotein corresponds to AP-3, brain extracts were immunoprecipitated using AP180-I mAb, and the immunoprecipitates were subsequently labeled with galactosyltransferase and [3H]galactose. As shown in Figure 7A, Coomassie blue staining of the immunoprecipitates detected a barely visible band at 160 kDa, but the protein band was extensively labeled with [3H]galactose. Immunoprecipitation was specific, because no band at the position of 160 kDa was detectable when an isotype-matched control antibody (100/2 mAb) was used (Fig.7B).
Fig. 7.

Immunoprecipitated 160 kDa protein is labeled by [3H]galactose and galactosyltransferase.A, Immunoprecipitation of brain extracts was performed using monoclonal anti-AP-3 antibody AP180-I, and the resulting immunoprecipitates were subsequently labeled with [3H]galactose as detailed in Materials and Methods. Coomassie blue staining of the immunoprecipitates revealed a barely visible band at 160 kDa (arrowhead). Fluorograph (two-day exposure) of the same Coomassie blue-stained gel is on the right, showing that the immunoprecipitated 160 kDa protein using the AP180-I mAb was heavily labeled with [3H]galactose. B, Immunoprecipitation was prepared using AP180-I mAb or 100/2 mAb (anti-AP-2). The resulting supernatants (S) and pellets (P) were analyzed by immunoblotting using AP180-I mAb. The 100/2 mAb was used as a control antibody because, like AP180-I mAb, it is IgG2 from mouse ascites fluid. Whereas the majority of AP-3 was present in the pellets when AP180-I mAb was used for immunoprecipitation (lanes 1, 2), no AP-3 was detected in the pellets with the use of 100/2 mAb (lanes 3, 4).
To further confirm that the 160 kDa glycoprotein is AP-3, two-dimensional electrophoresis was performed with isoelectric focusing in the first dimension and SDS-PAGE in the second dimension. As anticipated, the Coomassie blue-stained gel was not able to reveal any specific immunoprecipitates (data not shown). However, the corresponding fluorograph shows a doublet-spot at 160 kDa, and pI 5.2–5.4, consistent for the known pI for AP-3 (Ahle and Ungewickell, 1986) (Fig. 8A). Western blot analysis of a duplicate gel showed that the doublet spot was specifically immunoreactive to the AP180-I mAb (Fig.8B), supporting the evidence that the protein is AP-3. It is not known why there is a doublet showing in the fluorograph and in the blot instead of a single spot. Human AP-3 proteins may be present as two different isoforms, which has yet to be determined, or perhaps not all AP-3 molecules contain the same amount of sugar residues. The extra spot detected by Western blotting (Fig.8B, arrow) could be a protease fragment of AP-3.
Fig. 8.

Two-dimensional gel analysis of AP-3 labeled with [3H]galactose. Immunoprecipitates of AP-3 were labeled with [3H]galactose as described in Materials and Methods. The samples were then equally divided and resolved separately on duplicated 2-dimensional gels. One gel was subjected to fluorography (A), showing labeled AP-3 (10 d exposure). The other gel was analyzed with immunoblotting using the AP180-I mAb (B). The acid edge is to the left. The asterisk indicates the position of the internal standard, tropomyosin (pI, 5.2; molecular weight, 32.7 kDa). Positions of protein markers (in kilodaltons) are indicated between the panels. The AP180-I mAb-immunoreactive spot that was not3H-galacosylated is indicated with anarrow.
Finally, protein extracts from middle frontal gyri of all 11 AD and 10 control cases were immunoprecipitated and labeled with [3H]galactose. Figure9A is the Coomassie blue-stained gel showing immunoprecipitates from two representative AD and control brains. Whereas IgG heavy chain was the major protein brand stained with Coomassie blue, the AP-3 immunoprecipitates were not visible in most cases. In contrast, the fluorograph of the same gel demonstrated heavily glycosylated AP-3 immunoprecipitates (Fig.9B). The intensity of 3H-labeled protein bands was markedly reduced in AD. The amount of AP180-I mAb was not a limiting factor, because there was no AP-3 immunoreactivity present in the supernatant after immunoprecipitation (data not shown). Taken together, these results suggest that the O-GlcNAcylated 160 kDa protein is AP-3 and O-GlcNAcylated AP-3 is reduced significantly in selected brain regions affected by AD.
Fig. 9.

Glycosylated AP-3 is reduced significantly in AD brains. Extracts from middle frontal gyri of AD and age-matched controls were immunoprecipitated using AP180-I mAb and subsequently labeled with [3H]galactose. A, Coomassie blue-stained gel; B, corresponding fluorograph. Lanes 1 and 2 are two representative controls, and lanes 4 and5 are two AD cases. The migration positions of IgG heavy chain and AP-3 are indicated. Positions of protein markers (lane 3 in both panels) are indicated between the panels.
DISCUSSION
In this study, we detected and comparedO-GlcNAc-modified proteins in brain extracts from confirmed AD and non-AD age-matched controls and made several observations. First, in normal-aged human brains, a number of proteins possess terminal O-linked GlcNAc residues. Among them, a protein with molecular mass of ∼160 kDa on SDS-PAGE gels is glycosylated prominently. This distinct and reproducible glycosylation pattern is more evident in proteins from neocortical regions (frontal cortex and middle frontal gyrus) than in cerebellum. Second, in AD brains, although other GlcNAc-modified proteins show no dramatic changes when compared with controls, there is a substantial decrease in the levels of the 160 kDa glycoprotein. The reduction appears to correlate with the number of NFTs. Third, based on the results of immunoblotting, immunoprecipitation, and two-dimensional electrophoresis analysis, the 160 kDa glycoprotein is identified as AP-3, one of the clathrin assembly proteins known to contain O-GlcNAc (Murphy et al., 1994).
Galactosyltransferase has been commonly used as a specific probe to detect GlcNAc on purified proteins (Dong et al., 1993; Arnold et al., 1996), on immunoprecipitates (Chou and Omary, 1993; Haltiwanger and Philipsberg, 1997), or on protein mixtures from cell subfractions (Kearse and Hart, 1991; Haltiwanger and Philipsberg, 1997). We used this galactosyltransferase-labeling method to examineO-GlcNAc-modified proteins in human postmortem brains. In addition, we also attempted to detect O-GlcNAc-bearing proteins in brain extracts using anti-O-GlcNAc antibodies (Turner et al., 1990), as well as lectin succinyl wheat germ agglutinin (WGA) (Monsigny et al., 1980). We found that neither the anti-O-GlcNAc antibodies nor the lectin WGA were suitable for studying O-GlcNAc glycosylation in tissue extracts. Both reagents gave unacceptable high background and/or were not adequately specific (data not shown). In contrast, the galactosyltransferase labeling method allowed us to obtain information on GlcNAc levels and the overall profile of GlcNAc-containing proteins in the crude brain extracts. Further analyses of the galactosyltransferase labeled products with PNGase F digestion and alkali-induced β-elimination enabled us to demonstrate that the 160 kDa protein is glycosylated by monosaccharide GlcNAcs through O-glycosidic linkages (Fig.5). Although this galactosylation technique is a better method for detecting O-GlcNAc (Roquemore et al., 1994; Haltiwanger et al., 1997), it detects only accessible terminal GlcNAcs and therefore may underestimate total GlcNAcs.
This study does not provide evidence of a direct link betweenO-GlcNAc glycosylation and the abnormal hyperphosphorylation that is often observed in AD brains. With the exception of the 160 kDa protein, the AD brains we examined were essentially no different from the controls in the gross level of terminal GlcNAc. Hyperphosphorylated tau is well documented as being a major component of NFTs in AD brains (e.g., Goedert 1993). That tau can be modified by O-GlcNAc has been demonstrated, albeit only on purified bovine tau (Arnold et al., 1996). If there were a direct competition between phosphorylation and O-GlcNAcylation on tau proteins, as has been shown on some proteins (Kelly et al., 1993; Hart et al., 1995), then it might be anticipated that O-GlcNAc level on abnormal hyperphosphorylated tau would be different from tau with normal levels of phosphate (Hart et al., 1995; Arnold et al., 1996; Haltiwanger et al., 1997). However, we did not observe differences in GlcNAc levels on proteins with molecular mass between 40 and 60 kDa (Figs. 2,3), the range in which various tau isoforms migrate on SDS-PAGE gels (Greenberg and Davies, 1990; Bramblett et al., 1993). Although the brain extracts used in the study did contain both total tau and hyperphosphorylated tau proteins (P. J. Yao and P. D. Coleman, unpublished data), we do not exclude the possibility that the approach used in this study may not reveal changes in individualO-GlcNAc glycoproteins unless the protein is either very abundant in the brain extracts or is heavily glycosylated.
The clearly evident and consistent change found is the significant reduction of O-GlcNAcylated 160 kDa protein in end-stage AD neocortices. The limited number of AD cases we examined suggests a negative correlation between the glycosylated 160 kDa protein and the density of NFTs. This 160 kDa glycoprotein strikingly resembles clathrin assembly protein AP-3 in biochemical characteristics (Ahle and Ungewickell, 1986; Kohtz and Puszkin, 1988; Lindner and Ungewickell, 1992; Zhou et al., 1993; Murphy et al., 1994): it is from the soluble fraction of brain extracts and is abundant in brain; it migrates with an ∼160 kDa molecular mass on SDS-PAGE gels; it is poorly stained by Coomassie blue; and it is glycosylated extensively with O-GlcNAc. The identity of the 160 kDa glycoprotein as AP-3 is further supported by several lines of evidence. First, the [3H]galactose-labeled 160 kDa protein from brain extracts was immunoreactive to three different AP-3 specific antibodies but not to antibodies against other clathrin-coated vesicle proteins such as AP-2 and clathrin heavy-chain protein (Fig. 6). Second, using one of the AP-3-specific antibodies (AP180-I mAb), an immunoprecipitation product with a molecular mass of 160 kDa was the only protein band labeled with [3H]galactose (Fig.7). Furthermore, two-dimensional SDS-PAGE demonstrated that the pI for the immunoprecipitated protein was ∼5.2, in agreement with the value known for AP-3 (Ahle and Ungewickell, 1986) (Fig. 8). Finally, quantitative immunoprecipitation revealed thatO-GlcNAcylated AP-3 in AD brains was markedly reduced (Fig.9).
AP-3, a synapse-specific protein, was independently discovered by several laboratories but given different names, including pp155 (Keen and Black, 1986), AP180 (Ahle and Ungewickell, 1986), NP185 (Kohtz and Puszkin, 1988), and F1–20 (Zhou et al., 1993). It is known now that all these proteins are the same and therefore have been renamed AP-3. AP-3 is very effective in promoting the assembly of clathrin into clathrin-coated vesicles (Lindner and Ungewickell, 1992) and probably plays an important role in synaptic vesicle recycling (Maycox et al., 1992; Lafer et al., 1997). Measurement of the saccharide content indicated that 1 mol of AP-3 contained ∼1 mol of GlcNAc (Murphy et al., 1994), which is ∼10 times more than the amount of GlcNAc on neurofilaments (Dong et al., 1993). This is consistent with our observation that AP-3 is labeled with more [3H]galactose than any other protein in the brain extracts tested. As with other O-GlcNAc-modified proteins, the specific function of this modification on AP-3 remains unknown. In clathrin assembly assay, the interaction of AP-3 with clathrin was not affected by in vitro galactosylation of AP-3 (Murphy et al., 1994). Moreover, bacterially expressed AP-3 that lacksO-GlcNAcylation appears to be fully capable of clathrin binding and assembly (Ye and Lafer, 1995). These results suggest that GlcNAc residues may modulate AP-3 protein in other ways than its association with clathrin.
Because of its poor affinity for Coomassie blue, it is not apparent whether the observed diminution in O-GlcNAcylated AP-3 is attributable to a decrease in the level of sugar, in the level of protein itself, or both. Nonetheless, our studies with Western blotting using AP-3-specific antibodies (Fig. 6A) and additional unpublished results clearly show the level of the AP-3 protein was reduced in AD brains. It seems unlikely that the 2.5-fold reduction in glycosylated AP-3 in AD neocortex is attributable solely to loss of neocortical neurons. In the same brain extracts used for our study, we see little, if any, parallel changes in the levels of tau proteins and of neurofilament medium and high molecular mass (Yao and Coleman, unpublished observations), indicating relatively unchanged levels of these neuronal markers. Morphological data consistent with this conclusion come from a recent study using unbiased stereological methods demonstrating a statistically nonsignificant 6% loss of neocortical neurons in AD (Regeur et al., 1994). Although other recent studies have shown major neuronal loss in selected regions of AD brain (for review, see Morrison and Hof, 1997), we did not sample from any of these selectively vulnerable regions.
Because AP-3 is a synaptic protein associated with clathrin-coated vesicles (Lindner and Ungewickell, 1992; Zhou et al., 1993; Lafer et al., 1997), the decline of this glycoprotein may be part of the synapse loss that occurs in AD. In fact, electron microscopic (Scheff et al., 1990; Scheff and Price, 1993) and immuno-histochemical (Masliah et al., 1989) determinations of neocortical synapse density in AD showed a decrease of ≤50%, which is less than the loss in AP-3 found by us. This suggests that there may be a loss of clathrin-coated vesicles in AD in addition to the loss of synapses. Thus, the loss of glycosylated AP-3 may be an earlier event in the pathological cascade of synapse loss in AD.
The apparent decline of glycosylated AP-3 protein in AD may be related to the modification by O-GlcNAc. The level ofO-GlcNAc may change the susceptibility of a protein to proteases and thus modulate its stability. Han and Kudlow (1997) showed a direct correlation between reduced O-GlcNAc level on transcription factor Sp1 and increased proteolytic degradation. This possibility is particularly intriguing because AP-3 is known for its high susceptibility to proteolytic degradation (Kohtz and Puszkin, 1988; Murphy et al., 1991; Lindner and Ungewickell, 1992; Zhou et al., 1993). If indeed the glycosylation state modifies the vulnerability of AP-3 to proteolysis, then hypoglycosylation may be responsible for the degradation and loss of AP-3 in AD. Insufficient AP-3 at the nerve terminals may therefore result in abnormal clathrin-coated vesicle assembly and consequently affect synaptic vesicle recycling. We are currently investigating this potential function for O-GlcNAc residues on AP-3, and we hope to gain a better understanding of the role of O-GlcNAc modification and the mechanisms of synaptic vesicle recycling in AD pathology.
Footnotes
This work was supported by LEAD Award Grant AG-09016, Grant R01 AG-01121, Alzheimer’s Disease Center Grant AG-08665, a Neurobiology of Aging Training Grant AG-00107 to P.D.C., and a pilot grant from the Markey Foundation to P.J.Y. We are very grateful to Dr. Robert S. Haltiwanger for encouragement and invaluable help in initiating this research project. We are also very grateful to Dr. Lawrence A. Tabak for many useful discussions throughout the course of this work.
Correspondence should be addressed to Dr. Pamela J. Yao, Department of Neurobiology and Anatomy, University of Rochester Medical Center, Box 603, 601 Elmwood Avenue, Rochester, NY 14642.
REFERENCES
- 1.Ahle S, Ungewickell E. Purification and properties of a new clathrin assembly protein. EMBO J. 1986;5:3143–3149. doi: 10.1002/j.1460-2075.1986.tb04621.x. [DOI] [PMC free article] [PubMed] [Google Scholar]
- 2.Ahle S, Eichelsbacher U, Ungewickell E. Structural relationships between clathrin assembly proteins from the Golgi and the plasma membrane. EMBO J. 1988;7:919–929. doi: 10.1002/j.1460-2075.1988.tb02897.x. [DOI] [PMC free article] [PubMed] [Google Scholar]
- 3.Alzheimer A. Uber eine eigenartige Erkrangkung der Himrinde. All Z Psychiatr. 1907;64:146–148. [Google Scholar]
- 4.Arnold CS, Johnson GVW, Cole RN, Dong DLY, Lee M, Hart GW. The microtubule-associated protein tau is extensively modified with O-linked N-acetylglucosamine. J Biol Chem. 1996;271:28741–28744. doi: 10.1074/jbc.271.46.28741. [DOI] [PubMed] [Google Scholar]
- 5.Arriagada PV, Growdon JH, Hedley-Whyte T, Hyman BT. Neurofibrillary tangles but not senile plaques parallel duration and severity of Alzheimer’s disease. Neurology. 1992;42:631–639. doi: 10.1212/wnl.42.3.631. [DOI] [PubMed] [Google Scholar]
- 6.Beyer TA, Sadler JE, Rearick JI, Paulson JC, Hill RL. Glycosyltransferase and their use in assessing oligosaccaride structure and structure-function relationship. Adv Enzymol Relat Areas Mol Biol. 1981;52:23–175. doi: 10.1002/9780470122976.ch2. [DOI] [PubMed] [Google Scholar]
- 7.Blum H, Beier H, Gross HJ. Improved silver staining of plant proteins, RNA, and DNA in polyacrylamide gels. Electrophoresis. 1987;8:93–99. [Google Scholar]
- 8.Braak H, Braak E. Staging of Alzheimer’s disease-related neurofibrillary changes. Neurobiol Aging. 1995;16:271–284. doi: 10.1016/0197-4580(95)00021-6. [DOI] [PubMed] [Google Scholar]
- 9.Braak H, Braak E, Bohl J, Lang W. Alzheimer’s disease: amyloid plaques in the cerebellum. J Neurol Sci. 1989;93:277–287. doi: 10.1016/0022-510x(89)90197-4. [DOI] [PubMed] [Google Scholar]
- 10.Bramblett GT, Goedert M, Jakes R, Merrick SE, Trojanowski JQ, Lee VMY. Abnormal tau phosphorylation at Ser396 in Alzheimer’s disease recapitulates development and contributes to reduced microtubule binding. Neuron. 1993;10:1089–1099. doi: 10.1016/0896-6273(93)90057-x. [DOI] [PubMed] [Google Scholar]
- 11.Callahan LM, Coleman PD. Neurons bearing neurofibrillary tangles are responsible for selected synaptic deficits in Alzheimer’s disease. Neurobiol Aging. 1995;16:311–314. doi: 10.1016/0197-4580(95)00035-d. [DOI] [PubMed] [Google Scholar]
- 12.Chou CF, Omary MB. Mitotic arrest-associated enhancement of O-linked glycosylation and phosphorylation of human keratin 8 and 18. J Biol Chem. 1993;268:4465–4472. [PubMed] [Google Scholar]
- 13.Chou CF, Omary MB. Mitotic arrest with anti-microtubule agents or okadaic acid is associated with increased glycoprotein terminal GlcNAc’s. J Cell Sci. 1994;107:1833–1843. doi: 10.1242/jcs.107.7.1833. [DOI] [PubMed] [Google Scholar]
- 14.Chou CF, Smith AJ, Omary MB. Characterization and dynamics of O-linked glycosylation of human cytokeratin 8 and 18. J Biol Chem. 1992;267:3901–3906. [PubMed] [Google Scholar]
- 15.Dong DLY, Hart GW. Purification and characterization of an O-GlcNAc selective N-Acetyl-β-d-glucosaminidase from rat spleen cytosol. J Biol Chem. 1994;269:19321–19330. [PubMed] [Google Scholar]
- 16.Dong DLY, Xu ZS, Chevrier MR, Cotter RJ, Cleveland DW, Hart GW. Glycosylation of mammalian neurofilaments. J Biol Chem. 1993;268:16679–16687. [PubMed] [Google Scholar]
- 17.Goedert M. Tau protein and the neurofibrillary pathology of Alzheimer’s disease. Trends Neurosci. 1993;16:460–465. doi: 10.1016/0166-2236(93)90078-z. [DOI] [PubMed] [Google Scholar]
- 18.Greenberg SG, Davies P. A preparation of Alzheimer paired helical filaments that displays distinct tau proteins by polyacrylamide gel electrophoresis. Proc Natl Acad Sci USA. 1990;87:5827–5831. doi: 10.1073/pnas.87.15.5827. [DOI] [PMC free article] [PubMed] [Google Scholar]
- 19.Griffith LS, Schmitz B. O-linked N-acetylglucosamine is upregulated in Alzheimer brains. Biochem Biophys Res Commun. 1995;213:424–431. doi: 10.1006/bbrc.1995.2149. [DOI] [PubMed] [Google Scholar]
- 20.Haltiwanger RS, Philipsberg GA. Mitotic arrest with nocodazole induces selective changes in the level of O-linked N-acetylglucosamine and accumulation of incompletely processed N-glycans on proteins from HT29 cells. J Biol Chem. 1997;272:8752–8758. doi: 10.1074/jbc.272.13.8752. [DOI] [PubMed] [Google Scholar]
- 21.Haltiwanger RS, Blomberg MA, Hart GW. Glycosylation of nuclear and cytoplasmic proteins. J Biol Chem. 1992;267:9005–9013. [PubMed] [Google Scholar]
- 22.Haltiwanger RS, Busby S, Grove K, Li S, Mason D, Medina L, Moloney D, Philipsberg G, Scartozzi R. O-glycosylation of nuclear and cytoplasmic proteins: regulation analogous to phosphorylation? Biochem Biophys Res Commun. 1997;231:237–242. doi: 10.1006/bbrc.1997.6110. [DOI] [PubMed] [Google Scholar]
- 23.Han I, Kudlow JE. Reduced O glycosylation of Sp1 is associated with increased proteasome susceptibility. Mol Cell Biol. 1997;17:2550–2558. doi: 10.1128/mcb.17.5.2550. [DOI] [PMC free article] [PubMed] [Google Scholar]
- 24.Harlow E, Lane D. Antibodies—a laboratory manual, pp 421–510. Cold Spring Harbor Laboratory; Cold Spring Harbor, NY: 1988. [Google Scholar]
- 25.Hart GW, Greis KD, Dong LY, Blomberg MA, Chou TY, Jiang MS, Roquemore EP, Snow DM, Kreppel LK, Cole RN. O-linked N-acetylglucosamine: the “yin-yang” of Ser/Thr phosphorylation? Adv Exp Med Biol. 1995;376:115–123. [PubMed] [Google Scholar]
- 26.Kearse KP, Hart GW. Lymphocyte activation induces rapid changes in nuclear and cytoplasmic glycoroteins. Proc Natl Acad Sci USA. 1991;88:1701–1705. doi: 10.1073/pnas.88.5.1701. [DOI] [PMC free article] [PubMed] [Google Scholar]
- 27.Keen JH, Black MM. The phosphorylation of coated membrane protein in intact neuron. J Cell Biol. 1986;102:1325–1333. doi: 10.1083/jcb.102.4.1325. [DOI] [PMC free article] [PubMed] [Google Scholar]
- 28.Kelly WG, Dahmus ME, Hart GW. RNA polymerase II is a glycoprotein. J Biol Chem. 1993;268:10416–10424. [PubMed] [Google Scholar]
- 29.Khachaturian ZS. Diagnosis of Alzheimer’s disease. Arch Neurol. 1985;42:1097–1105. doi: 10.1001/archneur.1985.04060100083029. [DOI] [PubMed] [Google Scholar]
- 30.Kohtz DS, Puszkin S. A neuronal protein (NP185) associated with clathrin-coated vesicles. J Biol Chem. 1988;263:7418–7425. [PubMed] [Google Scholar]
- 31.Laemmli UK. Cleavage of structural proteins during the assembly of the head of bacteriophage T4. Nature. 1970;227:680–685. doi: 10.1038/227680a0. [DOI] [PubMed] [Google Scholar]
- 32.Lafer EM, Womack M, Zhao X, Prasad K, Augustine GJ. Microinjection of the clathrin assembly domain of AP-3 enhances synaptic transmission at the squid giant synapse. Soc Neurosci Abstr. 1997;23:361. [Google Scholar]
- 33.Ledesma MD, Bonay P, Colaco C, Avila J. Analysis of microtubule-associated protein tau glycation in paired helical filaments. J Biol Chem. 1994;269:21614–21619. [PubMed] [Google Scholar]
- 34.Lindner R, Ungewickell E. Clathrin-associated proteins of bovine brain coated vesicles. J Biol Chem. 1992;267:16567–16573. [PubMed] [Google Scholar]
- 35.Lindwall G, Cole RD. The purification of tau protein and the occurrence of two phosphorylation states of tau in brain. J Biol Chem. 1984;259:12241–12245. [PubMed] [Google Scholar]
- 36.Masliah E, Terry RD, DeTeresa RM, Hansen LA. Immunohistochemical quantification of the synapse-related protein synaptophysin in Alzheimer disease. Neurosci Lett. 1989;103:234–239. doi: 10.1016/0304-3940(89)90582-x. [DOI] [PubMed] [Google Scholar]
- 37.Maycox PR, Link E, Reetz A, Morris SA, Jahn R. Clathrin-coated vesicles in nervous tissue are involved primarily in synaptic vesicle recycling. J Cell Biol. 1992;118:1379–1388. doi: 10.1083/jcb.118.6.1379. [DOI] [PMC free article] [PubMed] [Google Scholar]
- 38.Monsigny M, Roche AC, Sene C, Maget-Dana R, Delmotte F. Sugar-lectin interactions: how does wheat-germ agglutinin bind sialoglycoconjugates? Eur J Biochem. 1980;104:147–153. doi: 10.1111/j.1432-1033.1980.tb04410.x. [DOI] [PubMed] [Google Scholar]
- 39.Morrison JH, Hof PR. Life and death of neurons in the aging brain. Science. 1997;278:412–419. doi: 10.1126/science.278.5337.412. [DOI] [PubMed] [Google Scholar]
- 40.Murphy DB. Purification of tubulin and tau from chicken erythrocytes: tubulin isotypes and mechanisms of microtubule assembly. Methods Enzymol. 1991;196:235–246. doi: 10.1016/0076-6879(91)96022-j. [DOI] [PubMed] [Google Scholar]
- 41.Murphy JE, Pleasure IT, Puszkin S, Prasad K, Keen JH. Clathrin assembly protein AP-3. J Biol Chem. 1991;266:4401–4408. [PubMed] [Google Scholar]
- 42.Murphy JE, Hanover JA, Froehlich M, DuBois G, Keen JH. Clathrin assembly protein AP-3 is phosphorylated and glycosylated on the 50 kDa structure domain. J Biol Chem. 1994;269:21346–21352. [PubMed] [Google Scholar]
- 43.O’Farrell PH. High resolution two-dimensional electrophoresis of proteins. J Biol Chem. 1975;250:4007–4021. [PMC free article] [PubMed] [Google Scholar]
- 44.Plummer TH, Tarentino AL. Facile cleavage of complex oligosaccharides from glycopeptides by almond emulsin peptide: N-glycosidase. J Biol Chem. 1981;256:10243–10246. [PubMed] [Google Scholar]
- 45.Regeur L, Jensen GB, Pakkenberg H, Evans SM, Pakkenberg B. No global neocortical nerve cell loss in brains from patients with senile dementia of Alzheimer’s type. Neurobiol Aging. 1994;15:347–352. doi: 10.1016/0197-4580(94)90030-2. [DOI] [PubMed] [Google Scholar]
- 46.Roquemore EP, Chou TY, Hart GW. Detection of O-linked N-acetylglucosamine on cytoplasmic and nuclear proteins. Methods Enzymol. 1994;230:443–461. doi: 10.1016/0076-6879(94)30028-3. [DOI] [PubMed] [Google Scholar]
- 47.Scheff SW, Price DA. Synapse loss in the temporal lobe in Alzheimer’s disease. Ann Neurol. 1993;33:190–199. doi: 10.1002/ana.410330209. [DOI] [PubMed] [Google Scholar]
- 48.Scheff SW, DeKosky ST, Price DA. Quantitative assessment of cortical synatic density in Alzheimer’s disease. Neurobiol Aging. 1990;11:29–37. doi: 10.1016/0197-4580(90)90059-9. [DOI] [PubMed] [Google Scholar]
- 49.Smith MA, Sayre LM, Monnier VM, Perry G. Radical ageing in Alzheimer’s disease. Trends Neurosci. 1995;18:172–176. doi: 10.1016/0166-2236(95)93897-7. [DOI] [PubMed] [Google Scholar]
- 50.Sousa R, Tannery NH, Lafer EM. Two new monoclonal antibodies provide immunohistochemical evidence for the unique biochemical similarity of the mouse globus pallidus, entopeduncular nucleus and substantia nigra pars reticulata. Neuroscience. 1990;34:403–410. doi: 10.1016/0306-4522(90)90149-x. [DOI] [PubMed] [Google Scholar]
- 51.Tomlinson BE, Blessed G, Roth M. Observations on the brains of demented old people. J Neurol Sci. 1970;11:205–242. doi: 10.1016/0022-510x(70)90063-8. [DOI] [PubMed] [Google Scholar]
- 52.Torres CR, Hart GW. Topography and polypeptide distribution of terminal N-acetyl-glucosamine residues on the surfaces of intact lymphocytes. J Biol Chem. 1984;259:3308–3317. [PubMed] [Google Scholar]
- 53.Travelyan WE, Procter DP, Harrison JS. Detection of sugars on paper chromatograms. Nature. 1950;166:3901–3906. doi: 10.1038/166444b0. [DOI] [PubMed] [Google Scholar]
- 54.Turner JR, Tartakoff AM, Greenspan NS. Cytologic assessment of nuclear and cytoplasmic O-linked N-acetylglucosamine distribution by using anti-streptococcal monoclonal antibodies. Proc Natl Acad Sci USA. 1990;87:5608–5612. doi: 10.1073/pnas.87.15.5608. [DOI] [PMC free article] [PubMed] [Google Scholar]
- 55.Wallenfels B. Developmental and mutational changes of glycoproteins in the mouse neuronal retina: studies with bovine galactosyltransferase. Proc Natl Acad Sci USA. 1979;76:3223–3227. doi: 10.1073/pnas.76.7.3223. [DOI] [PMC free article] [PubMed] [Google Scholar]
- 56.Wang JZ, Grundke-Iqbal I, Iqbal K. Glycosylation of microtubule-associated protein tau: an abnormal posttranslational modification in Alzheimer’s disease. Nat Med. 1996;2:871–875. doi: 10.1038/nm0896-871. [DOI] [PubMed] [Google Scholar]
- 57.Ye W, Lafer EM. Bacterially expressed F1–20/AP-3 assembles clathrin into cages with a narrow size distribution: implications for the regulation of quantal size during neurotransmission. J Neurosci Res. 1995;41:15–26. doi: 10.1002/jnr.490410104. [DOI] [PMC free article] [PubMed] [Google Scholar]
- 58.Zhou S, Tannery NH, Yang J, Puszkin S, Lafer EM. The synapse-specific phosphoprotein F1–20 is identical to the clathrin assembly protein AP-3. J Biol Chem. 1993;269:12655–12662. [PubMed] [Google Scholar]
- 59.Zinn AB, Plantner JJ, Carlson DM. Nature of linkages between protein core and oligosaccharides. In: Horowitz MI, Pigman W, editors. The glycoconjugates. Academic; New York: 1977. pp. 69–85. [Google Scholar]