

Abstract
βgc is a β-subunit variant of the insulin-like growth factor-1 (IGF-1) receptor highly enriched in growth cone membranes prepared by subcellular fractionation of fetal rat brain (Quiroga et al., 1995). The present study is focused on the expression and on the cellular and subcellular distribution of βgcin developing neurons and differentiating PC12 cells. In the developing cerebral cortex and, at least at early stages, in cultured primary neurons, βgc expression was found to be correlated with neurite outgrowth. In PC12 cells βgc expression was nerve growth factor (NGF)-dependent and also paralleled neurite outgrowth. In contrast, β-subunits of the insulin receptor and/or of other IGF-1 receptors (“βP5”; detected with antibody AbP5) were downregulated as βgc expression increased. Immunofluorescence studies confirmed the enrichment of βgc at growth cones and demonstrated morphologically its spatial separation from βP5, which is confined to the perikaryon. At the growth cone, βgc colocalizes and associates in a proximal region with microtubules, but it seems independent of the more peripheral microfilaments. Some βgc immunoreactivity is detected in the perinuclear region of PC12 cells, most likely the Golgi complex and its vicinity. βgc seems to emerge from the periphery of this structure in an apparently vesicular compartment distinct from that carrying synaptophysin to the growth cones. The facts that (1) βgcexpression is correlated closely with neurite outgrowth, that (2) it is regulated in PC12 cells by a neurotrophin, NGF, and that (3) βgc is concentrated in the proximal growth cone region raise new questions regarding a possible role of IGF-1 receptors containing βgc in the regulation of neurite growth.
Keywords: IGF-1 receptor, β-subunits, βgc, growth cones, neurons, neurite outgrowth, neurotrophins, PC12 cells, development, tissue culture
Insulin-like growth factor-1 (IGF-1) is involved in the regulation of animal growth and tissue differentiation (Froesch et al., 1985; Daughaday and Rotwein, 1989), including that of the brain. Expression of the IGF-1 gene and its transcript is high in the developing brain but decreases in the adult (Rotwein et al., 1988;LeRoith et al., 1992). IGF-1 stimulates the growth and differentiation of fetal neurons in culture (DiCiccio-Bloom and Black, 1988), increases neuronal sprouting and outgrowth (Aizenman and De Vellis, 1987; Caroni and Grandes, 1990; Beck et al., 1993; Ishii et al., 1993), enhances neuronal protein synthesis (Heidenreich and Toledo, 1989), and regulates neuronal and glial function (Sara and Hall, 1990). In addition, IGF-1 has been implicated in the modulation of synaptic transmission (Schwartz et al., 1992). The receptor for IGF-1 resembles the insulin receptor and is a disulfide-linked heterotetrameric (α2β2) transmembrane glycoprotein with extracellular ligand-binding (α) and intracellular tyrosine kinase (β) domains (Ullrich et al., 1986). The expression of this receptor in the CNS is high at late embryonic and early postnatal stages and declines significantly afterward (Ullrich et al., 1986; Werner et al., 1991), again suggesting an important role for this ligand–receptor system in brain development. This notion is supported further by the following observations: IGF-1 and its receptor are expressed permanently in the olfactory bulb, where neuronal remodeling and synaptogenesis continue throughout adult life (Bondy, 1991), and transgenic mice lacking IGF-1 receptors exhibit serious defects in CNS development (Liu et al., 1993).
We have reported previously the biochemical characterization of a β-subunit of the IGF-1 receptor, designated βgc. It is immunochemically distinct from the described forms of this polypeptide, highly enriched in a growth cone fraction prepared from developing rat brain, and, within the neuron, spatially segregated from the insulin receptor (Quiroga et al., 1995). In the present study we provide new evidence on the cellular and subcellular localization of βgc as well as on the regulation of its expression.
Three different systems were analyzed: developing rat cerebral cortex, primary neurons in culture, and PC12 cells differentiating in vitro. The rat pheochromocytoma cell line, PC12, is an excellent model system for studying growth cone formation, neurite outgrowth, and the expression of structural and membrane proteins involved in nerve cell morphogenesis (Greene and Tischler, 1976; Drubin et al., 1985;Greene et al., 1987; Bearer, 1992; Esmaeli-Azad et al., 1994). In the absence of nerve growth factor (NGF), the cells are round or polygonal. On stimulation with NGF, they extend several neurites tipped by well defined growth cones. To study the relationship between βgc expression and nerve cell development, we took advantage of this cell system. We analyzed the levels and distribution patterns of βgc during NGF-induced neurite outgrowth. Our results indicate that βgc expression is controlled developmentally, increasing in parallel with process extension, and that it is regulated by NGF in PC12 cells. Our studies also provide morphological evidence that βgc is a prominent growth cone component—in contrast to other β-subunits of the insulin or other IGF-1 receptors (Garofalo and Rosen, 1989), which are essentially restricted to cell perikarya. In addition, we show that, within growth cones, βgc is associated spatially with microtubules, but not microfilaments, and segregated from synaptophysin.
MATERIALS AND METHODS
Cell cultures. PC12 cells (obtained from Dr. A. Ferreira, Harvard Medical School, Cambridge, MA) were grown in DMEM supplemented with 10% horse serum and incubated at 37°C in a humidified 5% CO2 atmosphere. Cells were plated onto poly-l-lysine-coated glass coverslips at densities ranging from 5000–10,000 cells/cm2. After plating they were maintained for 2–3 d in serum-free medium supplemented with the additives of Bottenstein and Sato (1979). When appropriate, NGF (Boehringer Mannheim, Indianapolis, IN) was added at a concentration of 50 ng/ml. For some experiments PC12 cells were treated with cytochalasin D (5 μm) for 20 min or nocodazole (10 μg/ml) for 30 or 60 min. Primary neuronal cultures were prepared from the hippocampi or cerebral cortex of rat fetus (17–20 d gestation) as previously described (Cáceres et al., 1986, 1992; Kosik and Finch, 1987). Briefly, neurons were dissociated with trypsin in Ca- and Mg-free medium and plated onto poly-l-lysine-coated coverslips. Hippocampal neurons then were incubated for 2–3 hr in Eagle’s Minimum Essential Medium (MEM) containing 10% horse serum to allow for attachment. Subsequently, these coverslips were transferred into dishes containing astroglial cells. The cultures were maintained in MEM supplemented with 0.1% ovalbumin and the additives ofBottenstein and Sato (1979).
Immunofluorescence. Cells were fixed before or after mild detergent extraction under microtubule-stabilizing conditions and processed for immunofluorescence as previously described (Cáceres et al., 1992; DiTella et al., 1994) (see also Black et al., 1994). The primary antibodies used were a monoclonal antibody (mAb) against tyrosinated α-tubulin (clone TUB-1A2, mouse IgG, Sigma, St. Louis, MO) diluted 1:1000; a mAb against acetylated α-tubulin (clone 6-11B-1; Ferreira and Cáceres, 1989); an affinity-purified rabbit antiserum against βgc (Quiroga et al., 1995) diluted 1:50 or 1:100; and a rabbit antiserum designated AbP5, which recognizes previously described β-subunits of both the insulin and the IGF-1 receptors (Garofalo and Rosen, 1989). The double-antibody staining protocol consisted of labeling with a first primary antibody, washing with PBS, staining with fluorophore-labeled secondary antibody, washing again with PBS, and then repeating this procedure for the second primary antibody. Incubations with primary antibodies were for 1 or 3 hr at room temperature, whereas incubations with secondary antibodies (FITC or rhodamine-labeled, generated in the goat and obtained from Boehringer Mannheim) were performed for 1 hr at 37°C. The cells were observed with an inverted microscope (Zeiss Axiovert 35M) equipped with epifluorescence optics and photographed with 40× or 100× objectives (Zeiss, Oberkochen, Germany) and Tri X-Pan (400 ASA) or Kodak Gold Plus (400 ASA) film (Eastman Kodak, Rochester, NY).
In some experiments, the distribution of βgc and synaptophysin was evaluated with high-resolution video microscopy and image processing as described (DiTella et al., 1994, 1996). So that images of labeled cells could be made, the epifluorescence illumination was attenuated with glass neutral density filters. Images were formed on the faceplate of a Silicon Intensified Target camera (SIT; Hamamatsu, Middlesex, NJ), set for manual high voltage, gain, and black level. They were digitized directly into a Metamorph/Metafluor image processor (Universal Imaging, West Chester, PA) controlled by a host IBM-AT computer. After digitization, images were corrected for shading distortion by dividing by a low-pass-filtered image of a featureless field and normalizing to the maximum intensity within that image. In some cases pseudocolor images were generated with the red/green overlay menu of the Metamorph/Metafluor system. For the purpose of presentation fluorescent images were photographed directly from a high-resolution video monitor with a 35 mm camera (automatic exposure setting). Film negatives were printed with equal exposure times.
Morphometric analysis. For some experiments the neurite lengths of NGF-treated PC12 cells were measured with the morphometric menu of the Metamorph system as described (Cáceres et al., 1992).
Polyacrylamide gel electrophoresis and Western blotting.Whole-cell homogenates from brain tissue (cerebral cortex) or from cultured cells were prepared as described previously (Cáceres et al., 1988, 1992), and polypeptides were resolved by polyacrylamide gel electrophoresis (7.5% acrylamide; Laemmli, 1970). Polypeptides were electro-transferred to nitrocellulose and then probed with the βgc or the AbP5 antibodies using an alkaline phosphatase detection kit (Promega ProtoBlot Detection Kits, Madison, WI) or iodinated protein A (see also Quiroga et al., 1995). For some experiments βgc protein levels were quantitated in whole-cell homogenates from PC12 cells with a dot immunobinding assay as previously described (Cáceres et al., 1992).
Autophosphorylation and immunoprecipitation of βgc.Membranes from PC12 cells cultured for 72 hr in the presence of NGF were resuspended in phosphorylation buffer (50 mmHEPES, pH 7.8, and 2.5 mm MnCl2) with or without 10 nm IGF-1 (final reaction volume, 50 μl), and kinase reactions were performed as described (Garofalo and Rosen, 1989). Then βgc antibody was added and allowed to bind overnight at 4°C. Protein G-agarose was added, and the incubation was continued for 120 min at room temperature. Immune complexes were collected by centrifugation, and the beads were washed as described (Garofalo and Rosen, 1989). Autophosphorylated receptors were eluted by addition of Laemmli sample buffer (Laemmli, 1970). They were analyzed by electrophoresis in 7.5% polyacrylamide gels and autoradiography.
RESULTS
Expression of βgc in neurons from developing brain
Our previous study (Quiroga et al., 1995) showed that growth cone membranes isolated from fetal brain are enriched in βgc, suggesting that the expression of this protein is correlated with process formation in developing neurons. To test this hypothesis, we have examined the time course of expression and the relative levels of βgc during postnatal development of rat cerebral cortex. In addition, we analyzed its expression and distribution in primary cultures of neurons from fetal rat cerebral cortex (Kosik and Finch, 1987) and hippocampus (Cáceres et al., 1986; Dotti et al., 1988). For the first type of experiment, whole homogenates of cerebral cortex prepared on postnatal days 1, 3, 6, and 13 (P1–P13) and from adult rats were probed with the rabbit antiserum against βgc by Western blotting. The βgc antibody recognized a single, somewhat broad and heterogenous, immunoreactive band of ∼97 kDa in the tissue extracts obtained at P1, P3, P6 and P13, whereas a second and faster migrating band (90 kDa) was present in the homogenates prepared from adult cerebral cortex (Fig. 1). βgc expression was high at early postnatal stages but declined gradually and considerably with increasing age. In the adult brain the lowest levels were detected and the 97 kDa band appeared sharpened, as compared with earlier stages.
Fig. 1.

The expression of βgc in the developing rat cerebral cortex as revealed by immunoblot analysis of whole-tissue extracts. P1–P13, Postnatal days 1–13; Ad, adult. βgc is highly expressed in the developing cerebral cortex. A second and faster migrating band is present in the homogenates prepared from the adult cerebral cortex. Protein (20 μg) was loaded in each lane; the immunoblots were revealed by a rabbit ProtoBlot staining kit. The blots shown are representative of three independent experiments, all of which generated essentially identical results.
We next studied the distribution of βgc in primary neurons sprouting in culture. After 12 hr in culture, most cortical and hippocampal pyramidal neurons had extended several short undifferentiated neurites, designated as minor processes; at this stage βgc immunolabeling was concentrated heavily in the growth cones (Fig. 2A,B). Several hours later, the neurons differentiated one of their minor processes into an axon. In this type of culture any neurite that exceeded the other processes of the same neuron in length by 10 μm or more was considered to be an axon (Craig and Banker, 1994). The growth cones of these axons also displayed heavy staining for βgc. An example of such a growth cone, labeled with the βgcantibody, is shown in Figure 2D (tubulin staining of the same axon is shown in Fig. 2C). This particular neurite was over 100 μm long, exceeding in length the minor neurites from the same cell by >70 μm. Comparisons of βgc fluorescence intensities of axonal growth cones versus those of minor processes revealed no significant differences. Our results also showed that the expression of βgc in cortical and hippocampal pyramidal neurons was transient, declining significantly when cells began dendritic differentiation. Thus, in older cultures (>4 d in vitro) when the (nonaxonal) minor processes had become dendrites and were elongating, βgc immunolabeling decreased considerably, disappeared eventually from dendritic growth cones, and became diffusely distributed throughout the cell (data not shown).
Fig. 2.

The distribution of βgc in primary neurons. Double-immunofluorescence micrographs of a hippocampal pyramidal neuron maintained in culture for 12 hr show the distribution of tyrosinated α-tubulin (A) and βgc (B). Note the intense and selective labeling of neurite tips with the βgc antiserum. Double-immunofluorescence micrographs also show the distribution of microtubules (C) and βgc(D) in an axon-like process from a hippocampal pyramidal neuron maintained in culture for 24 hr. Note that βgc immunolabeling is restricted to the axonal growth cone. Calibration bar, 10 μm.
Expression and distribution of βgc in PC12 cells
In whole PC12 cell extracts the anti-βgc antibody recognized a single polypeptide of ∼105 kDa (Fig.3A, lane 1). Thus, the βgc-immunoreactive polypeptide from PC12 cells exhibited a higher apparent molecular mass than the single βgc-immunoreactive protein species detected in tissue extracts obtained from the developing rat cerebral cortex (∼97 kDa; Fig. 3A, lane 3). For the Western blot shown in Figure 3A, lane 1, extracts were prepared from PC12 cells cultured for 48 hr in the presence of NGF, i.e., from differentiating PC12 cells that had begun to form neurites. However, the βgc antigen was not or only very weakly detectable by Western blot in undifferentiated cells grown without NGF, even when two- to threefold higher protein amounts were loaded on the gels (Fig.3A, lane 2).
Fig. 3.
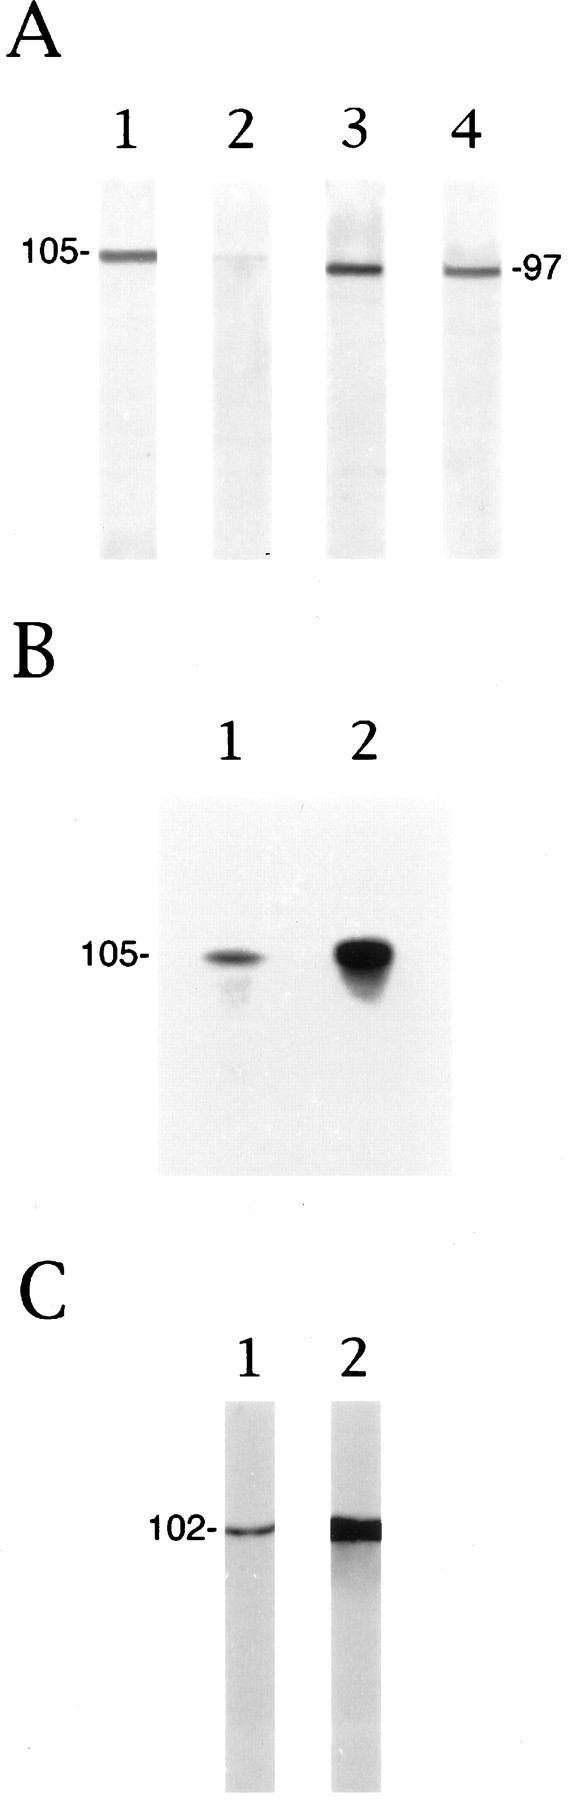
The expression of βgc and βP5 in PC12 cells. A, Immunoblot analysis of whole-cell extracts from NGF-treated (lane 1) or nontreated (lane 2) PC12 cells reacted with the βgc antiserum. NGF induces the expression of a single βgc-immunoreactive protein species with an apparent molecular mass of 105 kDa. βgc-immunoreactive polypeptides were not detected in undifferentiated PC12 cells under these conditions. A single βgc-immunoreactive species of 97 kDa (see also Fig. 1 and Quiroga et al., 1995) is detected in tissue extracts obtained from 3-d-old rat cerebral cortex (lane 3) or in whole-cell extracts from hippocampal pyramidal cells differentiated in culture for 48 hr (lane 4).B, Autophosphorylation of IGF-1 receptor in PC12 membranes immunoprecipitated with the βgc antibody. The addition of 10 nm IGF-1 (lane 2) dramatically stimulates the phosphorylation of the immunoprecipitated ∼105 kDa polypeptide, as compared with the control experiment (lane 1). C, Immunoblot analysis of whole-cell extracts from NGF-treated (lane 1) or nontreated (lane 2) PC12 cells reacted with the AbP5 antiserum (βP5). The 102 kDa βP5-immunoreactive band is considerably less abundant in NGF-treated than in nontreated PC12 cells (NGF treatment was for 3 d). Protein (20 μg) was loaded in each lane, and the immunoblots were processed with a rabbit ProtoBlot staining kit. The blots and autoradiogram shown are representative of at last three independent experiments, all of which generated essentially identical results.
To ascertain that the 105 kDa immunoreactive band detected in PC12 cells was indeed the βgc subunit of the IGF-1 receptor, we performed an autophosphorylation experiment with membranes of PC12 cells (grown with NGF) incubated in the presence or absence of IGF-1. Figure 3B shows autoradiograms of the immunoprecipitates obtained with the βgc antibody and resolved by SDS-polyacrylamide gel electrophoresis. A single radiolabeled band was detected at 105 kDa, and its intensity was greatly enhanced when the autophosphorylation was performed in the presence of IGF-1 (Fig.3B, lane 2). This established the identity of the 105 kDa band as βgc.
The expression of βgc in differentiating PC12 cells was compared with that of other β-subunits of the insulin and IGF-1 receptors with antibody AbP5. This polyclonal antibody was raised against a synthetic peptide representing part of the human insulin receptor β-subunit (amino acids 1328–1343; Garofalo and Rosen, 1989). The antibody cross-reacts with the β-subunit of the rat insulin receptor as well as with β-subunits of the IGF-1 receptor that are distinct from the βgc-immunoreactive species (Garofalo and Rosen, 1989; S. Quiroga, unpublished observations). Figure 3C shows that AbP5 recognizes a single polypeptide at 102 kDa in PC12 cells. In contrast to βgc, the AbP5-immunoreactive band (termed βP5) is relatively faint in extracts of NGF-differentiated PC12 cells and much stronger in the nondifferentiated cells (Fig. 3C, lane 1 vslane 2, respectively).
To correlate βgc and βP5 immunoreactivity quantitatively with differentiation, we determined average neurite lengths and β-subunit expression (by dot immunobinding assay of whole-cell extracts; Cáceres et al., 1988) in PC12 cells treated for up to 4 d with NGF. Table 1 shows the results. The dramatic increase of NGF-induced neurite length observed over 4 d was paralleled by a more than sixfold increase of βgc, whereas expression of βP5 decreased to less than one-half the control value in the presence of NGF. If NGF-differentiated (4 d) PC12 cells were deprived of the neurotrophin for 6 hr, neurite length decreased dramatically, and so did βgc expression. βP5 expression did not change during this short deprivation period, however. These results showed in PC12 cells that βgc expression was tightly controlled by NGF, together with differentiation, but that βP5 obeyed an inverse regulation pattern.
Table 1.
Changes in βgc and βP5 protein levels during NGF-induced neurite outgrowth in PC12 cells
| Treatment | Total neurite length (μm) | βgc (cpm) | βP5 (cpm) |
|---|---|---|---|
| None | 0.25 ± 0.2 | 93 ± 5 | 1236 ± 50 |
| NGF (1 d) | 5 ± 1 | 102 ± 8 | 844 ± 38 |
| NGF (2 d) | 25 ± 4 | 142 ± 11 | 655 ± 29 |
| NGF (3 d) | 97 ± 13 | 208 ± 17 | 730 ± 42 |
| NGF (4 d) | 280 ± 15 | 573 ± 31 | 588 ± 24 |
| NGF (4 d) + 6 hr without NGF | 31 ± 6 | 255 ± 23 | 568 ± 31 |
βgc and βP5 protein levels were determined by quantitative dot immunobinding assay using125I-protein A. Each value represents the mean ± SEM of measurements of five PC12 cultures grown on 18 mm glass coverslips. Values are expressed in cpm 125I-protein A bound per microgram of total cellular protein.
Length values represent the means ± SEM and are expressed in micrometers. In total, 500 cells were measured for each time point.
Immunolocalization of βgc in PC12 cells
In the next series of experiments the spatial distribution of βgc was studied in PC12 cells by double immunolabeling with anti-βgc and a mAb that recognized tyrosinated α-tubulin (clone TUA 1.2). PC12 cells cultured in the absence of NGF had a round or polygonal morphology, as expected (Fig.4A, tubulin antibody), and exhibited very weak immunofluorescence when incubated with the βgcantibody (Fig. 4B). When used at very high concentrations (dilution 1:5–1:10), the βgc antibody labeled a small perinuclear area of the cell cytoplasm that resembled the Golgi complex (data not shown). As expected, a dramatic increase in βgc immunofluorescence was evident when PC12 cells were cultured in the presence of NGF. This phenomenon was detected as early as 24 hr after the addition of NGF, when PC12 cells began to acquire a neuron-like morphology. At that stage the cells had several short neurites tipped with small growth cones. βgcimmunofluorescence was localized preferentially to the perinuclear region and to the growth cones (Fig. 4D; compare with tubulin staining in 4C), whereas most of the cell body and of the neuritic shafts was devoid of βgc immunolabeling. An exception was occasional short neurites that contained a continuous band of granular staining between the perinuclear region and the growth cones (see arrow, Fig. 4D). After 72 hr in the presence of NGF, PC12 cells had extended several long neurites that ended in prominent growth cones. At this stage βgcimmunostaining had become very intense within the growth cone area but had disappeared completely from neuritic shafts (Fig.4F). A similar pattern was detected in PC12 cells cultured with NGF for longer periods of time (3–7 d).
Fig. 4.

βgc becomes localized to growth cones in differentiated PC12 cells. Double-immunofluorescence micrographs show the distribution of tyrosinated α-tubulin (A, C, E) and βgc (B, D,F) in PC12 cells. PC12 cells cultured in the absence of NGF display low positive immunofluorescence for the βgc antibody (A, B). A dramatic increase in βgc immunofluorescence is detected in PC12 cells treated with NGF for 2 (C,D) or 4 (E, F) d. In these cells βgc is localized preferentially in the perinuclear region and at neurite tips. In young NGF-treated PC12 cells, a few neurites display a granular type of staining that extends from the cell body to the tip (arrow inD); however, in further differentiated PC12 cells, the cell body and neuritic shafts are devoid of labeling (E,F). Calibration bar, 10 μm.
Our subcellular fractionation data published earlier (Quiroga et al., 1995) indicated spatial separation of βgc from other insulin and IGF-1 receptor β-subunits. Therefore, we performed immunolocalization studies with the AbP5 antibody on PC12 cells. Uniformly distributed AbP5 immunofluorescence was readily detectable in undifferentiated PC12 cells (data not shown). To demonstrate the localization of βP5 versus βgc in differentiated PC12 cells, we performed double immunofluorescence. All cells were labeled with the tubulin antibody (secondarily tagged with the green FITC) and then with either AbP5 or anti-βgc(secondarily tagged with the red rhodamine). Because permeabilization was necessary to reveal the βgc antigen (presumably because the epitope is intracellular) and, of course, tubulin, we could not decide whether the βgc staining was on the cell surface and/or in the cellular interior. However, at least part of the perinuclear label almost certainly was associated with sites of synthesis, especially distal regions of the Golgi complex (compare Fig.7). At the growth cone, however, at least some of the βgclabel must have been associated with the cell surface, because the receptor could be activated by externally applied IGF-1 (Quiroga et al., 1995). Figure 5A shows the expected pattern for βgc, i.e., intensely red-yellow staining of growth cones (primarily βgc), green neurites (mostly tubulin), and yellow perikarya (overlap of tubulin and βgc). Figure 5B illustrates the contrasting pattern for AbP5: absence of obvious growth cone labeling, green neurites stained with anti-tubulin only, and yellow perikarya doubly labeled with anti-tubulin and AbP5. (As before, these samples had to be permeabilized for immunolabeling so that it was difficult to discriminate between β-subunits exposed on the cell surface and those within the cell). These experiments indicate strikingly the differential distribution of βgc versus the other β-subunit(s) (βP5) in differentiated PC12 cells.
Fig. 7.
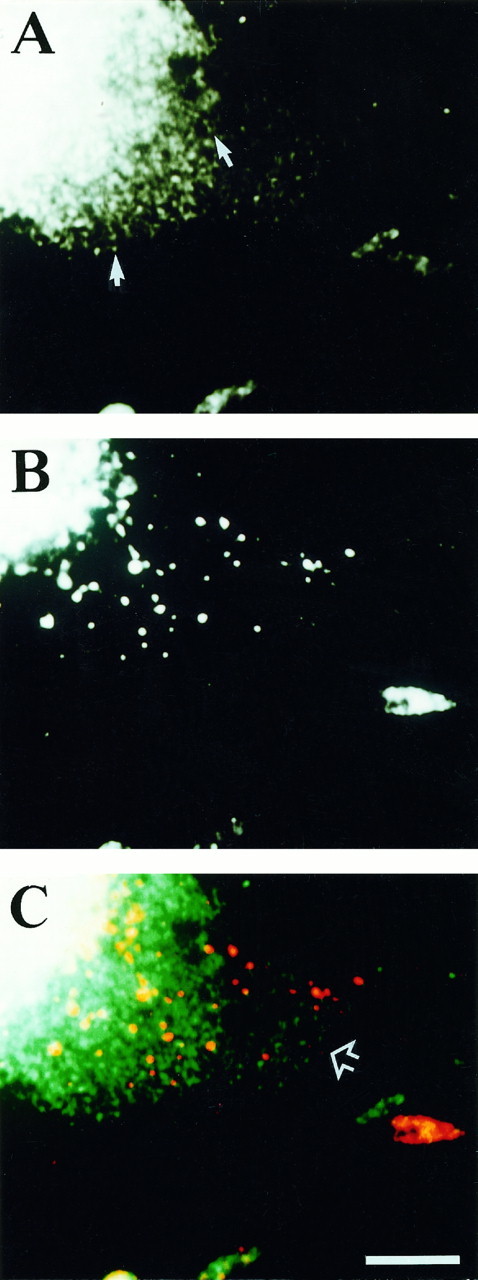
βgc and synaptophysin appear to emerge from the perinuclear region in distinct vesicle-like structures. Double-immunofluorescence micrographs show the distribution of synaptophysin (A) and βgc(B) in the perinuclear region of a PC12 cell treated with NGF for 3 d. The arrows in A point at apparent strands of small fluorescent dots.C, Overlay of digitized synaptophysin (green) and βgc(red) images shown in A andB, respectively. The open arrow points at a thin region of the perikaryon where there is no overlap between labeled compartments. Calibration bar, 10 μm.
Fig. 5.
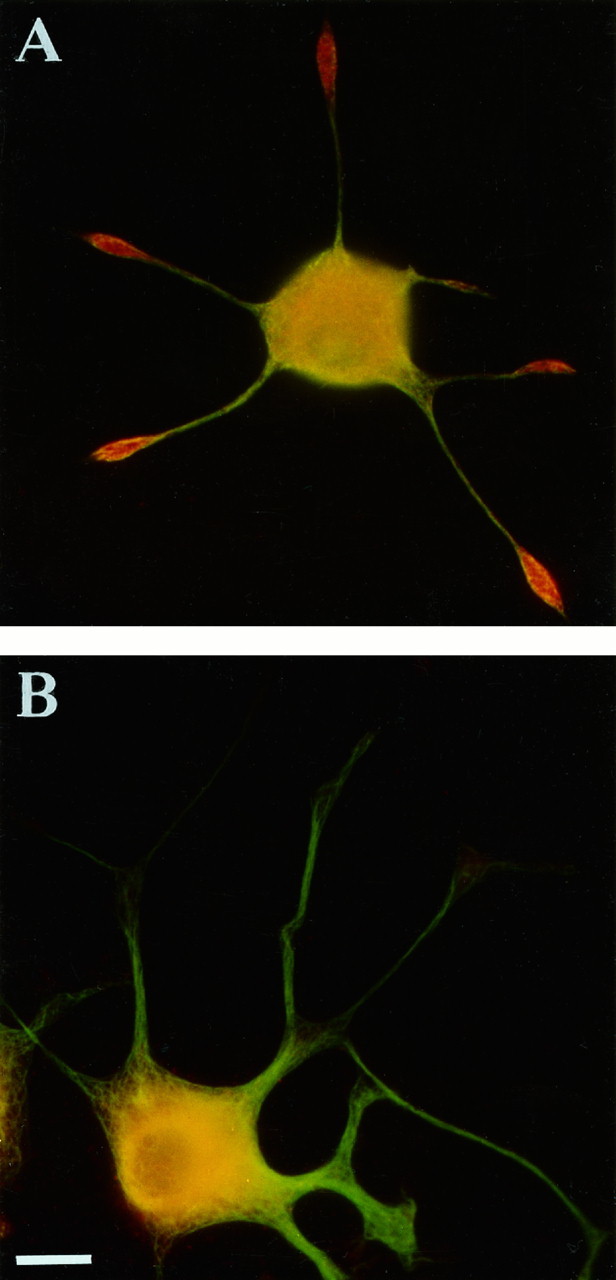
Differential distribution of βgc and AbP5-immunoreactive insulin/IGF-1 β-subunits. A, Double-immunofluorescence micrograph shows the distribution of tyrosinated α-tubulin (green) and of βgc (red). βgc is highly enriched at neurite tips. B, Double-immunofluorescence micrograph shows the distribution of tyrosinated α-tubulin (green) and AbP5 immunofluorescence (red) in a differentiated PC12 cell. Overlapping label appears yellow. Note the absence of AbP5 immunolabeling within the neurites and growth cones. Calibration bar, 10 μm.
To investigate βgc further, we used fluorescence microscopy combined with image processing to analyze its subcellular distribution in differentiating PC12 cells and to compare it with that of synaptophysin. Synaptophysin is a membrane protein associated with synaptic vesicles and enriched in the growth cones of developing neurons (Fletcher et al., 1990). Although the antibodies specific for βgc and synaptophysin labeled essentially the same areas of the cell, namely the perinuclear region and the growth cones (Fig.6A,B), we detected clear differences in their staining patterns. For example, as shown in Figure 6, the distribution of βgc immunofluorescence (Fig.6D,F) in growth cones exhibited in some cases little overlap with that of synaptophysin (Fig. 6C,E). Also, during the initial stages of neurite extension (24–48 hr after the addition of NGF) growth cones highly immunoreactive for βgc commonly were stained only faintly or not at all with the synaptophysin antibody, although prominent immunolabeling was detected in the perinuclear region (Fig.6E,F). Within the perikarya of differentiating PC12 cells, we were able to observe punctate fluorescent structures of variable size, vesicle-like structures clearly located in the cell interior and apparently emerging from the perinuclear region. With the synaptophysin antibody (Fig. 7A), these fluorescent dots were quite small and numerous and tended to form strands radiating from the perinuclear region (arrows). The βgc antibody (Fig. 7B), however, labeled a heterogeneously sized, generally much larger and sparser, compartment. A pseudocolor superimposition image is shown in Figure 7C. There was substantial overlap between the staining patterns in the thicker region of the cell near the nucleus (near the top left-hand corner), as expected. However, in the thinner, more peripheral parts of the perikaryon (arrow) there was very little, if any, overlap between the staining patterns.
Fig. 6.

βgc and synaptophysin exhibit similar, but not identical, distributions within growth cones. Double-immunofluorescence micrographs show the distribution of synaptophysin (A, C, E) and βgc (B, D,F) in PC12 cells treated with NGF for 3 d. Both antigens are localized preferentially in the perinuclear region of the cell bodies and in growth cones (arrows), but there are clear differences in their staining patterns (see text). Calibration bar, 10 μm.
Interactions between βgc and the cytoskeleton of growth cones
The distribution of several growth cone-associated surface antigens seems to depend on interactions with microtubules and/or microfilaments (Goslin et al., 1989; Bearer, 1992; DiTella et al., 1994). The highly polarized distribution of βgc raised the question of whether this membrane protein also interacted with the cytoskeleton. To study such relationships, we examined first whether and where βgc was detectable in association with the cytoskeletons remaining after detergent extraction of differentiated PC12 cells (prepared under microtubule-stabilizing conditions; see Material and Methods). The cytoskeletons were double-labeled with the antibody to tyrosinated α-tubulin and the βgc antiserum and then analyzed by fluorescence microscopy. On detergent extraction most βgc immunolabeling was lost from the perinuclear region. However, it remained unaffected within growth cones, where it colocalized extensively with tyrosinated microtubules (Fig. 8A,B). It is unlikely that this was the result of incomplete solubilization and extraction of membrane proteins because, under the same extraction conditions, the staining for synaptophysin was abolished completely (Fig. 8C, synaptophysin label, and 8D, βgc label of the same cell). Therefore, our observation indicated that a significant proportion of βgc of the growth cone was linked somehow to the cytoskeleton.
Fig. 8.

βgc and dynamic microtubules colocalize within growth cones. Double-immunofluorescence micrographs show the distribution of tyrosinated α-tubulin (A) and βgc (B) in a detergent-extracted cytoskeletal preparation from a differentiated PC12 cell. Note the colocalization of βgc immunolabeling with tyrosinated microtubules at the neurite tip. Double-immunofluorescence micrographs also show the distribution of synaptophysin (C) and βgc (D) in a detergent-extracted cytoskeletal preparation from a differentiated PC12 cell. Synaptophysin has disappeared completely from growth cones (arrows), although βgc immunolabeling remains unaffected. p, Perinuclear region. Calibration bar, 10 μm.
Next we investigated whether βgc was linked to microtubules and/or to actin filaments. Differentiated PC12 cells were treated with the microtubule toxin, nocodazole, for 30 or 60 min before fixation, and the distribution of βgc and microtubules was analyzed by immunofluorescence. As shown in Figure9, this treatment depolymerized throughout the cell most of the microtubules containing tyrosinated α-tubulin (Fig.9B), but it preserved the tubules enriched in acetylated α-tubulin (a marker of stable polymer); these were localized preferentially to neuritic shafts but absent from growth cones (Fig.9A; Ferreira and Cáceres, 1989; Arregui et al., 1991). The distribution of βgc (Fig. 9D) was altered dramatically in nocodazole-treated cells; the immunostaining disappeared from the growth cones while punctate and disperse labeling appeared along neuritic shafts (compare Fig. 9C, detyrosinated microtubules of the cell seen in 9D). Growth cones, however, remained attached, and their gross morphology essentially was unchanged in these experiments (see alsoGonzalez-Agosti and Solomon, 1996). On removal of nocodazole, tyrosinated microtubules rapidly reassembled proximo-distally from the cell body toward the neurites as well as within growth cones. βgc immunolabeling at neuritic tips closely paralleled the reappearance of tyrosinated microtubules within the growth cones (data not shown).
Fig. 9.

The growth cone localization of βgc depends on the integrity of dynamic microtubules. Double-immunofluorescence micrographs show the distribution of detyrosinated (A) and tyrosinated (B) α-tubulin in a detergent-extracted cytoskeletal preparation from a differentiated PC12 cell treated with nocodazole for 30 min. Note the complete disappearance of tyrosinated microtubules. Double-immunofluorescence micrographs also show the distribution of detyrosinated microtubules (C) and βgc (D) in a detergent-extracted cytoskeletal preparation from a differentiated PC12 cell treated with nocodazole for 30 min. Note the retraction of βgc immunolabeling from neurite tips and the presence of immunostaining along neurite shafts. n, Nucleus. Calibration bar, 10 μm.
It is now well established that the organization of microfilaments is altered considerably after microtubule depolymerization (Goslin et al., 1989; DiTella et al., 1994) so that the observed nocodazole-induced redistribution of βgc could be a secondary phenomenon dependent on actin. Therefore, we sought to determine whether βgc distribution was dependent on the integrity of actin filaments. Initially, we compared the patterns of βgc and actin filaments in normal growth cones and then analyzed the distribution of these proteins in cells treated with cytochalasin D. Phalloidin staining of differentiated PC12 cells revealed actin filaments primarily within the peripheral growth cone structures, as expected, and in some cases, in veils and filopodia along neuritic shafts (Fig. 10A). These F-actin-rich peripheral growth cone structures were almost devoid of microtubules (Fig. 10B; cf. Forscher and Smith, 1988; Letourneau and Shattuck, 1989). Comparing the distributions of βgc(Fig. 10D), F-actin (Fig. 10A,C), and tubulin (Fig. 10B) revealed that the βgc staining pattern resembled more closely that of tubulin than that of F-actin (see also Fig. 8A,B). Although both phalloidin and the βgc antiserum stained growth cones prominently, the F-actin-rich structures, the filopodia and lamellipodia, were in a position clearly distal to the region enriched in βgc, with little overlap between them (Fig.10C,D; compare position of arrows). In most cases, F-actin disassembly induced by cytochalasin D (Fig.10E,F) did not alter growth cone morphology and did not result in changes in the distribution of βgcimmunofluorescence in growth cones. However, sometimes the cytochalasin treatment caused the collapse and/or detachment of growth cones and the loss of βgc immunolabeling from neuritic tips.
Fig. 10.

βgc does not colocalize with F-actin. Double-immunofluorescence micrographs show the distribution of F-actin (A) and tyrosinated microtubules (B) in a differentiated PC12 cell. Note that F-actin, visualized by phalloidin staining, is detected primarily in regions distal or peripheral to, and almost devoid of, tyrosinated microtubules. Arrows point at corresponding proximal growth cone structures. Double-immunofluorescence micrographs also show the distribution of F-actin (C) and βgc(D) in a differentiating PC12 cell. Phalloidin and anti-βgc stain the tips of neurites prominently, but F-actin localizes to a position distal to that enriched in βgc. Arrows point at corresponding proximal growth cone structures. n, Nucleus. Finally, double-immunofluorescence micrographs show the distribution of F-actin (E) and βgc (F) in differentiating PC12 cells treated with cytochalasin D for 30 min. Note the complete disappearance of phalloidin staining from neurite tips, whereas βgc immunolabeling remains highly enriched within growth cones (arrowheads). n, Nucleus. Calibration bars, 10 μm.
DISCUSSION
The molecular identity of βgc remains unclear. We have not been able to establish so far whether it is, e.g., the product of a separate gene or the result of a specific post-translational modification of a “conventional” IGF-1 receptor β-subunit. Clear, however, are the distinctive immunochemical properties of βgc (Quiroga et al., 1995).
Our Western blots identified βgc in developing cerebral cortex as a heterogeneous band of 97 kDa, as expected (see Quiroga et al., 1995). The observed heterogeneity of this band most likely is the result of different phosphorylation states of the polypeptide, but differential glycosylation may be involved as well. In PC12 membranes the βgc antibody recognized a larger 105 kDa band. IGF-1-stimulated autophosphorylation of the immunoprecipitated polypeptide identified it as βgc. The higherMr of βgc in PC12 cells, as compared with brain, is consistent with previous studies showing that IGF-1 receptor β-subunits present in cells outside the CNS exhibit a higher apparent molecular weight, a phenomenon resulting apparently from differential glycosylation (Ocrant et al., 1988). That greater glycosylation accounts for the higher Mr of βgc in PC12 cells thus is likely but has not been established.
Spatial and temporal distribution of βgcin development
The previous fractionation studies (Quiroga et al., 1995) demonstrated that βgc immunoreactivity in fetal brain is membrane-associated. Our immunofluorescence analysis of primary neuron cultures presented here shows morphologically that βgc is highly enriched in growth cones, whereas there is little immunoreactivity associated with neuritic shafts. Thequasi-solid staining of neuronal or PC12 growth cones can be explained by the abundance of immunoreactivity in the plasma membrane, combined with the flattened configuration of the growth cone in culture and the staining of intracellular compartments carrying βgc to the distal neurite (see below). Based on the staining pattern in the cell body, i.e., its diffuse distribution excluding the nucleus and the enhanced perinuclear labeling, βgc immunoreactivity in the perikaryon most likely can be attributed to sites of synthesis, especially the Golgi complex (compare with below), rather than plasmalemmal receptors (cells were permeabilized before labeling). During the early phase of differentiation of cultured hippocampal pyramidal cells βgc is present in the growth cones of all types of neurite, including minor processes as well as axons. However, after 2–3 d in culture, when axons have elongated considerably and minor processes begin to differentiate into dendrites, βgcimmunoreactivity becomes redistributed throughout the cell while declining significantly overall. It follows that, in cultured neurons, βgc (unlike synaptophysin, synapsin I, and GAP43;Fletcher et al., 1990) is not targeted specifically to axonal growth cones, and its expression is transient. The former observation is surprising considering the high enrichment of βgc in the growth cone fraction from fetal brain, which is predominantly axonal in origin (Saito et al., 1992; Lohse et al., 1996). However, βgc distribution in the developing neuron may be related to the potential of all processes to differentiate into axons, at least during the early stages (Dotti and Banker, 1987). Conceivably, our observations in culture may reflect the (initial) lack of a mechanism sorting certain types of membrane protein to the axon during the establishment of neuronal polarity (Dotti and Simons, 1990). Finally, the different environmental conditions of the cultured neurons may explain the apparent discrepancy between these findings and those obtained by subcellular fractionation of fetal brain.
Growth cone enrichment of βgc in the brain, in cultured neurons, and in PC12 cells suggests a correlation between neurite outgrowth and βgc expression. Although this correlation is less clear in primary neurons in culture (initial increase followed by decline after the first few days in culture), it holds quantitatively for NGF-stimulated PC12 cells as well as for the developing brain: the βgc polypeptide is abundant during the late fetal and early postnatal days of development when neurite formation is prevalent. [Our more recent data indicate that brain-derived neurotrophic factor (BDNF) also increases βgc expression, concomitant with neurite outgrowth, in primary cultures of hippocampal neurons; studies in progress.] During maturation of the brain and in the adult, expression of the 97 kDa βgc subunit is much reduced. However, a clearly detectable amount of immunoreactivity remains. This may be analogous to the reduced but continued expression in the adult brain of other growth-regulated and growth-cone-enriched proteins, such as GAP43; this phenomenon has been attributed to continued sprouting activity (seePfenninger et al., 1991). The appearance after P13 of a second 90 kDa polypeptide reacting with the βgc antibody is not understood at this time. This polypeptide may be the product of oligodendrocytes, which appear relatively late in development.
Establishment and maintenance of βgc distribution
Our immunofluorescence data on cultures of primary neurons and differentiated PC12 cells indicate that βgc labeling does not stain the very periphery of the growth cone, the microfilament-filled filopodia, and lamellipodia. Instead, labeling is coextensive with the distal ends of dynamic (tyrosinated) microtubules, which stop in the proximal region of the growth cones (Forscher and Smith, 1988). This suggests that βgc may be anchored to these microtubules to maintain its spatial distribution. Indeed, a substantial proportion of βgc (unlike synaptophysin) is resistant to detergent extraction and remains codistributed with the distal regions of tyrosinated microtubules. Furthermore, actin depolymerization has little effect on βgc distribution as long as neurites remain attached; in contrast, depolymerization of dynamic microtubules with nocodazole results in βgc spreading to more proximal segments of neurites, where stable microtubules (detyrosinated or acetylated α-tubulin) are present. Based on these data, βgc falls into a category of proteins, more specifically receptors, capable of interacting directly or indirectly with polymerized tubulin. For example, there are two receptors at the synapse that are linked to microtubules. One of these is the γ-aminobutyric acid receptor A, which seems to interact directly with tubulin (Item and Sieghart, 1994); the other is the glycine receptor, which is linked to microtubules by gephyrin, a putative microtubule-associated protein involved in membrane–cytoskeleton interactions (Prior et al., 1992). The βgc-microtubule association raises the interesting possibility of functional effects of the βgc-containing IGF-1 receptor on the cytoskeleton. One of the proteins that is known to be phosphorylated by activation of the IGF-1 receptor is the microtubule-associated protein-2, MAP2 (Pillion et al., 1992). Therefore, βgc could be positioned at the growth cone to control neurite outgrowth by modulating the phosphorylation status of proteins known to be actively involved in cytoskeletal assembly, such as MAP2 or tau (Cáceres and Kosik, 1990; Cáceres et al., 1992; Harada et al., 1994).
To establish its distal, polarized distribution, βgc must be transported from perikaryal sites of synthesis to the growth cones. Synaptophysin, although not nearly so abundant in axonal growth cones as in synaptic endings (Lohse et al., 1996), is an example of a membrane protein shuttled to, and concentrated in, growth cones. Our micrographs of PC12 cells show very small synaptophysin-positive dots in the vicinity of heavily stained perinuclear regions, consistent with the antigen being sequestered into small (putatively synaptic) vesicles and about to be exported into the growing neurites. When cells are labeled with anti-βgc, one finds in the same region sparser, irregularly sized, and generally larger fluorescent dots. These images are compatible with the presence of a larger and distinct vesicular compartment, presumably also destined for export to growth cones. This is of particular interest because plasmalemmal growth of the developing neurite is known to occur primarily at the growth cone, and the plasmalemmal precursor is believed to be the large, clear, irregularly sized vesicles typically found in growth cones (Pfenninger and Maylié-Pfenninger, 1981; Lockerbie et al., 1991; Pfenninger and Friedman, 1993).
Regulation of βgc expression and functional implications
As discussed already, the expression of βgc-containing IGF-1 receptors is correlated, at least at the early stages, with growth cone formation and neurite outgrowth. Particularly striking, however, is the effect of NGF on the expression of βgc and of β-subunits of other IGF-1 and insulin receptors (βP5, recognized by AbP5) in PC12 cells. Undifferentiated PC12 cells express βP5 almost exclusively, whereas βgc is essentially undetectable with our methods. In contrast, under the influence of NGF βP5expression declines and remains confined to the perikaryon, whereas that of βgc increases several-fold. Furthermore, NGF withdrawal causes not only neurite retraction but also a precipitous drop in βgc levels. It follows that IGF-1 receptors containing βgc are strictly regulated by NGF and thus are a differentiation product of PC12 cells—in contrast to βP5-containing receptors, which seem to be more important for trophic effects in the proliferating cells (they are also abundant in developing brain). The observed differences in regulation and distribution between βgc and βP5 may be particularly significant because the IGF-1 and insulin receptors do not seem to have mainly redundant functions in vivo, despite a high degree of similarity in protein sequence and substrate specificity (Ullrich et al., 1986; Steele-Perkins et al., 1988; Gronborg et al., 1993). The predominant physiological actions of insulin seem to involve glucose, protein, and lipid metabolism. In contrast, IGF-1 seems to function in most cells primarily as a mitogenic peptide and, in the particular case of the developing nervous system, as a neurotrophic factor promoting neurite outgrowth (see introductory remarks). Although the reasons for these functional differences are poorly understood (Le Roith et al., 1992), the contrasting regulations and distributions of βgc-containing IGF-1 versus βP5-containing insulin/IGF-1 receptors may be essential for their apparently different functional roles in the neuron.
Footnotes
This work was supported by grants from Consejo Nacional de Investigaciónes Científicas y Técnicas, Consejo de Investigaciónes de la Provincia de Córdoba, Argentina, and Secretaria de Ciencia y Técnica, Universidad Nacional de Córdoba, Argentina, to A.C. and S.Q., and by National Institutes of Health Grant NS-24672 awarded to K.H.P. We express our gratitude to Drs. R. S. Garofalo and D. Beltramo for providing some of the antibodies used in the present study and to Gray Grether for expert assistance with the completion of this manuscript.
Correspondence should be addressed to Dr. Karl H. Pfenninger, University of Colorado, Health Sciences Center, Department of Cellular and Structural Biology, Box B-111, 4200 East Ninth Avenue, Denver, CO 80262.
REFERENCES
- 1.Aizenman Y, De Vellis J. Brain neurons develop in a serum glial-free environment: effects of insulin, insulin-like growth factor-I, and thyroid hormone on neuronal survival, growth, and differentiation. Brain Res. 1987;406:32–42. doi: 10.1016/0006-8993(87)90766-9. [DOI] [PubMed] [Google Scholar]
- 2.Arregui C, Busciglio J, Cáceres A, Barra H. Tyrosinated and detyrosinated microtubules in axonal processes of cerebellar macroneurons grown in culture. J Neurosci Res. 1991;28:171–181. doi: 10.1002/jnr.490280204. [DOI] [PubMed] [Google Scholar]
- 3.Bearer EL. An actin-associated protein present in the microtubule organizing center and the growth cones of PC12 cells. J Neurosci. 1992;12:750–761. doi: 10.1523/JNEUROSCI.12-03-00750.1992. [DOI] [PMC free article] [PubMed] [Google Scholar]
- 4.Beck KD, Knusel B, Hefti F. The nature of the trophic action of BDNF, des (1–3) IGF-1, and bFGF on mesencephalic dopaminergic neurons developing in culture. Neuroscience. 1993;52:855–866. doi: 10.1016/0306-4522(93)90534-m. [DOI] [PubMed] [Google Scholar]
- 5.Black M, Slaughter T, Fischer I. Microtubule-associated protein 1b (MAP1b) is concentrated in the distal region of growing axons. J Neurosci. 1994;14:857–870. doi: 10.1523/JNEUROSCI.14-02-00857.1994. [DOI] [PMC free article] [PubMed] [Google Scholar]
- 6.Bondy CA. Transient IGF-1 gene expression during the maturation of functionally related central projection neurons. J Neurosci. 1991;11:3442–3455. doi: 10.1523/JNEUROSCI.11-11-03442.1991. [DOI] [PMC free article] [PubMed] [Google Scholar]
- 7.Bottenstein J, Sato G. Growth of a neuroblastoma cell line in a serum-free supplemented medium. Proc Natl Acad Sci USA. 1979;76:514–517. doi: 10.1073/pnas.76.1.514. [DOI] [PMC free article] [PubMed] [Google Scholar]
- 8.Cáceres A, Kosik K. Inhibition of neurite polarity by antisense oligonucleotides in primary cerebellar neurons. Nature. 1990;343:461–463. doi: 10.1038/343461a0. [DOI] [PubMed] [Google Scholar]
- 9.Cáceres A, Banker G, Binder L. Immunocytochemical localization of tubulin and microtubule-associated protein 2 during the development of hippocampal neurons in culture. J Neurosci. 1986;6:714–722. doi: 10.1523/JNEUROSCI.06-03-00714.1986. [DOI] [PMC free article] [PubMed] [Google Scholar]
- 10.Cáceres A, Ferreira A, Busciglio J, Steward O. An immunocytochemical and biochemical study of the microtubule-associated protein 2 during post-lesion dendritic remodeling. Mol Brain Res. 1988;3:233–246. doi: 10.1016/0169-328x(88)90046-0. [DOI] [PubMed] [Google Scholar]
- 11.Cáceres A, Mautino J, Kosik K. Suppression of MAP-2 in cultured cerebellar macroneurons inhibits minor neurite formation. Neuron. 1992;9:607–618. doi: 10.1016/0896-6273(92)90025-9. [DOI] [PubMed] [Google Scholar]
- 12.Caroni P, Grandes P. Nerve sprouting in innervated adult skeletal muscle induced by exposure to elevated levels of insulin-like growth factors. J Cell Biol. 1990;110:1307–1317. doi: 10.1083/jcb.110.4.1307. [DOI] [PMC free article] [PubMed] [Google Scholar]
- 13.Craig A, Banker G. Neuronal polarity. Annu Rev Neurosci. 1994;17:267–310. doi: 10.1146/annurev.ne.17.030194.001411. [DOI] [PubMed] [Google Scholar]
- 14.Daughaday WH, Rotwein P. Insulin-like growth factors I and II: peptide, mRNA and gene structures, serum and tissue concentrations. Endocr Rev. 1989;10:85–100. doi: 10.1210/edrv-10-1-68. [DOI] [PubMed] [Google Scholar]
- 15.DiCiccio-Bloom E, Black LB. Insulin growth factors regulate the mitotic cycle in cultured rat sympathetic neuroblasts. Proc Natl Acad Sci USA. 1988;85:4066–4070. doi: 10.1073/pnas.85.11.4066. [DOI] [PMC free article] [PubMed] [Google Scholar]
- 16.DiTella M, Feiguin F, Morfini G, Cáceres A. A microfilament-associated growth cone component depends upon tau for its intracellular localization. Cell Motil Cytoskeleton. 1994;29:117–130. doi: 10.1002/cm.970290204. [DOI] [PubMed] [Google Scholar]
- 17.DiTella M, Feiguin F, Carri N, Kosik K, Cáceres A. MAP1b/tau functional redundancy during laminin-enhanced axonal growth. J Cell Sci. 1996;109:467–477. doi: 10.1242/jcs.109.2.467. [DOI] [PubMed] [Google Scholar]
- 18.Dotti C, Banker G. Experimentally induced alteration in the polarity of developing neurons. Nature. 1987;330:254–258. doi: 10.1038/330254a0. [DOI] [PubMed] [Google Scholar]
- 19.Dotti C, Simons K. Polarized sorting of viral glycoproteins to the axons and dendrites of hippocampal neurons in culture. Cell. 1990;62:63–72. doi: 10.1016/0092-8674(90)90240-f. [DOI] [PubMed] [Google Scholar]
- 20.Dotti C, Sullivan C, Banker G. The establishment of polarity in hippocampal neurons in culture. J Neurosci. 1988;8:1454–1468. doi: 10.1523/JNEUROSCI.08-04-01454.1988. [DOI] [PMC free article] [PubMed] [Google Scholar]
- 21.Drubin D, Feinstein S, Shooter E, Kirschner M. Nerve growth factor-induced neurite outgrowth in PC12 cells involves the coordinate induction of microtubule assembly and assembly-promoting factors. J Cell Biol. 1985;101:1799–1807. doi: 10.1083/jcb.101.5.1799. [DOI] [PMC free article] [PubMed] [Google Scholar]
- 22.Esmaeli-Azad B, McCarty J, Feinstein SC. Sense and antisense transfection analysis of tau function: tau influences net microtubule assembly, neurite outgrowth, and neuritic stability. J Cell Sci. 1994;107:869–879. doi: 10.1242/jcs.107.4.869. [DOI] [PubMed] [Google Scholar]
- 23.Ferreira A, Cáceres A. The expression of acetylated microtubules during axonal and dendritic growth in cerebellar macroneurons which develop in vitro. Dev Brain Res. 1989;49:205–213. doi: 10.1016/0165-3806(89)90022-9. [DOI] [PubMed] [Google Scholar]
- 24.Fletcher TL, DeCamilli P, Banker G. The distribution of synapsin I and synaptophysin (p38) in hippocampal neurons developing in culture. J Neurosci. 1990;11:1617–1626. doi: 10.1523/JNEUROSCI.11-06-01617.1991. [DOI] [PMC free article] [PubMed] [Google Scholar]
- 25.Forscher P, Smith SJ. Actions of cytochalasins on the organization of actin filaments and microtubules in a neuronal growth cone. J Cell Biol. 1988;107:1505–1516. doi: 10.1083/jcb.107.4.1505. [DOI] [PMC free article] [PubMed] [Google Scholar]
- 26.Froesch ER, Schmid C, Schwander J, Zapf J. Actions of insulin-like growth factors. Annu Rev Physiol. 1985;47:443–467. doi: 10.1146/annurev.ph.47.030185.002303. [DOI] [PubMed] [Google Scholar]
- 27.Garofalo RS, Rosen OM. Insulin and insulin-like growth factor-1 (IGF-1) receptors during central nervous system development: expression of two immunologically distinct IGF-1 receptor β subunits. Mol Cell Biol. 1989;9:2806–2817. doi: 10.1128/mcb.9.7.2806. [DOI] [PMC free article] [PubMed] [Google Scholar]
- 28.Gonzalez-Agosti C, Solomon F. Response of radixin to perturbations of growth cone morphology and motility in chick sympathetic neurons in vitro. Cell Motil Cytoskeleton. 1996;34:122–136. doi: 10.1002/(SICI)1097-0169(1996)34:2<122::AID-CM4>3.0.CO;2-D. [DOI] [PubMed] [Google Scholar]
- 29.Goslin K, Birgbauer E, Banker G, Solomon F. The role of the cytoskeleton in organizing growth cones: a microfilament-associated growth cone component depends upon microtubules for its localization. J Cell Biol. 1989;109:1621–1631. doi: 10.1083/jcb.109.4.1621. [DOI] [PMC free article] [PubMed] [Google Scholar]
- 30.Greene L, Tischler A. Establishment of a noradrenergic clonal line of rat adrenal pheochromocytoma cells which respond to nerve growth factor. Proc Natl Acad Sci USA. 1976;73:2424–2428. doi: 10.1073/pnas.73.7.2424. [DOI] [PMC free article] [PubMed] [Google Scholar]
- 31.Greene L, Aletta J, Rukenstein A, Green S. PC12 pheochromocytoma cells: culture, NGF treatment, and experimental exploitation. Methods Enzymol. 1987;147:207–216. doi: 10.1016/0076-6879(87)47111-5. [DOI] [PubMed] [Google Scholar]
- 32.Gronborg M, Wulff BS, Rasmussen JS, Kjeldsen T, Gammeltoft S. Structure-function relationship of the insulin-like growth factor I receptor tyrosine kinase. J Biol Chem. 1993;268:23435–23440. [PubMed] [Google Scholar]
- 33.Harada A, Oguchi K, Okabe S, Juno J, Terada S, Ohshima T, Sato-Yoshitake R, Takel Y, Noda T, Hirokawa N. Altered microtubule organization in small caliber axons of mice lacking tau protein. Nature. 1994;369:488–491. doi: 10.1038/369488a0. [DOI] [PubMed] [Google Scholar]
- 34.Heidenreich KA, Toledo SP. Insulin receptors mediate growth effects in cultured fetal neurons. I. Rapid stimulation of protein synthesis. Endocrinology. 1989;125:1451–1457. doi: 10.1210/endo-125-3-1451. [DOI] [PubMed] [Google Scholar]
- 35.Ishii DN, Glazner GW, Whalen LR. Regulation of peripheral nerve regeneration by insulin-like growth factors. Ann NY Acad Sci. 1993;692:172–182. doi: 10.1111/j.1749-6632.1993.tb26215.x. [DOI] [PubMed] [Google Scholar]
- 36.Item C, Sieghart W. Binding of gamma-aminobutyric acid (A) receptors to tubulin. J Neurochem. 1994;63:1119–1125. doi: 10.1046/j.1471-4159.1994.63031119.x. [DOI] [PubMed] [Google Scholar]
- 37.Kosik K, Finch E. MAP2 and tau segregate into dendritic and axonal domains after the elaboration of morphologically distinct neurites: an immunocytochemical study of cultured rat cerebrum. J Neurosci. 1987;7:3142–3153. doi: 10.1523/JNEUROSCI.07-10-03142.1987. [DOI] [PMC free article] [PubMed] [Google Scholar]
- 38.Laemmli U. Cleavage of structural proteins during the assembly of the head of the bacteriophage T4. Nature. 1970;227:680–685. doi: 10.1038/227680a0. [DOI] [PubMed] [Google Scholar]
- 39.LeRoith D, Werner H, Faria TN, Kato H, Adamo M, Roberts CT., Jr Insulin-like growth factor receptors. Implications for nervous system function. Ann NY Acad Sci. 1992;692:22–32. doi: 10.1111/j.1749-6632.1993.tb26202.x. [DOI] [PubMed] [Google Scholar]
- 40.Letourneau PC, Shattuck TA. Distribution and possible interaction of actin-associated proteins and cell adhesion molecules of nerve growth cones. Development (Camb) 1989;105:505–519. doi: 10.1242/dev.105.3.505. [DOI] [PubMed] [Google Scholar]
- 41.Liu JP, Baker J, Perkins AS, Robertson EJ, Efstratiadis A. Mice carrying null mutations of the gene encoding insulin-like growth factor-1 (IGF-1) and type 1 IGF receptor (IGF-1R). Cell. 1993;75:59–72. [PubMed] [Google Scholar]
- 42.Lockerbie RO, Miller VE, Pfenninger KH. Regulated plasma-lemmal expansion in nerve growth cones. J Cell Biol. 1991;112:1215–1227. doi: 10.1083/jcb.112.6.1215. [DOI] [PMC free article] [PubMed] [Google Scholar]
- 43.Lohse K, Helmke SM, Wood M, Quiroga S, de la Houssaye B, Miller V, Negre-Aminou P, Pfenninger KH. Axonal origin and purity of growth cones isolated from fetal rat brain. Dev Brain Res. 1996;96:83–96. doi: 10.1016/0165-3806(96)00076-4. [DOI] [PubMed] [Google Scholar]
- 44.Ocrant I, Valentino KL, Eng LF, Hintz RL, Wilson DM, Rosenfeld RG. Structural and immunohistochemical characterization of insulin-like growth factor I and II receptors in the murine central nervous system. Eur J Biochem. 1988;174:521–530. doi: 10.1210/endo-123-2-1023. [DOI] [PubMed] [Google Scholar]
- 45.Pfenninger KH, Friedman LB. Sites of plasmalemmal expansion in growth cones. Dev Brain Res. 1993;71:181–192. doi: 10.1016/0165-3806(93)90170-f. [DOI] [PubMed] [Google Scholar]
- 46.Pfenninger KH, Maylié-Pfenninger MF. Lectin labeling of sprouting neurons II. Relative movement and appearance of glycoconjugates during plasmalemmal expansion. J Cell Biol. 1981;89:547–559. doi: 10.1083/jcb.89.3.547. [DOI] [PMC free article] [PubMed] [Google Scholar]
- 47.Pfenninger KH, de la Houssaye BA, Helmke SM, Quiroga S. Growth-regulated proteins and neuronal plasticity—a commentary. Mol Neurobiol. 1991;5:143–151. doi: 10.1007/BF02935543. [DOI] [PubMed] [Google Scholar]
- 48.Pillion DJ, Kim SJ, Kim H, Meezan E. Insulin signal transduction—the role of protein-phosphorylation. Am J Med Sci. 1992;303:40–52. doi: 10.1097/00000441-199201000-00009. [DOI] [PubMed] [Google Scholar]
- 49.Prior P, Schmitt B, Grenningloh G, Pribilla I. Primary structure and alternative splice variants of gephyrin, a putative glycine receptor tubulin linker protein. Neuron. 1992;8:1161–1170. doi: 10.1016/0896-6273(92)90136-2. [DOI] [PubMed] [Google Scholar]
- 50.Quiroga S, Garofalo RS, Pfenninger KH. Insulin-like growth factor I receptors of fetal brain are enriched in nerve growth cones and contain a β-subunit variant. Proc Natl Acad Sci USA. 1995;92:4309–4312. doi: 10.1073/pnas.92.10.4309. [DOI] [PMC free article] [PubMed] [Google Scholar]
- 51.Rotwein P, Burgess SK, Milbrandt JD, Krause JE. Differential expression of insulin-like growth factor genes in rat central nervous system. Proc Natl Acad Sci USA. 1988;85:265–269. doi: 10.1073/pnas.85.1.265. [DOI] [PMC free article] [PubMed] [Google Scholar]
- 52.Saito S, Fujita T, Komiya Y, Igarashi M. Biochemical characterization of nerve growth cones isolated from both fetal and neonatal rat forebrains—the growth cone particle fraction mainly consists of axonal growth cones in both stages. Dev Brain Res. 1992;65:179–184. doi: 10.1016/0165-3806(92)90177-x. [DOI] [PubMed] [Google Scholar]
- 53.Sara VR, Hall K. Insulin-like growth factors and their binding proteins. Physiol Rev. 1990;70:591–614. doi: 10.1152/physrev.1990.70.3.591. [DOI] [PubMed] [Google Scholar]
- 54.Schwartz MW, Figlewicz DP, Baskin DG, Woods SC, Porte D., Jr Insulin in the brain: a hormonal regulator of energy balance. Endocr Rev. 1992;13:387–414. doi: 10.1210/edrv-13-3-387. [DOI] [PubMed] [Google Scholar]
- 55.Steele-Perkins G, Turner J, Edman JC, Hari J, Pierce SB, Stover C, Rutter WJ, Roth RA. Expression and characterization of a functional human insulin-like growth factor I receptor. J Biol Chem. 1988;263:11486–11492. [PubMed] [Google Scholar]
- 56.Ullrich A, Gray A, Tam AW, Yang-Feng T, Tsubokawa M, Collins C, Henzel W, LeBon T, Kathuria S, Chen E, Jacobs S, Francke U, Ramachandran J, Fujita-Yamaguchi Y. Insulin-like growth factor receptor primary structure: comparison with insulin receptor suggests structural determinants that define functional specificity. EMBO J. 1986;5:2503–2512. doi: 10.1002/j.1460-2075.1986.tb04528.x. [DOI] [PMC free article] [PubMed] [Google Scholar]
- 57.Werner H, Woloschak M, Stannard B, Shenn-Orr Z, Roberts CT, Jr, LeRoith D. The insulin-like growth factor I receptor: molecular biology, heterogeneity and regulation. In: LeRoith D, editor. Insulin-like growth factors: molecular and cellular aspects. CRC; Boca Raton, FL: 1991. pp. 17–47. [Google Scholar]