Abstract
The effort to determine morphological and anatomically defined neuronal characteristics from extracellularly recorded physiological signatures has been attempted with varying success in different brain areas. Recent studies have attempted such classification of cerebellar interneurons (CINs) based on statistical measures of spontaneous activity. Previously, such efforts in different brain areas have used supervised clustering methods based on standard parameterizations of spontaneous interspike interval (ISI) histograms. We worried that this might bias researchers toward positive identification results and decided to take a different approach. We recorded CINs from anesthetized cats. We used unsupervised clustering methods applied to a nonparametric representation of the ISI histograms to identify groups of CINs with similar spontaneous activity and then asked how these groups map onto different cell types. Our approach was a fuzzy C-means clustering algorithm applied to the Kullbach–Leibler distances between ISI histograms. We found that there is, in fact, a natural clustering of the spontaneous activity of CINs into six groups but that there was no relationship between this clustering and the standard morphologically defined cell types. These results proved robust when generalization was tested to completely new datasets, including datasets recorded under different anesthesia conditions and in different laboratories and different species (rats). Our results suggest the importance of an unsupervised approach in categorizing neurons according to their extracellular activity. Indeed, a reexamination of such categorization efforts throughout the brain may be necessary. One important open question is that of functional differences of our six spontaneously defined clusters during actual behavior.
Keywords: cerebellar cortex interneurons, fuzzy C-means clustering, inter-spike interval
Introduction
Despite recent progress in intracellular in vivo methods and optical recordings, extracellular electrophysiological recording of action potentials of individual neurons remains a leading method for relating neural activity to behavior. One notable drawback of this method is that the researcher is left to interpret the activity of the recorded neurons without knowing what sort of neurons they are. For instance, researchers recording neurons in the cerebellar cortex can identify Purkinje cells (PCs) using the complex spike waveforms and the pause in PC simple spikes caused by each complex spike. However, the interneurons of the cerebellar cortex are differentiated on the basis of shape, location, and connectivity into different types—Golgi, granule, basket, stellate, and unipolar brush cells (UBCs)—first described more than a century ago (Sotelo 2008). Understanding the potentially varied functional properties of these neurons would be easier if they could be differentiated during extracellular recording. Recent studies have searched for physiological signatures of those morphological types in the statistical measures of spontaneous activity (Simpson et al., 2005; Holtzman et al., 2006; Van Dijck et al., 2013). This search parallels similar efforts in other brain areas (Parra et al., 1998; Markram et al., 2004).
A key tool in the effort to identify neurons based on extracellular activity is juxtacellular labeling. This method, developed by Pinault (1994, 1996), enables anatomical reconstruction of the extracellularly recorded neurons and has been applied in various brain regions (Wu et al., 2000; Lee et al., 2005; Thankachan and Rusak, 2005). Simpson et al. (2005) first applied juxtacellular labeling to associate spontaneous activity of cerebellar interneurons (CINs) with their morphological type. In 2011, these authors extended this work and proposed an algorithm to identify the type of a CIN from its spontaneous activity (Ruigrok et al., 2011). A different algorithm based on the same technique was proposed by Van Dijck et al. (2013).
Both of these papers make the case that CINs can indeed be classified on the basis of extracellular recordings. However, reported variability in CIN firing patterns (Holtzman et al., 2006) and biochemical properties (Simat et al., 2007) led us to question whether true clusters exist in the spontaneous activity of CINs. To address this, we developed an algorithm for classification of spontaneous neural activity that is not driven by a priori knowledge of classification identity. That is, we set out to determine whether there is a natural clustering of CIN spontaneous activity. We tested how well the algorithm generalizes to different datasets and the extent to which the electrophysiologically defined classification of CINs matched the morphologically defined classification. Although we did find clusters in the spontaneous activity of CINs, our results raise questions about the possibility of determining CIN type from its spontaneous activity.
Materials and Methods
Datasets.
The results in this study are taken from three different datasets. To be clear about which datasets are in use, we list them here and give each an abbreviated name to be used below.
Ruigrok Sim.
This is a collection of randomly generated datasets modeling Ruigrok et al. (2011) based on statistical characterizations of a sample of their data that the authors generously provided for this purpose.
Barmack Labeled.
This is a full dataset of spontaneous neuronal activity and morphological labeling recorded in mice, published previously by Barmack and Yakhnitsa (2008).
Givon Mayo Unlabeled.
This is extracellular, unlabeled spontaneous activity collected in cats.
Simulated data.
Ruigrok Sim was generated based on a sample of statistics of the original data provided to us by Ruigrok and his colleagues. The sample did not include any raw data but only the five features used in the algorithm for 26 CINs from four types: UBCs, molecular layer interneurons (basket or stellate) and Golgi cells (seven from each type), and five granular cells, of which only one fired during the recording. With this limited sample, it was not possible to test directly for deviations from the normal distribution. Instead, we represented each cell class as a multivariate Gaussian fit to data provided. We generated 1000 simulated datasets using the joint normal distributions fit to the means and covariance matrixes of the data sample. Each simulated dataset had the same number of CINs from each type as in the original study. For the granular cells, 80% were simulated as silent cells and the other 20% were simulated using the values of single-firing sample as distribution means and the SDs from Table 1 from the study by Ruigrok et al. (2011).
Table 1.
Ruigrok et al. (2011) identifications on Barmack's data
| Juxtacellular | Algorithm identification |
||||
|---|---|---|---|---|---|
| Granule | UBC | Molecular | Golgi | Borders | |
| Granule | 1 | 1 | 3 | 1 | 5 |
| UBC | 0 | 9 | 1 | 6 | 5 |
| Basket | 0 | 1 | 2 | 1 | 0 |
| Stellate | 1 | 7 | 9 | 4 | 6 |
| Golgi | 0 | 1 | 9 | 4 | 10 |
Mouse recording and juxtacellular labeling.
All data for the dataset Barmack Labeled has been published previously by Barmack and Yakhnitsa (2008), in which the methods are described in full. Thus, we describe the methodology here only briefly. C57BL/6J mice (weighing 16.0–22.0 g) of either sex were anesthetized with intraperitoneal injections of ketamine (60–70 mg/kg) and xylazine (3 mg/kg). Neurons were extracellularly recorded and juxtacellularly labeled using NaCl plus Neurobiotin-filled glass micropipettes (10–15 MΩ) advanced through folia 8 through 10. Neurobiotin ejection driven by positive current pulses led to juxtacellular labeling (Pinault, 1996; Simpson et al., 2005; Holtzman et al., 2006; Barmack and Yakhnitsa, 2008). Spike sorting was done using Spike2 spike shape recognition software. From the dataset of 110 spike trains, we removed all spike trains shorter than 10 s (n = 47) and any cells labeled as PCs (n = 18), leaving 45 spike trains for additional analysis.
Cat recording and PC identification.
The data for the Givon Mayo Unlabeled dataset are described in full detail elsewhere (R. Givon-Mayo, S. Haar, Y. Aminov, E. Simons, and O. Donchin, unpublished observations, http://www.bgu.ac.il/∼donchin/GivonMayo.html). Briefly, we collected data from three healthy cats of either sex (weighing 4.0–6.0 kg) with chronic recording chambers implanted over the medial cerebellum. Spontaneous activity recordings were performed during prolonged anesthesia sessions (2–8 h long), under general anesthesia with propofol (intravenously) or ketamine/xylazine (intramuscularly). The two work on different mechanisms in an effort to control for the effects of anesthesia. Propofol induces a positive modulation of GABA inhibition through GABAA receptors (Trapani et al., 2000), whereas ketamine is a noncompetitive NMDA antagonist (Lahti et al., 2001). We inserted two to four glass coated tungsten microelectrodes (1–2 MΩ, at 1 kHz; Alpha-Omega Engineering) into the forelimb area of the C2 zone. The signal was amplified (10,000×), filtered (300–6000 Hz), digitized at 24 kHz, and stored on disk. Neurons were sorted offline using a principal component analysis (PCA)-based program developed by Maarten Frens and Beerend Winkelman (Erasmus Medical Center, Rotterdam, The Netherlands). We determined the identity of PCs according to the presence of complex spikes and a short pause (∼10 ms) in the simple spike firing after complex spikes (McDevitt et al. 1982). Fifty-two cells were identified as PCs and removed from the analysis, as were spike trains recorded for <80 s. The final dataset consisted of 224 single units identified as CINs recorded for a median of 358 s (maximum of 1080 s). One hundred nineteen CINs recorded from two cats were used as training data in the search for groups in the spontaneous activity and the development of the clustering algorithm. Another 105 CINs, recorded from the third cat, were kept aside as testing data and were not used during the clustering analysis. The testing data was all from one cat to neutralize variability between cats during the testing and to test generalization to a completely new cat.
Statistical measures.
Statistical measures of spontaneous activity were calculated from the interspike intervals (ISIs). The mean, median, SD, coefficient of variation (CV − SD divided by the mean), dispersion (variance divided by the mean), skewness, kurtosis, and median absolute deviation from the median (MAD) were each calculated for each of the following measures: the ISIs (in seconds), the absolute difference between successive ISIs, the natural logarithm of the ISIs (in milliseconds), the instantaneous firing rate (IFR − 1/ISI), the difference between successive IFR, and the natural logarithm of the IFR. All other statistical measures of spontaneous activity suggested by Ruigrok et al. (2011) were also calculated, including average FR, CV2, ISI variation, frequency variation, and the values of the second, fifth, 95th, and 98th percentiles of the ISIs and the difference in successive ISIs. A total of 60 measures were examined.
Spike train analysis.
Most of the statistical measures of spontaneous activity described above are parameterizations of the ISI distribution (the rest characterize the joint distribution of two or three successive ISIs). In addition, we also took a nonparametric approach to the entire ISI distribution. Although other studies in the cerebellum (Simpson et al., 2005; Holtzman et al., 2006) and hippocampus (Parra et al., 1998) have looked at the ISI distributions, we believe we are the first to take a nonparametric (very high dimensional) approach.
We characterized the data in the high-dimensional space defined by the vector of values of the ISI histogram itself. We explored histograms binned at 1–10 ms bins and choose to work with a bin size of 5 ms. This bin width was the largest that accurately reflected the shape of the distribution, but our results do not depend strongly on the bin size chosen. We smoothed the binned histogram using kernel smoothing density estimation with an optimally estimated width based on the MATLAB (R2011b; MathWorks) statistical toolbox (version 7.6) algorithm (Bowman and Azzalini, 1997). This algorithm produced a better fit than any fixed bandwidth. This process produced a discrete estimate of the underlying probability density function (PDF) that generated the ISI distribution. Once each cell was represented by the estimated PDF of its ISIs, we constructed a matrix of the distances between PDFs and searched for the existence of well separated groups in this space. To measure the distance between PDFs, we used two common and accepted information theoretic measures for the difference between two probability distributions: the Kullback–Leibler distance (KLD) and Hellinger distance (Basseville, 1989). We applied this process twice, first on the PDF itself. Later, we constructed a median-normalized PDF (MN-PDF) and applied the process there as well.
The KLD (Kullback and Leibler, 1951) is defined as follows:
 |
The KLD is a nonsymmetric measure [DKL(P||Q) ≠ DKL(Q||P)]. There are a number of symmetrizing versions of the KLD. We used the harmonic mean known as resistor-averaged Kullback–Leibler (RKL) distance (Johnson et al., 2001): . The RKL is less sensitive to outlier states than the KLD (Kang and Sompolinsky, 2001) and from some other symmetrizations.
As an alternative, we used the Hellinger distance (Diaconis and Zabell, 1982). It is defined as follows: .
The RKL and Hellinger distances are not distances in the mathematical sense because they do not obey the triangle inequality. Because standard clustering algorithms work in Euclidian spaces, or at least spaces with a true distance, there was a need to embed our results into a Euclidian space. The method we used was the “any relation clustering algorithm” (ARCA; Corsini et al., 2005). In the ARCA, “each object is represented by the vector of its relation strengths with the other objects in the data” (Corsini et al., 2005), in which the relation can be in any metric. Intuitively, two objects are close to each other if they are far away from the same other objects. The new representation is in Euclidian space, and, thus, any standard clustering algorithm can be used.
Fuzzy C-means clustering.
To test for clusters in the spontaneous activity of CINs, we used an unsupervised approach that requires no assumptions or previous knowledge on the data or the groups. We worked with a fuzzy C-means algorithm based on the classical “unsupervised optimal fuzzy clustering” (UOFC; Gath and Geva, 1989). Briefly, the fuzzy C-means assigns a friendship level to each data point for each cluster according to the distance of the data points from the center of the cluster. Each point was classified into the cluster with which it had the highest friendship. We used the UOFC robust approach for center selection to ensure the independence of the clustering results from the original estimated cluster centers. We tested different cluster validity indices to determine the number of clusters. In each case, we chose the number of clusters that gave the best cluster validity. Basic indices, such as partition coefficient (Bezdek 1981) and classification entropy (Bezdek 1974), and Xie and Beni (1991) failed to show a clear preference for a specific number of clusters on most of our clustering attempts. We used instead a cluster validity index proposed by Zhang et al. (2008) (Vw). This validity index uses a ratio between a variation measure in each cluster and a separation measure between the fuzzy clusters, and it is reported to have very good performance (Zhang et al., 2008). For the parametric data, we used the fuzzy hyper volume (FHV) and partition density (PD) indices of Gath and Geva (1989), as well. However, those indices cannot be used on the nonparametric data because they require the covariance matrix and it was nearly singular in the nonparametric data.
Dimensionality reduction.
Many of the 60 statistical measures of spontaneous activity presented above are correlated variables. Thus, clustering based on these measures was preceded by PCA. PCA was applied to data in which each statistical measure was normalized to be mean 0 and SD of 1 to give equal power to each statistical measure. We used PCA on the nonparametric clustering as well. The distance matrix used in ARCA clustering produces similar sets of distance vectors for cells with similar PDFs, leading to redundancy in the feature space.
PCA revealed that the ARCA data sits on a two-dimensional arc. An arc in the plane defined by the first two principal components suggests that the data are actually one dimensional. To extract this one dimension, we used a sliding spline interpolation of second degree to fit each data point with the nearest point on a single curve defined by the spline. On this smoothed curve, we measured the distances between each pair of neighboring points and created a new vector of points with those distances. This vector is a one-dimensional representation of the data. For verification, we applied a nonlinear PCA (Scholz, 2012) to the same data. It produced almost exactly the same results as did the linear PCA.
F statistics.
To compare between clustering results and quantify the grouping success, we used the traditional F statistic: between-group variability (explained variance) divided by the within-group variability (unexplained variance). The explained variance was calculated as the sum squared of the distances of all group centers from the center of all data, divided by the degrees of freedom (the number of clusters minus one). The unexplained variance was calculated as the sum square of the distances of all data points from its group centers divided by its degrees of freedom (the number of data points minus the number of groups). Because the variances are not from normally distributed data, calculation of a p value from the standard distribution of F might be biased. Instead, we used a Monte Carlo analysis to generate a null distribution for F. A total of 1000 F values were generated using a random clustering applied to our actual dataset. For each repetition, random centers were chosen from a uniform distribution in the range of the data. Each data point was classified to its nearest center, and then the F value of the repetition was calculated. The p value represents the probability of the F value to come from the distribution of the randomly generated F values.
Results
Testing the Ruigrok et al. (2011) algorithm
Juxtacellular labeled data
Using the technique of juxtacellular labeling on the Barmack Labeled database, five morphological types of CINs (granule cells, UBCs, Golgi cells, stellate cells, and basket cells) were identified in the mouse caudal vermis (Barmack and Yakhnitsa 2008). We applied the Ruigrok et al. (2011) algorithm on this dataset, which included 45 labeled CINs, looking for a match between the morphological label and the label of the algorithm. The results, as presented in Table 1, show a very low detection rate of 24% (not significantly better than chance) and an incorrect classification rate of 42%. The remaining 34% fell in the “border area” defined by the algorithm.
Simulated data
Given the results of applying the Ruigrok et al. algorithm on a new dataset, we explored its success rate on a simulated dataset, Ruigrok Sim, which is based on its training data. We applied the Ruigrok et al. algorithm on each of the 1000 simulated data of the simulation. The detection rates were lower than those reported for 70% of simulated datasets [median, 72.1%; interquartile range (IQR), 5.8%], and the incorrect classification values were much higher than the reported 2% for 99.9% simulated datasets (median, 9.3%; IQR, 4.6%). Although the simulated detection rates are a bit lower than those reported by Ruigrok et al., the interesting difference is not there but in the incorrect classification rates, which suggest an over-fit of the algorithm borders to the training data.
The clustering approach
Statistical methods
As an alternative to the Ruigrok et al. algorithm, we developed a clustering algorithm on the Givon Mayo Unlabeled dataset. We began by calculating 60 different statistical measures (see Materials and Methods). As a first attempt, we tried running the UOFC-based clustering on the feature space used in the Ruigrok et al. algorithm (average FR, median ISI, CVlog, CV2, and the fifth percentile of the ISI distribution), as well as on the first four moments of the ISI train (mean, variance, skewness, and kurtosis) and their natural logarithms. None of those feature spaces showed any clear grouping (F(2,116) = 1.15, p = 0.89; F(1,117) = 0.37, p = 0.96; F(3,115) = 1.09, p = 0.98 respectively). Next we used PCA to convert the database of all statistical measures into a set of linearly uncorrelated variables. PCA was performed on the original set of measures (Fig. 1A), on their natural logarithms (Fig. 1B), and on a set composed of the original measures for those with nearly Gaussian tails (skewness <2) and the logarithm of measures with non-Gaussian tails (Fig. 1C). UOFC-based clustering was applied on the first seven principal components of the original set (covering 91% of the variance), the first five principal components of the natural logarithm of the original set (covering 94% of the variance), and the first five principal components of the mixed set (covering 93% of its variance). All showed no clear grouping (F(6,112) = 1.76, p = 0.98; F(4,114) = 2.08, p = 0.18; F(4,114) = 1.88, p = 0.42 respectively. Because there was no consistency between the different cluster validity indices (FHV, PD, Vw), the statistics presented are for the clustering result with the best F statistics.
Figure 1.
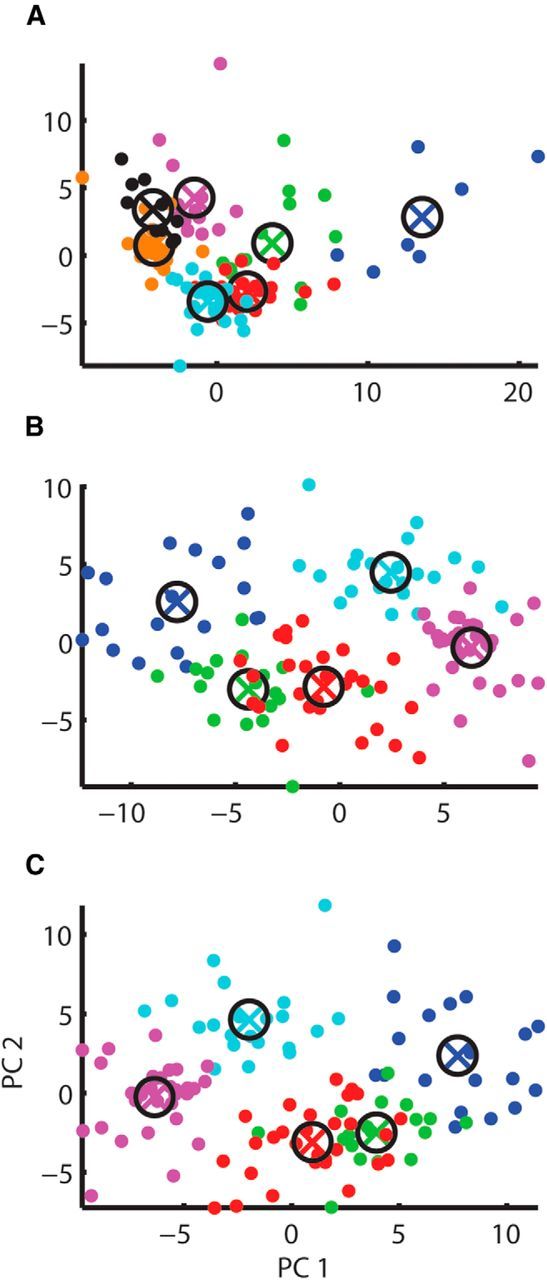
PCA clustering results for parametric data. Clustering results for the PCA of 60 statistical measures calculated for the spontaneous activity of the CINs of cats. Results are shown projected onto the first and second principal components of each analysis. Different colors stands for different clusters. A, Clustering of PCA of the original measures. B, Clustering of PCA of the natural logarithm of the original measures. C, Clustering of PCA of a set containing the original measures (for those measures with nearly Gaussian tails) and the natural logarithm of measures (for measures with non-Gaussian tails).
ISI PDF analysis
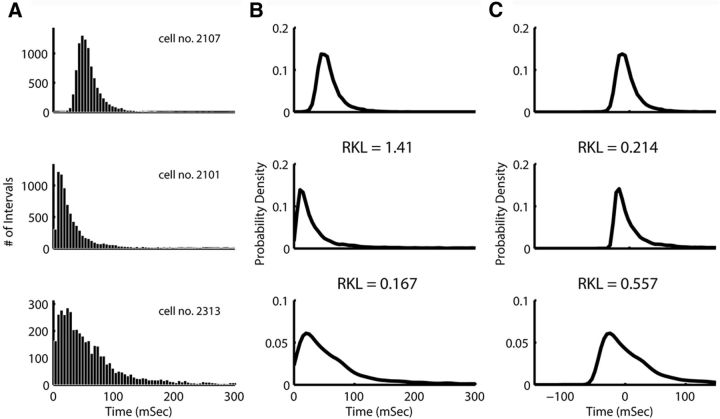
The statistical measures of the ISI trains, which failed to show clear grouping, are measures of the distribution of ISIs. Previous studies in the cerebellum (Simpson et al., 2005; Holtzman et al., 2006) and in the hippocampus (Parra et al., 1998) have looked at the ISI distribution, but none took a nonparametric approach. For that purpose, as described in Materials and Methods, we estimated the PDF that generated each ISI distribution and measured the distance between each pair of PDFs (Fig. 2, A shows sample ISI distributions and B shows their PDFs). Our feature space was the matrix of distances between PDFs, and we applied the UOFC-based clustering algorithm to this matrix. The Vw cluster validity index suggested three groups in this dataset for the RKL metric and two for the Hellinger metric, showing no consistency between the two. This analysis did not show clear grouping for any metric (F(2,116) = 3.41, p = 0.426 and F(1,117) = 4.05, p = 0.046 for the two distance metrics, respectively). The problem with the application of our PDF distance approach on the PDFs of the ISIs was the strong influence of the difference between the centers of the distributions on the distance between the distributions themselves (Fig. 2B). As a result, distributions with close centers but a different shape would be closer than distributions with a similar shape but different centers (Fig. 2B). Thus, the measure of distance does not capture the multidimensional distance between the histograms because it is dominated by the distance between the centers of the distributions. Therefore, we normalized the distributions by subtracting the median ISI from all ISI trains and constructed MN-PDFs. It is important to note that subtracting the median from the ISI distributions does not actually remove this information from the distribution. That is because the median ISI is highly correlated with other features of the shape. For instance, the Spearman's correlation of the median ISI with the MAD ISI measure gives an R of 0.96. Rather, what the MN-PDF does is to better match the dimensions of our nonparametric representation in the analysis (Fig. 2C).
Figure 2.
ISI distribution analysis. A, ISI histograms of three cells, 5 ms bins. B, PDF of those cells ISIs. C, PDF of the median-normalized ISIs (ISI − median ISI); the RKL distance between pairs of PDFs is given between the plots (thus, first RKL is the distance between the 1st and 2nd plot). When distance is taken on the non-normalized PDF, the second cell is much closer to the third than to the first. Using the MN-PDF makes the second cell much closer to the first, which corresponds to our intuition.
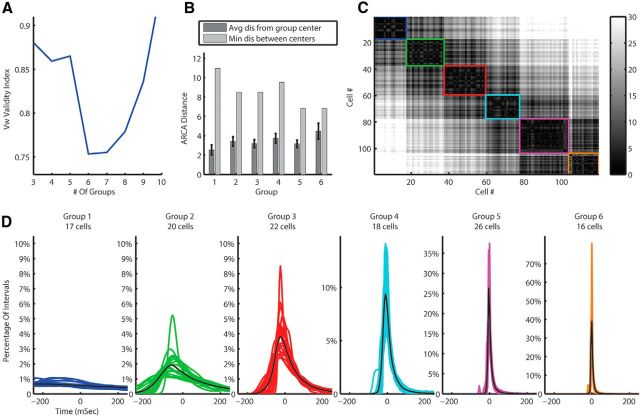
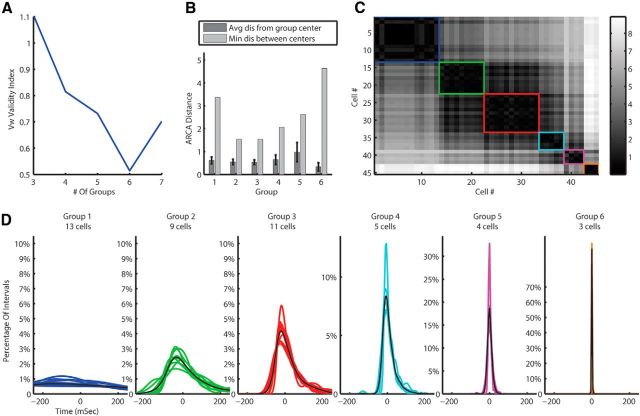
Our new feature space was the matrix of distances between MN-PDFs. We applied the UOFC-based clustering algorithm to this matrix. The Vw cluster validity index suggested six groups in the dataset (Fig. 3A) for both distance metrics, and the F statistics suggested a good separation (F(5,113) = 23.95, p < 0.001 and F(5,113) = 25.56, p < 0.001 for RKL and Hellinger distance metrics, respectively). Figure 3B describes the separation of the clusters by presenting the distances between and within groups. Figure 3C presents the matrix of the Euclidian distances between the ARCA representations of the PDFs, used for the clustering algorithm, ordered by groups. The matrix emphasizes the small distances between cells within group versus the bigger ones between cells from different groups. Figure 3D shows the PDFs of all cells in data color coded by group.
Figure 3.
MN-PDF clustering results for the training data using the RKL metric. A, Vw cluster validity suggest six clusters in the data. B, Separation statistics; the average (with SEM indicated by error bars) distance between MN-PDFs within groups compared with the distance of the group center to the next nearest center. C, The ARCA distances matrix of all cells. Black is zero and white is a large distance. Each group is marked by a square with the same color as in D. D, The MN-PDFs of all cells in the training data divided into groups by the clustering algorithm.
Testing data
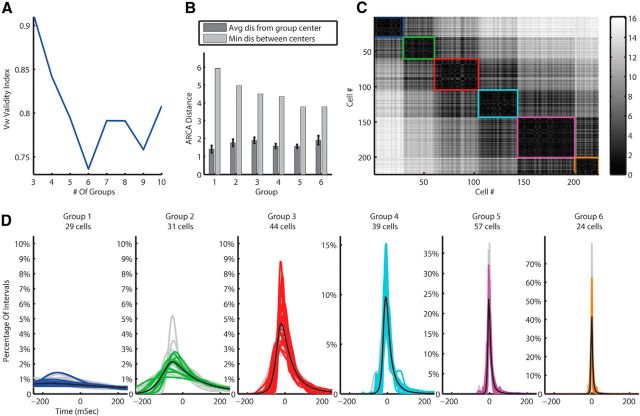
How robust are the six groups we found in the data? To answer this question and confirm that the grouping results are not random, we applied the algorithm to our testing data. The testing dataset includes 105 CINs recorded all from the same cat (to avoid variance between animals). The testing data was not used for the construction of this clustering nor for any adjustments. Only after reaching satisfying clustering results on our training data, set all the parameters, validity indices, etc., and finding the number of clusters to be six and the characteristic of each cluster, we applied the algorithm unchanged to the testing data. We found six clusters in the testing data as well (F(5,99) = 23.24, p < 0.001 and F(5,99) = 25.09, p < 0.001 for RKL and Hellinger distance metrics, respectively). By eye, these six clusters seem very similar to those in the training data (Fig. 4D). Next we applied clustering on the full dataset (training and testing data), and here we received the same six well separated groups (Fig. 4A–D; F(5,218) = 22.66, p < 0.001 and F(5,218) = 24.14, p < 0.001 for RKL and Hellinger distance metrics, respectively). The fact that there are six groups of CINs with separable spontaneous activity may indicate different underlying functional roles. Indeed, differences in spontaneous activity are, by their nature, functional because it is the spontaneous activity that maintains the state of the cerebellar computational network.
Figure 4.
MN-PDF clustering results for all data using the Hellinger metric. A, Vw cluster validity suggest six clusters in the data. B, Separation statistics; the average (with SEM indicated by error bars) distance between MN-PDFs within groups compared with the distance of the group center to the next nearest center. C, The ARCA distances matrix of all cells. Black is zero and white is a large distance. Each group is marked by a square with the same color as in D. D, The MN-PDFs of all cells in the training and testing data divided into groups by the clustering algorithm. The training data are in gray in the background and the testing data in color.
Anesthesia protocol effect
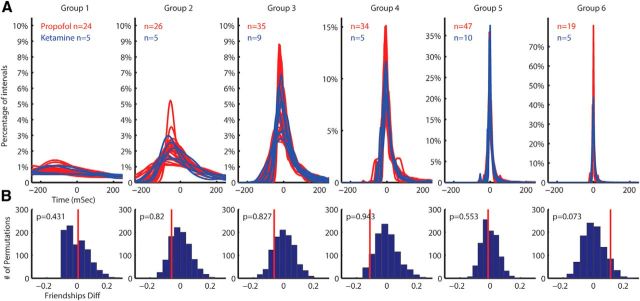
To test for the possible effects of anesthesia on the results, we performed recordings under two different anesthesia protocols: ketamine/xylazine and propofol. The clustering algorithm was applied on the dataset once again, this time separately on the two sets recorded under two different anesthesia protocols. The results (Fig. 5A) show that the same groups exist in the data recorded in both anesthesia protocols, and the cells in both protocols are evenly spread between the groups. To check statistically if the clusters are represented in both drugs equally, we tested whether the friendship levels (see Materials and Methods) of cells recorded under the different drug protocols were affected by the drug type. We took the set of the friendship levels assigned to each neuron and its drug type and created 1000 permutations of the friendship levels to which drug types were randomly reassigned. For each cluster, we then checked the difference between the median friendship levels under the two drugs in the original data compared with the same difference in all permutations (Fig. 5B). This difference was not significantly different from 0 (mean p = 0.6), suggesting no significant difference between the populations.
Figure 5.
Anesthesia effect on the groupings. Distribution of the cells recorded under different anesthesia protocols over the different groups. A, The PDF of the cells colored by their anesthesia protocol. B, Permutation histograms of the differences between the friendships of the cells recorded under different anesthesia protocols show no significant difference. The red line is the difference in the original data.
Cluster properties
To explore the properties of the clusters found, we span the labeled data on each of the 60 statistical measures we defined above and looked for the measures that most strongly relate to the clustering results. The statistical measures look at parameterization of six different distributions, two of which are the ISI distribution and the natural logarithm of the ISIs. Most parameters of those two distributions are highly correlated (by definition) and, as might be expected, some parameters of those distributions are highly correlated to the clusters found by our nonparametric clustering, which was applied on the ISI distribution. Specifically, the mean, median of both distributions, and the MAD of the ISI distribution show very high correlation (r > 0.9). The four other distributions are not derived from the ISI distribution, but some of their parameters do correlate to our clusters from the ISI distribution. The mean, median, and MAD of the distribution of the absolute difference between successive ISIs, as well as the median of the IFR, and the mean and median of natural logarithm of the IFR, all showed very high correlation (r > 0.9) to the clusters. Those distributions describe measures of regularity and randomness of the spike train that cannot be driven from the ISI distribution itself but, interestingly, are described by the clusters driven from the ISI distribution.
Dimensionality reduction
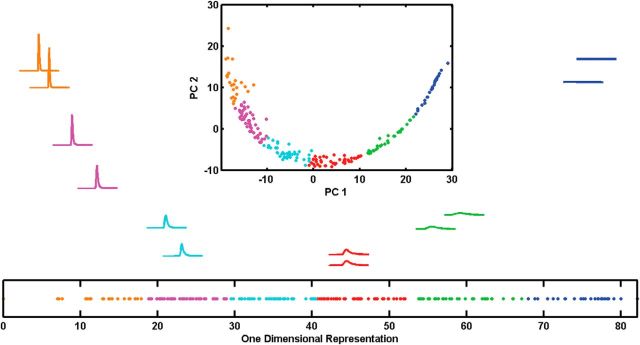
With six clusters and a large number of dimensions, there must be a significant redundancy in the dimensionality of the data. PCA on the distance matrix of the MN-PDFs (see Materials and Methods) produced two components spanning 98.1% of the variance for RKL metric or three components spanning 98.9% of the variance for the Hellinger metric. For both metrics, the span over the first two principal components was an arc (Fig. 6, top insets; for the Hellinger metric, we looked at the span over the first three principal components, which was a one-dimensional curve in three-dimensional space). As described in Materials and Methods, we fit a sliding spline to those curves and extracted the one-dimensional data. The one-dimensional data from using the two different distance measures was nearly identical (Pearson's correlation of r = 0.999).
Figure 6.
MN-PDF dimensional reduction clustering results for RKL metric. Two typical PDFs from each group, one closest to the cluster center and the other with distance from the first equal to the median distance between pairs in the group. Position on the page reflects the first two principle components (x position determined by the 1st PC, y position determined by the 2nd PC). Top insets, The full dataset collected from the cat (training and testing data) presented on the first and second principal components with the same group colors as in Figures 3 and 4. Bottom insets, The same data presented using a one-dimensional representation reflecting arc length along the one-dimensional curve on the top insets. Colors are the same as on the top insets and reflect the original algorithm.
Clustering results into six groups over this single dimension led to the same clustering results as before, both with the RKL (Fig. 6, bottom insets) and with the Hellinger distance metrics (F(5,218) = 44.1, p < 0.005 and F(5,218) = 48.6, p < 0.001 for RKL and Hellinger metrics, respectively). However, in one dimension, the cluster validity index (Zhang et al., 2008) did not produce a clear determination for the number of clusters (Fig. 7A). Nevertheless, looking at the two measures the cluster validity index is constructed from (separation and variation) reveals that, although the variation continues to drop as the number of clusters is increased, the separation measure peaks at six groups (Fig. 7B,C). The one-dimensional clustering allows visualization of the quality of the clustering, a key part of assessing its success. Importantly, dimensionality reduction causes information loss that generally leads to worse classification. Therefore, achieving the same clustering results in this less informative space suggests that those clusters are inherent in the data and not an artifact of the multidimensional representation.
Figure 7.
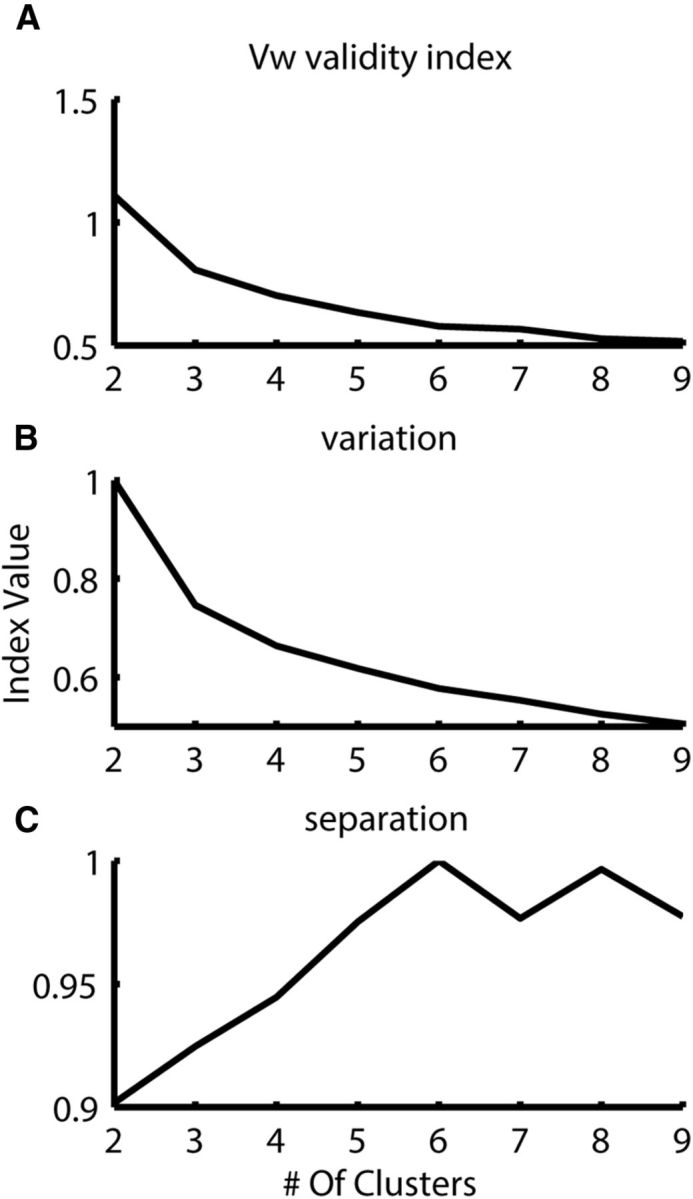
Cluster validity for single-dimensional representation. A, The Vw cluster validity index (Zhang et al., 2008) does not produce a clear determination for the number of clusters when using the one-dimensional representation in Figure 8C. B, The variation continues to drop as the number of clusters is increased. C, The separation measure peaks at six groups.
It was natural to ask whether this one dimension can be constructed from some specific parameterization of the ISI distributions. We found the one-dimensional data to be very highly correlated to the natural logarithm of the median ISI (Pearson's correlation, r = 0.94 for both RKL and Hellinger metrics), which is interesting considering that the ISI trains were normalized by the median ISI. The one-dimensional data was actually best correlated to the natural logarithm of the MAD ISI (r = 0.99 for both metrics), which is very reasonable because MAD ISI is a measure of variance around the median. It was also highly correlated to the logarithm of the median and the MAD of the absolute difference between successive ISIs (Pearson's correlations were r = 0.985 and r = 0.982, respectively, for both metrics). Each of those measures is presumably carrying some noise and, therefore, cannot produce the exact grouping by itself. Our expectation is that this one-dimensional parameter will ultimately reflect some underlying biophysical property of the neuron that has a role in driving firing but that is only loosely correlated with it. This would be consistent with our results.
Morphology of clusters
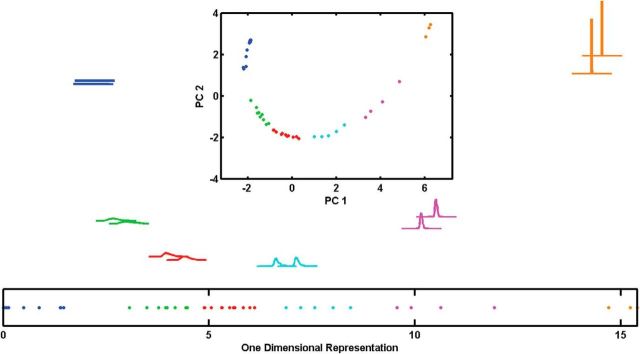
After verifying the robustness of the algorithm and rejecting the possible relation to the anesthesia protocol, we looked for a relation between the clusters of spontaneous activity and the morphological types of the CINs. For that purpose, we returned to the Barmack Labeled dataset and applied the clustering algorithm on it. Although it is a relatively small dataset (only 45 CINs), the clustering algorithm generated the same clustering we had seen on the Givon Mayo Unlabeled dataset. That is, the cluster validity measure Vw suggested six clusters for both metrics (the F statistics suggested a good separation; F(5,39) = 67.31, p < 0.005 and F(5,39) = 48.22, p < 0.001 for RKL and Hellinger distance metrics, respectively), and the results showed about the same clusters as found on the previous two datasets (Fig. 8A–D). Considering the variation between the different species (cats vs mice) and the different laboratories and recording systems (Ben-Gurion University with tungsten microelectrodes vs Oregon Health and Science University with glass micropipettes), the similarity between those clusters is remarkable. Furthermore, the application of the dimensional reduction algorithm on this new dataset produced the same arc shape after the PCA, and, after transforming into a one-dimensional representation of these data, the clustering results on the single dimension remains the same (Fig. 9A–C). The clusters in the one dimension were significantly distinct (F(5,39) = 100.36, p = 0 < 0.01 and F(5,39) = 95.45, p < 0.005 for RKL and Hellinger metrics, respectively).
Figure 8.
MN-PDF clustering results for mice juxtacellular data using the RKL metric. A, Vw cluster validity suggest six clusters in the data. B, Separation statistics; the average (with SEM indicated by error bars) distance between MN-PDFs within groups compared with the distance of the group center to the next nearest center. C, The ARCA distances matrix of all cells. Black is zero and white is a large distance. Each group is marked by a square with the same color as in D. D, The MN-PDFs of all cells in the mice juxtacellular data divided into groups by the clustering algorithm.
Figure 9.
Dimensional reduction clustering results for mice juxtacellular data using RKL metric. Two typical PDFs from each group, one closest to center and the other with a median distance between from the first. Position on the page determined by the first two principal components, as in Figure 6. Top insets, The full mice juxtacellular dataset presented on the first and second principal components with the same group colors as in Figure 8. Bottom insets, The full dataset presented on the one-dimensional representation showing the same clustering results as the original algorithm.
Looking for correlation between clusters of spontaneous activity and the morphological types of the juxtacellular labeled dataset, we found no such correlation. As presented in Table 2, the different morphological CIN types are spread between the spontaneous activity groups. We did not have access to the data to test correlation of the clusters with the morphological types in the Ruigrok Stats database. This difference between morphology and spontaneous activity may be because spontaneous activity is driven to a large extent by cerebellar inputs and depends on details of the input received by the different neurons or it may be the result of spontaneous activity being driven by intrinsic biophysical properties that vary widely across the different morphological types. To what extent the CINs modulate their spontaneous activity differently for different inputs may reveal how spontaneous activity and morphological type interact.
Table 2.
Clustering results of juxtacellular data
| Juxtacellular | Clustering algorithm identification |
|||||
|---|---|---|---|---|---|---|
| 1 | 2 | 3 | 4 | 5 | 6 | |
| Granule | 6 | 2 | 2 | 0 | 0 | 0 |
| UBC | 1 | 3 | 1 | 1 | 2 | 2 |
| Golgi | 2 | 4 | 5 | 2 | 0 | 0 |
| Basket | 0 | 0 | 1 | 0 | 0 | 0 |
| Stellate | 4 | 0 | 2 | 2 | 2 | 1 |
Discussion
We applied an unsupervised approach to the clustering of neurons on the basis of their spontaneous activity. The essential motivation was to improve our confidence in the determination of neuronal type based on electrophysiological signatures, a problem of great interest in the analysis and interpretation of extracellular recordings. However, our study failed to find evidence that the “morphological type” of CINs can be determined from their spontaneous firing pattern. Indeed, although we did find reproducible clusters in the ISI histograms of CIN spontaneous activity, none of these clusters overlapped with morphologically defined cell types.
Our algorithm was based on modern approaches to clustering, including distance measures taken from the KLD between ISI histograms that were then embedded into a high-dimensional Euclidean space (Corsini et al., 2005). Our decision to use a high-dimensional (i.e., nonparametric) approach was made after efforts to cluster on the basis of specific selected features of the spontaneous firing patterns did not produce successful clustering. Of course, any clustering algorithm must be validated against data on which it was not trained. In our case—using a sophisticated algorithm arrived at after significant trial and error—this is particularly true. We reserved nearly half of our data for the purpose of validation and only applied the algorithm to it once every aspect of the algorithm had been determined. No additional manipulation of the algorithm or its parameters was allowed. The six clusters that we found in the original data were also found in this validation data. The clustering was also robust when tested on a new dataset from a different animal, as well as under two different anesthesia protocols and when tested on a separate dataset collected in mice. It is worth mentioning that many physiological factors, including but not at all limited to anesthesia, core temperature, and heart rate, may influence spontaneous activity. Although we controlled for these factors, spontaneous activity may be affected by other factors as well. Thus, the fact that we have seen the same six groups across different preparations, in different laboratories, and in multiple anesthetic protocols seems to transcend at least some physiological factors. It may be that these groups would not be found in some specific physiological conditions.
Thus, we tentatively propose that the six groups of neurons found by our algorithm represent a classification of CINs worthy of additional study, despite the fact that none of them coincided with any morphological group.
This lack of overlap appears inconsistent with the published algorithms that identify morphological type on the basis of spontaneous activity (Ruigrok et al., 2011; Van Dijck et al., 2013), as well as previous reports of consistency in the spontaneous activity (Edgley and Lidierth, 1987; Vos et al., 1999; Simpson et al., 2005; Holtzman et al., 2006; Prsa et al., 2009). Although this may arise because of differences in the species studied, in the precise cerebellar recording locations, or in other aspects of the experimental methodologies, it may also mean that the published algorithms over-fit their data. There are a number of reasons to believe this. First, we are not the only ones. Sultan and Bower (1998) produced similar findings in their effort to classify molecular layer interneurons. Others have reached similar conclusions regarding the relationship between spontaneous activity and neural morphology in other parts of the brain (Markram et al., 2004). Second, it seems the published algorithms do not generalize well. Performance of the Ruigrok et al. (2011) algorithm on mouse CINs was well below their results on their own data. Van Dijck et al. (2013) also tested the Ruigrok et al. algorithm on new data and arrived at similar results [correct classification of 44 of 92 (48%) rat CINs]. Badura et al. (2013) used the Ruigrok et al. algorithm to check the identity of CINs recorded in the molecular layer and found only 64% of those cells to be molecular layer interneurons according to the algorithm. Indeed, even testing on simulated data, drawn to be as close as possible to the training data, still lead to reduced performance. Third, the algorithms are not consistent with each other. A review of the above-cited literature on the consistency of spontaneous activity in different CIN subtypes does not produce any consensus view. Finally, published results indicate great variability in firing within CIN subtypes. Spontaneous activity of Golgi cells is highly variable (Holtzman et al., 2006), possibly the result of the existence of five classes of biochemically distinct subgroups (Simat et al., 2007). CINs of the molecular layer are also known to fall into distinct categories electrophysiologically (fast and slow firing), but each category contains both stellate and basket cells (Jörntell et al., 2010; Ruigrok et al., 2011). In summary, it is possible that the existing efforts to classify based on extracellular spontaneous activity are overambitious.
Of course, it still may be possible to develop an algorithm that does succeed in classifying. That is, perhaps we are not looking at the “right” features of the spontaneous activity, features that would produce a clustering consistent with morphological type. Although our search was rather extensive and included the feature spaces used in all previous studies on this topic, this cannot be ruled out. In any case, if such a classifying feature exists, it is not one that is arrived at intuitively.
Although our results may be disappointing to researchers hoping to be able to make strong claims about the identity of extracellularly recorded interneurons (they were for us), we feel that they represent more than a negative result. First, we hope that the field can now move past the efforts to determine the morphological types of CINs in this way. Second, we believe that the six groups of CINs found consistently by our algorithm could play a key role in understanding the functional roles of CINs. A first effort in this direction is reflected in recent work from our group exploring how pausing and synchronization of CINs is different in the different groups (R. Givon-Mayo, S. Haar, Y. Aminov, E. Simons, and O. Donchin, unpublished observations). Of course, we must still test the extent to which these groups, defined on the basis of spontaneous activity, respond differently during awake behavior. Finally, we think that our work represents a methodological innovation. The effort to identify neurons based on extracellularly recorded spontaneous activity is common in various areas of the brain. Ours is one of the first studies to successfully apply modern techniques of classification and clustering to the study of extracellularly recorded neural activity. Specifically, the use of an unsupervised learning approach allows us to ask which clusters really exist in the activity before we take the next step and try to relate these clusters to identified neuronal types.
Of course, one concern with an approach such as ours is that advanced modern methods, hand-tuned at least somewhat to cerebellar data, may not be applicable in other datasets. We feel that this is unlikely to be a serious problem. First, we think that the essence of our approach should generalize: there is value in examining data as free as possible from assumptions regarding the best parameterization or the clusters that one expects to find. Although changes in things such as quality of data, firing rate, and stability may affect the details of the approach, this essential insight should still hold. Second, although this must be tested empirically, we also believe that the details are likely to generalize. This is because the specific approaches we have chosen (the distance measure, the embedding, the clustering algorithm, and the separation index) are all standard tools in the field of clustering that have been shown to be powerful on a wide variety of datasets. Thus, although hand-tuning may always be necessary, we think our particular technical approach will represent an excellent first attempt for most datasets.
We think that our results should encourage researchers to try similar approaches on their own data. Such techniques could provide insight into the natural groupings of activity of neurons recorded in other areas of the brain. They could prompt a reexamination of existing categorization algorithms in other brain areas, and it is even possible that they could reveal a relationship between neural activity and morphology in other areas in which it has not previously been shown convincingly. As such, we see our contribution not only to the current understanding of CINs but also as a challenge to researchers in all parts of the brain.
Footnotes
We thank Tom Ruigrok, Robert Hensbroek, and John Simpson for sharing data with us. We thank them and also Maarten Frens for helpful discussions about the manuscript. Additionally, we gratefully acknowledge the support of the Lower Saxony/Israel Fund, without whom this research would not have been possible, and Alex Gail, with whom we collaborated on this grant.
The authors declare no competing financial interests.
References
- Badura A, Schonewille M, Voges K, Galliano E, Renier N, Gao Z, Witter L, Hoebeek FE, Chédotal A, De Zeeuw CI. Climbing fiber input shapes reciprocity of Purkinje cell firing. Neuron. 2013;78:700–713. doi: 10.1016/j.neuron.2013.03.018. [DOI] [PubMed] [Google Scholar]
- Barmack NH, Yakhnitsa V. Functions of interneurons in mouse cerebellum. J Neurosci. 2008;28:1140–1152. doi: 10.1523/JNEUROSCI.3942-07.2008. [DOI] [PMC free article] [PubMed] [Google Scholar]
- Basseville M. Distance measures for signal processing and pattern recognition. Signal Process. 1989;18:349–369. doi: 10.1016/0165-1684(89)90079-0. [DOI] [Google Scholar]
- Bezdek JC. Cluster validity with fuzzy sets. J Cybern. 1974;3:58–73. [Google Scholar]
- Bezdek JC. Pattern recognition with fuzzy objective function algorithms. New York: Plenum; 1981. [Google Scholar]
- Bowman AW, Azzalini A. Applied smoothing techniques for data analysis. New York: Oxford UP; 1997. [Google Scholar]
- Corsini P, Lazzerini B, Marcelloni F. A new fuzzy relational clustering algorithm based on the fuzzy C-means algorithm. Soft Computing. 2005;9:439–447. [Google Scholar]
- Diaconis P, Zabell SL. Updating subjective probability. J Am Stat Assoc. 1882;77:822–830. [Google Scholar]
- Edgley SA, Lidierth M. The discharges of cerebellar Golgi cells during locomotion in the cat. J Physiol. 1987;392:315–332. doi: 10.1113/jphysiol.1987.sp016782. [DOI] [PMC free article] [PubMed] [Google Scholar]
- Gath I, Geva A. Unsupervised optimal fuzzy clustering. IEEE Trans Pattern Anal Mach Intell. 1989;11:773–781. [Google Scholar]
- Holtzman T, Rajapaksa T, Mostofi A, Edgley SA. Different responses of rat cerebellar Purkinje cells and Golgi cells evoked by widespread convergent sensory inputs. J Physiol. 2006;574:491–507. doi: 10.1113/jphysiol.2006.108282. [DOI] [PMC free article] [PubMed] [Google Scholar]
- Johnson DH, Gruner CM, Baggerly K, Seshagiri C. Information-theoretic analysis of neural coding. J Comput Neurosci. 2001;10:47–69. doi: 10.1023/a:1008968010214. [DOI] [PubMed] [Google Scholar]
- Jörntell H, Bengtsson F, Schonewille M, De Zeeuw CI. Cerebellar molecular layer interneurons—computational properties and roles in learning. Trends Neurosci. 2010;33:524–532. doi: 10.1016/j.tins.2010.08.004. [DOI] [PubMed] [Google Scholar]
- Kang K, Sompolinsky H. Mutual information of population codes and distance measures in probability space. Phys Rev Lett. 2001;86:4958–4961. doi: 10.1103/PhysRevLett.86.4958. [DOI] [PubMed] [Google Scholar]
- Kullback S, Leibler RA. On information and sufficiency. Ann Math Stat. 1951;22:79–86. [Google Scholar]
- Lahti AC, Weiler MA, Tamara Michaelidis BA, Parwani A, Tamminga CA. Effects of ketamine in normal and schizophrenic volunteers. Neuropsychopharmacology. 2001;25:455–467. doi: 10.1016/S0893-133X(01)00243-3. [DOI] [PubMed] [Google Scholar]
- Lee MG, Hassani OK, Alonso A, Jones BE. Cholinergic basal forebrain neurons burst with theta during waking and paradoxical sleep. J Neurosci. 2005;25:4365–4369. doi: 10.1523/JNEUROSCI.0178-05.2005. [DOI] [PMC free article] [PubMed] [Google Scholar]
- Markram H, Toledo-Rodriguez M, Wang Y, Gupta A, Silberberg G, Wu C. Interneurons of the neocortical inhibitory system. Nat Rev Neurosci. 2004;5:793–807. doi: 10.1038/nrn1519. [DOI] [PubMed] [Google Scholar]
- McDevitt CJ, Ebner TJ, Bloedel JR. The changes in Purkinje cell simple spike activity following spontaneous climbing fiber inputs. Brain Res. 1982;237:484–491. doi: 10.1016/0006-8993(82)90460-7. [DOI] [PubMed] [Google Scholar]
- Parra P, Gulyás AI, Miles R. How many subtypes of inhibitory cells in the hippocampus? Neuron. 1998;20:983–993. doi: 10.1016/S0896-6273(00)80479-1. [DOI] [PubMed] [Google Scholar]
- Pinault D. Golgi-like labeling of a single neuron recorded extracellularly. Neurosci Lett. 1994;170:255–260. doi: 10.1016/0304-3940(94)90332-8. [DOI] [PubMed] [Google Scholar]
- Pinault D. A novel single-cell staining procedure performed in vivo under electrophysiological control: morpho-functional features of juxtacellularly labeled thalamic cells and other central neurons with biocytin or neurobiotin. J Neurosci Methods. 1996;65:113–136. doi: 10.1016/0165-0270(95)00144-1. [DOI] [PubMed] [Google Scholar]
- Prsa M, Dash S, Catz N, Dicke PW, Thier P. Characteristics of responses of Golgi cells and mossy fibers to eye saccades and saccadic adaptation recorded from the posterior vermis of the cerebellum. J Neurosci. 2009;29:250–262. doi: 10.1523/JNEUROSCI.4791-08.2009. [DOI] [PMC free article] [PubMed] [Google Scholar]
- Ruigrok TJ, Hensbroek RA, Simpson JI. Spontaneous activity signatures of morphologically identified interneurons in the vestibulocerebellum. J Neurosci. 2011;31:712–724. doi: 10.1523/JNEUROSCI.1959-10.2011. [DOI] [PMC free article] [PubMed] [Google Scholar]
- Scholz M. Validation of nonlinear PCA. Neural Process Lett. 2012;36:21–30. [Google Scholar]
- Simat M, Parpan F, Fritschy JM. Heterogeneity of glycinergic and gabaergic interneurons in the granule cell layer of mouse cerebellum. J Comp Neurol. 2007;500:71–83. doi: 10.1002/cne.21142. [DOI] [PubMed] [Google Scholar]
- Simpson JI, Hulscher HC, Sabel-Goedknegt E, Ruigrok TJ. Between in and out: linking morphology and physiology of cerebellar cortical interneurons. Prog Brain Res. 2005;148:329–340. doi: 10.1016/S0079-6123(04)48026-1. [DOI] [PubMed] [Google Scholar]
- Sotelo C. Viewing the cerebellum through the eyes of Ramon y Cajal. Cerebellum. 2008;7:517–522. doi: 10.1007/s12311-008-0078-0. [DOI] [PubMed] [Google Scholar]
- Sultan F, Bower JM. Quantitative Golgi study of the rat Cerebellar molecular layer interneurons using principal component analysis. J Comp Neurol. 1998;393:353–373. doi: 10.1002/(SICI)1096-9861(19980413)393:3<353::AID-CNE7>3.0.CO;2-0. [DOI] [PubMed] [Google Scholar]
- Thankachan S, Rusak B. Juxtacellular recording/labeling analysis of physiological and anatomical characteristics of rat intergeniculate leaflet neurons. J Neurosci. 2005;25:9195–9204. doi: 10.1523/JNEUROSCI.2672-05.2005. [DOI] [PMC free article] [PubMed] [Google Scholar]
- Trapani G, Altomare C, Liso G, Sanna E, Biggio G. Propofol in anesthesia. Mechanism of action, structure-activity relationships, and drug delivery. Curr Med Chem. 2000;7:249–271. doi: 10.2174/0929867003375335. [DOI] [PubMed] [Google Scholar]
- Van Dijck G, Van Hulle MM, Heiney SA, Blazquez PM, Meng H, Angelaki DE, Arenz A, Margrie TW, Mostofi A, Edgley S, Bengtsson F, Ekerot CF, Jörntell H, Dalley JW, Holtzman T. Probabilistic identification of cerebellar cortical neurones across Species. PLoS One. 2013;8:e57669. doi: 10.1371/journal.pone.0057669. [DOI] [PMC free article] [PubMed] [Google Scholar]
- Vos BP, Maex R, Volny-Luraghi A, De Schutter E. Parallel fibers synchronize spontaneous activity in cerebellar Golgi cells. J Neurosci. 1999;19:RC6. doi: 10.1523/JNEUROSCI.19-11-j0003.1999. (1–5) [DOI] [PMC free article] [PubMed] [Google Scholar]
- Wu Y, Richard S, Parent A. The organization of the striatal output system: a single-cell juxtacellular labeling study in the rat. Neurosci Res. 2000;38:49–62. doi: 10.1016/S0168-0102(00)00140-1. [DOI] [PubMed] [Google Scholar]
- Xie XL, Beni G. A validity measure for fuzzy clustering. IEEE Trans Pattern Anal Machine Intell. 1991;13:841–847. doi: 10.1109/34.85677. [DOI] [Google Scholar]
- Zhang Y, Wang W, Zhang X, Li Y. A cluster validity index for fuzzy clustering. Inform Sci. 2008;178:1205–1218. doi: 10.1016/j.ins.2007.10.004. [DOI] [Google Scholar]


