Abstract
Polypyrimidine tract-binding proteins (PTBPs) are RNA binding proteins that regulate a number of posttranscriptional events. Human PTBP1 transits between the nucleus and cytoplasm and is thought to regulate RNA processes in both. However, information about PTBP1 mRNA isoforms and regulation of PTPB1 expression remains incomplete. Here we mapped the major PTBP1 mRNA isoforms in HEK293T cells and identified alternative 5′ and 3′ untranslated regions (5′-UTRs, 3′-UTRs), as well as alternative splicing patterns in the protein coding region. We also assessed how the observed PTBP1 mRNA isoforms contribute to PTBP1 expression in different phases of the cell cycle. Previously, PTBP1 mRNAs were shown to crosslink to eukaryotic translation initiation factor 3 (eIF3). We find that eIF3 binds differently to each PTBP1 mRNA isoform in a cell cycle dependent manner. We also observe a strong correlation between eIF3 binding to PTBP1 mRNAs and repression of PTBP1 levels during the S phase of the cell cycle. Our results provide evidence of translational regulation of PTBP1 protein levels during the cell cycle, which may affect downstream regulation of alternative splicing and translation mediated by PTBP1 protein isoforms.
Keywords: mRNA isoform, 3′-UTR, 5′-UTR, alternative splicing, translation regulation
INTRODUCTION
PTBP1 was first discovered as a purified protein that bound to polypyrimidine tract regions of introns (Garcia-Blanco et al. 1989). Initially, PTBP1 was thought to be part of the splicing machinery, until U2AF65 was discovered as the splicing factor responsible for recognizing the poly(U) tracts at the 3′ splice site during the assembly of the spliceosome (Gil et al. 1991). PTBP1 has since been shown to regulate alternative exon selection during mRNA processing by repressing exon inclusion (Xue et al. 2009). Although PTBP1 acts as an alternative splicing (AS) factor in the nucleus, it also shuttles between the nucleus and cytoplasm. When PTBP1 is present in the cytoplasm, it is thought to be involved in posttranscriptional regulation, processes that require cap- independent translational control, RNA localization or changes in mRNA stability (Kamath et al. 2001; Romanelli et al. 2013). In addition to its role in molecular processes including splicing, polyadenylation, translation initiation, and mRNA stability, PTBP1 has recently been linked to the regulation of the cell cycle (Monzón-Casanova et al. 2018).
PTBP1 is a 57 kDa protein comprised of four RNA recognition motifs (RRMs) with a bipartite nuclear localization domain (NLD) and a nuclear export signal (NES) at the amino terminus of the protein (Pérez et al. 1997; Wollerton et al. 2001; Li and Yen 2002). The expression of PTBP1 is tightly regulated through alternative splicing events (Wollerton et al. 2004). Its 15 exons have previously been shown to be alternatively spliced into three major mRNA isoforms, termed PTBP1-1, PTBP1-2, and PTBP1-4. The first described isoform, PTBP1-1 encodes a protein of 521 amino acids containing all four RRMs. The alternatively spliced isoforms, PTBP1-2 and PTBP1-4, encode an additional 19 or 26 amino acids, respectively, between the RRM2 and RRM3 domains derived from exon 9 inclusion (Garcia-Blanco et al. 1989; Valcárcel and Gebauer 1997; Sawicka et al. 2008; Romanelli et al. 2013). Despite being very similar, the different isoforms have distinct roles in splicing and internal ribosome entry site (IRES)-mediated initiation of translation. The absence or length of the unstructured region between RRM2 and RRM3 results in differential recognition of target RNAs. These functional differences coupled with differing PTBP1 isoform ratios in different cell lines suggests that changes in relative PTBP1 isoform expression levels may be a cellular determinant of alternative splicing events (Wollerton et al. 2001; Gueroussov et al. 2015). For example, in the case of tropomyosin alternative splicing, PTBP1-4 represses exon 3 inclusion more than PTBP1-1 both in vivo and in vitro, whereas PTBP1-2 harbors intermediate activity (Wollerton et al. 2001). Additionally, differences in exon 9 skipping in PTBP1 mRNAs have been found to affect the levels of many additional alternative splicing (AS) events, likely modulating the timing of transitions in the production of neural progenitors and mature neurons so as to affect brain morphology and complexity (Gueroussov et al. 2015).
In eukaryotic mRNAs, the 5′ and 3′ untranslated regions (5′- and 3′-UTRs) serve as major cis-regulatory control elements. RNA sequences and structures in the 5′-UTR and 3′-UTR can act as binding sites for translation initiation factors and other RNA binding proteins to influence the translational output of an mRNA and its lifetime in the cell (Hinnebusch et al. 2016). To date, how the alternatively spliced isoforms of PTBP1 are connected to different 5′-UTRs and 3′-UTRs in PTBP1 mRNA has not been determined. Several annotation databases, such as ENSEMBL (Ensembl Release 94) (Zerbino et al. 2018), FANTOM5 (Riken Center for Integrative Medical Sciences [IMS]) (Noguchi et al. 2017), and NCBI Gene (O'Leary et al. 2015), have information on PTBP1 isoforms. However, the information on UTRs differs across these databases. In ENSEMBL, the three main isoforms have distinct 5′-UTRs and a common 3′-UTR. In the NCBI Gene (refseq) database, PTBP1 has common 5′ and 3′-UTRs. The FANTOM5 database (The FANTOM Consortium and the RIKEN PMI and CLST [DGT] 2014) only accounts for two distinct 5′-UTRs for PTBP1 and a common 3′-UTR. Finally, the APASdb database for polyadenylation signals (You et al. 2015) reports two major polyadenylation sites within the PTBP1 3′-UTR. These libraries need to be reconciled into a comprehensive model of PTBP1 transcript isoforms allowing further biochemical analysis of the regulatory pathways that influence PTBP1 mRNA isoform production and translation.
To better understand the regulation of PTBP1 mRNA isoform levels in the cell, we mapped the major PTBP1 mRNA variants present in mammalian HEK293T cells. We analyzed the 5′-UTR elements using 5′-RACE (RLM-RACE) and long-read sequencing (Oxford Nanopore). We also mapped the 3′-UTRs and open reading frames. Using western blots and mRNA reporters, we determined how the PTBP1 mRNA isoforms are translated in different stages of the cell cycle. Previous evidence revealed that human translation initiation factor eIF3, the largest translation initiation factor, crosslinks to the 5′-UTR elements of several messenger RNAs, including PTBP1. While bound to mRNAs, eIF3 acts to either activate or repress their translation (Lee et al. 2015). For this reason, we also probed eIF3 interactions with PTBP1 mRNAs to determine whether eIF3 may act as a trans-acting factor regulating PTBP1 isoform translation.
RESULTS
Endogenous levels of PTBP1
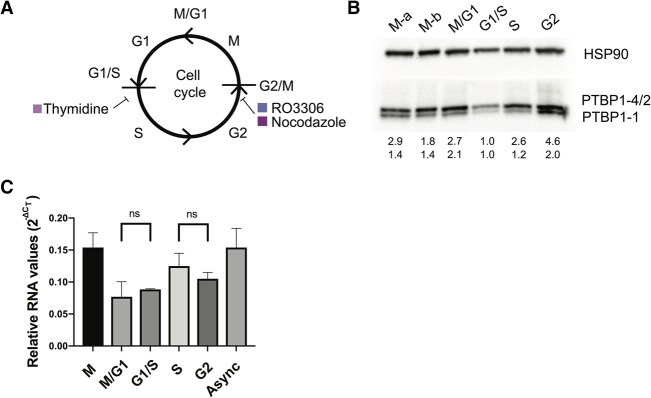
Since PTBP1 has been implicated in regulating numerous processes including the cell cycle, we analyzed the endogenous levels of PTBP1 in HEK293T cells harvested in different stages of the cell cycle (Fig. 1A). We observed that PTBP1 isoforms vary dramatically during cell cycle progression. Cells harvested during the G2 or M phases had the highest levels of all three isoforms (PTBP1-1, PTBP1-2, PTBP1-4, Fig. 1B), with the upper band, comprising PTBP1-2 and PTBP1-4 (Wollerton et al. 2001), having a higher expression profile than PTBP1-1 regardless of cell cycle phase. All three isoforms exist at low levels during G1, and increase slightly during S, before a larger burst during G2/M occurs. Notably, PTBP1 mRNA levels do not fluctuate as much as protein levels in the different stages of the cell cycle (Fig. 1C). Although we did not separate the contributions of translation and protein degradation, these results indicate that posttranscriptional regulation of PTBP1 expression occurs as a function of the cell cycle.
FIGURE 1.
PTBP1 expression changes across the cell cycle. (A) Chemical inhibitors used to arrest cells at specific phases of the cell cycle: thymidine, arrest at G1/S, and RO3306 or Nocodazole, arrest at G2/M transitions. Cells were synchronized and collected at time points after release from the drugs. (B) Representative western blot of whole cell lysates of synchronized HEK293T cells prepared using synchronized samples. Separate methods to arrest G2/M were used. M-a and M-b samples were synchronized with the use of RO3306 and Nocodazole, respectively. PTBP1-2 and PTBP1-4 protein isoforms have similar sizes and comigrate in the gel. Below the gel are shown the amounts of the PTBP1 isoforms relative to that in G1/S phase, normalized to HSP90 levels. (C) Amounts of total PTBP1 mRNA were assessed using quantitative PCR for each phase of the cell cycle. ΔCT values normalized to ACTB mRNA levels. ns, not statistically significant; P-values >0.2. Experiments were carried out in biological triplicate, with standard deviations shown. Async, proliferating cells without synchronization.
Mapping the 5′-UTR, CDS, and 3′-UTR sequences in PTBP1 mRNAs
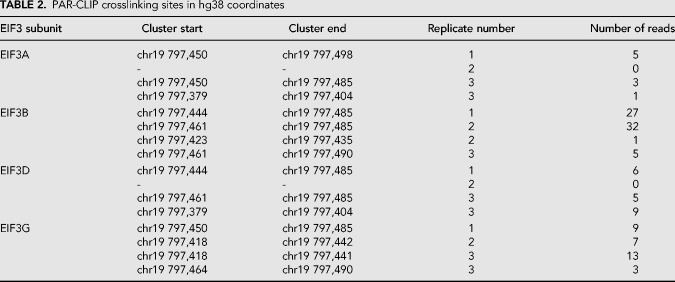
To test whether PTBP1 transcript isoform sequences in the ENSEMBL database are in agreement with the transcription start sites (TSS) in FANTOM5, we used RNA Ligase Mediated Rapid Amplification of cDNA Ends (RLM-RACE) and Nanopore sequencing of mRNAs extracted from HEK293T cells to map PTBP1 transcripts (Fig. 2). Although both TSS in the FANTOM5 database were confirmed by RLM-RACE, we could not verify the presence of the 5′-UTR for ENSEMBL transcript ENST00000356948.10. Notably, our RLM-RACE data supports a different TSS for ENSEMBL transcript ENST00000349038.8, 7 nucleotides (nts) 5′ of the annotated TSS, in agreement with the TSS mapped in the FANTOM5 database (Fig. 2C,D). The longer TSS for this transcript is also in agreement with the fact that eIF3 crosslinks to nucleotides 5′ of the ENSEMBL-annotated TSS (Fig. 2B,D).
FIGURE 2.
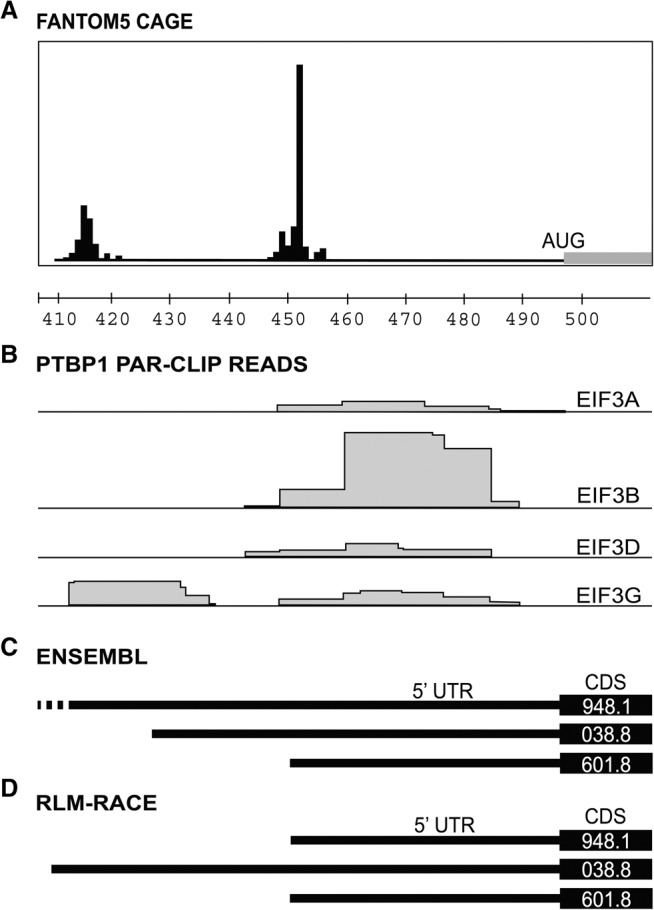
Database and experimental mapping of the three major transcript isoforms of PTBP1 mRNA. (A) Transcription start sites (TSS) determined by CAGE mapping in the FANTOM5 database (Riken Center for Integrative Medical Sciences [IMS]) (Noguchi et al. 2017), along with hg38 chromosome location, showing the last three digits of the chromosomal coordinates for the PTBP1 gene. (B) Sites of PTBP1 mRNA interaction with eIF3 mapped by photoactivatable RNA crosslinking and immunoprecipitation (PAR-CLIP) (Lee et al. 2015), by eIF3 subunit, indicated to the right. Coordinates of clusters are given in Table 2. (C) Annotated Ensembl transcripts for PTBP1, including the 5′-UTR and the beginning of the CDS, as indicated by the last four digits of the Ensembl tag (i.e., ENST0000****). (D) Experimentally determined 5′-UTR elements in PTBP1 mRNAs determined by RLM-RACE. In all panels, the transcripts are vertically aligned with the chromosomal coordinates in panel A.
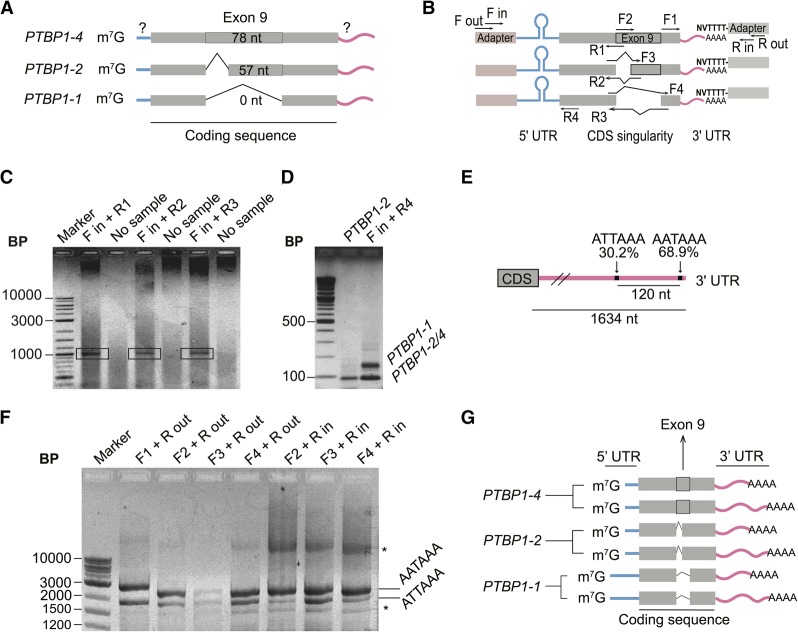
PTBP1 has three major protein isoforms that only differ with respect to exon 9 inclusion. PTBP1-1 lacks exon 9 completely, PTBP1-2 includes only part of exon 9 and PTBP1-4 contains the full sequence coding for exon 9 (Fig. 3A). Although differences in exon properties have been implicated in the different biological roles of PTBP1, the connectivity between the different CDS variants and the mRNA 5′-UTR and 3′-UTR ends is not known. To map the 5′-UTRs for each predicted CDS in the PTBP1 transcript isoforms, we used a variation of the RLM-RACE methodology (Fig. 3B). For each PTBP1 exon 9 isoform, we observed a single species by RLM-RACE, indicating one major form of 5′-UTR for each CDS variant (Fig. 3C). This was confirmed by a second reaction in which we used a common inner primer to the 5′ adaptor and reverse primer to the common CDS region upstream of exon 9 (Fig. 3B, primers Fin and R4) to assess the amount of different PTBP1 5′-UTRs in the samples (Fig. 3D), which revealed two major 5′-UTR species. After sequencing the reactions in Figure 3C individually we were able to determine the exact sequence of each transcript up to the cap region. Isoform PTBP1-1, which lacks the exon 9 sequence, extends to the 5′ end of the long 5′-UTR, matching the upstream TSS mapped in FANTOM5 (Fig. 2A) and the RLM-RACE experiment described above (Fig. 2D). In contrast, isoforms PTBP1-2 and PTBP1-4, which encode the truncated or full exon 9, respectively, each have the short 5′-UTR, with the downstream TSS mapped in FANTOM5 (Figs. 2A,D, 3A).
FIGURE 3.
Mapping of the UTR elements of PTBP1 mRNAs. (A) Scheme of the composition of the 5′-UTR of PTBP1 transcripts according to the coding sequence content, with question marks indicating the regions to be mapped. (B) Design of RLM-RACE experiments performed to determine the relationship between 3′-UTR elements, exon 9 boundaries, and 5′-UTR elements in PTBP1 mRNAs. (C) Agarose gel of final PCR reaction for the 5′-UTR RLM-RACE. Bands in the black rectangles were extracted for sequencing. (D) Agarose gel showing the presence of two known and mapped 5′-UTR lengths during RLM-RACE, using primers that anneal to all three PTBP1 isoforms. PTBP1-2 sequence was used as a control. (E) Representation showing high usage polyadenylation sites on PTBP1 mRNA 3′-UTR (not to scale). Data from You et al. (2015). (F) Agarose gel of PCR reactions following RLM-RACE to identify the polyadenylation sites of PTBP1 transcript isoforms. (*) Unidentified bands that only appear after second round of PCR. (G) Model for major PTBP1 transcript isoforms in HEK293T cells based on experimental observations. Blue bars, evidence for the existence of two lengths of the 5′-UTR; pink bars, evidence that each transcript has at least two alternative polyadenylation sites, resulting in a long or short 3′-UTR. Gray thick bar represents the alternatively spliced isoforms involving exon 9.
We also determined the 3′-UTR sequences of PTBP1 transcript isoforms in HEK239T cells. The APASdb database (You et al. 2015), which contains precise maps and usage quantification of different polyadenylation sites, contains two major polyadenylation sites for PTBP1 (Fig. 3E). We used this information to design specific primers to determine the presence of each poly(A) site in total RNA extracted from HEK293T cells. By using a forward primer that recognizes the splice junction specific to each transcript upstream of exon 9, we could determine the 3′-UTR length of each isoform by using a reverse primer on a poly(A) adapter (Fig. 3B). The resulting amplification pattern could be visualized by agarose gel (Fig. 3F) and then by sequencing. Using this amplification strategy, we observed all three PTBP1 exon 9 isoforms predicted in the ENSEMBL database to have two different lengths of 3′-UTR resulting from the predicted poly(A) sites in the APASdb database (Fig. 3E,F), and possibly a third. Taken together, the present experiments define six PTBP1 transcript isoforms in HEK293T cells (Fig. 3G).
PTBP1 5′-UTR and 3′-UTR contributions to translation regulation
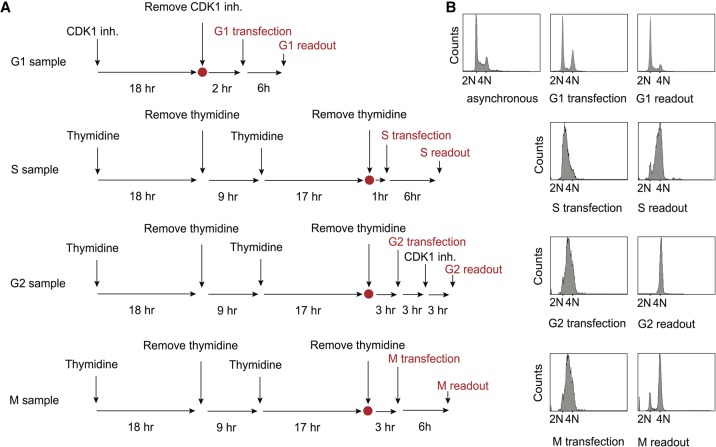
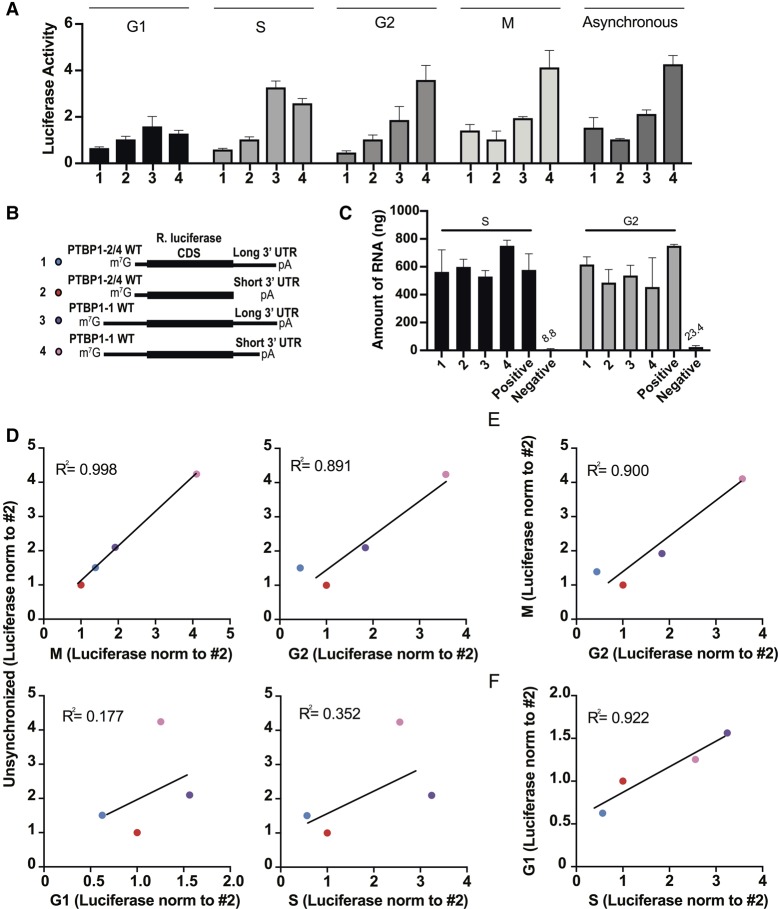
In order to assess whether the differences in PTBP1 expression through the cell cycle are related to the 5′-UTRs and 3′-UTRs in PTBP1 mRNAs, we used Renilla luciferase reporter mRNAs with the different PTBP1 5′-UTR and 3′-UTR elements in cell based assays. Using transfections of reporter mRNAs, we first assessed the relative translation levels of each reporter with respect to the cell cycle (Figs. 4, 5). We used 6 h transfections, as previous results have indicated that these early time points are in the linear range for mRNA transfections (Bert 2006). We determined that the mRNA was not degraded during the 6 h of the experiment (Fig. 5C). During the G2 and M phases of the cell cycle, the reporter transcript with the long PTBP1 5′-UTR and short PTBP1 3′-UTR (Fig. 4A) had the highest translation efficiency (Fig. 5). During the G1 and S phases of the cell cycle, the reporter transcript with the long PTBP1 5′-UTR and the long PTBP1 3′-UTR had higher translation efficiency (Fig. 5). Although these experiments are not normalized across cell cycle phases, due to the fact each experiment was carried out separately, we found the experiments synchronized in the G2 and M phases correlated well with unsynchronized cells (Fig. 5D). Furthermore, translation of the reporter mRNAs in the G2 and M phases also correlate well with each other (Fig. 5E). In contrast, translation in G1 and S synchronized cells did not correlate with the unsynchronized cells (Fig. 5D) but rather correlated with one another (Fig. 5F). These results indicate that translation in the G2 and M phases, even though relatively short time-wise (∼2 h total) with respect to the entire cell cycle, dominate translation of the reporter mRNAs with PTBP1 5′-UTR and 3′-UTR elements. These results are consistent with endogenous PTBP1 levels observed by western blotting (Fig. 1B), suggesting that posttranscriptional regulation of PTBP1 levels occurs to a significant extent at the level of translation during the G2 and M phases of the cell cycle.
FIGURE 4.
Timecourses for mRNA transfections, incubation, and luminescence readout. (A) Schematic overview of HEK293T synchronization protocol and of luciferase mRNA reporter transfections. RO-3306 (6 µM) was used as the CDK1 inhibitor. (B) G1, S, G2, and M samples were transfected and assessed as outlined in A. FACS analysis is shown at the time of transfection and readout for G1, S, G2, and M samples. Note: G2 and M samples were transfected at the same time. For G2, RO3306 was maintained in the media during the experiment to maintain the block in G2, due to the fast transition observed between G2 and M phases.
FIGURE 5.
Translation profile of luciferase reporters with PTBP1 5′-UTR and 3′-UTR elements in different phases of the cell cycle. (A) Luciferase reporter readout for the experiments as diagrammed in Figure 4. All experiments were carried out in biological triplicate, with standard deviations shown. (B) Schematics of the luciferase reporters, with PTBP1 5′-UTR and 3′-UTR elements. (C) Determination of mRNA stability during the timecourse of the transfection experiment (6 h). We used the PSMB6 5′-UTR and short random 3′-UTR as positive control and water transfection as a negative control for background. (D) Luciferase activity from transcripts from the G1, S, G2, and M experiments in Figure 4A plotted against a mixed population of untreated cells. (E) Luciferase activity from transcripts from the M experiment in Figure 4A plotted against the G2 phase experiment in Figure 4A. (F) Luciferase activity from transcripts from the G1 experiment in Figure 4A plotted against the S phase experiment in Figure 4A. In panels A–F, transcripts are numbered according to the schematic in Figure 5B. In all panels, the experiments were carried out in biological triplicate, with standard deviations shown.
Implications of eIF3 binding to PTBP1 mRNA on its translation
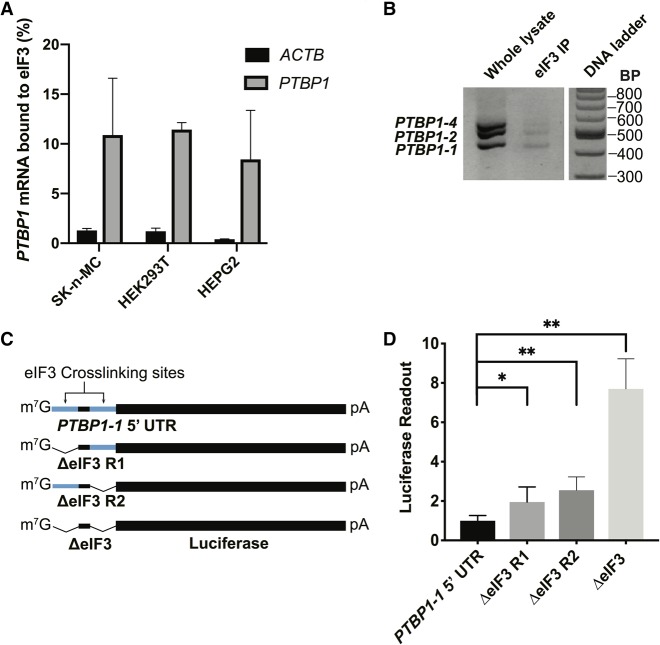
The results above suggest that translational regulation plays an important role in controlling PTBP1 isoform expression. Given the fact that eIF3 crosslinks to specific sequences in the 5′-UTR of PTBP1 mRNA (Lee et al., 2015), we first confirmed that PTBP1 mRNA binds eIF3 specifically in different cell types (Fig. 6A), by immunoprecipitating eIF3 from cell lysates using an antibody against EIF3B (Lee et al. 2015). In separate experiments, eIF3 immunoprecipitated from HEK293T cell lysates using an antibody against EIF3B (Lee et al. 2015) bound to all three endogenous PTBP1 coding sequence isoforms in HEK293T cells (Fig. 6B). We next tested the importance of these eIF3–5′-UTR interactions in regulating PTBP1 translation, also in HEK293T cells. We used luciferase reporter assays to measure differences in the translation output of mRNAs with the longer PTBP1 5′-UTR, which contains two sites of eIF3 crosslinking (Fig. 2B), or lacking regions known to bind eIF3 (Fig. 6C). In untreated HEK293T cells, individually deleting eIF3 crosslinking sites had a minimal impact on translation, whereas deleting both eIF3-interacting regions increased translation of these mRNAs (Fig. 6D).
FIGURE 6.
Binding of reporter mRNAs containing sites of interaction with eIF3. (A) qPCR quantification of PTBP1 mRNA bound to eIF3, with ACTB used as a negative control. Cell lines SK-n-MC, HEK293T, and HEPG2 were used. (B) PTBP1 mRNA exon 9 coding sequence isoforms that immunoprecipitate with eIF3, as determined by RT-PCR, and resolved on a 2% agarose. DNA ladder shown on the right. (C) Schematic of PTBP1 5′-UTR–luciferase reporter mRNAs. WT, wild-type; ΔeIF3, deletion of eIF3 PAR-CLIP clusters, nucleotide positions 25–49 (Region 1, R1), and/or 58–86 (Region 2, R2) for the PTBP1 transcript with the long 5′-UTR (GenBank accession NM_002819). (D) Luciferase activity in HEK293T cells transfected with mRNAs containing PTBP1 5′-UTR elements with or without deletions of the eIF3 crosslinking sites in Region 1 (R1) and/or Region 2 (R2). Experiments were carried out in biological triplicate, with standard deviation shown, significant with (*) P > 0.01, (**) P > 0.001.
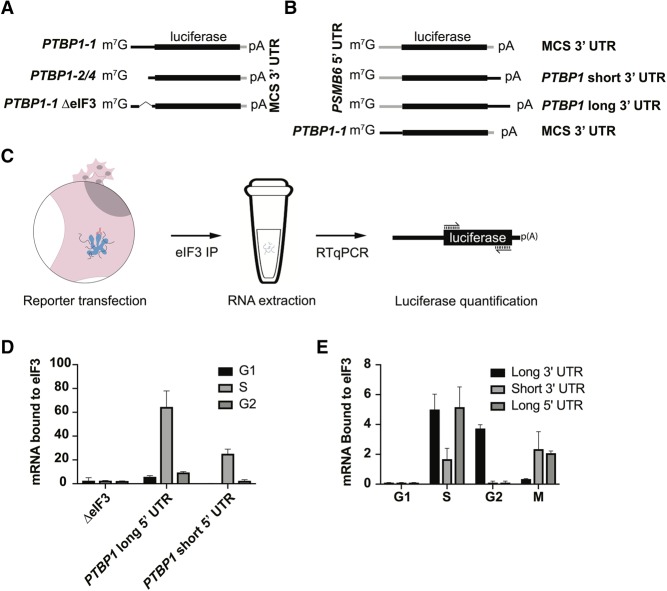
To check if the 5′-UTR of PTBP1 is sufficient for eIF3 binding, and whether both lengths of PTBP1 5′-UTR bind similarly to eIF3 across the cell cycle, we designed mRNAs with either the long or short PTBP1 5′-UTR sequences upstream of a luciferase open reading frame. We also tested a reporter with a mutated 5′-UTR in which the sequences that crosslink to eIF3 were deleted (Figs. 2B, 7A). These mRNAs were transfected into HEK293T cells, and the cells were collected in different stages of the cell cycle (Fig. 7C). We then immunoprecipitated eIF3 from cell lysates as above (Lee et al. 2015), followed by RNA extraction and quantitative PCR using primers for the luciferase CDS (Fig. 7C). Upon deletion of the eIF3 crosslinking sites, eIF3 no longer bound to the reporter mRNAs (Fig. 7D). Notably, although the longer PTBP1 5′-UTR interacts with eIF3 more efficiently than the short 5′-UTR, both species of 5′-UTR bind to eIF3 more efficiently during the S phase and less so during G2, and even less during G1 (Fig. 7D). In the above immunoprecipitation experiments, we used a random 3′-UTR instead of the 3′-UTR elements derived from PTBP1 transcript isoforms to assess the influence of the PTBP1 5′-UTR. To test whether eIF3 binding might also be influenced by the PTBP1 3′-UTR, we designed chimeric mRNAs with different combinations of PTBP1 5′-UTR and PTBP1 3′-UTR, using the same reporter system (Fig. 7B). Similarly to the 5′-UTR experiment (Fig. 7D), binding of the mRNAs containing the PTBP1 3′-UTR to eIF3 is more prevalent during the S phase compared to the other cell phases. Interestingly, the length of the 3′-UTR interacting with eIF3 changes as cell phases progress, with a switch happening during the mitotic phase (Fig. 7E). Altogether, these results indicate that eIF3 binds to PTBP1 mRNAs likely by interacting with both 5′-UTR and 3′-UTR elements in a cell cycle dependent manner (Fig. 7).
FIGURE 7.
Differential binding of PTBP1 UTR elements to eIF3 across the cell cycle. (A,B) Schematics of the luciferase reporters used in the experiments. (C) Schematic of the transfection, immunoprecipitation, and quantification method used to determine luciferase reporter mRNA binding to eIF3. (D) Distribution of binding to eIF3 across the cell cycle for the different PTBP1 5′-UTR elements as well as the deletion mutant. (E) Distribution of binding to eIF3 across the cell cycle for the different PTBP1 3′-UTR elements, as well as the long form of the PTBP1 5′-UTR. Binding experiments were carried out in biological triplicate, with standard deviation shown. Luciferase arbitrary units were normalized to WT for graphing.
DISCUSSION
A transcript set is the collection of mRNA isoforms that originate from a given genomic sequence. Transcripts are defined by introns, exons, UTRs, and their positions. Human transcript set information is stored in large databases and browsers such as ENSEMBL, REFSEQ, and UCSC (Zhao and Zhang 2015). However, cases in which the annotations of isoforms are inconsistent across databases are not uncommon (Brenner 1999; Schnoes et al. 2009; Promponas et al. 2015). Given the existence of overlapping, variable transcript isoforms, determining the functional impact of the transcriptome requires identification of full-length transcripts, rather than just the genomic regions that are transcribed (Pelechano et al. 2013). While working with PTBP1 mRNAs we noticed that sequences available in the ENSEMBL and FANTOM5 databases had discrepancies with respect to the TSSs of the major mRNA transcripts (Fig. 2). We therefore decided to validate the major mRNA isoforms for PTBP1 as the basis for future functional analysis of posttranscriptional regulation of PTBP1 expression. We were able to confirm at least six mRNA forms (Fig. 3G). These mRNA isoforms had differences in the 5′-UTR, coding sequence and 3′-UTR, suggesting that PTBP1 protein isoform expression may be regulated in multiple ways. PTBP1 is a pleiotropic protein, functioning in a variety of cellular processes. It is still unclear if the multiple activities of PTBP1 share a mechanistic pathway and more importantly how PTBP1 could act in posttranscriptional regulation in a tissue-specific way that is singular to the physiology of a certain set of cells. Although PTBP1 has been extensively studied, the multiple PTBP1 transcript isoforms we have identified will now enable biochemical analysis of PTBP1 mRNA regulation and function in different stages of the cell cycle.
Identifying RNA exon–exon connectivity remains a challenge when dealing with unknown mRNA isoforms. By combining long-read sequencing, and biochemical validation, we were able to fully characterize PTPB1 transcript isoforms. We used nanopore long-read sequencing with the goal to resolve connectivity between 5′-UTR, CDS and 3′-UTR elements of PTBP1 mRNAs. However, due to the inability of long-read sequencing to accurately reach the 5′ end of mRNA transcripts (Workman et al. 2018), we complemented nanopore sequencing with RNA Ligase Mediated Rapid Amplification of cDNA Ends (RLM-RACE) in order to determine the full length of PTBP1 mRNA isoforms present in HEK293T cells. This approach should be useful to identify the collection of PTBP1 variants in different cell types or culture conditions (Lundberg et al. 2010). PTBP1 mRNA has three major isoforms in the coding sequence that differ from each other at exon 9. PTBP1-1 lacks exon 9, PTBP1-2 has a partial sequence of exon 9 and PTBP1-4 has full-length exon 9. Because there are three different coding sequences (CDS) (Fig. 3A), resulting in three different proteins, and two distinct lengths of 5′-UTR, we aimed at determining the exact full-length sequence of each transcript. We found that PTBP1-1 bears the longer 5′-UTR and PTBP1-2 and PTBP1-4 both bear the shorter 5′-UTR. There is only one visible band in the agarose gel for each transcript, meaning that there is only one major form of the 5′-UTR for each transcript (Fig. 3C). Consistent with the APASdb database for alternative polyadenylation sites (You et al. 2015), we identified two alternative polyadenylation sites with significant usage, resulting in each of the three major PTBP1 transcripts having two distinct 3′-UTR lengths (Fig. 3E,F).
The mapping of all major PTBP1 transcripts in HEK293T cells (Fig. 3G) generated the information necessary for the biochemical analysis of PTBP1 translational regulation. Translational control elements can be located within the 5′-UTR and the 3′-UTR, with overall translation being affected by characteristics such as length, start-site consensus sequences as well as the presence of secondary structure, upstream AUGs, upstream open reading frames (uORFs) and internal ribosome entry sites (IRESs), and binding sites for trans-acting factors (Wilkie et al. 2003; Ma and Mayr 2018). UTR elements have been found to be involved in regulating cell cycle dependent translation. For example, histone translational control in Leishmania requires both 5′ and 3′-UTRs to properly restrict H2A translation to the S phase (Abanades et al. 2009). Differences in 3′-UTR length due to alternative polyadenylation have also been shown to result in acceleration of the cell cycle in cancer cells (Wang et al. 2018). We found that differences in the length of PTBP1 UTRs result in altered translational efficiency as the cell cycle progresses (Figs. 4–7), which may reflect the need to regulate PTBP1 protein isoform translation quickly depending on cellular demands (Sonenberg 1994; Pesole et al. 2001; Mayr 2017).
We previously found that eIF3 binds to PTBP1 through its 5′-UTR (Fig. 2B; Lee et al. 2015). Here we found both lengths of 5′-UTR are able to bind to eIF3 through two different sequence regions (Fig. 7). We also found that eIF3 can bind to the PTBP1 3′-UTRs (Fig. 7E). Interestingly, the different UTR lengths have differing impacts on translation (Figs. 4–6) and eIF3 binding (Fig. 7) in a cell cycle dependent manner. However, there is no obvious correlation between eIF3 binding and translational output of the mRNAs, indicating the role of eIF3 in PTBP1 translational regulation is more complex than simple binding of eIF3 to the transcripts. Although eIF3 binding to the 5′-UTR is likely direct (Lee et al. 2015), eIF3 binding to 3′-UTRs may be more common than previously appreciated, and may have been missed in (Lee et al. 2015) due to the sequencing depth and/or the types of contact to eIF3 involved. For example, eIF3 binding to the PTBP1 3′-UTR may require trans-acting factors.
Binding of eIF3 to PTBP1 mRNA isoforms is most abundant during the S and G2 phases, with the length of the 3′-UTR seeming to influence the extent of eIF3 binding. During S phase, binding is mediated predominantly through the long 3′-UTR and through the 5′-UTR, which correlates with overall repression of translation (Figs. 1, 5, 6). During G2, eIF3 interacts only with mRNAs bearing the long 3′-UTR, which correlates with repression of translation of these transcripts (Fig. 5). Consistent with eIF3 acting as a repressor, previous observations indicate that long 3′-UTRs often repress translation (Szostak and Gebauer 2013; Yamashita and Takeuchi 2017). Future experiments will be required to establish a mechanistic basis for isoform specific eIF3 repression of PTBP1 mRNA translation in the S and G2 phases of the cell cycle. Although we did not measure eIF3 levels in different stages of the cell cycle in this study, several groups have shown that some eIF3 subunits have different expression patterns throughout the cell cycle. Subunit EIF3F expression peaks in S and M phases in A569 cells (Higareda-Mendoza and Pardo-Galván 2010), and subunit EIF3A is also translated more during the S-phase (Dong et al. 2009). Depletion of EIF3B has been shown to decrease the levels of S-phase and G2/M phase cyclins in a bladder cancer cell line (Wang et al. 2013) and EIF3B/C depletion studies showed a profound cell size increase in G1 followed by a decrease in size during S-phase (Schipany et al. 2015).
Recently, PTBP1 has been found to be important for cell cycle progression. For example, PTBP1 enables germinal center B cells to progress through the late S phase of the cell cycle rapidly (Monzón-Casanova et al. 2018). In addition, knockout of Ptbp1 in mice results in embryonic lethality due to prolonged G2 to M progression (Shibayama et al. 2009). Notably, we find that PTBP1 expression is highest during the G2 and M cell cycle phases (Fig. 1B), which could be explained by the increase in the cell's demand for PTBP1 in late S phase for proper cell progression. Although several studies have shown global protein synthesis is repressed during mitosis (Fan and Penman 1970), a number of transcripts escape translational repression during M phase (Wilker et al. 2007; Marash et al. 2008; Ramírez-Valle et al. 2010; Stumpf et al. 2013; Tanenbaum et al. 2015; Park et al. 2016). Notably, some of these studies used Nocodazole as a synchronizing agent, which has been shown to disrupt translation (Coldwell et al. 2013) and proper cell cycling (Cooper et al. 2006), limiting the utility of these experiments for comparing effects on specific transcripts. However, alternative approaches using RO3306 (Tanenbaum et al. 2015) still show a modest global reduction in translation during mitosis, with more pronounced effects on a small subset of transcripts. Since the levels of PTBP1 mRNA remain relatively unchanged even as protein abundance increases substantially (Fig. 1), posttranscriptional regulation seems to be central to PTBP1 expression in the S to G2/M transitions, at least in HEK293T cells. With curated information on PTBP1 mRNA isoforms present in HEK293T mammalian cells (Fig. 3G), it will now be possible to dissect the posttranscriptional regulatory mechanisms involved in cell cycle dependent expression of PTBP1 isoforms, and the downstream physiological consequences.
MATERIALS AND METHODS
Cells and transfections
Human HEK293T cells were cultured in DMEM (Invitrogen) supplemented with 10% of Fetal Bovine Serum (FBS) (Seradigm) and 1% Pen/Strep (Gibco, cat. # 15140122). RNA transfections were performed using Mirus TransIT-mRNA Transfection Kit (cat. # MIR 2250), with the following modifications to the manufacturer's protocol. Sixteen hours before transfection, HEK293T cells were seeded into opaque 96-well plates to reach ∼80% confluence at the time of transfection. For each well, 9 µL of prewarmed OptiMEM (Invitrogen) was mixed with 250 ng of RNA, 0.27 µL of Boost reagent and 0.27 µL of TransIT mRNA reagent. Reactions were incubated for 3 min at room temperature, added drop-wise to the well, and luciferase activity was measured 6–8 h (as indicated) after transfection, using the Renilla Luciferase assay kit (Promega, cat. # E2820) and a Microplate 309 Luminometer (Veritas). Transfections were done in triplicate and on two different occasions using HEK293T cells.
For G1 transfections and luminescence readouts, cells were grown to 30% confluence and compound RO3306 (Vassilev et al. 2006; Tanenbaum et al. 2015) was added to a final concentration of 6 µM. Cells were incubated for 18 h. After 18 h, cells were released and incubated for 2 h with fresh media, to allow the cells to recover before mRNA transfection. After this time, we examined the cells by bright field microscopy to ensure they were well attached to the dish. Cells were transfected with the desired mRNA and luminescence was then measured after 6 h of incubation.
For S-phase transfections and readouts, cells were grown to 20% confluence in standard media and thymidine was added to a final concentration of 2 mM. Cells were incubated for 18 h in a tissue culture incubator, followed by two washes of HBSS media (Invitrogen) to remove the thymidine. Fresh media was added and cells were incubated for 9 h, at which point thymidine was added again to a final concentration of 2 mM. Cells were incubated in a tissue culture incubator for 15 h, then washed with HBSS media (Invitrogen) and released into fresh media. After 1 h of incubation to allow the cells to recover, cells were transfected with desired mRNA and luminescence was measured after 6 h. For G2 transfection and luminescence readouts, cells were synchronized with the same protocol as for S phase. After release, however, they were incubated for 4 h before mRNA transfection. After mRNA transfection, cells were incubated for 3 h and RO3306 was added at a final concentration of 6 µM. This guaranteed the cells would not progress into M phase before luminescence was measured. Cells were then incubated for 3 h prior to assessing luminescence. For M transfection and readouts, cells were treated exactly as G2, except RO3306 was not added, allowing them to progress into M phase after 4 h. Luminescence was measured after 6 h of incubation. Two batches of synchronization were done and transfections were performed in triplicate in each of the batches.
Cell cycle analysis
Cells were harvested and washed twice with phosphate-buffered saline (PBS) followed by fixation with 80% ethanol for 30 min at room temperature. Cells were then collected by centrifugation and stained with 50 µg/µL propidium iodide. The cells were then treated with 100 µg/µL RNAse for 15 min at 37°C followed by analysis using a BD Fortessa Flow Cytometer. Cell cycle distribution was analyzed using BD FACSDiva 7.0 software. We used two-parameter flow cytometry with forward (FSC) and side scatter (SSC) information, along with PE-TexasRed signal on an untreated (not synchronized) sample to determine the size distribution and locations of G1 and G2 phases on the plot (SSC vs. FSC; FSC vs. FSC and PE-TexasRed vs. FSC). Next, we analyzed the samples collected at different times after synchronization to assess the cell cycle distribution at each time point. We used this information to set the timing of the luciferase reporter experiments, as shown in Figure 4.
Analysis of luciferase reporters in different phases of the cell cycle
In experiments to analyze the influence of PTBP1 5′-UTR and 3′-UTR elements, luciferase readings after very short times after transfection were too noisy to be interpretable. We therefore timed the experiments such that luminescence readout was conducted in the desired phase of the cell cycle. We relied on normalizing luciferase expression from the transcript isoforms internally to each experiment in Figure 5. When comparing the relative translation of each transcript isoform to that observed in unsynchronized cells, the relative translation of each isoform in the experiments spanning G2 and M closely matched that in unsynchronized cells. The high correlation between these experiments and the unsynchronized cells indicates that translation of the PTBP1 mRNAs is highest in G2 and M phases, and relatively low in G1 and S phases.
To analyze the mRNA levels after 6 h of incubation, we transfected the desired reporters (750 ng of RNA per well) following the synchronized transfection protocol in 24 well plates in triplicate. After 6 h of incubation, cells were harvested and lysed with NP40 lysis buffer and 10 µL was removed for western blot control. The remaining 50 µL was extracted with the use of an RNeasy Mini Kit (QIAGEN) and RNA concentrations were assessed on nano drop and normalized to 50 ng/µL. Two hundred and fifty nanograms of RNA were used to perform RT-PCR with the use of a Superscript III Reverse Transcriptase kit (Thermo Fisher scientific, cat. #18080044). After reverse transcription, samples were treated with RNAse H enzyme for 30 min at 37°C. qPCR was done using 500 ng of cDNA and Sybr Green master mix with run conditions as follows: 95°C for 15 sec, followed by 40 cycles at 95°C for 15 sec, 60°C for 60 sec, and 95°C for 1 sec. Standard curves for assessing primer annealing and amplification were calculated for the ACTB primers and for the luciferase primers and the absolute amount of RNA was then calculated based on the equation given for each curve. Final RNA amounts were normalized to ACTB amounts to control for cell number differences across samples. Although we performed this control for mRNA stability, determination of cytoplasmic mRNA levels may be complicated by the route of mRNA entry into the cell due to the transfection protocol (Kirschman et al. 2017).
Plasmids
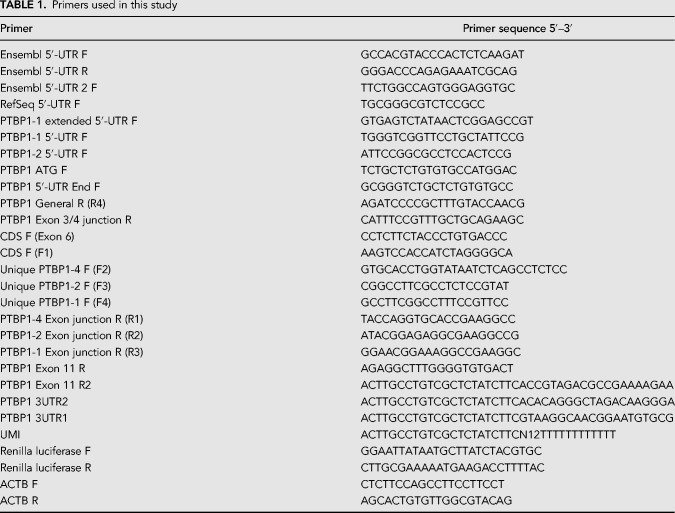
To generate the luciferase plasmids used on this work, sections of either the PTBP1 5′-UTR (GenBank accession NM_002819) or the PTBP1 3′-UTR were first amplified from human cDNA extracted from HEK293T cells. These were then placed downstream from a T7 RNA polymerase promoter using overlap extension PCR and InFusion cloning. The 5′-UTRs were then inserted together with Renilla luciferase into plasmid pcDNA4 V102020 (Invitrogen). The eIF3 binding mutants and PSMB6-PTBP1 chimeras were made by insertional mutagenesis with primers annealed to the pcDNA4 plasmid digested at the desired insertion site. Primers and sequences are included in Table 1.
TABLE 1.
Primers used in this study
TABLE 2.
PAR-CLIP crosslinking sites in hg38 coordinates
Western blot
Western Blot analysis was carried out using the following antibodies: anti- EIF3B (Bethyl A301-761A), anti-HSP90 (BD 610418), and anti-PTBP1 (MABE986, clone BB7); all antibodies were used with a 1:10000 dilution.
In vitro transcription
RNAs to be used for transfections were made by in vitro transcription with T7 RNA polymerase (NEB). For luciferase mRNAs, transcription was performed in the presence of 3′-O-Me-m7G (5′)ppp(5′)G RNA Cap Structure Analogue (NEB), using linearized plasmid as template, then polyadenylated using poly(A) polymerase (Invitrogen). RNAs were purified by phenol–chloroform extraction and ethanol precipitation or using the RNA clean and concentrator kit (Zymo Research). RNA quality was verified using 2% agarose gels, to ensure mRNAs were intact before transfection. RNAs were quantified using nanodrop and agarose gels to account for free NTPs. The amounts of each mRNA isoform were normalized prior to transfections.
RNA immunoprecipitation and RT-PCR
HEK293T cells grown on 10 cm plates were lysed as needed in three volumes of NP40 lysis buffer (50 mM HEPES-KOH pH = 7.5, 500 mM KCl, 2 mM EDTA, 1% Nonidet P-40 alternative, 0.5 mM DTT). Dynabeads were prepared with rabbit IgG (Cell Signaling 2729) and rabbit anti-EIF3B antibody (Bethyl A301-761A). The lysate was split into three parts, the Dynabeads-antibody mixture was added, and the suspensions incubated for 2 h at 4°C. The beads were washed four times with NP40 buffer, and bound RNAs were isolated by phenol–chloroform extraction and ethanol precipitation. The resulting cDNA was reverse transcribed using random hexamers and Superscript III (Thermo Fisher scientific), and PCR was performed using DNA polymerase Q5 (NEB). qPCR was always performed in duplicates. Primers used to quantify PTBP1 RNA levels:
PTBP1_Forward: GTACAAAGCGGGGATCTGAC
PTBP1_Reverse: CGGCTGTCACCTTTGAACTT
qPCR run conditions are as follows: 95°C for 15 sec, followed by 40 cycles at 95°C for 15 sec, 60°C for 60 sec, and 95°C for 1 sec.
Oxford Nanopore sequencing
Nanopore sequencing was carried out using the manufacturer protocol for 1D Strand switching cDNA by ligation (SQK-LSK108). The user defined primer was specific for exon 11 in PTBP1 mRNA:
5′-ACTTGCCTGTCGCTCTATCTTCAGAGGCTTTGGGGTGTGACT-3′
Rapid amplification of cDNA ends (RACE)
RACE analysis followed the protocol described for the FirstChoice RLM-RACE kit (Ambion), using the thermostable Vent DNA polymerase (NEB) and the adapter primers provided by the kit. The user-defined primers were:
For the 5′-UTR RACE:
PTBP1-2 Exon junction reverse (R2): 5′-ATA CGG AGA GGC GAA GGC CG-3′
PTBP1-1 Exon junction reverse (R3): 5′-GGA ACG GAA AGG CCG AAG GC-3′
PTBP1-4 Exon junction reverse (R1): 5′-TAC CAG GTG CAC CGA AGG CC-3′
PTBP1 general reverse (R4): 5′-AGA TCC CCG CTT TGT ACC AAC G-3′
For the 3′-UTR RACE:
Unique PTBP1-4 (F2): 5′-GTGCACCTGGTATAATCTCAGCCTCTCC-3′
Unique PTBP1-2 (F3): 5′-CGGCCTTCGCCTCTCCGTAT-3′
Unique PTBP1-1 (F4): 5′-GCCTTCGGCCTTTCCGTTCC-3′
CDS F (F1): 5′-AAGTCCACCATCTAGGGGCA-3′
ACKNOWLEDGMENTS
We thank D. Black for providing the PTBP1 antibody (Bb7) and for helpful discussions. We also thank W. Li, F.R. Ward, R. Green, and A.S.-Y. Lee for helpful discussions and the director of the CRL LSA Flow Cytometry Facility at UC Berkeley, Dr. Hector Nolla. This work was funded by a predoctoral fellowship to L.M.A.T. through CAPES Science Without Borders (fellowship P-3-03822) and by grant P50-GM102706 from the National Institute of General Medical Sciences (NIGMS) to J.H.D.C.
Footnotes
Article is online at http://www.rnajournal.org/cgi/doi/10.1261/rna.070193.118.
REFERENCES
- Abanades DR, Ramírez L, Iborra S, Soteriadou K, González VM, Bonay P, Alonso C, Soto M. 2009. Key role of the 3′ untranslated region in the cell cycle regulated expression of the Leishmania infantum histone H2A genes: minor synergistic effect of the 5′ untranslated region. BMC Mol Biol 10: 48 10.1186/1471-2199-10-48 [DOI] [PMC free article] [PubMed] [Google Scholar]
- Bert AG. 2006. Assessing IRES activity in the HIF-1 and other cellular 5′ UTRs. RNA 12: 1074–1083. 10.1261/rna.2320506 [DOI] [PMC free article] [PubMed] [Google Scholar]
- Brenner SE. 1999. Errors in genome annotation. Trends Genet 15: 132–133. 10.1016/S0168-9525(99)01706-0 [DOI] [PubMed] [Google Scholar]
- Coldwell MJ, Cowan JL, Vlasak M, Mead A, Willett M, Perry LS, Morley SJ. 2013. Phosphorylation of eIF4GII and 4E-BP1 in response to nocodazole treatment: a reappraisal of translation initiation during mitosis. Cell Cycle 12: 3615–3628. 10.4161/cc.26588 [DOI] [PMC free article] [PubMed] [Google Scholar]
- Cooper S, Iyer G, Tarquini M, Bissett P. 2006. Nocodazole does not synchronize cells: implications for cell-cycle control and whole-culture synchronization. Cell Tissue Res 324: 237–242. 10.1007/s00441-005-0118-8 [DOI] [PubMed] [Google Scholar]
- Dong Z, Liu Z, Cui P, Pincheira R, Yang Y, Liu J, Zhang J-T. 2009. Role of eIF3a in regulating cell cycle progression. Exp Cell Res 315: 1889–1894. 10.1016/j.yexcr.2009.03.009 [DOI] [PMC free article] [PubMed] [Google Scholar]
- Fan H, Penman S. 1970. Regulation of protein synthesis in mammalian cells. II. Inhibition of protein synthesis at the level of initiation during mitosis. J Mol Biol 50: 655–670. 10.1016/0022-2836(70)90091-4 [DOI] [PubMed] [Google Scholar]
- The FANTOM Consortium and the RIKEN PMI and CLST (DGT). 2014. A promoter-level mammalian expression atlas. Nature 507: 462–470. 10.1038/nature13182 [DOI] [PMC free article] [PubMed] [Google Scholar]
- Garcia-Blanco MA, Jamison SF, Sharp PA. 1989. Identification and purification of a 62,000-dalton protein that binds specifically to the polypyrimidine tract of introns. Genes Dev 3: 1874–1886. 10.1101/gad.3.12a.1874 [DOI] [PubMed] [Google Scholar]
- Gil A, Sharp PA, Jamison SF, Garcia-Blanco MA. 1991. Characterization of cDNAs encoding the polypyrimidine tract-binding protein. Genes Dev 5: 1224–1236. 10.1101/gad.5.7.1224 [DOI] [PubMed] [Google Scholar]
- Gueroussov S, Gonatopoulos-Pournatzis T, Irimia M, Raj B, Lin Z-Y, Gingras A-C, Blencowe BJ. 2015. An alternative splicing event amplifies evolutionary differences between vertebrates. Science 349: 868–873. 10.1126/science.aaa8381 [DOI] [PubMed] [Google Scholar]
- Higareda-Mendoza AE, Pardo-Galván MA. 2010. Expression of human eukaryotic initiation factor 3f oscillates with cell cycle in A549 cells and is essential for cell viability. Cell Div 5: 10 10.1186/1747-1028-5-10 [DOI] [PMC free article] [PubMed] [Google Scholar]
- Hinnebusch AG, Ivanov IP, Sonenberg N. 2016. Translational control by 5′-untranslated regions of eukaryotic mRNAs. Science 352: 1413–1416. 10.1126/science.aad9868 [DOI] [PMC free article] [PubMed] [Google Scholar]
- Kamath RV, Leary DJ, Huang S. 2001. Nucleocytoplasmic shuttling of polypyrimidine tract-binding protein is uncoupled from RNA export. Mol Biol Cell 12: 3808–3820. 10.1091/mbc.12.12.3808 [DOI] [PMC free article] [PubMed] [Google Scholar]
- Kirschman JL, Bhosle S, Vanover D, Blanchard EL, Loomis KH, Zurla C, Murray K, Lam BC, Santangelo PJ. 2017. Characterizing exogenous mRNA delivery, trafficking, cytoplasmic release and RNA-protein correlations at the level of single cells. Nucleic Acids Res 45: e113 10.1093/nar/gkx290 [DOI] [PMC free article] [PubMed] [Google Scholar]
- Lee ASY, Kranzusch PJ, Cate JHD. 2015. eIF3 targets cell-proliferation messenger RNAs for translational activation or repression. Nature 522: 111–114. 10.1038/nature14267 [DOI] [PMC free article] [PubMed] [Google Scholar]
- Li B, Yen TSB. 2002. Characterization of the nuclear export signal of polypyrimidine tract-binding protein. J Biol Chem 277: 10306–10314. 10.1074/jbc.M109686200 [DOI] [PubMed] [Google Scholar]
- Lundberg E, Fagerberg L, Klevebring D, Matic I, Geiger T, Cox J, Älgenäs C, Lundeberg J, Mann M, Uhlen M. 2010. Defining the transcriptome and proteome in three functionally different human cell lines. Mol Syst Biol 6: 450 10.1038/msb.2010.106 [DOI] [PMC free article] [PubMed] [Google Scholar]
- Ma W, Mayr C. 2018. A membraneless organelle associated with the endoplasmic reticulum enables 3′UTR-mediated protein-protein interactions. Cell 175: 1492–1506. 10.1016/j.cell.2018.10.007 [DOI] [PMC free article] [PubMed] [Google Scholar]
- Marash L, Liberman N, Henis-Korenblit S, Sivan G, Reem E, Elroy-Stein O, Kimchi A. 2008. DAP5 promotes cap-independent translation of Bcl-2 and CDK1 to facilitate cell survival during mitosis. Mol Cell 30: 447–459. 10.1016/j.molcel.2008.03.018 [DOI] [PubMed] [Google Scholar]
- Mayr C. 2017. Regulation by 3′-untranslated regions. Annu Rev Genet 51: 171–194. 10.1146/annurev-genet-120116-024704 [DOI] [PubMed] [Google Scholar]
- Monzón-Casanova E, Screen M, Díaz-Muñoz MD, Coulson RMR, Bell SE, Lamers G, Solimena M, Smith CWJ, Turner M. 2018. The RNA-binding protein PTBP1 is necessary for B cell selection in germinal centers. Nat Immunol 19: 267–278. 10.1038/s41590-017-0035-5 [DOI] [PMC free article] [PubMed] [Google Scholar]
- Noguchi S, Arakawa T, Fukuda S, Furuno M, Hasegawa A, Hori F, Ishikawa-Kato S, Kaida K, Kaiho A, Kanamori-Katayama M, et al. 2017. FANTOM5 CAGE profiles of human and mouse samples. Sci Data 4: 170112 10.1038/sdata.2017.112 [DOI] [PMC free article] [PubMed] [Google Scholar]
- O'Leary NA, Wright MW, Rodney Brister J, Ciufo S, Haddad D, McVeigh R, Rajput B, Robbertse B, Smith-White B, Ako-Adjei D, et al. 2015. Reference sequence (RefSeq) database at NCBI: current status, taxonomic expansion, and functional annotation. Nucleic Acids Res 44: D733–D745. 10.1093/nar/gkv1189 [DOI] [PMC free article] [PubMed] [Google Scholar]
- Park J-E, Yi H, Kim Y, Chang H, Kim VN. 2016. Regulation of poly(A) tail and translation during the somatic cell cycle. Mol Cell 62: 462–471. 10.1016/j.molcel.2016.04.007 [DOI] [PubMed] [Google Scholar]
- Pelechano V, Wei W, Steinmetz LM. 2013. Extensive transcriptional heterogeneity revealed by isoform profiling. Nature 497: 127–131. 10.1038/nature12121 [DOI] [PMC free article] [PubMed] [Google Scholar]
- Pérez I, McAfee JG, Patton JG. 1997. Multiple RRMs contribute to RNA binding specificity and affinity for polypyrimidine tract binding protein. Biochemistry 36: 11881–11890. 10.1021/bi9711745 [DOI] [PubMed] [Google Scholar]
- Pesole G, Mignone F, Gissi C, Grillo G, Licciulli F, Liuni S. 2001. Structural and functional features of eukaryotic mRNA untranslated regions. Gene 276: 73–81. 10.1016/S0378-1119(01)00674-6 [DOI] [PubMed] [Google Scholar]
- Promponas VJ, Iliopoulos I, Ouzounis CA. 2015. Annotation inconsistencies beyond sequence similarity-based function prediction - phylogeny and genome structure. Stand Genomic Sci 10: 108 10.1186/s40793-015-0101-2 [DOI] [PMC free article] [PubMed] [Google Scholar]
- Ramírez-Valle F, Badura ML, Braunstein S, Narasimhan M, Schneider RJ. 2010. Mitotic raptor promotes mTORC1 activity, G2/M cell cycle progression, and internal ribosome entry site-mediated mRNA translation. Mol Cell Biol 30: 3151–3164. 10.1128/MCB.00322-09 [DOI] [PMC free article] [PubMed] [Google Scholar]
- Romanelli MG, Diani E, Lievens PM-J. 2013. New insights into functional roles of the polypyrimidine tract-binding protein. Int J Mol Sci 14: 22906–22932. 10.3390/ijms141122906 [DOI] [PMC free article] [PubMed] [Google Scholar]
- Sawicka K, Bushell M, Spriggs KA, Willis AE. 2008. Polypyrimidine-tract-binding protein: a multifunctional RNA-binding protein. Biochem Soc Trans 36: 641–647. 10.1042/BST0360641 [DOI] [PubMed] [Google Scholar]
- Schipany K, Rosner M, Ionce L, Hengstschläger M, Kovacic B. 2015. eIF3 controls cell size independently of S6K1-activity. Oncotarget 6: 24361–24375. 10.18632/oncotarget.4458 [DOI] [PMC free article] [PubMed] [Google Scholar]
- Schnoes AM, Brown SD, Dodevski I, Babbitt PC. 2009. Annotation error in public databases: misannotation of molecular function in enzyme superfamilies. PLoS Comput Biol 5: e1000605 10.1371/journal.pcbi.1000605 [DOI] [PMC free article] [PubMed] [Google Scholar]
- Shibayama M, Ohno S, Osaka T, Sakamoto R, Tokunaga A, Nakatake Y, Sato M, Yoshida N. 2009. Polypyrimidine tract-binding protein is essential for early mouse development and embryonic stem cell proliferation. FEBS J 276: 6658–6668. 10.1111/j.1742-4658.2009.07380.x [DOI] [PubMed] [Google Scholar]
- Sonenberg N. 1994. mRNA translation: influence of the 5′ and 3′ untranslated regions. Curr Opin Genet Dev 4: 310–315. 10.1016/S0959-437X(05)80059-0 [DOI] [PubMed] [Google Scholar]
- Stumpf CR, Moreno MV, Olshen AB, Taylor BS, Ruggero D. 2013. The translational landscape of the mammalian cell cycle. Mol Cell 52: 574–582. 10.1016/j.molcel.2013.09.018 [DOI] [PMC free article] [PubMed] [Google Scholar]
- Szostak E, Gebauer F. 2013. Translational control by 3′-UTR-binding proteins. Brief Funct Genomics 12: 58–65. 10.1093/bfgp/els056 [DOI] [PMC free article] [PubMed] [Google Scholar]
- Tanenbaum ME, Stern-Ginossar N, Weissman JS, Vale RD. 2015. Regulation of mRNA translation during mitosis. Elife 4: e07957 10.7554/elife.07957 [DOI] [PMC free article] [PubMed] [Google Scholar]
- Valcárcel J, Gebauer F. 1997. Post-transcriptional regulation: the dawn of PTB. Curr Biol 7: R705–R708. 10.1016/S0960-9822(06)00361-7 [DOI] [PubMed] [Google Scholar]
- Vassilev LT, Tovar C, Chen S, Knezevic D, Zhao X, Sun H, Heimbrook DC, Chen L. 2006. Selective small-molecule inhibitor reveals critical mitotic functions of human CDK1. Proc Natl Acad Sci 103: 10660–10665. 10.1073/pnas.0600447103 [DOI] [PMC free article] [PubMed] [Google Scholar]
- Wang H, Ru Y, Sanchez-Carbayo M, Wang X, Kieft JS, Theodorescu D. 2013. Translation initiation factor eIF3b expression in human cancer and its role in tumor growth and lung colonization. Clin Cancer Res 19: 2850–2860. 10.1158/1078-0432.CCR-12-3084 [DOI] [PMC free article] [PubMed] [Google Scholar]
- Wang Q, He G, Hou M, Chen L, Chen S, Xu A, Fu Y. 2018. Cell cycle regulation by alternative polyadenylation of CCND1. Sci Rep 8: 6824 10.1038/s41598-018-25141-0 [DOI] [PMC free article] [PubMed] [Google Scholar]
- Wilker EW, van Vugt MA, Artim SA, Huang PH, Petersen CP, Reinhardt HC, Feng Y, Sharp PA, Sonenberg N, White FM, et al. 2007. 14-3-3σ controls mitotic translation to facilitate cytokinesis. Nature 446: 329–332. 10.1038/nature05584 [DOI] [PubMed] [Google Scholar]
- Wilkie GS, Dickson KS, Gray NK. 2003. Regulation of mRNA translation by 5′- and 3′-UTR-binding factors. Trends Biochem Sci 28: 182–188. 10.1016/S0968-0004(03)00051-3 [DOI] [PubMed] [Google Scholar]
- Wollerton MC, Gooding C, Robinson F, Brown EC, Jackson RJ, Smith CW. 2001. Differential alternative splicing activity of isoforms of polypyrimidine tract binding protein (PTB). RNA 7: 819–832. 10.1017/S1355838201010214 [DOI] [PMC free article] [PubMed] [Google Scholar]
- Wollerton MC, Gooding C, Wagner EJ, Garcia-Blanco MA, Smith CWJ. 2004. Autoregulation of polypyrimidine tract binding protein by alternative splicing leading to nonsense-mediated decay. Mol Cell 13: 91–100. 10.1016/S1097-2765(03)00502-1 [DOI] [PubMed] [Google Scholar]
- Workman RE, Tang A, Tang PS, Jain M, Tyson JR, Zuzarte PC, Gilpatrick T, Razaghi R, Quick J, Sadowski N, et al. 2018. Nanopore native RNA sequencing of a human poly(A) transcriptome. bioRxiv 10.1101/459529 [DOI] [PMC free article] [PubMed] [Google Scholar]
- Xue Y, Zhou Y, Wu T, Zhu T, Ji X, Kwon Y-S, Zhang C, Yeo G, Black DL, Sun H, et al. 2009. Genome-wide analysis of PTB-RNA interactions reveals a strategy used by the general splicing repressor to modulate exon inclusion or skipping. Mol Cell 36: 996–1006. 10.1016/j.molcel.2009.12.003 [DOI] [PMC free article] [PubMed] [Google Scholar]
- Yamashita A, Takeuchi O. 2017. Translational control of mRNAs by 3′-untranslated region binding proteins. BMB Rep 50: 194–200. 10.5483/BMBRep.2017.50.4.040 [DOI] [PMC free article] [PubMed] [Google Scholar]
- You L, Wu J, Feng Y, Fu Y, Guo Y, Long L, Zhang H, Luan Y, Tian P, Chen L, et al. 2015. APASdb: a database describing alternative poly(A) sites and selection of heterogeneous cleavage sites downstream of poly(A) signals. Nucleic Acids Res 43: D59–D67. 10.1093/nar/gku1076 [DOI] [PMC free article] [PubMed] [Google Scholar]
- Zerbino DR, Achuthan P, Akanni W, Amode MR, Barrell D, Bhai J, Billis K, Cummins C, Gall A, Girón CG, et al. 2018. Ensembl 2018. Nucleic Acids Res 46: D754–D761. 10.1093/nar/gkx1098 [DOI] [PMC free article] [PubMed] [Google Scholar]
- Zhao S, Zhang B. 2015. A comprehensive evaluation of ensembl, RefSeq, and UCSC annotations in the context of RNA-seq read mapping and gene quantification. BMC Genomics 16: 97 10.1186/s12864-015-1308-8 [DOI] [PMC free article] [PubMed] [Google Scholar]


