SUMMARY
Polycomb-directed repression of gene expression is frequently misregulated in human diseases. A quantitative and target-specific cellular assay was utilized to discover the first potent positive allosteric modulator (PAM) peptidomimetic, UNC4976, of nucleic acid binding by CBX7, a chromodomain methyl-lysine reader of Polycomb Repressive Complex 1. The PAM activity of UNC4976 resulted in enhanced efficacy across three orthogonal cellular assays by simultaneously antagonizing H3K27me3-specific recruitment of CBX7 to target genes while increasing non-specific binding to DNA and RNA. PAM activity thereby reequilibrates PRC1 away from H3K27me3 target regions. Together, our discovery and characterization of UNC4976 not only revealed the most cellularly potent PRC1-specific chemical probe to date, but also uncovers a potential mechanism of Polycomb regulation with implications for non-histone lysine methylated interaction partners.
In Brief
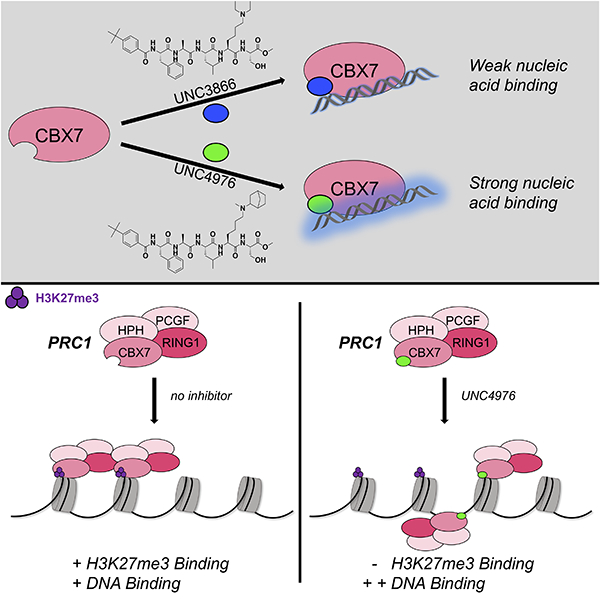
Lamb et al. describe the discovery of UNC4976 as a cellularly efficacious inhibitor of CBX7. Despite similar potency, selectivity, and permeability to previously published probe UNC3866, UNC4976 possesses a unique MOA as a positive allosteric modulator of nucleic acid binding to CBX7 that rationalizes its enhanced cellular activity.
Graphical Abstract:
INTRODUCTION
The installation, interpretation, and removal of histone post-translational modifications (PTMs) by distinct classes of effector proteins represents a crucial mode of chromatin regulation. While a myriad of PTMs have been identified on histones, lysine methylation (Kme) is one of the most abundant and better studied modifications, and depending upon its location and degree of methylation (mono-, di-, or tri-), can be associated with both active and repressed chromatin states. Reader proteins that bind this mark are therefore crucial signaling nodes, as they often participate in and recruit multi-subunit complexes that elicit varying effects on chromatin structure and gene transcription (Chi et al., 2010; Dawson and Kouzarides, 2012; Strahl and Allis, 2000).
Trimethylation of histone H3 lysine 27 (H3K27me3) is a well-known repressive mark that is installed and maintained by complexes of Polycomb group (PcG) proteins (Aranda et al., 2015; Margueron and Reinberg, 2011; Simon and Kingston, 2013). Polycomb Repressive Complex 2 (PRC2), which contains the methyltransferase subunit EZH1/2, is responsible for deposition of the H3K27me3 mark (Cao et al., 2002; Czermin et al., 2002; Muller et al., 2002). PRC2 also contains an H3K27me3-reading subunit, EED, that plays a key role in propagation of the mark to adjacent histone proteins by allosteric activation of EZH1/2 (Margueron et al., 2009; Suh et al., 2019). H3K27me3 also serves as a signal for the recruitment of canonical Polycomb Repressive Complex 1 (PRC1) through interaction with the chromodomain of the chromobox (CBX) subunit and binding of the H3K27me3 residue within a three-member aromatic cage (Bernstein et al., 2006; Fischle et al., 2003; Gao et al., 2012; Hauri et al., 2016; Kaustov et al., 2011). This binding event aids in positioning the RING1A/RING1B subunit of the complex to install the histone H2A lysine 119 monoubiquitin (H2AK119ub1) mark through its E3 ligase activity (Cao et al., 2005; de Napoles et al., 2004; McGinty et al., 2014; Wang et al., 2004). The activities of both complexes operating in tandem allow for robust transcriptional repression, although recent evidence suggests that PRC1 alone can act directly to compact chromatin, unlike PRC2 (Francis et al., 2004; Gao et al., 2012; Kundu et al., 2017; Lau et al., 2017). Altogether, PcGs are central to maintaining cellular identity and normal differentiation by repressing Polycomb target genes (Aranda et al., 2015; Di Croce and Helin, 2013; Gil and O’Loghlen, 2014; Luis et al., 2012). Given these critical roles, mutation or deregulation of several PcG proteins have been identified in numerous cancers and other diseases (De Rubeis et al., 2014; Ribich et al., 2017).
Recent literature has not only shed light on the immense complexity of mammalian PRC1 complexes, but challenged the classical, sequential signaling mechanism by which Polycomb complexes function to repress their target genes (Blackledge et al., 2014; Connelly and Dykhuizen, 2017; Gao et al., 2012; Hauri et al., 2016; Tavares et al., 2012; Vandamme et al., 2011). All mammalian PRC1 complexes are comprised of either RING1A/B (RING1/RNF2) and one of six PCGF subunits (PCGF1–6) that dimerize to form the core complex (Gao et al., 2012; Hauri et al., 2016). Mammalian PRC1 complexes have diverged into two distinct categories: canonical complexes, which bind H3K27me3 through the CBX subunit (Morey et al., 2012) and variant complexes that lack CBX domains, the cognate Kme reader (Blackledge et al., 2014; Gao et al., 2012; Hauri et al., 2016; Kundu et al., 2017; Tavares et al., 2012). Moreover, while all PCGF-RING1 dimer combinations demonstrate the ability to ubiquitinate nucleosomes in vitro (Taherbhoy et al., 2015), cellular H2A ubiquitination by canonical PRC1 (PCGF2/MEL18 or PCGF4/BMI1) has been shown to be greatly attenuated in comparison to the cellular E3 ligase activity of variant PRC1 (PCGF1, ‒3, ‒5, ‒6) (Blackledge et al., 2014). These observations led to a revised pathway for PcG signaling in which variant PRC1 complexes can initiate gene silencing via placement of H2AK119ub1 independently of PRC2 and H3K27me3 (Blackledge et al., 2014; Tavares et al., 2012). In turn, molecular recognition of H2AK119ub1 is mediated through Jarid2 and recognized by PRC2, which promotes the recruitment of canonical PRC1 for chromatin compaction and consequent transcriptional repression (Blackledge et al., 2014; Cooper et al., 2016).
Given the complexity of Polycomb signaling and its direct role in transcriptional repression, chemical probes have played an important role in the exploration of Polycomb biology and elucidation of specific functions of PRC1/PRC2 subunits (He et al., 2017; Qi et al., 2017; Shortt et al., 2017).Translational drug discovery opportunities have also stemmed from chemical probe exploration (Xu et al., 2015a), demonstrated by the advancement of several PRC2-directed inhibitors, including multiple EZH2 inhibitors and one EED inhibitor, to clinical trials. While PRC1 chemical probe development has not garnered the same level of attention, we and others have focused on CBX7 as a potential therapeutic target as its overexpression has been implicated in oncogenesis and poor prognoses in a number of malignancies (Morey et al., 2012; Shinjo et al., 2014; Yap et al., 2010). While development of both small molecule (Ren et al., 2015; Ren et al., 2016) and peptidomimetic (Simhadri et al., 2014; Stuckey et al., 2016a; Stuckey et al., 2016b) CBX7 inhibitors have been achieved, only UNC3866 meets the affinity, selectivity, and utility criteria for classification as a cellular chemical probe for Polycomb CBX chromodomains (Frye, 2010; Liszczak et al., 2017; Schwarz and Gestwicki, 2018). However, UNC3866 is still limited by low permeability, which has precluded its use in in vivo systems and encouraged our continued development of more cellularly active compounds.
Notably, an aspect of Polycomb CBX chromodomains that has been relatively underappreciated in the inhibitor development process is their ability to bind to nucleic acids in addition to the histone substrate peptide. This nucleic acid binding function has been recently summarized elsewhere (Weaver et al., 2018) for a broad range of Kme reader domains. Importantly, Polycomb CBX chromodomains have been reported by multiple groups to bind nucleic acids, unlike their HP1 chromodomain counterparts, in a non-sequence specific fashion (Bernstein et al., 2006; Connelly et al., 2019; Yap et al., 2010; Zhen et al., 2016). Additionally, one of the aforementioned small molecule inhibitors towards CBX7 was reported to stabilize chromodomain binding to an ANRIL-RNA probe at a Kd= 23.8 μM, despite very weak in vitro affinity to the chromodomain (Kd ~ 500 μM, HSQC) (Ren et al., 2016).
In addition to our focus on increasing cellular efficacy of newly developed compounds towards CBX7, we also set out to more thoroughly characterize the cellular effects of our CBX7 compounds in the context of chromatin, with an emphasis on compound-induced alterations of CBX7 binding to nucleic acids. Herein, we report the discovery of UNC4976, a significantly improved cellularly efficacious chemical probe of CBX7, and characterize its mechanism of action as a positive allosteric modulator (PAM) of CBX7 chromodomain binding to nucleic acids with rapid impacts on both PRC1 occupancy on chromatin and gene expression at Polycomb target genes within cells.
RESULTS
Utility of a GFP Reporter Assay as a Cellular Screen for New Inhibitors of CBX7
In an effort to overcome limitations in cellular permeability and efficacy seen with UNC3866, we utilized a cellular reporter assay in order to simultaneously assess potency and permeability for new compounds targeting PRC1-associated CBX7 in the context of native chromatin. Similar to the recently characterized Polycomb in-vivo Assay (Moussa et al., 2019), we generated a mouse embryonic stem cell (mESC) line with a single integration of an array of 12 DNA binding sites for ZFHD1 upstream of a CpG-free Green Fluorescent Protein (GFP) gene to direct specific recruitment of canonical PRC1 and initiation of a Polycomb repressive domain (Figure S1A). We have previously shown that canonical PRC1 targeting to a reporter locus could be achieved by a chimeric fusion of the PRC1 core subunit CBX7 with a DNA binding domain (Moussa et al., 2019). Stable expression of the DNA binding domain ZFHD1 alone did not lead to deposition of repressive chromatin modifications or reduced GFP expression (Figures S1B and S1C). In contrast and consistent with previous results (Moussa et al., 2019), ZFHD1-meditated CBX7 tethering nucleated formation of a functional canonical PRC1, deposition of repressive histone modifications and transcriptional silencing of the GFP reporter gene (Figures S1B and S1C). Importantly, while nucleation of repressive chromatin depended on sequence-specific ZFHD1-CBX7 tethering, stable repression of the Polycomb domain by endogenous PRC1 and PRC2 requires interactions of the CBX7 chromodomain with H3K27me3 (Moussa et al., 2019). Therefore, we posited that inhibitors precluding CBX7 binding to H3K27me3 would prevent Polycomb spreading in cis from ZFHD1 binding sites and result in reactivation of the GFP reporter gene.
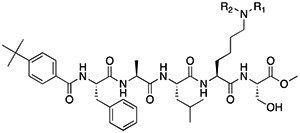
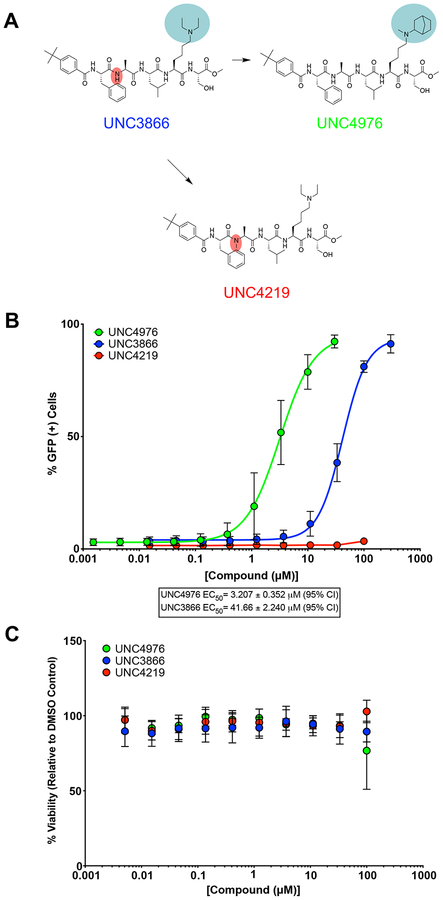
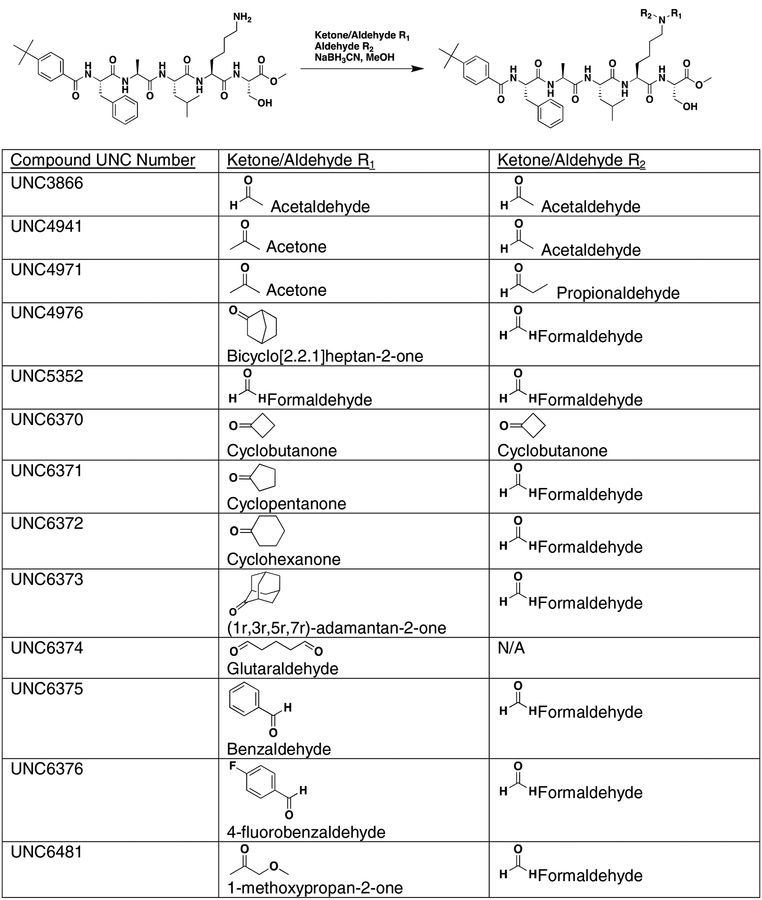
Using the Polycomb in-vivo Assay, we screened a set of UNC3866 analogs whose structures varied at the methyl-lysine mimetic position. We focused on the lysine mimetic position because much of our previous work concentrated on optimization of the N-terminal “cap” residue in UNC3866 to achieve potency (Stuckey et al., 2016a; Stuckey et al., 2016b), and the ε-amino group of the lysine side chain provided a synthetic handle for efficient derivatization. We primarily incorporated aliphatic substituents, both cyclic and acyclic, to examine the effect of increased hydrophobicity on the lysine amine (Table 1; compound number listed). A few aromatic substituents (UNC6375, UNC6376, and UNC6483) were also tested to determine if π- π stacking was preferred within the CBX7 aromatic cage. We utilized flow cytometry to monitor GFP levels after 48-hour treatment with compounds in the CBX7 reporter mESC line, and determined that most of the tested UNC3866 analogs displayed a dose-dependent reactivation of GFP expression. From this data, it was apparent that cellular activity is enhanced by bulky, lipophilic substituents on the lysine amine, as a clear correlation between increased lipophilicity and cellular efficacy was observed (Table 1). However, this preference for increased lipophilicity eventually came at the cost of solubility, as the N6-adamantyl-N6-methyl lysine (UNC6373) and N6-benzyl-N6-methyl lysine series of analogs (UNC6375, UNC6376, and UNC6483) showed markedly poor solubility above 30 mM in this assay. Thus, we decided that the modestly increased efficacy of these compounds over the N6-methyl-N6-norbornyl lysine compound was offset by the observed decrease in solubility, and we selected the N6-methyl-N6-norbornyl compound, UNC4976, for further investigation (Figure 1A). UNC4976 is ~14-fold more potent than UNC3866 in the CBX7 reporter cell line, demonstrating a cellular EC50 = 3.207 ± 0.352 μM in comparison to an EC50 = 41.66 ± 2.240 μM for UNC3866, while a previously reported negative control, UNC4219, was inactive in this assay (Figure 1B), as expected. It is worth noting that previously reported small molecule ligands for CBX7, MS452 (Ren et al., 2015) and MS351 (Ren et al., 2016), were also inactive under these assay conditions, likely owing to weak affinity towards CBX7 and observed solubility issues at concentrations where activity attributed to cellular antagonism of CBX7 had been reported (data not shown). As cellular EC50’s in the low micromolar range (or lower) are preferred for chemical probes, the potency enhancement seen for UNC4976 was highly significant for a peptidic ligand (Arrowsmith et al., 2015; Bunnage et al., 2013; Frye, 2010; Schwarz and Gestwicki, 2018).
Table 1.
Methyl Lysine (Kme) Mimetic Compounds Screened in Polycomb in-vivo Assay.
| Kme Mimetic | EC50 (μM) |
|---|---|
| 105.1 ± 11.25 | |
| 41.66 ± 2.240 | |
| 36.57 ± 1.140 | |
 |
26.55 ± 3.240 |
 |
13.74 ± 0.535 |
 |
33.08 ± 1.905 |
| 23.73 ± 1.740 | |
| ~ 20 | |
| 4.590 ± 0.292 | |
 |
3.207 ± 0.352 |
 |
1.018 ± 0.175 |
 |
2.356 ± 0.115 |
 |
2.223 ± 0.194 |
 |
2.057 ± 0.135 |
Peptidomimetic scaffold shown above table for reference, with methyl-lysine mimetic modification site highlighted in blue. Data are presented as mean ± SD from three biological replicate experiments.
Figure 1. Screening and Viability of Compounds in mESCs.
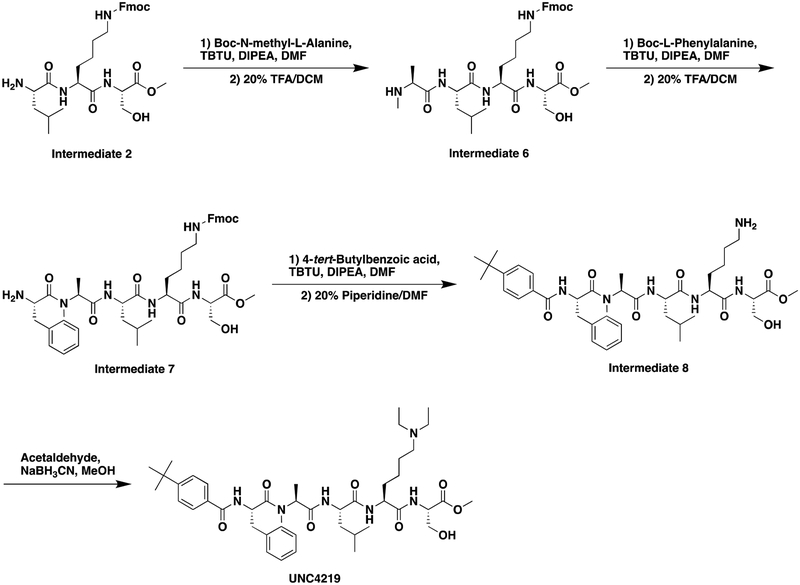
A. Structures of UNC3866, UNC4976, and UNC4219 with modifications highlighted (lysine mimetic change in blue, amide methylation in red). B. In the Polycomb in-vivo Assay, UNC4976 displays a 14-fold enhancement in efficacy over UNC3866, while a negative control, UNC4219, shows no activity. UNC4976, UNC3866, and UNC4219 data are colored in green, blue, and red, respectively. Data are represented as mean ± SD from at least three biological replicates. C. Assessment of compound effects on cell viability by Cell Titer-Glo. UNC4976, UNC3866, and UNC4219 data are colored in green, blue, and red, respectively. Data are presented as mean ± SD from three biological replicate experiments.
Following screening in the Polycomb in-vivo Assay, we also tested all three compounds of continued interest (UNC3866, UNC4976, and UNC4219) for their potency to curtail epigenetic maintenance of CBX7-induced transcriptional silencing using the previously published TetOFF reporter cell line (Moussa et al., 2019). We have shown that after release of the original TetR-dependent stimulus, epigenetic inheritance of Polycomb repression is promoted by CBX7 binding to H3K27me3 and sensitive to treatment with UNC3866. In agreement with increased potency, derepression of the GFP reporter gene was enhanced in response UNC4976 compared to UNC3866 treatment (Supplementary Figure 1D). Maintenance of Polycomb silencing was unaffected in the presence of the control compound (UNC4219). In addition, we evaluated mESC viability upon compound treatment. All compounds were non-toxic with the exception of weak toxicity of UNC4976 at 100 μM, which was outside of the concentration range utilized for this compound in the Polycomb in-vivo Assay (Figure 1C).
Comparison of UNC3866 and UNC4976 in vitro Thermodynamic Affinities, Kinetic Affinities, and Selectivity
Upon discovery of UNC4976 as a 14-fold more efficacious inhibitor relative to UNC3866 in the Polycomb in-vivo Assay, we compared the in vitro affinities of the two compounds for the five Polycomb CBX chromodomains as well as the CDYL2 chromodomain by isothermal titration calorimetry (ITC) (Stuckey et al., 2016a). In comparing Kd values by ITC, UNC4976 displays an affinity profile that is almost identical to UNC3866 for purified Polycomb CBX and CDYL2 protein chromodomains (Table S1 and Figures S2A–E). UNC4976 displays equipotent affinity for CBX4 and ‒7, which have identical amino-acid residues that contact the ligand, while showing 28‒ and 9-fold selectivity for CBX4/7 over CBX2 and ‒6, respectively, and 8-fold selectivity over CDYL2. ITC data for UNC4976 binding to CBX8 was unable to be obtained due to DMSO tolerance constraints of the protein under the assay conditions.
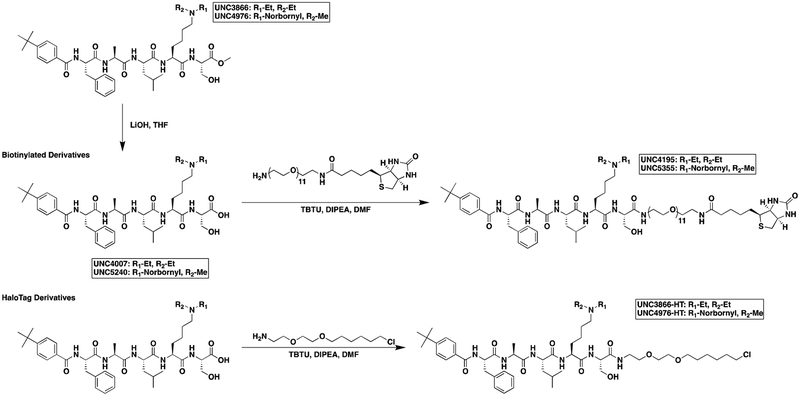
We next sought to compare kinetic data for the two compounds, hypothesizing that perhaps UNC4976 showed better efficacy in the mESC reporter assay due to slow off-rate of the compound, extending the target residence time of the ligand bound to CBX7 protein (Copeland, 2016; Copeland et al., 2006). We generated a biotinylated derivative of UNC4976, UNC5355, from the C-terminus of the serine residue for further study (ITC: CBX7 Kd = 209.5 ± 55.9 nM, Figure S2F). We compared chromodomain binding of biotinylated derivatives of both UNC3866 (UNC4195, ITC: CBX7 Kd = 220 ± 22 nM (Stuckey et al., 2016a)) and UNC4976 (UNC5355) by surface plasmon resonance (SPR), via immobilization of the biotin ligands on a NeutrAvidin chip. Although both ligands demonstrated exceptional SPR signal upon testing of all five Polycomb CBX and CDYL2 chromodomains, no differences in off-rate (kd) or target residence time were observed between the two ligands for any protein, and chromodomain selectivity by SPR was consistent with our ITC data (Table S2 and Figures S2G–L). Overall, this suggests that the improvement in cellular efficacy of UNC4976 is not due to improved binding to its target chromodomains.
We further evaluated the selectivity profiles of both biotinylated compounds by comparing binding on a chromatin-associated domain array (CADOR) containing 120 purified Kme reader domains, including 28 chromodomains, >45 Tudor domains, and other PHD, Agnet, Bromo, and Yeats domains, spotted on a nitrocellulose coated membrane (Figures S3B and S3C) (Kim et al., 2006). Upon incubating the array with biotinylated ligands, the biotin handle of UNC4195 and UNC5355 was used to interact with fluorescently tagged streptavidin for binding visualization. This CADOR microarray revealed that in addition to the similar thermodynamic and kinetic selectivity profiles of UNC3866 and UNC4976 for CBX and CDY chromodomains, the biotinylated versions of both compounds retained a remarkably similar selectivity profile against a much broader range of Kme reader domains, as binding interactions were only detected for all five Polycomb CBX chromodomains and a small subset of CDY chromodomains (Figure S3A) in each case.
Quantification of Compound Permeability by the ChloroAlkane Penetration Assay
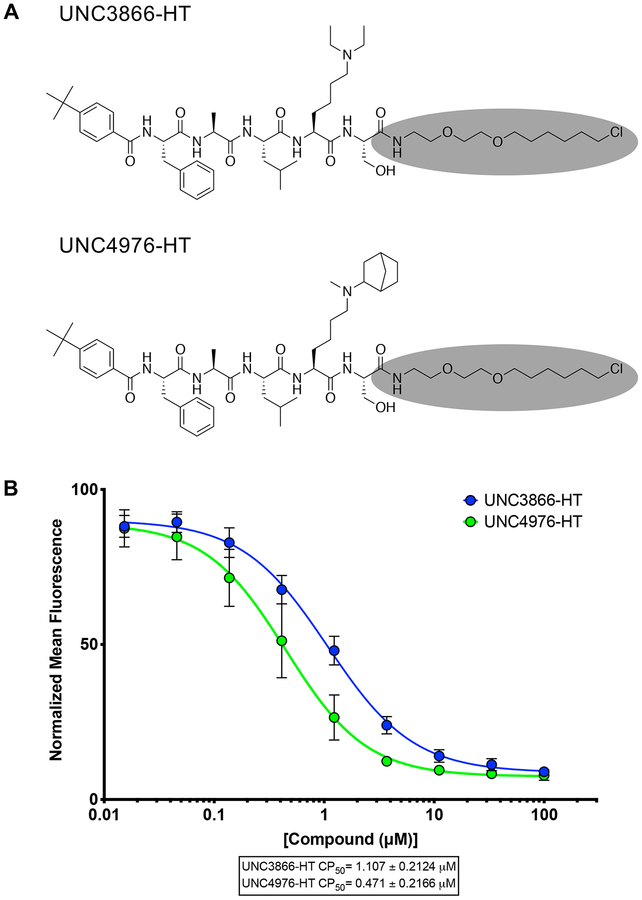
After confirming that thermodynamic affinities, target residence time, and the selectivity profile of UNC4976 were nearly identical to UNC3866, we sought a way to quantitatively measure permeability of both compounds to determine if the increase in UNC4976 efficacy from the cellular GFP reporter assay was a result of higher permeability, since we knew this was a limitation of UNC3866 (Stuckey et al., 2016a). We were encouraged by recent work from Kritzer and colleagues on the assessment of peptide permeability using the HaloTag system, in an elegant method referred to as the ChloroAlkane Penetration Assay (CAPA) (Peraro et al., 2018; Peraro et al., 2017). Briefly, CAPA utilizes a HeLa cell line that expresses a cytosolically oriented haloenzyme-GFP fusion. Thus, the assay is able to account for compound that is freely available in the cytosol but not compound that is endosomally sequestered, which is a known concern for peptides (Kwon and Kodadek, 2007; Tan et al., 2008). CAPA cells are first incubated with a compound of interest that has been appended with a chloroalkane tag (denoted -HT for HaloTag) which will react with the free haloenzyme should the compound reach the cytosol. Following this, a TAMRA dye that is also tagged with the chloroalkane (TAMRA-HT) is added to the cells to react with any remaining free haloenzyme not previously labeled by the compound of interest. Permeability is then read out by flow cytometry as an inverse measure of TAMRA fluorescence, and reported as a “CP50” value, for the concentration at which 50% cell penetration was observed (Peraro et al., 2018). For use in CAPA, our compounds first needed to be labeled with a chloroalkane tag, which was installed at the same position previously used for biotinylation of the two compounds (Figure 2A). The resulting CAPA data revealed that UNC4976-HT was ~2-fold more permeable than UNC3866-HT, preventing TAMRA-HT labeling at approximately half the concentration (Figure 2B). Therefore, while UNC4976 is slightly more permeable than UNC3866, this difference is not sufficient to explain the difference in efficacy in the GFP reporter line. It is important to note that we previously determined that efflux was not a major factor in limiting the cellular activity of UNC3866, so a change in efflux is also not an explanation for the increased activity of UNC4976 (Stuckey et al., 2016a).
Figure 2. ChloroAlkane Penetration Assay (CAPA).
A. Structures of UNC3866-HT and UNC4976-HT, HaloTag modified compounds for use in CAPA. Chloroalkane tag is highlighted in gray. B. UNC4976-HT is 2-fold more permeable than UNC3866-HT in CAPA. Data are presented as mean ± SD from three biological replicate experiments.
UNC4195 and UNC5355 Similarly Engage Canonical PRC1 Complex in Cells
Chemiprecipitation experiments in prostate cancer derived PC3 cell lysates were performed with UNC4195 and UNC5355 to determine if discrepancies in the ability of the two compounds to pulldown canonical PRC1 complex were present. Consistent with the rationale from our previous work with UNC3866 and UNC4195, PC3 cells were selected based on their expression of all five Polycomb CBX proteins in order to examine whether UNC4976 possesses a cellular selectivity profile of CBX binding that is distinct from UNC3866 (Stuckey et al., 2016a). Following chemiprecipitation, we blotted for CBX2, CBX4, CBX6, CBX7, and CBX8, while also testing for the presence of BMI1 and RING1B components of canonical PRC1. Experiments with UNC4195 were validated from previous work, as we detected pulldown of CBX4, CBX7, CBX8, RING1B, and BMI1. However, no differences in the cellular pulldown profile between UNC4195 and UNC5355 were detected, as all five components previously mentioned were similarly pulled down by UNC5355, while pulldown of CBX2 and CBX6 was not detected (Figures S4A and S4B). Encouragingly, both compounds are able to bind intact canonical PRC1 complex in cellular lysates, but their identical target engagement profiles do not offer an explanation for the enhanced cellular efficacy of UNC4976.
UNC4976 Efficiently Displaces CBX7-containing PRC1 from Polycomb Target Genes
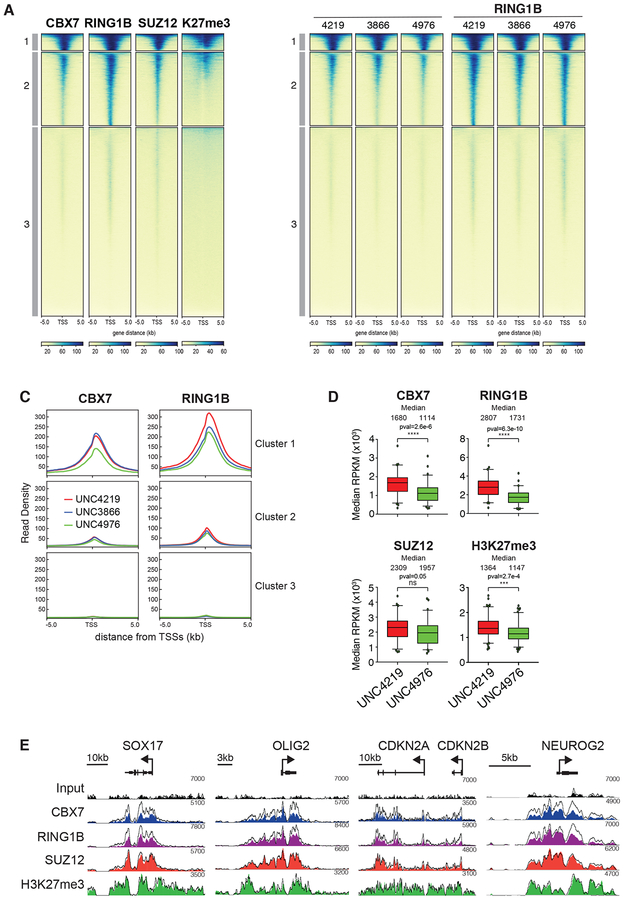
Given similar binding affinities to canonical PRC1 complexes in cellular lysates, we sought to determine the relative capacity of UNC3866 and UNC4976 to displace CBX7 and RING1B from endogenous targets in mESCs. To evaluate changes in canonical PRC1 recruitment, we used Chromatin Immunoprecipitation followed by quantitative PCR (ChIP-qPCR) and Next-Generation Sequencing (ChIP-seq) to compare CBX7 and RING1B binding after four hours of treatment with UNC3866, UNC4976 or negative control compound UNC4219. We selected this time point in order to capture early changes in PRC1 occupancy that would be less influenced by any subsequent transcriptional changes. In mESCs, CBX7 and the catalytic subunit RING1B largely co-occupy transcription start sites (TSSs) bound by PRC2 subunit SUZ12 and marked by H3K27me3 (Morey et al., 2012). We used k-means clustering of CBX7, RING1B, SUZ12 and H3K27me3 to define sets of high, intermediate and low PRC1 occupancy (Figure 3A). Unlike with negative control compound UNC4219, short treatment with UNC4976 substantially reduced CBX7 and RING1B binding at high and intermediate mESC PRC1 target TSSs (Figures 3B, 3C and S5A, Table S3). While UNC4976 treatment resulted in strong reduction of CBX7 and RING1B binding from all target TSSs, UNC3866 had more limited impact (Figures 3B, 3C and S5A). Hence, the preferential capacity to displace PRC1 from chromatin of UNC4976 versus UNC3866 is consistent with the enhanced activity observed in the CBX7 reporter assay suggesting that on chromatin UNC4976 disrupts PRC1 activity more effectively than UNC3866.
Figure 3. UNC4976 efficiently displaces CBX-containing PRC1 from Polycomb target genes.
A. Heat maps showing ChIP-seq enrichment for CBX7, RING1B, SUZ12 and H3K27me3 in mES cells. Signal is centered around the TSSs +/− 5 kb and plotted as FPKM normalized mapped reads and separated in three clusters. B. Heat maps display ChIP-seq enrichment of CBX7 and RING1B in mouse ES cells treated for 4 hours with 20 μM of UNC4219, UNC3866 or UNC4976. Signal is centered around the TSSs +/− 5 kb and plotted as FPKM normalized mapped reads and separated in three clusters. C. Meta plots of clusters in (B) display changes in RING1B and CBX7 occupancy in response treatment with UNC4219 (red), UNC3866 (blue) or UNC4976 (green). D. Boxplots of heat maps from capture ChIP-seq (Supplementary Figure 5B) show median RPKM normalized mapped reads for Cluster 1 of CBX7, RING1B, SUZ12 and H3K27me3. Statistical significance was calculated using unpaired t-test (p<0.01). Data are presented as mean ± SD. E. Screenshots of four representative capture ChIP-seq regions for RING1B, CBX7, SUZ12 and H3K27me3. ChIP-seq signal of control UNC4219 treatment is shown as an outlined line and UNC4976 treated capture ChIP-seq samples are shown in filled color tracks. All data in A-E are representative of at least two independent biological replicates.
To enhance sensitivity and obtain a more quantitative measurement of canonical PRC1 displacement in response to UNC4976 treatment, we performed ChIP-seq for CBX7, RING1B, SUZ12 and H3K27me3 in combination with sequence capture by biotinylated oligonucleotides to enrich for 25 selected chromosomal regions harboring Polycomb and non-Polycomb target genes (Table S4). Capture ChIP-seq achieved up to 10,000-fold sequencing read coverage providing superior sensitivity compared to whole-genome sequencing, and allowing increased ability to detect differential enrichment with compound treatment. This approach revealed on average a ~40% reduction in CBX7 and RING1B occupancy in response to UNC4976 but not UNC4219 (Figures 3D, 3E and S5B–D). Moreover, this effect was selective as UNC4976 yields only a mild or insignificant reduction in SUZ12 binding and H3K27me3 (Figures 3D, 3E and S5B–D). Together, this argues that loss of canonical PRC1 is independent of PRC2 and UNC4976 interferes selectively with CBX7-mediated targeting of the canonical PRC1 complex to H3K27me3 domains.
UNC4976 Enhances Affinity of CBX7 Chromodomain for Nucleic Acids
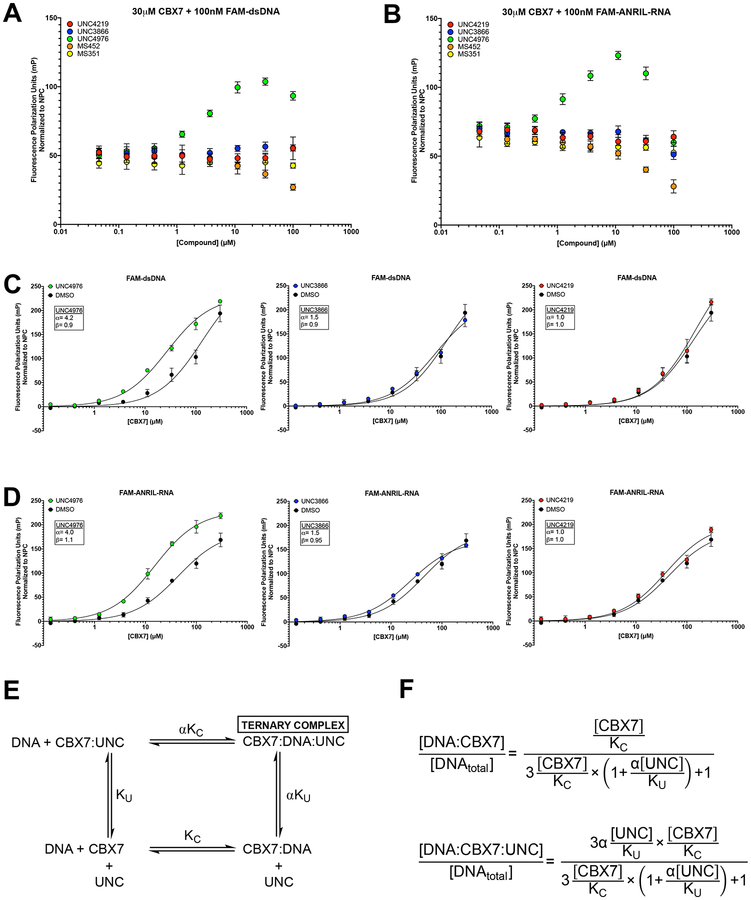
Upon finding that ChIP-seq data corroborated the chromatin context specific enhancement of the activity of UNC4976 versus UNC3866 in the CBX7 reporter assay, we continued our investigation of the underlying mechanism by examining the influence of these compounds on CBX7 binding to nucleic acids. We initially assessed nucleic acid binding to CBX7 chromodomain in the presence or absence of compound by utilizing a fluorescence polarization (FP) assay. Upon titration of UNC3866, UNC4976, or control compound UNC4219 in the presence of 30 μM CBX7 chromodomain and 100 nM of a FAM-labeled double-stranded DNA probe (FAM-dsDNA), we observed that only UNC4976 increased polarization (Figure 4A). Similar results were obtained with a FAM-labeled ANRIL RNA Loop C probe (FAM-ANRIL-RNA) (Ren et al., 2016) (Figure 4B), suggesting that UNC4976 increases the affinity of CBX7 for nucleic acids. Interestingly, an observed maximum of fluorescence polarization was achieved at a 1:3 ratio of UNC4976 to CBX7 for both double-stranded DNA and ANRIL Loop C RNA probes. While this ratio-dependent phenomenon was observed previously by Ren and colleagues (Ren et al., 2016), we did not observe increased fluorescence polarization with MS351, again likely owing to solubility issues of the compound under our assay conditions (Figures 4A and 4B). The more soluble MS452 compound, however, showed a slight destabilizing effect on binding of CBX7 to both FAM-dsDNA and FAM-ANRIL-RNA probes, similar to previous results (Ren et al., 2016).
Figure 4. UNC4976 Enhances Nucleic Acid Probe Binding by Fluorescence Polarization (FP).
A. Compound titration in the presence of 30 μM CBX7 chromodomain and 100 nM FAM-dsDNA. Fluorescence polarization signal is normalized to a No Protein Control (NPC). Data is shown for UNC4219 (red), UNC3866 (blue), UNC4976 (green), MS452 (orange), and MS351 (yellow). B. Compound titration as in (A), with 30 μM CBX7 chromodomain and 100 nM FAMANRIL-RNA. Fluorescence polarization signal is normalized to a No Protein Control (NPC). Data is shown for UNC4219 (red), UNC3866 (blue), UNC4976 (green), MS452 (orange), and MS351 (yellow). C. Ratio titration of 1:3 compound to CBX7 in the presence of 100 nM FAM-dsDNA. UNC4976 (left panel, green), UNC3866 (middle panel, blue), and UNC4219 (right panel, red) are all compared to DMSO control (black). Fluorescence polarization signal is normalized to a No Protein Control (NPC). D. Ratio titration as in (C) in the presence of 100 nM FAM-ANRIL-RNA. UNC4976 (left panel, green), UNC3866 (middle panel, blue), and UNC4219 (right panel, red) are all compared to DMSO control (black). Fluorescence polarization signal is normalized to a No Protein Control (NPC). E. Depiction of Stockton-Ehlert allosteric binding model of CBX7:DNA/RNA:UNC compound ternary complex formation. “KU” represents the binding constant between CBX7 and UNC compounds and was derived from previously calculated ITC Kd values (Table S1). “KC” represents the binding constant between CBX7 and DNA/RNA and was calculated by protein titration with DNA/RNA probes in FP in the absence of compound (DMSO control). F. Equations for Stockton-Ehlert allosteric binding model by which “α” constant was derived. All data in A-D are presented as mean ± SD from three biological replicate experiments.
To quantitate the compound-mediated affinity changes of CBX7 binding to both DNA or RNA, we elected to hold this 1:3 ratio of compound to protein constant, allowing for a consistent fraction of protein to be occupied by compound during titration against FAM-dsDNA or FAMANRIL-RNA (Figures 4C and 4D). UNC4976 binding caused a significant enhancement in CBX7 affinity for FAM-dsDNA (Figure 4C, left panel) while UNC3866 demonstrated negligible enhancement (Figure 4C, middle panel). Similar results were seen using the same ratio-based titration of compound and protein in binding to FAM-ANRIL-RNA, in which UNC4976 not only promoted enhanced CBX7 binding to RNA, but also demonstrated an upward shift in the maximum polarization values observed upon binding to RNA (Figure 4D, left panel).
The production of a ternary complex between DNA/RNA, CBX7 and UNC3866/UNC4976 was then analyzed with the standard Stockton/Ehlert allosteric binding model to quantify UNC4976-mediated affinity enhancement of CBX7 for nucleic acids (Ehlert, 1988; Stockton et al., 1983). This model yields explicit expressions of the ternary complex (DNA/RNA:CBX7:UNC; where UNC is used as shorthand for the ligands) and the binary complex between DNA/RNA:CBX7 (Figures 4E and 4F), and is based on the precept that the interaction of two species is necessarily modified by binding of a third species. In this model (Figure 4E) and associated equations (Figure 4F), “KU” represents the binding constant between CBX7 and UNC compounds and was derived from previously calculated ITC Kd values (Table S1), and “KC” represents the binding constant between CBX7 and DNA/RNA and was calculated by protein titration with DNA/RNA probes in FP in the absence of compound (DMSO control). The affinity of CBX7 for either DNA or RNA is modified by a factor “α” when a UNC compound is bound; since the allosterism is compound dependent, the value of α is unique for every compound. Fitting of the data for DNA/RNA binding in the presence or absence of UNC compounds indicates that UNC4976 enhances the affinity of CBX7 for the DNA probe by a factor of 4.2 (α = 4.2) (Figure 4C, left panel), whereas UNC3866 only enhances affinity by a factor of 1.5 (Figure 4C, middle panel). Similar data were obtained for the RNA probe, although it was evident that UNC4976 also causes an increase in maximum FP response upon formation of the ternary complex. To accommodate this, a multiplicative factor “β” that captures the difference in FP response capability present for the UNC4976-mediated ternary complex was incorporated in the RNA probe dataset analysis, where β is the ratio of FP factors between [RNA:CBX7:UNC] and [RNA:CBX7]. UNC4976 not only increases the affinity by a factor of 4 (α = 4.0), but also slightly increases the FP response of the complex by a factor of 1.1 (β = 1.1) (Figure 4D, left panel). All other values for α and β for each compound and DNA/RNA probe combination are captured in individual panels (Figures 4C and 4D). Accordingly, Stockton/Ehlert analysis of our FP dataset produces excellent fits and supports a mechanism of action for UNC4976 as a positive allosteric modulator (PAM) of CBX7 affinity for nucleic acids.
To corroborate our FP data, we also utilized electrophoretic mobility shift assays (EMSAs) to determine the ability of UNC4976 to stabilize CBX7 binding to FAM-dsDNA in an orthogonal system. After observing that CBX7 weakly bound to the FAM-dsDNA probe at a concentration of 166 μM CBX7 chromodomain (Figures S6A and S6B), we performed EMSAs with 150 mM CBX7 and 100 nM FAM-dsDNA probe in the presence of various ratios of UNC4976, UNC3866, UNC4219, MS452, and MS351 to determine if UNC4976 binding would enhance FAM-dsDNA binding similar to that observed by FP. Interestingly, utilizing UNC4976 at a 1:3 ratio of compound to CBX7 showed enhanced FAM-dsDNA binding, while UNC3866 at the same ratio did not have any effect (Figure S6C). We also did not observe enhancement of FAM-dsDNA binding to CBX7 in the presence of MS351, again likely owing to solubility issues under our assay conditions, while both UNC4219 and MS452 had no effect, as expected (Figure S6C). By Coomassie stain, both UNC3866 and UNC4976 showed binding to CBX7 as evidenced by higher molecular weight band shifts (Figure S6D). Overall, both FP and EMSA data clearly demonstrate that only UNC4976 possesses the unique ability to enhance CBX7 chromodomain affinity for nucleic acid probes, despite its structural similarity to UNC3866.
Molecular Dynamics of CBX7 with UNC3866 versus UNC4976
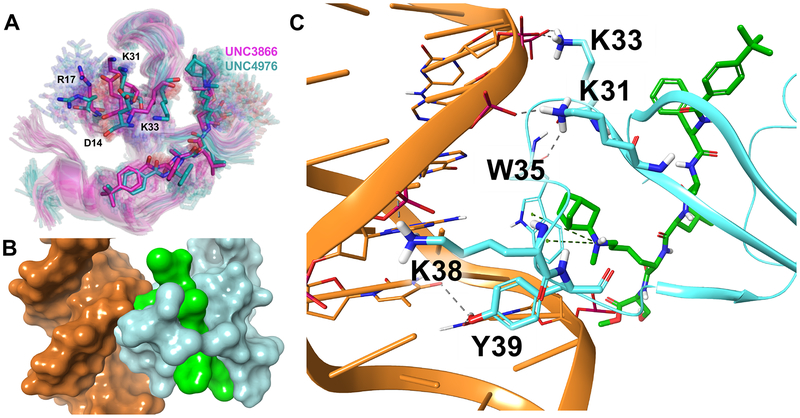
We then sought to understand the structural mechanism by which UNC4976 may allosterically enhance the affinity of CBX7 to DNA/RNA. In general, an allosteric modulator of a protein acts by altering the host protein’s conformational ensemble which in turn may alter its binding affinity to a third molecule at a remote binding site (a positive value of a in the Stockton/Ehlert allosteric binding model) (Boehr et al., 2009). Molecular dynamics (MD) simulations is the technique of choice to study how intermolecular interactions affect their respective conformational ensembles. In this study, we performed a total of ~50 microseconds (ms) of MD simulations on systems including the CBX7 chromodomain in complex with respectively UNC4976 and UNC3866, as well as the CBX7 chromodomain alone. Structural snapshots, one per 40 picoseconds (ps), were extracted from the MD trajectories, aligned and subjected to a cluster analysis. The analysis was performed in such a way that each cluster contained closely related protein folds, within ~1 Å of root mean square distance (RMSD). Hence, a centroid of each cluster approximates a distinct conformation within the protein’s conformational ensemble. Of particular interest were clusters that predominantly consisted of the snapshots featuring either UNC4976 or UNC3866. Indeed, such clusters can be associated with ligand-induced conformations of the ensemble. As hypothesized, we observed that both UNC4976 and UNC3866, each in its unique way, alter the conformational ensemble of the CBX7 chromodomain. Of the total of 377 conformations identified in all three simulated systems, 19 and 6 were induced by UNC4976 or UNC3866, respectively (Figure 5A). These ligand-induced conformations were observed during 16% and 18% of time, respectively, for UNC4976- and UNC3866-bound CBX7. The mere existence of such ligand-induced conformations supports the idea that the enhanced binding of the UNC4976-CBX7 complex to DNA/RNA might be due to the compound’s ability to induce “DNA/RNA-friendly” chromodomain conformations. While we expected ligand-induced conformations to show more focused changes around the aromatic cage, as the two compounds only differ in the methyl-lysine mimetic that is expected to bind in this region (Stuckey et al., 2016a), compound-induced conformations instead reflected broader, chromodomain-wide shifts. This suggests that although the N6,N6-diethyl (UNC3866) to N6-methyl-N6-norbornyl (UNC4976) change is modest in the context of the entire peptidomimetic scaffold, UNC4976 has the ability to drastically alter the conformation of the CBX7 chromodomain even outside the aromatic cage and therefore allosterically enhance DNA/RNA binding.
Figure 5. Molecular Dynamics and Docking of Binary (CBX7:UNC) and Ternary (CBX7:DNA:UNC) Complexes.
A. Ligand-induced conformational ensembles of CBX7 for UNC3866- and UNC4976-bound protein (respectively magenta and cyan sticks). Centroid conformations from the largest clusters are rendered as solid sticks, other cluster centroids as transparent sticks. B. Surface representation of the CBX7:DNA:UNC4976 docking model, displaying a significant contact surface area, as well as the ligand’s involvement. DNA is shown in orange, UNC4976 is shown in green, and CBX7 is shown in light blue. C. Cartoon representation of the CBX7:DNA:UNC4976 docking model, showing the major interacting residues (including the methyllysine-binding aromatic cage) and the role of the ligand’s methyllysine mimetic group. Components are colored as described above.
We then investigated a possible structural mode of the ligand-induced interaction of CBX7 chromodomain with the DNA double helix. To this end, three sets of 10 MD snapshots each were selected at random from structural clusters predominantly containing either ligand-bound (UNC4976 or UNC3866) or ligand-free CBX7 chromodomain. All 30 structures were then submitted to automated protein-DNA docking simulations by the High Ambiguity Driven protein-protein DOCKing (HADDOCK) algorithm (van Zundert et al., 2016). The resulting HADDOCK scores were in the range between ‒70 and ‒110 kcal/mol that is typical for a small-size protein. Of note, although the HADDOCK scores are not expected to accurately reflect the binding free energies, the mean scores over molecular systems ranked consistently with experimental data, i.e., CBX7:UNC4976 (−93±9 kcal/mol) < CBX7:UNC3866 (−89±9) < CBX7 (−81±12). The top ranked docking poses show a large contact surface area between the protein and DNA (Figure 5B) with the W32-S40 loop binding deep into the major groove. Both ligand-bound chromodomains share significant similarities in the way they bind to DNA. In particular, the protein-DNA interaction implicates the residues R17, K31, and K33 which have been previously identified as important for the interaction with DNA (Connelly et al., 2019; Yap et al., 2010) (Figure 5C). Importantly, two of the residues forming the methyl-lysine binding aromatic cage (W35 and Y39), as well as the ligand’s methyl-lysine mimetic group, also have close contacts with DNA (Figure 5C). Overall, the combination of MD clustering and HADDOCK docking data suggests that the ligand modification in the vicinity of the methyl-lysine mimetic significantly affects the dynamics of both the W32–S40 loop and the aromatic cage, which in turn are putatively implicated in CBX7:DNA binding, thus providing a straightforward structural rationale of the positive allosteric effect of UNC4976.
UNC4976 Increases Expression of Polycomb Target Genes in HEK293 Cells
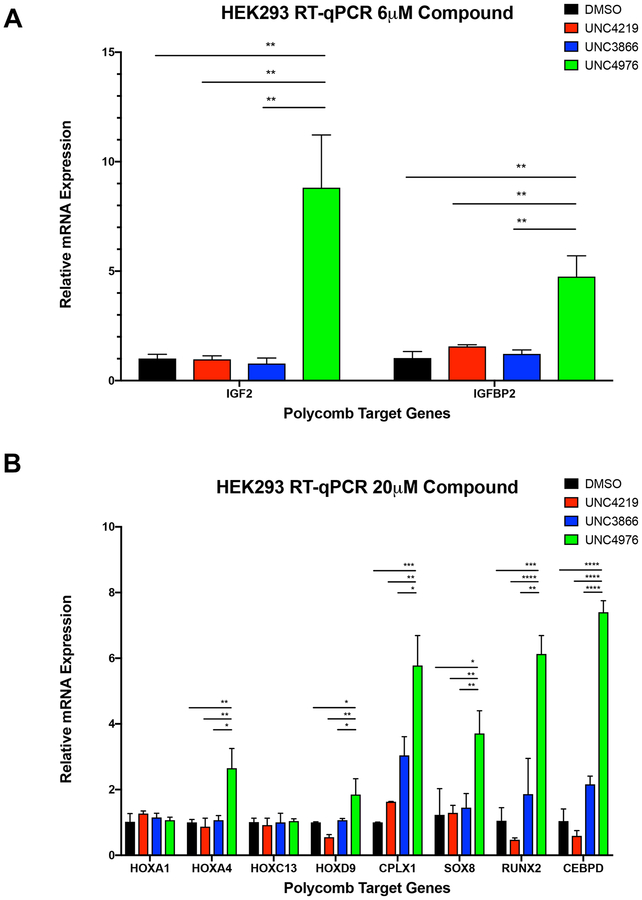
After observing that UNC4976 had a greater effect than UNC3866 at displacing CBX7-PRC1 from Polycomb target genes and uncovering that UNC4976 surprisingly had a stabilizing effect on binding nucleic acids, we sought to determine how the depletion of PRC1 occupancy and enhancement of CBX7 nucleic acid binding inflicted by UNC4976 would correspond with changes in the expression profiles of Polycomb target genes. To this end, we chose to use HEK293 cells to examine known canonical PRC1 targets that bind H3K27me3 sites (Figure S7) by RT-qPCR. We utilized HEK293 cells as a system not biased towards CBX7, unlike the remainder of our dataset, where the CBX profile of UNC3866 and UNC4976 (see Figure S2 and 3), would result in changes in expression due to perturbation of most CBX containing, canonical PRC1 complexes, not just those containing CBX7. Treatment with 6 μM and 20 μM of UNC4976 caused a pronounced increase in transcription of these tested Polycomb target genes, in some cases displaying 8-fold higher expression than UNC3866 treatment at the same concentration (Figures 6A and 6B, Table S5). Meanwhile, UNC3866 had either no or a mild effect on derepression of these Polycomb target genes relative to UNC4219 or DMSO controls at 6 μM (Figure 6A) and 20 μM (Figure 6B). These RT-qPCR results are concordant with our ChIP-seq data and Polycomb in vivo Assay data in demonstrating that UNC4976 is significantly more potent in the context of cellular chromatin than could be predicted by its binding affinity in vitro, permeability, or selectivity profile.
Figure 6. mRNA Expression Analysis in HEK293 Cells.
RT-qPCR data plotting relative mRNA expression after treatment of 6mM (A), or 20μM (B) compound. Data is shown for DMSO (black), UNC4219 (red), UNC3866 (blue), and UNC4976 (green). All data are presented as mean ± SD from three biological replicate experiments. (*, p<0.05; **, p<0.01; ***, p<0.001, ****, p<0.0001; NS, not significant)
DISCUSSION
Our original design and optimization of CBX7 ligands was based upon a reductionist approach of isolating the CBX7 chromodomain in an in vitro assay system and utilizing MD simulations to understand how to drive an induced-fit mode of binding and increase ligand affinity by iterative design, synthesis and determination of binding constants (Stuckey et al., 2016a; Stuckey et al., 2016b). While this approach was highly successful, yielding ligands such as UNC3866 which are >100-fold more potent than fragments of the endogenous H3K27me3 peptide, it necessarily leaves out other interactions that may be critical in the context of full-length CBX7 within PRC1 binding to chromatin. We describe here the utilization of a cellular reporter assay that was constructed to be uniquely dependent upon CBX7 to allow us to optimize for more cellularly potent ligands. This assay revealed that analogues of UNC3866, such as UNC4976, with increased lipophilicity at the methyl-lysine mimetic position, were significantly more potent in cells for reasons that could not be explained by an enhanced Kd for CBX7. We initially hypothesized that this might be due to either a slower off-rate of binding or enhanced permeability of UNC4976 versus UNC3866. By determining kinetic off-rates by SPR and quantitating relative permeability using the CAPA assay, we were able to reject these hypotheses. In addition to the Polycomb in vivo Assay, we were able to show by ChIP-seq and RT-qPCR that UNC4976 was significantly more potent than UNC3866 at displacing CBX7 from chromatin and inducing re-expression of PRC1 silenced genes. Previous work on CBX7 (Bernstein et al., 2006; Yap et al., 2010; Zhen et al., 2016) and a recent study of CBX8 (Connelly et al., 2019) support a role of relatively low affinity and non-sequence specific nucleic acid binding by CBX chromodomains in enhancing their affinity for chromatin via binding to both H3K27me3 (specificity determining) and DNA or RNA (multivalent affinity enhancement). Due to the generally low affinity of Kme reader domains for their cognate methylated substrates, it is not unexpected that other interactions may contribute to their localization to chromatin. As a result, we examined ternary complex formation between CBX7, DNA/RNA and our H3K27me3 competitive ligands, UNC3866 and UNC4976, as well as negative control, UNC4219. Utilizing FP we were able to generate data that could be quantitatively fit to the Stockton/Ehlert allosteric binding model, revealing that UNC4976 is a positive allosteric modulator of oligonucleotide binding, while UNC3866 is a silent allosteric modulator (SAM). EMSA data also supports the conclusion that only UNC4976 enhances oligonucleotide binding. We further explored the structural basis for PAM versus SAM behavior via MD simulations that revealed UNC4976 specific effects on the conformational ensemble of CBX7 that could specifically lead to enhanced nucleic acid binding.
Overall, a quantitative and target-specific cellular assay allowed us to discover and characterize the mechanism of action of the first potent PAM for CBX7, UNC4976. We propose that the enhanced cellular efficacy we observed across three orthogonal cellular assays is due to the PAM activity of UNC4976 simultaneously antagonizing H3K27me3-specific recruitment of CBX7 to target genes while increasing the non-specific affinity to DNA and RNA. This results in an equilibrium shift of CBX7-containing PRC1 away from H3K27me3 regions, as seen in our ChIP-seq data, and dilution across the genome, likely in a non-specific fashion. Moreover, this UNC4976-specific phenotype is achieved by a relatively modest structural change, in switching from N6,N6-diethyl (UNC3866) to N6-methyl-N6-norbornyl (UNC4976) substituents on the lysine amine. This phenomena of positive allosteric dilution of a chromatin reader domain could reflect an endogenous regulatory mechanism if non-histone lysine methylated proteins can also bind to CBX domains as PAMs to antagonize specific binding to H3K27me3 while enhancing nonspecific binding to nucleic acids. In this context, positive allosteric dilution could modulate the multivalent affinity of chromatin regulatory proteins and complexes and provide a mechanism for relocalization during dynamic, chromatin-templated processes.
STAR*METHODS
LEAD CONTACT AND MATERIALS AVAILABILITY
Further information and requests for resources and reagents should be directed to and will be fulfilled by the Lead Contact, Stephen Frye (svfrye@email.unc.edu).
EXPERIMENTAL MODEL AND SUBJECT DETAILS
Cell Lines
Generation of Polycomb in-vivo Assay in mouse Embryonic Stem Cell (mESC) and Culture Conditions
mESCs used in this study were derived from haploid mESCs available at Haplobank repository (Elling et al., 42017). CBX7 reporter mESCs with 12XZFHD1 DNA binding sites upstream of a CpG-less GFP reporter gene were generated by random integration of the DNA vector HFM009. mESCs were cultivated without feeders in high-glucose-DMEM (Sigma, D6429) supplemented with 13.5% fetal bovine serum (Gibco), 10 mM HEPES pH 7.4 (Corning, 25–060-CI), 2 mM GlutaMAX (Gibco, 35050-061), 1 mM Sodium Pyruvate (Gibco, 11360–070), 1% Penicillin/Streptomycin (Sigma, P0781), 1× non-essential amino acids (Gibco, 11140–050), 50 μM β-mercaptoethanol (Gibco, 21985–023) and recombinant LIF, and incubated at 37°C and 5% CO2. mESCs were passaged every 48 hours by trypsinization in 0.25% Trypsin-EDTA (1×) (Gibco, 25200–056) and seeding of 2.0 × 10⁶ cells on a 10 cm tissue culture plate (Genesee Scientific, #25–202).
GFP-HaloTag HeLa Cell Culture Conditions
HeLa cells stably expressing the HaloTag-GFP-Mito construct were provided by the Kritzer lab (Peraro et al., 2018). Cells were cultured in high-glucose-DMEM (Sigma, D6429) supplemented with 10% fetal bovine serum, 1% Penicillin/Streptomycin (Sigma, P0781) and 1 μg/mL Puromycin (InvivoGen, ant-pr) and incubated at 37°C and 5% CO2. Cells were passaged every 48–72 hours by trypsinization in 0.25% Trypsin-EDTA (1×) (Gibco, 25200–056) and seeding of 3.0 × 10⁶ cells on a T75 tissue culture plate.
PC3 Cell Culture Conditions
PC3 cells were obtained from ATCC (CRL-1435) through the UNC Lineberger Tissue Culture Facility and authenticated using STR analysis (ATCC, 135-XV). Cells were cultured in DMEM/Ham’s F12 (1:1) with additives of L-glutamine and 15 mM HEPES (Gibco, 11330–032) supplemented with 10% fetal bovine serum. Cells were passaged every 48–72 hours by trypsinization in 0.25% Trypsin-EDTA (1×) (Gibco, 25200–056) and seeding of 3.0 × 10⁶ cells on a T75 tissue culture plate.
HEK293 Cell Culture Conditions
HEK293 cells were obtained from ATCC (CRL-1573) and maintained using recommended culture conditions.
METHOD DETAILS
GFP Reporter Assay Compound Screening
Compounds were prepared at 10× final concentration from 10 mM or 50 mM DMSO stocks as a ten-point, three-fold dilution series, diluted into PBS buffer + 6% DMSO. 5 μL of each 10× stock was then added to a 384-well assay plate (Corning, 3764) in triplicate. mESCs were trypsinized in 0.25% Trypsin-EDTA, counted on a BioRad TC20 cell counter, and diluted to a density of 2,000 cells/45 μL. 45 μL of cell suspension per well was then plated on top of previously added 10× compound stocks to achieve a final 1× compound concentration + 0.6% DMSO, and assay plates were incubated for 48 hours at 37°C and 5% C O2. After 48 hours, cells were washed once in 50 μL of 1× PBS and trypsinized with 12.5 μL of clear 0.25% Trypsin-EDTA (5×) (Gibco, 15400–054) per well. Cells were incubated at 37°C a nd 5% CO2 for 15–20 min to ensure in complete dislodging of cells from the assay plate. Trypsin was then quenched with 12.5 μL of 50% FBS in 1× PBS. Flow cytometry was completed on an IntelliCyt iQue Screener PLUS equipped with ForeCyt acquisition software. Live, single cells were gated for GFP expression and data analysis was completed with FlowJo and GraphPad Prism 8 software.
CellTiter-Glo Viability Assay in mESCs
The effect of UNC4976, UNC3866, and UNC4219 on cell viability was determined using CellTiter-Glo (Promega #7573). Compound stocks at 50 mM in DMSO were diluted to 500 μM (or 5×) in PBS, yielding a DMSO concentration of 1%. A three-fold dilution series of ten total points was then generated in PBS + 1% DMSO. 5 μL of each 5× compound stock was plated in assay wells on a Corning 384-well, white-walled, clear-bottom, cell culture treated assay plate in technical triplicate. Mouse embryonic stem cells (mESCs) were harvested, counted, and diluted to a density of 5,000 cells/20 μL. 20 μL of cell suspension per well was added on top of pre-plated 5× compound stocks to generate 1× concentrations (0.2% DMSO). The assay plate was centrifuged for 30 s and then incubated for 48 hr at 37°C and 5% CO2. Wells without cells (media only) were included as negative controls. Following incubation at 37°C, the assay plate was equilibrated at room temperature along with the CellTiter-Glo reagent. 25 μL of CellTiter-Glo reagent was added to appropriate wells and the plate was centrifuged for 30 s. The assay plate was then placed on a plate shaker at room temperature for 2 min, and then allowed to equilibrate on a bench top for an additional 10 min. Luminescence was read on a PerkinElmer EnSpire Alpha Multimode Plate Reader.
Protein Expression and Purification
Expression constructs.
The chromodomains of CBX2 (residues 9–66 of NP_005180), CBX4 (residues 8–65 of NP_003646), CBX6 (residues 8–65 of NP_055107), CBX7 (residues 8–62 of NP_783640 and CDYL2 (residues 1–75 of NP_689555) were expressed with C-terminal His-tags in pET30 expression vectors. The chromodomain of CBX8 (residues 8–61 of NP_065700) was expressed with a N-terminal His-tag in a pET28 expression vector. A longer version of CBX7, residues 1–62, was expressed with a N-terminal GST-tag in a pGEX expression vector.
Protein expression and purification.
All expression constructs were transformed into Rosetta BL21(DE3)pLysS competent cells (Novagen, EMD Chemicals, San Diego, CA). Protein expression was induced by growing cells at 37 °C wi th shaking until the OD600 reached ~0.6–0.8 at which time the temperature was lowered to 18 °C and expression was induced by adding 0.5 mM IPTG and continuing shaking overnight. Cells were harvested by centrifugation and pellets were stored at −80 °C.
His-tagged proteins were purified by re-suspending thawed cell pellets in 30 ml of lysis buffer (50 mM sodium phosphate pH 7.2, 50 mM NaCl, 30 mM imidazole, 1× EDTA free protease inhibitor cocktail (Roche Diagnostics, Indianapolis, IN)) per liter of culture. Cells were lysed on ice by sonication with a Branson Digital 450 Sonifier (Branson Ultrasonics, Danbury, CT) at 40% amplitude for 12 cycles with each cycle consisting of a 20 s pulse followed by a 40 s rest. The cell lysate was clarified by centrifugation and loaded onto a HisTrap FF column (GE Healthcare, Piscataway, NJ) that had been pre-equilibrated with 10 column volumes of binding buffer (50 mM sodium phosphate, pH 7.2, 500 mM NaCl, 30mM imidazole) using an AKTA FPLC (GE Healthcare, Piscataway, NJ). The column was washed with 15 column volumes of binding buffer and protein was eluted in a linear gradient to 100% elution buffer (50 mM sodium phosphate, pH 7.2, 500 mM NaCl, 500 mM imidazole) over 20 column volumes. Peak fractions containing the desired protein were pooled and concentrated to 2 ml in Amicon Ultra-15 concentrators 3,000 molecular weight cut-off (Merck Millipore, Carrigtwohill Co. Cork IRL). Concentrated protein was loaded onto a HiLoad 26/60 Superdex 75 prep grade column (GE Healthcare, Piscataway, NJ) that had been pre-equilibrated with 1.2 column volumes of sizing buffer (25 mM Tris, pH 7.5, 250 mM NaCl, 2 mM DTT, 5% glycerol) using an ATKA Purifier (GE Healthcare, Piscataway, NJ). Protein was eluted isocratically in sizing buffer over 1.3 column volumes at a flow rate of 2 ml/min collecting 3-ml fractions. Peak fractions were analyzed for purity by SDS-PAGE and those containing pure protein were pooled and concentrated using Amicon Ultra-15 concentrators 3,000 molecular weight cut-off (Merck Millipore, Carrigtwohill Co. Cork IRL). Protein was exchanged into a buffer containing 25 mM Tris, pH 7.5, 150 mM NaCl, 2 mM β-mercaptoethanol before use in ITC.
GST-tagged proteins were purified by re-suspending thawed cell pellets in 30 ml of lysis buffer (1× PBS, 5 mM DTT, 1× EDTA free protease inhibitor cocktail (Roche Diagnostics, Indianapolis, IN)) per liter of culture. Cells were lysed on ice by sonication as described for His-tagged proteins. Clarified cell lysate was loaded onto a GSTrap FF column (GE Healthcare, Piscataway, NJ) that had been pre-equilibrated with 10 column volumes of binding buffer (1× PBS, 5mM DTT) using a AKTA FPLC (GE Healthcare, Piscataway, NJ). The column was washed with 10 column volumes of binding buffer and protein was eluted in 100% elution buffer (50 mM Tris, pH 7.5, 150 mM NaCl, 10 mM reduced glutathione) over 10 column volumes. Peak fractions containing the desired protein were pooled and concentrated to 2 ml in Amicon Ultra-15 concentrators, 10,000 molecular weight cut-off (Merck Millipore, Carrigtwohill Co. Cork IRL). Concentrated protein was loaded onto a HiLoad 26/60 Superdex 200 prep grade column (GE Healthcare, Piscataway, NJ) that had been pre-equilibrated with 1.2 column volumes of sizing buffer (25 mM Tris, pH 7.5, 250 mM NaCl, 2 mM DTT, 5% glycerol) using an ATKA FPLC (GE Healthcare, Piscataway, NJ). Protein was eluted isocratically in sizing buffer over 1.3 column volumes at a flow rate of 2 ml/min collecting 3-ml fractions. Peak fractions were analyzed for purity by SDS-PAGE and those containing pure protein were pooled and concentrated using Amicon Ultra-15 concentrators 10,000 molecular weight cut-off (Merck Millipore, Carrigtwohill Co. Cork IRL).
Affinity tag removal.
The N-terminal GST-tag was removed from the CBX7 proteins by HRV3C protease cleavage according to manufacturer’s recommendations (Pierce, Thermo Scientific, Rockford, IL). Briefly, purified protein was incubated with GST-tagged HRV3C protease at a final concentration of 2 units HRV3C protease per milligram tagged protein for 16 h at 4 °C. The cleavage reaction was loaded onto a HiLoad 26/60 Superdex 75 to separate tag free CBX7 from GST and any protein that still retained the GST-tag. Size exclusion was performed as described above except the sizing buffer was 25 mM Tris, pH 8.0, 150mM NaCl, 1mM DTT. Peak fractions were analyzed for purity by SDS-PAGE and those containing pure tag free CBX7 protein were pooled and concentrated using Amicon Ultra-15 concentrators 3,000 molecular weight cut-off (Merck Millipore, Carrigtwohill Co. Cork IRL).
Isothermal Titration Calorimetry (ITC) Experiments
All ITC measurements were recorded at 25 °C with an Auto-iTC200 isothermal titration calorimeter (MicroCal Inc., USA). All protein and compound stock samples were stored in ITC Buffer (25 mM Tris-HCl, pH 7.5, 150 mM NaCl, and 2 mM β-mercaptoethanol) and then diluted to achieve the desired concentrations. Typically, 50 μM protein and 0.5 mM compound were used; variations in these concentrations always maintained a 10:1 compound to protein ratio for all ITC experiments. The concentration of the protein stock solution was established using the Edelhoch method, whereas compound stock solutions were prepared based on mass. A typical experiment included a single 0.2 μl compound injection into a 200 μl cell filled with protein, followed by 26 subsequent 1.5 μl injections of compound. Injections were performed with a spacing of 180 s and a reference power of 8 cal/s. The initial data point was routinely deleted. The titration data was analyzed using Origin 7 Software (MicroCal Inc., USA) by nonlinear least-squares method, fitting the heats of binding as a function of the compound to protein ratio to a one site binding model.
Surface Plasmon Resonance (SPR) Experiments
SPR experiments were performed on a BioRad ProteOn XPR36 Interaction Array System. All compound stock solutions were diluted to desired final concentrations in SPR Buffer (20 mM Tris-HCl, pH 7.0, 150 mM NaCl, 0.005% Tween-20), and protein stock solutions were diluted into SPR Buffer supplemented with 1 mg/mL BSA. Biotinylated derivatives, UNC4195 (UNC3866) and UNC5355 (UNC5355) were made up as 150 nM stocks in SPR buffer, and immobilized at a flow rate of 30 μL/min and a contact time of 60 s onto a NeutrAvidin-containing ProteOn NLC sensor chip. Following a 30 min buffer blank in which SPR Buffer was switched to buffer supplemented with 1 mg/mL BSA, proteins (CBX2, CBX4, CBX6, CBX7, CBX8, CDYL2) were flowed at a rate of 50 μL/min with a contact time of 200 s and a dissociation time of 800 s. Regeneration of the sensor chip in 0.1% SDS/5mM NaOH was completed between each protein sample at a flow rate of 30 μL/min for 120 s. Double referencing subtraction was done with buffer and protein blank channels to account for nonspecific binding to the sensor chip. Data were fit to a two-state binding model in which ka and kd parameters were fit as grouped, ka2, kd2, and RI parameters were fit locally, and all other parameters were fit globally.
Chloroalkane Penetration Assay
GFP-HaloTag HeLa cells were seeded in a 384-well assay plate (Corning, 3764) at a density of 5,000 cells/well on the day before the experiment, and allowed to adhere overnight at 37°C and 5% CO2. On the day of the experiment, compounds were prepared on a separate 384-well plate at 1× final concentration from 10 mM DMSO stocks diluted into HeLa media (1% DMSO final concentration). Stocks were made up as a ten-point, three-fold dilution series in triplicate at a total volume of 60 μL per well. Media was then removed from the assay plate containing cells, and replenished with 50 μL of 1× compound stock. The assay plate was then incubated at 37°C and 5% CO2 for 4 hours. Media was removed, and cells were washed once with phenol-red free Opti-MEM (1×) (Gibco, 11058–021) and incubated at 37°C and 5% CO2 for 30 min. Media was again removed and replenished with 30 μL phenol-red free Opti-MEM supplemented with 5 mM HT-TAMRA (Promega, G8251), except for no HT-TAMRA control wells, which were replenished with 30 μL phenol-red free Opti-MEM alone. Cells were then incubated at 37°C and 5% CO2 for 30 min. Media was removed and cells were washed a final time with phenol-red free Opti-MEM, this time supplemented with 10% FBS + 1% Penicillin/Streptomycin, and incubated at 37°C and 5% CO2 for 30 min. Media was removed, and cells were washed once in 50 μL of 1× PBS and trypsinized with 12.5 μL of clear 0.25% Trypsin-EDTA (5×) (Gibco, 15400–054) per well. Cells were incubated at 37°C and 5% CO2 for 15–20 min to ensure in complete dislodging of cells from the assay plate. Trypsin was then quenched with 12.5 μL of 50% FBS in 1× PBS. Flow cytometry was completed on an IntelliCyt iQue Screener PLUS equipped with ForeCyt acquisition software. Live, single cells were gated first for GFP expression, and GFP positive cells were then analyzed for mean fluorescence intensity of TAMRA-HT dye by double normalization to a no dye sample (0% red signal) and dye only sample (100% red signal). Data analysis was completed with FlowJo and GraphPad Prism 8 software.
PC3 Pulldown Assays with Biotinylated Compounds
PC3 cells were cultured in T175 or T225 tissue culture flasks until reaching 80–90% confluency. Following trypsinization and centrifugation, the cell pellet was washed twice with 1× PBS and either flash frozen in LN2 and stored at −80°C, or lysed for immediate use. L ysis was completed in Cytobuster Protein Extraction Reagent (EMD Millipore, 71009) supplemented with 1× protease inhibitors (Roche) and Benzonase (25U/mL final concentration, Novogen 70746); the cell pellet was resuspended to a total volume of 500 μL lysis solution. Samples were incubated at 37 °C for 10 min, and then at RT for 20 min on a n end-to-end rotator. Samples were then centrifuged at RT at 14,000 RPM for 30 s, and supernatant was collected and transferred to a clean Eppendorf tube. Protein concentration was quantified by the Bradford protein assay. M-270 Streptavidin Dynabeads (Invitrogen) were used to immobilize biotinylated compounds for pulldowns. Prior to use, Dynabeads were washed 3 × 500 μL in TBST (20 mM Tris-HCl, pH 7.0, 150 mM NaCl, 0.1% Tween-20). UNC4195 or UNC5355 were then immobilized by rotating 30 μL of beads with a 20-fold excess of pulldown reagent, diluted to 150 μL in TBST, at RT for 30 min on an end-to-end rotator. Unbound pulldown reagent was then removed by washing the Dynabeads with 3 × 500μL of TBST. PC3 lysate, at 1000 μg protein per sample, was then transferred to an Eppendorf tube containing 30 μL of Dynabeads that had been pre-bound to UNC4195 or UNC5355, and the mixture was diluted to a final volume of 500 μL in TBST. Samples were incubated overnight at 4 °C on an end- to-end rotator. The following morning, the depleted lysate was removed and the beads were washed 3 × 500 μL of TBST. Beads were then re-suspended with 30 μL of MilliQ water/2× Laemmli sample buffer (BioRad, #1610737) (1:1) and heated at 95 °C for 3 min. Samples were t hen loaded into a BioRad Any kD Mini-PROTEAN TGX Stain-Free gel (12 well: #4569035, 15 well: #4569036) in BioRad 1× Tris/Glycine/SDS buffer (#1610772). Input samples used for western blotting were 1% of final protein concentration. Gels were run at RT for 30–40 min at 200V. Transfer was completed onto a PVDF membrane in 1× Tris/Glycine buffer (#1610771) at 4°C for 1 hour at 100V. Membranes were blocked for 45–60 min in Odyssey TBS Blocking Buffer (P/N:927–50000) and then incubated in TBST supplemented with the appropriate primary antibody overnight at 4°C on a plate rocker. The following morning, membranes were washed 3 × TBST, and incubated in TBST supplemented with the appropriate fluorescently-labeled secondary antibody at RT for 1 hour. Primary antibodies in this study include: CBX2 (Abcam, ab184968, 1:5000), CBX4 (Abcam, ab174300, 1:5000), CBX6 (Abcam, ab195235, 1:5000), CBX7 (Abcam, ab21873, 1:5000), CBX8 (Active Motif, #61237, 1:5000), RING1B (Abcam, ab101273, 1:2000), and BMI-1 (Active Motif, #39993, 1:5000). Secondary antibodies in this study were infrared labeled antibodies (LI-COR, #926–32211 and #926–68070, 1:10,000) and blots were imaged on a LICOR Odyssey imager.
Fluorescence Polarization (FP) Assays
All protein, DNA/RNA probe, and compound stocks were diluted to desired final concentrations in FP Buffer (25 mM Tris-HCl, pH 7.4, 100 mM NaCl, 0.05% Tween-20, 2 mM DTT) and all experiments were conducted in 384-well assay plates (Grenier, No: 784076). For compound titration experiments, an eight-point, three-fold dilution series was generated for all compounds starting at 100 μM. Compounds were incubated with 30 μM CBX7 and 100 nM DNA/RNA probe at a final reaction volume of 10 μL (0.2% DMSO). For all 1:3 compound to protein ratio titrations, an eight-point, three-fold dilution series was generated for CBX7 supplemented with all compounds starting at 300 μM CBX7 and 100 μM compound. Compound and CBX7 protein were serially diluted simultaneously to maintain a 1:3 ratio, respectively, and each mixture was incubated with 100 nM DNA/RNA probe at a final reaction volume of 10 μL (0.2% DMSO). All assay plates were incubated at RT for 30 min after assembly of reaction mixtures, and plates were analyzed on an LJLBiosystems Acquest 384•1536 plate reader. Data were interpreted using the Stockton-Ehlert allosteric binding model (Ehlert, 1988, 2005; Kenakin, 2005; Price et al., 2005; Stockton et al., 1983) and additional analysis was completed with GraphPad Prism 8.
Electrophoretic Mobility Shift Assays (EMSAs)
All protein, DNA probe, and compound stocks were diluted to desired final concentrations in EMSA Binding Buffer (25 mM Tris-HCl, pH 7.4, 100 mM NaCl, 0.05% Tween-20, 2 mM DTT). For protein titration experiments, a three-fold serial dilution series was generated for CBX7 starting at 500 μM protein. All protein samples were incubated with 100 nM DNA probe at a final reaction volume of 20 μL, on ice, for 20 min. For experiments with compound, 150 μM CBX7 was incubated with 100 nM DNA probe and either 50 μM or 150 μM compound (0.3% final DMSO concentration) at a final reaction volume of 20 μL, on ice, for 20 min. All samples were diluted 1:1 with 20% glycerol and loaded onto a Novex 10% Tris-glycine mini gel (XP00100BOX) and run in 1× Tris/glycine buffer (BioRad, #1610771) at 100V and 4°C for 90 min, in the dark. Gels were imaged on a Multi-DocIt Imaging System with Doc-ItLS software, using a blue light plate to visualize FAM-labeled DNA probe fluorescence. After imaging, gels were then stained with SimplyBlue SafeStain (Invitrogen, LC6065) at RT for 2 hours.
Chromatin Immunoprecipitation and quantitative PCR (ChIP-qPCR) and Next-Generation Sequencing (ChIP-seq) in mESCs
25×106 mES cells were collected, washed in once in 1× PBS and crosslinked with formaldehyde at a final concentration of 1 % for 7 min. The crosslinking was stopped on ice and with glycine at final 0.125 M concentration. The crosslinked cells were pelleted by centrifugation for 5 min at 1200g at 4 °C. Nuclei were prepared by washes with NP-Rinse buffer 1 (final: 10 mM Tris pH 8.0, 10 mM EDTA pH 8.0, 0.5 mM EGTA, 0.25% Triton X-100) followed by NP-Rinse buffer 2 (final: 10 mM Tris pH 8.0, 1 mM EDTA, 0.5 mM EGTA, 200 mM NaCl). Afterwards the cells were prepared for shearing by sonication by two washes with Covaris shearing buffer (final: 1 mM EDTA pH 8.0, 10 mM Tris-HCl pH 8.0, 0.1% SDS) and resuspension of the nuclei in 0.9 mL Covaris shearing buffer (with 1× protease inhibitors complete mini (Roche)). The nuclei were sonicated for 15 min (Duty factor 5.0; PIP 140.0; Cycles per Burst 200; at 4°C) in 1 ml Covaris glass cap tubes using a Covaris E220 High Performance Focused Ultrasonicator. Lysates were incubated in 1× IP buffer (final: 50 mM HEPES/KOH pH 7.5, 300 mM NaCl, 1 mM EDTA, 1% Triton X-100, 0.1% DOC, 0.1% SDS), with following antibodies at 4 °C on a rotating wheel: H3K27me3 (Diagenode, C15410195), Ring1B (Cell Signaling, D22F2), Suz12 (Cell Signaling, D39F6), Cbx7 (Abcam, ab21873), H2AK119ub (Cell Signaling, D27C4). ChIPs were washed 5× with 1× IP buffer (final: 50 mM HEPES/KOH pH 7.5, 300 mM NaCl, I mM EDTA, 1% Triton-X100, 0.1% DOC, 0.1% SDS), or 1.5× IP buffer for H3K27me3 and H2AK119ub1, followed by 3× with DOC buffer (10 mM Tris pH 8, 0.25 mM LiCl, 1 mM EDTA, 0.5% NP40, 0.5% DOC) and 1× with TE (+50 mM NaCl).
qPCR Analysis
The PCIA extracted IP DNA was precipitated and quantified using a homemade EvaGreen based qPCR mix on a CFX Connect Real-Time PCR Detection System (BioRad). qPCR primers are listed in Table S4. Data represent an average of at least two independent experiments.
Capture Probe Design
120nt-long MYbaits sequence capture probes (Arbor Biosciences) were custom designed for 24 genomic loci based on mm9 genome build. Designed probes were tiled at an approximate density of 1.26 (=starting approx. every 95bp) to cover a total of 1,960,734 bp. After repeat masking, candidate probes were filtered for stringent specificity. Sequence capture from genomic DNA recovered in ChIP was carried out according to manufacturer’s instructions.
ChIP-seq Library Preparation
Libraries were prepared using the NEXTflex ChIP-Seq kit (Bio Scientific) following the “No size-selection cleanup” protocol and doubling the incubation times for all enzymatic steps. Each sample of ChIPed DNA was end-repaired and ligated to unique barcoded adaptors to produce individual libraries. Libraries corresponding to samples to be directly compared to each other (e.g. +IAA vs -IAA) were pooled together and purified using 1 volume of Agencourt AMPure XP (Beckman Coulter). The pooled libraries were eluted with 25 μL of elution buffer (NEXTflex ChIP-Seq kit) and amplified using the KAPA Real-Time Library Amplification Kit (peqlab) following the kit instructions. Finally, the amplified libraries were size-selected to fragments of 200–800 bp by running them on 1.5% agarose gel, and staining with 1× SYBR Gold (Thermo Fisher) to visualize the DNA on a blue light LED screen and cut the appropriate fragments. The size selected libraries were gel purified with the Monarch DNA Gel extraction kit (NEB).
ChIP-seq and Capture-ChIP-seq Data Analysis
Processing and mapping of raw reads:
The raw reads of ChIP-seq and capture-seq were mapped to the customized genome using bowtie2 (Langmead and Salzberg, 2012). In addition, the unique mapped reads were retained and duplicated reads were discarded using SAMtools (Li et al., 2009).
Peak calling:
After merging biological replicates, peaks were called using MACS2 (Zhang et al., 2008) with -broad option and default q-value cutoff of 0.1 for both ChIP-seq and Capture-seq samples. In particular, only peaks within baits were retained for Capture-seq samples.
Data visualization:
For visualization, the coverage tracks (bigWig files) were generated with R package rtracklayer (Lawrence et al., 2009) and heatmaps were done with deepTools (Ramirez et al., 2016).
Differential binding analysis:
Read counts within peaks were first quantified with featureCounts function in R package Rsubread (Liao et al., 2013). The differential binding analysis were done with DESeq2 package (Love et al., 2014) in which the ChIP-seq samples were normalized by library sizes and capture-ChIP-seq samples were normalized by total read counts in the baits but excluding the Polycomb proteins binding regions (Martinez et al., in revision).
All ChIP-seq and Capture-ChIP-seq data represent an average of two independent experiments.
Molecular Dynamics and Docking
Molecular dynamics (MD) simulations for all three systems (CBX7, CBX7:UNC3866, and CBX7:UNC4976) were performed using the Gromacs 2018.2 simulation package with CHARMM22 protein force field (Vanommeslaeghe et al., 2010). The crystal structure of CBX7 in complex with UNC3866 (PDB: 5EPJ) (Stuckey et al., 2016a) was used as a structural template for building the CBX7:UNC4976 complex using the Maestro modeling suite (release 2016–2, Schrödinger, LLC: New York, NY). Both above structures served as starting points for MD simulations. CHARMM22 force field parameters for UNC3866 and UNC4976 were generated by Swissparam (Zoete et al., 2011). End caps were added to both termini of each protein. The protein complex was minimized in vacuum using steepest decent algorithm for 5,000 steps or until the maximum force of 1,000 kJ*mol−1*nm−1 was reached. The molecular systems were then solvated in TIP3P water (Mark and Nilsson, 2001), counterions were added to ensure the systems’ electric neutrality, and NaCl ions (0.15 M) were added by randomly replacing certain water molecules in order to mimic physiological conditions. An energy minimization with solvent was then performed, followed by a two-step equilibration: 5 ns in NVT ensemble at 310 K using the modified Berendsen thermostat (Berendsen et al., 1984) and 5 ns in NPT ensemble at 1 atm (and 310 K) using the Parinello-Rahman pressure coupling (Nosé and Klein, 1983). All simulations were conducted using the Leapfrog integrator in periodic boundary conditions. The particle mesh Ewald algorithm (Essmann et al., 1995) controlled the long-range electrostatic interactions. Bonds involving hydrogen atoms were constrained using the linear constraint solver algorithm (LINCS) (Hess et al., 1997). The production simulations were performed in NVT ensemble. For each of the three systems, three independent ~5 μs MD simulations were run. Molecular visualizations were produced using Maestro and PyMol [Schrodinger, LLC]. MD trajectories were clustered and analyzed by means of the Pipeline Pilot data processing environment (v. 18.1.100.11, BIOVIA, 3dsbiovia.com). The input data (sets of the protein’s atomic coordinates and the backbone ϕ and Ψ angles) were generated from the MD trajectories using custom Pipeline Pilot scripts (protein structures were centered and aligned using the Gromacs trjconv tool). The clustering technique used was k-means with Euclidian distance metrics. The cluster aggregation criteria were chosen so that root mean square distances (RMSD) between the cluster members would be on the order of 1 Å.
Protein-DNA docking calculations were performed using the HADDOCK web service (van Zundert et al., 2016; Wassenaar et al., 2012). Thirty protein structures were selected for docking from the MD trajectories of the three simulated systems (CBX7, CBX7:UNC3866, and CBX7:UNC4976). Ten selected structures, CBX7:UNC3866 complexes, belonged to UNC3866-specific clusters (that is, clusters including more than 72% of structural snapshots from CBX7:UNC3866 MD trajectories). Another set of ten structures were CBX7:UNC3866 complexes representing UNC4976-specific clusters. The third set of ten included ligand-free CBX7 representing non-ligand-specific clusters. The 3D structure of the DNA double helix (35 base pairs) was generated using the Discovery Studio 4.0 modeling suite (www.3dsbiovia.com). A set of default HADDOCK parameters was used for all docking simulations. The parameter file and all input and output HADDOCK files are available upon request.
HEK293 Chromatin Immunoprecipitation and Next Generation Sequencing (ChIP-seq)
ChIP-Seq were carried out as before (Cai et al., 2018; Lu et al., 2016; Xu et al., 2015b) and ChIP DNA samples submitted to the UNC-Chapel Hill High-Throughput Sequencing Facility (HTSF) for preparation of multiplexed libraries. Deep sequencing of multiplexed libraries was conducted with an Illumina High-Seq platform according to the manufacturer’s instructions. The detailed procedures of ChIP-Seq data analysis were described before (Cai et al., 2018; Lu et al., 2016; Xu et al., 2015b).
HEK293 RT-qPCR Analysis
HEK293 cells were treated with UNC4219, UNC3866 and UNC4976 at 6 μM and 20 μM for 2 days. Reverse transcription of RNA was performed using the High Capacity cDNA Reverse Transcription Kits (Applied Biosystems). PCR amplicon size (~100–150 bp) was designed using Primer 3 (http://bioinfo.ut.ee/primer3/). Quantitative PCR was performed in triplicate using SYBR green master mix reagent (BioRad) on an ABI 7900HT fast real-time PCR system. The detailed primer sequences for RT-qPCR are provided in Table S3. Datasets of the H2AK119ub1 ChIP-seq completed in HEK293 cells and utilized to determine Polycomb target genes were obtained from GEO: GSE34774. ChIP-seq data processing and visualization with the IGV browser were carried out as described before (Cai et al., 2018; Lu et al., 2016).
Synthesis of Compound Intermediates, Final Compounds and Labeled Final Compounds
(i). General procedures
Analytical LCMS data for all compounds were acquired using an Agilent 6110 Series system with the UV detector set to 220 nm and 254 nm. Samples were injected (10 μL) onto an Agilent Eclipse Plus 4.6 × 50 mm, 1.8 μm, C18 column at 25 °C. Mobile phases A (H2O + 0.1% acetic acid) and B (CH3OH + 0.1% acetic acid) were used with a linear gradient from 10% to 100% B in 5.0 min, followed by a flush at 100% B for another 2 minutes at a flow rate of 1.0 mL/min. Mass spectra (MS) data were acquired in positive ion mode using an Agilent 6110 single quadrupole mass spectrometer with an electrospray ionization (ESI) source. Nuclear Magnetic Resonance (NMR) spectra were recorded on a Varian Mercury spectrometer at 400 MHz for proton (1H NMR); chemical shifts are reported in ppm (σ) relative to residual protons in deuterated solvent peaks. Due to intramolecular hydrogen-bonding, hydrogen-deuterium exchange between the amide protons of the molecule and the deuterated solvent is slow and requires overnight equilibration for complete exchange. Normal phase column chromatography was performed with a Teledyne ISCO CombiFlash®Rf using silica RediSep®Rf columns with the UV detector set to 220 nm and 254 nm. The mobile phases used are indicated for each compound. Reverse phase column chromatography was performed with a Teledyne ISCO CombiFlash®Rf 200 using C18 RediSep®Rf Gold columns with the UV detector set to 220 nm and 254 nm. The mobile phases used are indicated for each compound. Preparative HPLC was performed using an Agilent Prep 1200 series with the UV detector set to 220 nm and 254 nm. Samples were injected onto a Phenomenex Luna 250 × 30 mm, 5 μm, C18 column at 25 °C. Mobile phases of A (H2O + 0.1% TFA) and B (CH3OH or CH3CN) were used with a flow rate of 40 mL/min. A general gradient of 0–15 minutes increasing from 10 to 100% B, followed by a 100% B flush for another 5 minutes was used. Small variations in this purification method were made as needed to achieve ideal separation for each compound. Analytical LCMS (at 220 nm and 254 nm) and 1HNMR were used to establish the purity of targeted compounds. All compounds that were evaluated in biochemical and biophysical assays had >95% purity as determined by LCMS and 1HNMR.
(ii). Synthesis of Peptide Intermediates, UNC3866, UNC4976 and KMe Mimetic Analogs
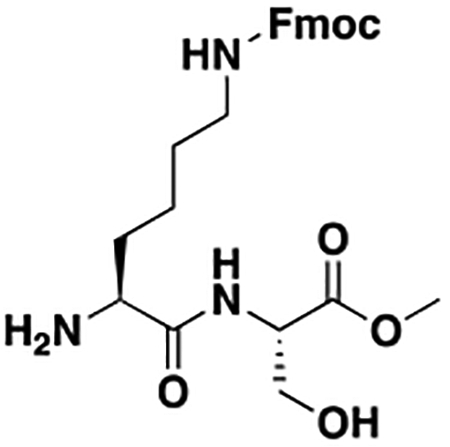
Methyl N6-(((9H-fluoren-9-yl)methoxy)carbonyl)-L-lysyl-L-serinate (Intermediate 1):
N6-(((9H-fluoren-9-yl)methoxy)carbonyl)-N2-(tert-butoxycarbonyl)-L-lysine (6.00 g, 1.00 Eq, 12.8 mmol), TBTU (4.93 g, 1.20 Eq, 15.4 mmol), and DIPEA (3.35 mL, 1.50 Eq, 19.2 mmol) were added to a 500 mL RB flask in DMF (20 mL) and DCM (200 mL) and stirred for 10 min to allow for pre-activation of the amino acid to be coupled. (S)-3-hydroxy-1-methoxy-1-oxopropan-2-aminium chloride (2.19 g, 1.10 Eq, 14.1 mmol) and DIPEA (3.35 mL, 1.50 Eq, 19.2 mmol) were added to a separate flask in 10 mL DMF to allow for neutralization of the HCl salt. After 10 min, contents of the second flask were added dropwise to the first flask and the reaction mixture was stirred for 16 hour at 25 °C. The reaction mixture was then concentrated under reduced pressure, re-dissolved in 50 mL of DCM, and combined with an equal portion of brine. Product was extracted with 3×100 mL DCM, dried over Na2SO4, and concentrated under reduced pressure. Concentrate was then dissolved in 100 mL DCM in a 250 mL RB flask, to which TFA (19.7 mL, 20.0 Eq, 256 mmol) was added. The reaction mixture was stirred at for 2 hour at 25 °C, and product formation was monitored by LCMS. Up on conversion of the Boc-protected intermediate to the deprotected product, the reaction mixture was concentrated under reduced pressure. Crude product was purified by reverse phase chromatography on a Flash Column ISCO using a (H2O+0.1% TFA):CH3OH gradient to yield 7.00 g (93.7% yield) of the TFA salt of the title compound as a clear oil.
1H NMR (400 MHz, Methanol-d4) δ 7.79 (d, J = 7.6 Hz, 2H), 7.64 (d, J = 7.5 Hz, 2H), 7.39 (t, J = 7.4 Hz, 2H), 7.31 (t, J = 7.4 Hz, 2H), 4.58 (t, J = 4.4 Hz, 1H), 4.36 (d, J = 6.8 Hz, 2H), 4.19 (t, J = 6.7 Hz, 1H), 3.98 – 3.90 (m, 2H), 3.83 (dd, J = 11.2, 3.9 Hz, 1H), 3.71 (s, 3H), 3.14 (t, J = 6.6 Hz, 2H), 2.00 – 1.25 (m, 6H). MSI (ESI): 470 [M+H]+. tR = 4.65 min.
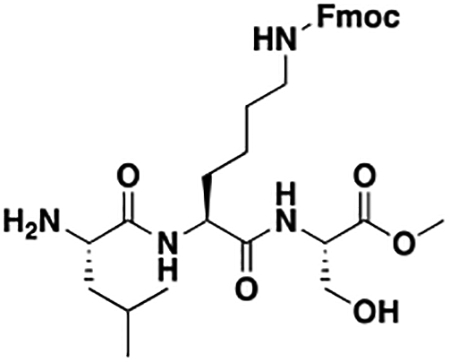
Methyl N6-(((9H-fluoren-9-yl)methoxy)carbonyl)-N2-(L-leucyl)-L-lysyl-L-serinate (Intermediate 2):
Boc-L-leucine (2.52 g, 0.95 Eq, 10.9 mmol), TBTU (4.42 g, 1.20 Eq, 13.8 mmol), and DIPEA (3.00 mL, 1.50 Eq, 17.2 mmol) were added to a 500 mL RB flask in DMF (20 mL) and DCM (200 mL) and stirred for 10 min to allow for pre-activation of the amino acid to be coupled. Intermediate 1 (6.70 g, 1.00 Eq, 11.5 mmol) and DIPEA (3.00 mL, 1.50 Eq, 17.2 mmol) were added to a separate flask in 10 mL DMF to allow for neutralization of the TFA salt. After 10 min, contents of the second flask were added dropwise to the first flask and the reaction mixture was stirred for 16 hour at 25 °C. The reaction mixture was then concentrated under reduced pressure, re-dissolved in 50 mL of DCM, and combined with an equal portion of brine. Product was extracted with 3×100 mL DCM, dried over Na2SO4, and concentrated under reduced pressure. Concentrate was then dissolved in 100 mL DCM in a 250 mL RB flask, to which TFA (17.7 mL, 20.0 Eq, 230 mmol) was added. The reaction mixture was stirred for 2 hour at 25 °C, and product formation was monitored by LCMS. Upon conversion of the Boc-protected intermediate to the deprotected product, the reaction mixture was concentrated under reduced pressure. Crude product was purified by reverse phase chromatography on a Flash Column ISCO using a (H2O+0.1% TFA):CH3OH gradient to yield 3.23 g (40.4% yield) of the TFA salt of the title compound as a clear oil.
1H NMR (400 MHz, Methanol-d4) δ 7.79 (d, J = 7.5 Hz, 2H), 7.63 (d, J = 7.4 Hz, 2H), 7.38 (t, J = 7.4 Hz, 2H), 7.30 (t, J = 7.4 Hz, 2H), 4.54 – 4.42 (m, 2H), 4.34 (d, J = 6.8 Hz, 2H), 4.19 (t, J = 6.8 Hz, 1H), 3.95 – 3.88 (m, 2H), 3.78 (dd, J = 11.3, 4.0 Hz, 1H), 3.72 (s, 3H), 3.12 (t, J = 6.7 Hz, 2H), 1.93 – 1.24 (m, 9H), 1.02 – 0.95 (m, 6H). MSI (ESI): 583 [M+H]+. tR = 4.83 min.
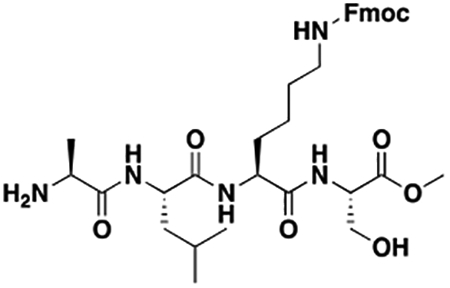
methyl N6-(((9H-fluoren-9-yl)methoxy)carbonyl)-N2-L-alanyl-L-leucyl-L-lysyl-L-serinate (Intermediate 3):
(tert-butoxycarbonyl)-L-alanine (560 mg, 0.95 Eq, 2.96 mmol), TBTU (1.10 g, 1.10 Eq, 3.43 mmol), and DIPEA (0.80 mL, 1.50 Eq, 4.67 mmol) were added to a 500 mL RB flask in DMF (20 mL) and DCM (200 mL) and stirred for 10 min to allow for pre-activation of the amino acid to be coupled. Intermediate 2 (2.17 g, 1.00 Eq, 3.11 mmol) and DIPEA (0.80 mL, 1.50 Eq, 4.67 mmol) were added to a separate flask in 10 mL DMF to allow for neutralization of the TFA salt. After 10 min, contents of the second flask were added dropwise to the first flask and the reaction mixture was stirred for 16 hour at 25 °C. The reaction mixture was then concentrated under reduced pressure, re-dissolved in 50 mL of DCM, and combined with an equal portion of brine. Product was extracted with 3×100 mL DCM, dried over Na2SO4, and concentrated under reduced pressure. Crude product was purified by normal phase chromatography on a Flash Column ISCO using a DCM:CH3OH gradient. Product fractions were then concentrated under reduced pressure. Concentrate was then dissolved in 50 mL DCM in a 100 mL RB flask, to which TFA (4.80 mL, 20.0 Eq, 62.3 mmol) was added. The reaction mixture was stirred for 2 hour at 25 °C, a nd product formation was monitored by LCMS. Upon conversion of the Boc-protected intermediate to the deprotected product, the reaction mixture was concentrated under reduced pressure. Crude product was purified by reverse phase chromatography on a Flash Column ISCO using a (H2O+0.1% TFA):CH3OH gradient to yield 2.01 g (84.1% yield) of the TFA salt of the title compound as a clear oil.
1H NMR (400 MHz, Methanol-d4) δ 7.80 (d, J = 7.5 Hz, 2H), 7.64 (d, J = 7.5 Hz, 2H), 7.39 (t, J = 7.4 Hz, 2H), 7.31 (t, J = 7.3 Hz, 2H), 4.53 – 4.33 (m, 5H), 4.20 (t, J = 6.8 Hz, 1H), 3.97 – 3.87 (m, 2H), 3.79 (dd, J = 11.3, 4.0 Hz, 1H), 3.72 (s, 3H), 3.12 (t, J = 5.2 Hz, 2H), 1.92 – 1.55 (m, 6H), 1.50 (d, J = 7.0 Hz, 3H), 1.46 – 1.25 (m, 3H), 1.00 – 0.91 (m, 6H). MSI (ESI): 654 [M+H]+. tR = 4.79 min.
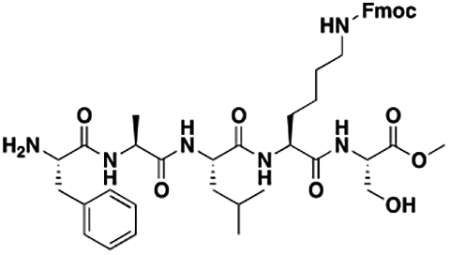
methyl N6-(((9H-fluoren-9-yl)methoxy)carbonyl)-N2-L-phenylalanyl-L-alanyl-L-leucyl-L-lysyl-L-serinate (Intermediate 4):
(tert-butoxycarbonyl)-L-phenylalanine (625 mg, 0.90 Eq, 2.36 mmol), TBTU (925 mg, 1.10 Eq, 2.88 mmol), and DIPEA (0.50 mL, 1.10 Eq, 2.88 mmol) were added to a 250 mL RB flask in DMF (10 mL) and DCM (100 mL) and stirred for 10 min to allow for pre-activation of the amino acid to be coupled. Intermediate 3 (2.01 g, 1.00 Eq, 2.62 mmol) and DIPEA (0.50 mL, 1.10 Eq, 2.88 mmol) were added to a separate flask in 10 mL DMF to allow for neutralization of the TFA salt. After 10 min, contents of the second flask were added dropwise to the first flask and the reaction mixture was stirred for 16 hour at 25 °C. The reaction mixture was then concentrated under reduced pressure, re-dissolved in 50 mL of DCM, and combined with an equal portion of brine. Product was extracted with 3×100 mL DCM, dried over Na2SO4, and concentrated under reduced pressure. Crude product was purified by normal phase chromatography on a Flash Column ISCO using a DCM:CH3OH gradient. Product fractions were concentrated under reduced pressure. Concentrate was then dissolved in 100 mL DCM in a 250 mL RB flask, to which TFA (4.04 mL, 20.0 Eq, 52.4 mmol) was added. The reaction mixture was stirred for 2 hour at 25 °C, a nd product formation was monitored by LCMS. Upon conversion of the Boc-protected intermediate to the deprotected product, the reaction mixture was concentrated under reduced pressure. Crude product was purified by reverse phase chromatography on a Flash Column ISCO using a (H2O+0.1% TFA):CH3OH gradient to yield 1.51 g (63.0% yield) of the TFA salt of the title compound as a clear oil.
1H NMR (400 MHz, Methanol-d4) δ 7.78 (d, J = 7.6 Hz, 2H), 7.62 (d, J = 7.5 Hz, 2H), 7.41 – 7.23 (m, 9H), 4.52 – 4.38 (m, 4H), 4.32 (d, J = 6.9 Hz, 2H), 4.17 (t, J = 6.9 Hz, 1H), 4.10 (dd, J = 8.7, 5.2 Hz, 1H), 3.90 (dd, J = 11.3, 4.6 Hz, 1H), 3.78 (dd, J = 11.3, 4.0 Hz, 1H), 3.71 (s, 3H), 3.26 (dd, J = 5.1 Hz, 1H), 3.11 (t, J = 7.0 Hz, 2H), 2.98 (dd, J = 14.3, 8.8 Hz, 1H), 1.91 – 1.40 (m, 9H), 1.38 (d, J = 7.1 Hz, 3H), 1.00 – 0.91 (m, 6H). MSI (ESI): 801 [M+H]+. tR = 5.37 min.
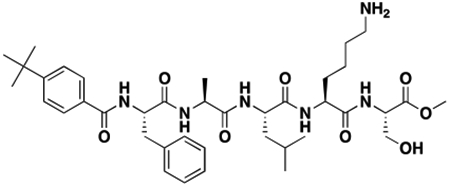
methyl (4-(tert-butyl)benzoyl)-L-phenylalanyl-L-alanyl-L-leucyl-L-lysyl-L-serinate (Intermediate 5):
4-(tert-butyl)benzoic acid (429 mg, 1.10 Eq, 2.40 mmol), TBTU (842 mg, 1.20 Eq, 2.62 mmol), and DIPEA (0.42 mL, 1.10 Eq, 2.41 mmol) were added to a 250 mL RB flask in DMF (10 mL) and DCM (100 mL) and stirred for 10 min to allow for pre-activation of the amino acid to be coupled. Intermediate 4 (2.00 g, 1.00 Eq, 2.19 mmol) and DIPEA (0.42 mL, 1.10 Eq, 2.41 mmol) were added to a separate flask in 10 mL DMF to allow for neutralization of the TFA salt. After 10 min, contents of the second flask were added dropwise to the first flask and the reaction mixture was stirred for 16 hour at 25 °C. The reaction mixture was then concentrated under reduced pressure, re-dissolved in 50 mL of DCM, and combined with an equal portion of brine. Product was extracted with 3×100 mL DCM, dried over Na2SO4, and concentrated under reduced pressure. Crude product was purified by normal phase chromatography on a Flash Column ISCO using a DCM:CH3OH gradient. Product fractions were concentrated under reduced pressure. Concentrate was then dissolved in 50 mL DMF in a 250 mL RB flask, to which piperidine (4.30 mL, 20.0 Eq, 43.7 mmol) was added. The reaction mixture was stirred for 16 hour at 25 °C, and produ ct formation was monitored by LCMS. Upon conversion of the Fmoc-protected intermediate to the deprotected product, the reaction mixture was concentrated under reduced pressure. Crude product was purified by reverse phase chromatography on a Flash Column ISCO using a (H2O+0.1% TFA):CH3OH gradient to yield 1.28 g (68.6% yield) of the TFA salt of the title compound as a clear oil.
1H NMR (400 MHz, Methanol-d4) δ 7.70 (d, J = 8.5 Hz, 2H), 7.48 (d, J = 8.5 Hz, 2H), 7.33 – 7.26 (m, 4H), 7.24 – 7.18 (m, 1H), 4.73 (dd, J = 9.3, 5.6 Hz, 1H), 4.58 (s, 1H), 4.52 – 4.27 (m, 4H), 3.91 (dd, J = 11.4, 4.6 Hz, 1H), 3.79 (dd, J = 11.3, 3.8 Hz, 1H), 3.74 (s, 3H), 3.26 (dd, J = 13.9, 5.6 Hz, 1H), 3.10 (dd, J = 13.9, 9.3 Hz, 1H), 2.92 (t, J = 7.5 Hz, 2H), 1.95 – 1.44 (m, 9H), 1.37 (d, J = 7.2 Hz, 3H), 1.33 (s, 9H), 0.95 – 0.89 (m, 6H).
MSI (ESI): 739 [M+H]+. tR = 5.31 min.
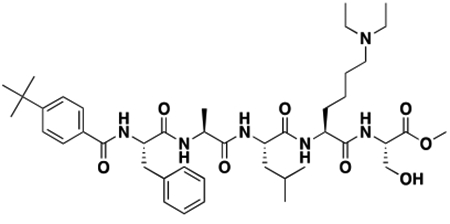
methyl N2-(4-(tert-butyl)benzoyl)-L-phenylalanyl-L-alanyl-L-leucyl-N6,N6-diethyl-L-lysyl-L-serinate (UNC3866):
Intermediate 5 (40 mg, 1.0 Eq, 47 μmol) was dissolved in CH3OH (10 mL) in a 20 mL scintillation vial, to which acetaldehyde (7.9 μL, 3.0 Eq, 0.14 mmol) and sodium cyanoborohydride (15 mg, 5.0 Eq, 0.23 mmol) were added. The reaction was stirred for 16 hour at 25 °C, and conversion to the di-substituted lysine product was monitored by LCMS. Upon complete conversion to the di-substituted lysine final product, the reaction mixture was concentrated under reduced pressure. Crude product was purified by normal phase chromatography on a Flash Column ISCO using a DCM:CH3OH gradient (to remove excess reducing agent and prevent methyl ester hydrolysis). Product fractions were concentrated under reduced pressure and subsequently purified by reverse phase chromatography on a Flash Column ISCO using a (H2O+0.1% TFA):CH3OH gradient to yield 25.5 mg (60% yield) of the TFA salt of the title compound as a clear oil.
1H NMR (400 MHz, Methanol-d4) δ 7.71 (d, J = 8.5 Hz, 2H), 7.48 (d, J = 8.6 Hz, 2H), 7.34 – 7.26 (m, 4H), 7.24 – 7.19 (m, 1H), 4.73 (dd, J = 9.3, 5.5 Hz, 1H), 4.52 – 4.28 (m, 4H), 3.91 (dd, J = 11.4, 4.6 Hz, 1H), 3.79 (dd, J = 11.4, 3.9 Hz, 1H), 3.74 (s, 3H), 3.30 – 3.04 (m, 8H), 2.00 – 1.42 (m, 9H), 1.38 (d, J = 7.2 Hz, 3H), 1.33 (s, 9H), 1.27 (t, J = 7.3 Hz, 6H), 0.92 (t, 6H). MSI (ESI): 795 [M+H]+. tR = 5.24 min.
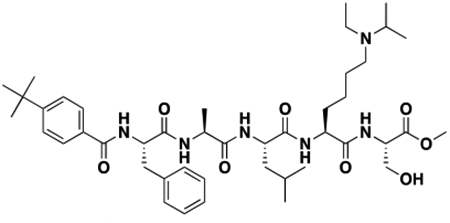
methyl N2-(4-(tert-butyl)benzoyl)-L-phenylalanyl-L-alanyl-L-leucyl-N6-ethyl-N6-isopropyl-L-lysyl-L-serinate (UNC4941):
Intermediate 5 (20 mg, 1.0 Eq, 23 μmol) was dissolved in CH3OH (5 mL) in a 20 mL scintillation vial, to which acetone (17 μL, 10 Eq, 0.23 mmol) and sodium cyanoborohydride (7.4 mg, 5.0 Eq, 0.12 mmol) were added. The reaction was stirred for 16 hour at 25 °C, at which point conversion to the mon o-substituted lysine intermediate was monitored by LCMS. After complete conversion to the mono-substituted lysine intermediate, acetaldehyde (10 mg, 10 Eq, 0.23 mmol) was added. The reaction was stirred for an additional 2 hour at 25 °C, and conversion to the di-substituted lysine product was monitored by LCMS. Upon complete conversion to the di-substituted lysine final product, the reaction mixture was concentrated under reduced pressure. Crude product was purified by normal phase chromatography on a Flash Column ISCO using a DCM:CH3OH gradient (to remove excess reducing agent and prevent methyl ester hydrolysis). Product fractions were concentrated under reduced pressure and subsequently purified by reverse phase chromatography on a Flash Column ISCO using a (H2O+0.1% TFA):CH3OH gradient to yield 10.6 mg (49% yield) of the TFA salt of the title compound as a clear oil.
1H NMR (400 MHz, Methanol-d4) δ 7.71 (d, J = 8.4 Hz, 2H), 7.48 (d, J = 8.5 Hz, 2H), 7.33 – 7.26 (m, 4H), 7.24 – 7.18 (m, 1H), 4.72 (dd, J = 9.3, 5.5 Hz, 1H), 4.53 – 4.27 (m, 4H), 3.91 (dd, J = 11.4, 4.6 Hz, 1H), 3.79 (dd, J = 11.4, 3.9 Hz, 1H), 3.74 (s, 3H), 3.66 (p, J = 6.5 Hz, 1H), 3.30 – 2.94 (m, 6H), 2.00 – 1.44 (m, 10H), 1.37 (d, J = 7.2 Hz, 3H), 1.33 (s, 9H), 1.30 (s, 9H), 0.95 – 0.89 (m, 6H). MSI (ESI): 809 [M+H]+. TR = 5.00 min.
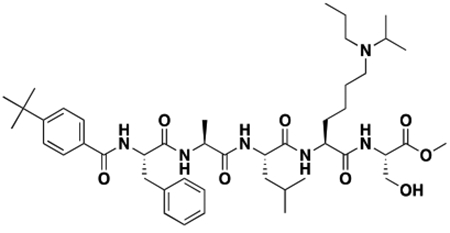
methyl N2-(4-(tert-butyl)benzoyl)-L-phenylalanyl-L-alanyl-L-leucyl-N6-isopropyl-N6-propyl-L-lysyl-L-serinate (UNC4971):
Intermediate 5 (20 mg, 1.0 Eq, 23 μmol) was dissolved in CH3OH (5 mL) in a 20 mL scintillation vial, to which acetone (17 μL, 10 Eq, 0.23 mmol) and sodium cyanoborohydride (7.4 mg, 5.0 Eq, 0.12 mmol) were added. The reaction was stirred for 16 hour at 25 °C, at which point co nversion to the mono-substituted lysine intermediate was monitored by LCMS. After complete conversion to the mono-substituted lysine intermediate, propionaldehyde (17 μL, 10 Eq, 0.23 mmol) was added. The reaction was stirred for an additional 16 hour at 25 °C, and conversion to the di-substituted lysine product was monitored by LCMS. Upon complete conversion to the di-substituted lysine final product, the reaction mixture was concentrated under reduced pressure. Crude product was purified by normal phase chromatography on a Flash Column ISCO using a DCM:CH3OH gradient (to remove excess reducing agent and prevent methyl ester hydrolysis). Product fractions were concentrated under reduced pressure and subsequently purified by reverse phase chromatography on a Flash Column ISCO using a (H2O+0.1% TFA):CH3OH gradient to yield 9.2 mg (42% yield) of the TFA salt of the title compound as a clear oil.
1H NMR (400 MHz, Methanol-d4) δ 7.71 (d, J = 8.4 Hz, 2H), 7.48 (d, J = 8.5 Hz, 2H), 7.34 – 7.26 (m, 4H), 7.24 – 7.18 (m, 1H), 4.72 (dd, J = 9.2, 5.5 Hz, 1H), 4.52 – 4.26 (m, 4H), 3.91 (dd, J = 11.4, 4.6 Hz, 1H), 3.79 (dd, J = 11.4, 3.9 Hz, 1H), 3.74 (s, 3H), 3.65 (p, J = 6.6 Hz, 1H), 3.26 (dd, J = 13.9, 5.5 Hz, 1H), 3.18 – 2.91 (m, 5H), 1.98 – 1.43 (m, 10H), 1.37 (d, J = 7.2 Hz, 3H), 1.33 (s, 9H), 1.30 (s, 8H), 0.99 (td, J = 7.3, 2.6 Hz, 3H), 0.95 – 0.89 (m, 6H). MSI (ESI): 823 [M+H]+. TR = 5.07 min.
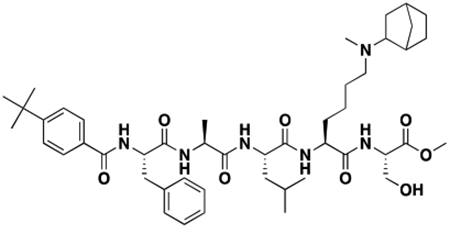
methyl N6-(bicyclo[2.2.1]heptan-2-yl)-N2-(4-(tert-butyl)benzoyl)-L-phenylalanyl-L-alanyl-L-leucyl-N6-methyl-L-lysyl-L-serinate (UNC4976):
Intermediate 5 (225 mg, 1.00 Eq, 264 μmol) was dissolved in CH3OH (50 mL) in a 250 mL RB flask, to which Bicyclo[2.2.1]hentan-2-one (581 mg, 20.0 Eq, 5.28 mmol) and sodium cyanoborohydride (166 mg, 10.0 Eq, 2.64 mmol) were added. The reaction was stirred for 16 hour at 25 °C, at which point conversion to the mono-substituted lysine intermediate was monitored by LCMS. After complete conversion to the mono-substituted lysine intermediate, formaldehyde (10.0 Eq, 2.64 mmol) and sodium cyanoborohydride (166 mg, 10.0 Eq, 2.64 mmol) were added. The reaction was stirred for an additional 1 hour at 25 °C, and conversion to the di-substituted lysine product was monitored by LCMS. Upon complete conversion to the di-substituted lysine final product, the reaction mixture was concentrated under reduced pressure. Crude product was purified by normal phase chromatography on a Flash Column ISCO using a DCM:CH3OH gradient (to remove excess reducing agent and prevent methyl ester hydrolysis). Product fractions were concentrated under reduced pressure and subsequently purified by reverse phase chromatography on a Flash Column ISCO using a (H2O+0.1% TFA):CH3OH gradient to yield 165 mg (65.1% yield) of the TFA salt of the title compound as a clear oil.
1H NMR (400 MHz, Methanol-d4) δ 7.71 (d, J = 8.4 Hz, 2H), 7.49 (d, J = 8.5 Hz, 2H), 7.34 – 7.26 (m, 4H), 7.25 – 7.19 (m, 1H), 4.75 – 4.69 (m, 1H), 4.52 – 4.26 (m, 4H), 3.91 (dd, J = 11.4, 4.6 Hz, 1H), 3.79 (dd, J = 11.4, 3.9 Hz, 1H), 3.74 (s, 3H), 3.47 – 3.36 (m, 1H), 3.30 – 2.92 (m, 5H), 2.85 – 2.69 (m, 3H), 2.67 – 2.53 (m, 1H), 2.43 – 2.25 (m, 1H), 2.15 – 2.01 (m, 1H), 2.01 – 1.41 (m, 16H), 1.38 (d, J = 7.2 Hz, 3H), 1.33 (s, 9H), 1.23 – 1.04 (m, 2H), 0.95 – 0.88 (m, 6H). MSI (ESI): 847 [M+H]+. tR = 5.23 min.
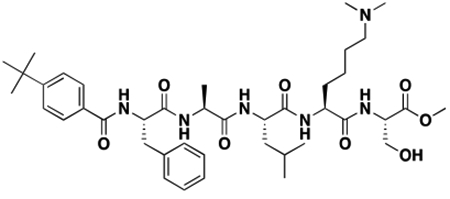
methyl N2-(4-(tert-butyl)benzoyl)-L-phenylalanyl-L-alanyl-L-leucyl-N6,N6-dimethyl-L-lysyl-L-serinate (UNC5352):
Intermediate 5 (26 mg, 1.0 Eq, 30 μmol) was dissolved in CH3OH (5 mL) in a 20 mL scintillation vial, to which formaldehyde (5.0 Eq, 0.15 mmol) and sodium cyanoborohydride (9.6 mg, 5.0 Eq, 0.15 mmol) were added. The reaction was stirred for 2 hour at 25 °C, at which point conversion to the di- substituted lysine product was monitored by LCMS. Upon complete conversion to the di-substituted lysine final product, the reaction mixture was concentrated under reduced pressure. Crude product was purified by normal phase chromatography on a Flash Column ISCO using a DCM:CH3OH gradient (to remove excess reducing agent and prevent methyl ester hydrolysis). Product fractions were concentrated under reduced pressure and subsequently purified by reverse phase chromatography on a Flash Column ISCO using a (H2O+0.1% TFA):CH3OH gradient to yield 8.9 mg (33% yield) of the TFA salt of the title compound as a clear oil.
1H NMR (400 MHz, Methanol-d4) δ 7.70 (d, J = 8.5 Hz, 2H), 7.49 (d, 2H), 7.33 – 7.26 (m, 4H), 7.24 – 7.19 (m, 1H), 4.72 (dd, J = 9.2, 5.6 Hz, 1H), 4.52 – 4.26 (m, 4H), 3.91 (dd, J = 11.3, 4.6 Hz, 1H), 3.79 (dd, J = 11.3, 3.9 Hz, 1H), 3.74 (s, 3H), 3.27 (dd, J = 14.0, 5.7 Hz, 1H), 3.14 – 3.06 (m, 3H), 2.85 (s, 6H), 1.99 – 1.42 (m, 10H), 1.38 (d, J = 7.2 Hz, 3H), 1.33 (s, 9H), 0.96 – 0.89 (m, 6H). MSI (ESI): 767 [M+H]+. TR = 4.89 min.
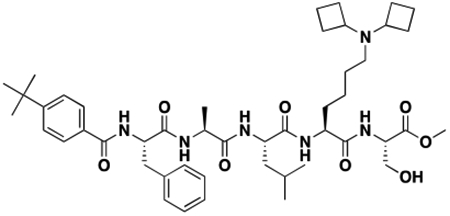
methyl N2-(4-(tert-butyl)benzoyl)-L-phenylalanyl-L-alanyl-L-leucyl-N6,N6-dicyclobutyl-L-lysyl-L-serinate (UNC6370):
Intermediate 5 (20 mg, 1.0 Eq, 23 μmol) was dissolved in CH3OH (5 mL) in a 20 mL scintillation vial, to which cyclobutanone (18 μL, 10 Eq, 0.23 mmol) and sodium cyanoborohydride (7.4 mg, 5.0 Eq, 0.12 mmol) were added. The reaction was stirred for 24 hour at 25 °C, at which point conversion to both the mono-substituted lysine intermediate and a di-substituted lysine product was observed by LCMS. Additional cyclobutanone (18 μL, 10 Eq, 0.23 mmol) was added, and the reaction was stirred for an additional 96 hour at 25 °C. Upon complete conversion to the di-substituted lysine final product, the reaction mixture was concentrated under reduced pressure. Crude product was purified by normal phase chromatography on a Flash Column ISCO using a DCM:CH3OH gradient (to remove excess reducing agent and prevent methyl ester hydrolysis). Product fractions were concentrated under reduced pressure and subsequently purified by reverse phase chromatography on a Flash Column ISCO using a (H2O+0.1% TFA):CH3OH gradient to yield 17.7 mg (79% yield) of the TFA salt of the title compound as a clear oil
1H NMR (400 MHz, Methanol-d4) δ 7.71 (d, J = 8.3 Hz, 2H), 7.48 (d, J = 8.4 Hz, 2H), 7.35 – 7.26 (m, 4H), 7.25 – 7.19 (m, 1H), 4.72 (dd, J = 9.4, 5.5 Hz, 1H), 4.53 – 4.25 (m, 4H), 3.91 (dd, J = 11.4, 4.6 Hz, 1H), 3.80 (dd, 1H), 3.73 (s, 3H), 3.26 (dd, J = 13.9, 5.3 Hz, 1H), 3.17 – 3.07 (m, 1H), 2.97 – 2.89 (m, 2H), 2.35 – 2.17 (m, 7H), 1.97 – 1.40 (m, 14H), 1.37 (d, J = 7.2 Hz, 3H), 1.33 (s, 9H), 1.30 (s, 5H), 0.92 (m, 6H). MSI (ESI): 847 [M+H]+. TR = 4.99 min.
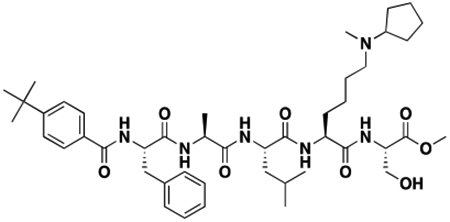
methyl N2-(4-(tert-butyl)benzoyl)-L-phenylalanyl-L-alanyl-L-leucyl-N6-cyclopentyl-N6-methyl-L-lysyl-L-serinate (UNC6371):
Intermediate 5 (20 mg, 1.0 Eq, 23 μmol) was dissolved in CH3OH (5 mL) in a 20 mL scintillation vial, to which cyclopentanone (21 μL, 10 Eq, 0.23 mmol) and sodium cyanoborohydride (7.4 mg, 5.0 Eq, 0.12 mmol) were added. The reaction was stirred for 24 hour at 25 °C, at which point conversion to the mono-substituted lysine intermediate was monitored by LCMS. After complete conversion to the mono-substituted lysine intermediate, formaldehyde (10 Eq, 0.23 mmol) was added. The reaction was stirred for an additional 1 hour at 25 °C, and conversion to the di-substituted lysine product was monitored by LCMS. Upon complete conversion to the di-substituted lysine final product, the reaction mixture was concentrated under reduced pressure. Crude product was purified by normal phase chromatography on a Flash Column ISCO using a DCM:CH3OH gradient (to remove excess reducing agent and prevent methyl ester hydrolysis). Product fractions were concentrated under reduced pressure and subsequently purified by reverse phase chromatography on a Flash Column ISCO using a (H2O+0.1% TFA):CH3OH gradient to yield 6.5 mg (30% yield) of the TFA salt of the title compound as a clear oil.
1H NMR (400 MHz, Methanol-d4) δ 7.71 (d, J = 8.4 Hz, 2H), 7.49 (d, J = 8.5 Hz, 2H), 7.34 – 7.26 (m, 4H), 7.24 – 7.19 (m, 1H), 4.72 (td, J = 7.8, 2.1 Hz, 1H), 4.52 – 4.26 (m, 4H), 3.91 (dd, J = 11.4, 4.6 Hz, 1H), 3.79 (dd, J = 11.4, 3.9 Hz, 1H), 3.74 (s, 3H), 3.63 – 3.53 (m, 1H), 3.30 – 2.96 (m, 4H), 2.80 (s, 3H), 2.14 – 2.03 (m, 2H), 1.98 – 1.43 (m, 16H), 1.38 (d, J = 7.2 Hz, 3H), 1.33 (s, 9H), 0.92 (m, 6H). MSI (ESI): 821 [M+H]+. TR = 5.07 min.
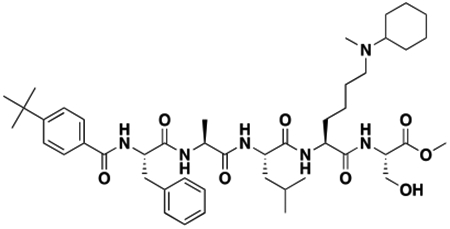
methyl N2-(4-(tert-butyl)benzoyl)-L-phenylalanyl-L-alanyl-L-leucyl-N6-cyclohexyl-N6-methyl-L-lysyl-L-serinate (UNC6372):
Intermediate 5 (20 mg, 1.0 Eq, 23 μmol) was dissolved in CH3OH (5 mL) in a 20 mL scintillation vial, to which cyclohexanone (24 μL, 10 Eq, 0.23 mmol) and sodium cyanoborohydride (7.4 mg, 5.0 Eq, 0.12 mmol) were added. The reaction was stirred for 16 hour at 25 °C, at which point conversion to the mono-substituted lysine intermediate was monitored by LCMS. After complete conversion to the mono-substituted lysine intermediate, formaldehyde (10 Eq, 0.23 mmol) was added. The reaction was stirred for an additional 1 hour at 25 °C, and conversion to the di-substituted lysine product was monitored by LCMS. Upon complete conversion to the di-substituted lysine final product, the reaction mixture was concentrated under reduced pressure. Crude product was purified by normal phase chromatography on a Flash Column ISCO using a DCM:CH3OH gradient (to remove excess reducing agent and prevent methyl ester hydrolysis). Product fractions were concentrated under reduced pressure and subsequently purified by reverse phase chromatography on a Flash Column ISCO using a (H2O+0.1% TFA):CH3OH gradient to yield 2.5 mg (11% yield) of the TFA salt of the title compound as a clear oil.
1H NMR (400 MHz, Methanol-d4) δ 7.71 (d, J = 8.4 Hz, 2H), 7.49 (d, J = 8.5 Hz, 2H), 7.34 – 7.26 (m, 4H), 7.25 – 7.19 (m, 1H), 4.71 (dd, J = 9.3, 5.5 Hz, 1H), 4.53 – 4.25 (m, 5H), 3.91 (dd, J = 11.4, 4.6 Hz, 1H), 3.79 (dd, J = 11.4, 3.9 Hz, 1H), 3.74 (s, 3H), 3.28 – 3.06 (m, 4H), 2.76 (s, 3H), 2.02 – 1.42 (m, 18H), 1.38 (d, J = 7.2 Hz, 3H), 1.33 (s, 9H), 1.24 – 1.14 (m, 1H), 0.95 – 0.89 (m, 6H). MSI (ESI): 835 [M+H]+. TR = 5.20 min.
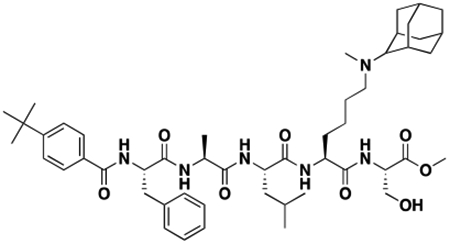
methyl N6-((1S,3S,5S,7S)-adamantan-2-yl)-N2-(4-(tert-butyl)benzoyl)-L-phenylalanyl-L-alanyl-L-leucyl-N6-methyl-L-lysyl-L-serinate (UNC6373):
Intermediate 5 (20 mg, 1.0 Eq, 23 μmol) was dissolved in CH3OH (5 mL) in a 20 mL scintillation vial, to which (1r,3r,5r,7r)-adamantan-2-one (35 mg, 10 Eq, 0.23 mmol) and sodium cyanoborohydride (7.4 mg, 5.0 Eq, 0.12 mmol) were added. The reaction was stirred for 24 hour at 45 °C, at which point conversion to the mono-substituted lysine intermediate was monitored by LCMS. After complete conversion to the mono-substituted lysine intermediate, formaldehyde (10 Eq, 0.23 mmol) was added. The reaction was stirred for an additional 1 hour at 25 °C, and conversion to the di-substituted lysine product was monitored by LCMS. Upon complete conversion to the di-substituted lysine final product, the reaction mixture was concentrated under reduced pressure. Crude product was purified by normal phase chromatography on a Flash Column ISCO using a DCM:CH3OH gradient (to remove excess reducing agent and prevent methyl ester hydrolysis). Product fractions were concentrated under reduced pressure and subsequently purified by reverse phase chromatography on a Flash Column ISCO using a (H2O+0.1% TFA):CH3OH gradient to yield 3.3 mg (14% yield) of the TFA salt of the title compound as a clear oil.
1H NMR (400 MHz, Methanol-d4) δ 7.75 – 7.69 (m, 2H), 7.52 – 7.46 (m, 2H), 7.33 – 7.26 (m, 4H), 7.25 – 7.19 (m, 1H), 4.69 (dq, J = 9.7, 4.7, 4.3 Hz, 1H), 4.53 – 4.24 (m, 4H), 3.91 (dd, J = 11.3, 4.6 Hz, 1H), 3.78 (dd, J = 11.4, 4.0 Hz, 1H), 3.74 (s, 3H), 3.29 – 3.06 (m, 4H), 2.87 (s, 3H), 2.36 – 2.23 (m, 2H), 2.06 – 1.41 (m, 22H), 1.37 (d, J = 7.2 Hz, 3H), 1.33 (s, 9H), 0.96 – 0.89 (m, 6H). MSI (ESI): 887 [M+H]+. TR = 5.29 min.
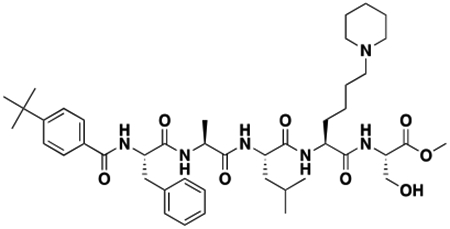
methyl ((S)-2-((S)-2-((S)-2-((S)-2-(4-(tert-butyl)benzamido)-3-phenylpropanamido) propanamido)-4-methylpentanamido)-6-(piperidin-1-yl)hexanoyl)-L-serinate (UNC6374):
Intermediate 5 (20 mg, 1.0 Eq, 23 μmol) was dissolved in CH3OH (12 mL) in a 20 mL scintillation vial, to which glutaraldehyde (12 mg, 5.0 Eq, 0.12 mmol) and sodium cyanoborohydride (7.4 mg, 5.0 Eq, 0.12 mmol) were added. The reaction was stirred for 16 hour at 25 °C, at which point conversion to the di- substituted lysine intermediate was monitored by LCMS. Upon complete conversion to the di-substituted lysine final product, the reaction mixture was concentrated under reduced pressure. Crude product was purified by normal phase chromatography on a Flash Column ISCO using a DCM:CH3OH gradient (to remove excess reducing agent and prevent methyl ester hydrolysis). Product fractions were concentrated under reduced pressure and subsequently purified by reverse phase chromatography on a Flash Column ISCO using a (H2O+0.1% TFA):CH3OH gradient to yield 3.4 mg (16% yield) of the TFA salt of the title compound as a clear oil.
1H NMR (400 MHz, Methanol-d4) δ 7.70 (d, J = 8.4 Hz, 2H), 7.49 (d, J = 8.5 Hz, 2H), 7.33 – 7.26 (m, 4H), 7.24 – 7.19 (m, 1H), 4.72 (dd, J = 9.2, 5.5 Hz, 1H), 4.60 (s, 4H), 4.52 – 4.25 (m, 4H), 3.91 (dd, J = 11.3, 4.7 Hz, 1H), 3.79 (dd, J = 11.4, 3.8 Hz, 1H), 3.74 (s, 3H), 3.49 (s, 2H), 3.26 (dd, 1H), 3.17 – 2.99 (m, 3H), 2.87 (s, 2H), 1.97 – 1.42 (m, 16H), 1.38 (d, J = 7.2 Hz, 3H), 1.33 (s, 9H), 0.96 – 0.89 (m, 6H).MSI (ESI): 807 [M+H]+. TR = 5.06 min.
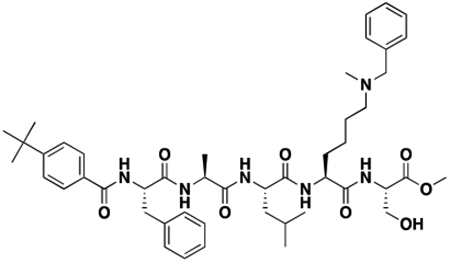
methyl N6-benzyl-N2-(4-(tert-butyl)benzoyl)-L-phenylalanyl-L-alanyl-L-leucyl-N6-methyl-L-lysyl-L-serinate (UNC6375):
Intermediate 5 (20 mg, 1.0 Eq, 23 μmol) was dissolved in CH3OH (5 mL) in a 20 mL scintillation vial, to which benzaldehyde (24 μL, 10 Eq, 0.23 mmol) and sodium cyanoborohydride (7.4 mg, 5.0 Eq, 0.12 mmol) were added. The reaction was stirred for 16 hour at 25 °C, at which point conversion to the mono-substituted lysine intermediate was monitored by LCMS. After complete conversion to the mono-substituted lysine intermediate, formaldehyde (10 Eq, 0.23 mmol) was added. The reaction was stirred for an additional 1 hour at 25 °C, and conversion to the di-substituted lysine product was monitored by LCMS. Upon complete conversion to the di-substituted lysine final product, the reaction mixture was concentrated under reduced pressure. Crude product was purified by normal phase chromatography on a Flash Column ISCO using a DCM:CH3OH gradient (to remove excess reducing agent and prevent methyl ester hydrolysis). Product fractions were concentrated under reduced pressure and subsequently purified by reverse phase chromatography on a Flash Column ISCO using a (H2O+0.1% TFA):CH3OH gradient to yield 10.1 mg (45% yield) of the TFA salt of the title compound as a clear oil.
1H NMR (400 MHz, Methanol-d4) δ 7.70 (d, J = 8.4 Hz, 2H), 7.50 – 7.45 (m, 7H), 7.33 – 7.25 (m, 4H), 7.23 – 7.18 (m, 1H), 4.72 (dd, J = 9.2, 5.6 Hz, 1H), 4.52 – 4.25 (m, 5H), 4.22 – 4.15 (m, 1H), 3.98 (s, 1H), 3.91 (dd, J = 11.4, 4.6 Hz, 1H), 3.79 (dd, J = 11.3, 3.9 Hz, 1H), 3.73 (s, 3H), 3.29 – 3.01 (m, 4H), 2.75 (s, 3H), 1.98 – 1.42 (m, 10H), 1.37 (d, J = 7.2 Hz, 3H), 1.33 (s, 9H), 0.95 – 0.88 (m, 6H).MSI (ESI): 843 [M+H]+. TR = 5.09 min.
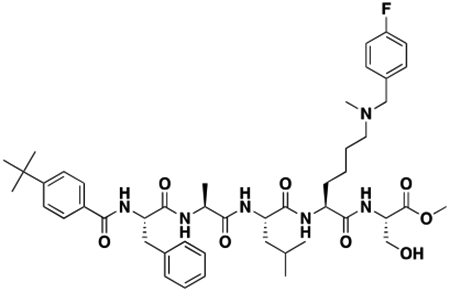
methyl N2-(4-(tert-butyl)benzoyl)-L-phenylalanyl-L-alanyl-L-leucyl-N6-(4-fluorobenzyl)-N6-methyl-L-lysyl-L-serinate (UNC6376):
Intermediate 5 (20 mg, 1.0 Eq, 23 μmol) was dissolved in CH3OH (5 mL) in a 20 mL scintillation vial, to which 4-fluorobenzaldehyde (25 μL, 10 Eq, 0.23 mmol) and sodium cyanoborohydride (7.4 mg, 5.0 Eq, 0.12 mmol) were added. The reaction was stirred for 32 hour at 25 °C, at which point co nversion to the mono-substituted lysine intermediate was monitored by LCMS. After complete conversion to the mono-substituted lysine intermediate, formaldehyde (10 Eq, 0.23 mmol) was added. The reaction was stirred for an additional 1 hour at 25 °C, and conversion to the di-substituted lysine product was monitored by LCMS. Upon complete conversion to the di-substituted lysine final product, the reaction mixture was concentrated under reduced pressure. Crude product was purified by normal phase chromatography on a Flash Column ISCO using a DCM:CH3OH gradient (to remove excess reducing agent and prevent methyl ester hydrolysis). Product fractions were concentrated under reduced pressure and subsequently purified by reverse phase chromatography on a Flash Column ISCO using a (H2O+0.1% TFA):CH3OH gradient to yield 9.9 mg (43% yield) of the TFA salt of the title compound as a clear oil.
1H NMR (400 MHz, Methanol-d4) δ 7.70 (d, J = 8.4 Hz, 2H), 7.54 – 7.45 (m, 4H), 7.32 – 7.25 (m,4H), 7.23 – 7.17 (m, 3H), 4.72 (dd, J = 9.3, 5.6 Hz, 1H), 4.53 – 4.26 (m, 5H), 4.22 – 4.15 (m, 1H), 3.98 (s, 1H), 3.91 (dd, J = 11.4, 4.6 Hz, 1H), 3.79 (dd, J = 11.3, 3.9 Hz, 1H), 3.73 (s, 3H), 3.30 – 3.02 (m, 4H), 2.75 (s, 3H), 1.98 – 1.41 (m, 10H), 1.37 (d, J = 7.2 Hz, 3H), 1.33 (s, 9H), 0.95 – 0.88 (m, 6H).
MSI (ESI): 861 [M+H]+. TR = 5.18 min.
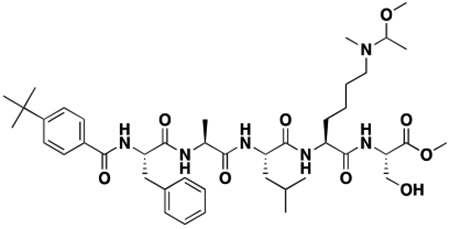
methyl N2-(4-(tert-butyl)benzoyl)-L-phenylalanyl-L-alanyl-L-leucyl-N6-(1-methoxyethyl)-N6-methyl-L-lysyl-L-serinate (UNC6481):
Intermediate 5 (20 mg, 1.0 Eq, 23 μmol) was dissolved in CH3OH (5 mL) in a 20 mL scintillation vial, to which 1-methoxypropan-2-one (22 μL, 10 Eq, 0.23 mmol) and sodium cyanoborohydride (7.4 mg, 5.0 Eq, 0.12 mmol) were added. The reaction was stirred for 24 hour at 25 °C, at which point conversion to the mono-substituted lysine intermediate was monitored by LCMS. After complete conversion to the mono-substituted lysine intermediate, formaldehyde (10 Eq, 0.23 mmol) was added. The reaction was stirred for an additional 1 hour at 25 °C, and conversion to the di-substituted lysine product was monitored by LCMS. Upon complete conversion to the di-substituted lysine final product, the reaction mixture was concentrated under reduced pressure. Crude product was purified by normal phase chromatography on a Flash Column ISCO using a DCM:CH3OH gradient (to remove excess reducing agent and prevent methyl ester hydrolysis). Product fractions were concentrated under reduced pressure and subsequently purified by reverse phase chromatography on a Flash Column ISCO using a (H2O+0.1% TFA):CH3OH gradient to yield 11.7 mg (53% yield) of the TFA salt of the title compound as a clear oil.
1H NMR (400 MHz, Methanol-d4) δ 7.71 (d, J = 8.5 Hz, 2H), 7.48 (d, J = 8.6 Hz, 2H), 7.34 – 7.26 (m, 4H), 7.25 – 7.18 (m, 1H), 4.73 (dd, J = 9.2, 5.5 Hz, 1H), 4.53 – 4.27 (m, 4H), 3.91 (dd, J = 11.4, 4.6 Hz, 1H), 3.79 (dd, J = 11.4, 3.9 Hz, 1H), 3.74 (s, 3H), 3.70 – 3.47 (m, 3H), 3.38 (s, 3H), 3.30 – 2.95 (m, 4H), 2.81 (s, 1H), 2.72 (s, 2H), 2.00 – 1.42 (m, 10H), 1.38 (d, J = 7.2 Hz, 3H), 1.33 (s, 9H), 1.30 – 1.18 (m, 3H), 0.96 – 0.89 (m, 6H).
MSI (ESI): 825 [M+H]+. TR = 4.90 min.
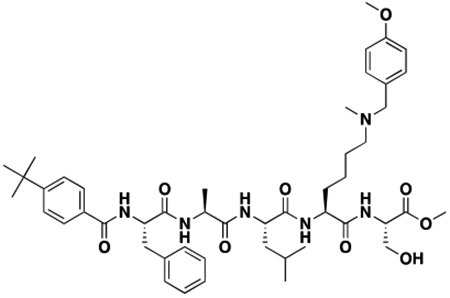
methyl N2-(4-(tert-butyl)benzoyl)-L-phenylalanyl-L-alanyl-L-leucyl-N6-(4-methoxybenzyl)-N6-methyl-L-lysyl-L-serinate (UNC6483):
Intermediate 5 (20 mg, 1.0 Eq, 23 μmol) was dissolved in CH3OH (5 mL) in a 20 mL scintillation vial, to which 4-methoxybenzaldehyde (29 μL, 10 Eq, 0.23 mmol) and sodium cyanoborohydride (7.4 mg, 5.0 Eq, 0.12 mmol) were added. The reaction was stirred for 48 hour at 25 °C, at which point conversion to the mono-substituted lysine intermediate was monitored by LCMS. After complete conversion to the mono-substituted lysine intermediate, formaldehyde (10 Eq, 0.23 mmol) was added. The reaction was stirred for an additional 1 hour at 25 °C, and conversion to th e di-substituted lysine product was monitored by LCMS. Upon complete conversion to the di-substituted lysine final product, the reaction mixture was concentrated under reduced pressure. Crude product was purified by normal phase chromatography on a Flash Column ISCO using a DCM:CH3OH gradient (to remove excess reducing agent and prevent methyl ester hydrolysis). Product fractions were concentrated under reduced pressure and subsequently purified by reverse phase chromatography on a Flash Column ISCO using a (H2O+0.1% TFA):CH3OH gradient to yield 3.8 mg (16% yield) of the TFA salt of the title compound as a clear oil.
1H NMR (400 MHz, Methanol-d4) δ 7.69 (d, J = 8.5 Hz, 2H), 7.48 (d, J = 8.6 Hz, 2H), 7.38 (d, J = 8.7 Hz, 2H), 7.33 – 7.25 (m, 4H), 7.24 – 7.18 (m, 1H), 7.00 (d, J = 8.7 Hz, 2H), 4.72 (dd, J = 9.3, 5.6 Hz, 1H), 4.52 – 4.25 (m, 5H), 4.18 – 4.06 (m, 1H), 3.91 (dd, J = 11.3, 4.6 Hz, 1H), 3.81 (s, 3H), 3.78 (dd, J = 11.3 Hz, 1H), 3.73 (s, 3H), 3.30 – 2.95 (m, 4H), 2.73 (s, 3H), 1.99 – 1.42 (m, 10H), 1.36 (d, J = 7.2 Hz, 3H), 1.33 (s, 9H), 0.95 – 0.89 (m, 6H). MSI (ESI): 873 [M+H]+. TR = 5.05 min.
(iii). Synthesis of UNC4219 and Intermediates
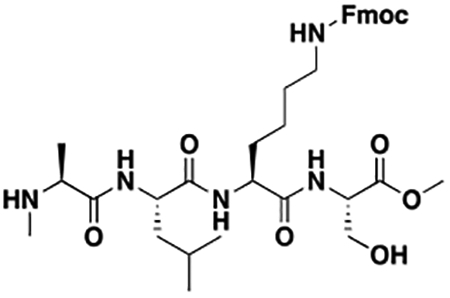
methyl N6-(((9H-fluoren-9-yl)methoxy)carbonyl)-N2-L-alanyl-L-leucyl-L-lysyl-L-serinate (Intermediate 3):
N-(tert-butoxycarbonyl)-N-methyl-L-alanine (370 mg, 0.900 Eq, 1.80 mmol), TBTU (710 mg, 1.10 Eq, 2.20 mmol), and DIPEA (0.390 mL, 1.10 Eq, 2.20 mmol) were added to a 500 mL RB flask in DMF (20 mL) and DCM (200 mL) and stirred for 10 min to allow for pre-activation of the amino acid to be coupled. Intermediate 2 (1.40 g, 1.00 Eq, 2.00 mmol) and DIPEA (0.390 mL, 1.10 Eq, 2.20 mmol) were added to a separate flask in 10 mL DMF to allow for neutralization of the TFA salt. After 10 min, contents of the second flask were added dropwise to the first flask and the reaction mixture was stirred for 16 hour at 25 °C. The reaction mixture was then concentrated under reduced pressure, re-dissolved in 50 mL of DCM, and combined with an equal portion of brine. Product was extracted with 3×100 mL DCM, dried over Na2SO4, and concentrated under reduced pressure. Crude product was purified by normal phase chromatography on a Flash Column ISCO using a DCM:CH3OH gradient. Product fractions were then concentrated under reduced pressure. Concentrate was then dissolved in 50 mL DCM in a 100 mL RB flask, to which TFA (3.10 mL, 20.0 Eq, 40.0 mmol) was added. The reaction mixture was stirred for 2 hour at 25 °C, and product formation was monitored by LCMS. Upon conversion of the Boc-protected intermediate to the deprotected product, the reaction mixture was concentrated under reduced pressure. Crude product was purified by reverse phase chromatography on a Flash Column ISCO using a (H2O+0.1% TFA):CH3OH gradient to yield 1.46 g (93.0% yield) of the TFA salt of the title compound as a clear oil.
MSI (ESI): 668 [M+H]+. tR = 4.99 min.
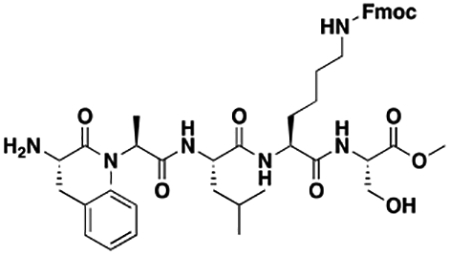
methyl N6-(((9H-fluoren-9-yl)methoxy)carbonyl)-N2-N-(L-phenylalanyl)-N-methyl-L-alanyl-L-leucyl-L-lysyl-L-serinate (Intermediate 7):
(tert-butoxycarbonyl)-L-phenylalanine (446 mg, 0.900 Eq, 1.68 mmol), TBTU (660 mg, 1.10 Eq, 2.05 mmol), and DIPEA (0.360 mL, 1.10 Eq, 2.06 mmol) were added to a 250 mL RB flask in DMF (10 mL) and DCM (100 mL) and stirred for 10 min to allow for pre-activation of the amino acid to be coupled. Intermediate 6 (1.46 g, 1.00 Eq, 1.87 mmol) and DIPEA (0.360 mL, 1.10 Eq, 2.06 mmol) were added to a separate flask in 10 mL DMF to allow for neutralization of the TFA salt. After 10 min, contents of the second flask were added dropwise to the first flask and the reaction mixture was stirred for 16 hour at 25 °C. The reaction mixture was then concentrated under reduced pressure, re-dissolved in 50 mL of DCM, and combined with an equal portion of brine. Product was extracted with 3×100 mL DCM, dried over Na2SO4, and concentrated under reduced pressure. Crude product was purified by normal phase chromatography on a Flash Column ISCO using a DCM:CH3OH gradient. Product fractions were concentrated under reduced pressure. Concentrate was then dissolved in 50 mL DCM in a 250 mL RB flask, to which TFA (2.88 mL, 20.0 Eq, 52.4 mmol) was added. The reaction mixture was stirred for 2 hour at 25 °C, a nd product formation was monitored by LCMS. Upon conversion of the Boc-protected intermediate to the deprotected product, the reaction mixture was concentrated under reduced pressure. Crude product was purified by reverse phase chromatography on a Flash Column ISCO using a (H2O+0.1% TFA):CH3OH gradient to yield 783 mg (45.1% yield) of the TFA salt of the title compound as a clear oil.
MSI (ESI): 815 [M+H]+. tR = 5.28 min.
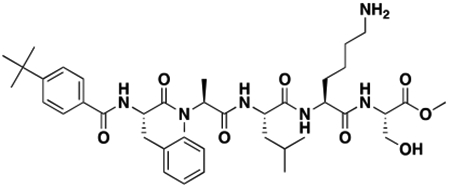
methyl N-((4-(tert-butyl)benzoyl)-L-phenylalanyl)-N-methyl-L-alanyl-L-leucyl-L-lysyl-L-serinate (Intermediate 8):
4-(tert-butyl)benzoic acid (165 mg, 1.10 Eq, 927 μmol), TBTU (325 mg, 1.20 Eq, 1.01 mmol), and DIPEA (0.160 mL, 1.10 Eq, 1.42 mmol) were added to a 250 mL RB flask in DMF (10 mL) and DCM (100 mL) and stirred for 10 min to allow for pre-activation of the amino acid to be coupled. Intermediate 7 (783 mg, 1.00 Eq, 843 μmol) and DIPEA (0.160 mL, 1.10 Eq, 1.42 mmol) were added to a separate flask in 10 mL DMF to allow for neutralization of the TFA salt. After 10 min, contents of the second flask were added dropwise to the first flask and the reaction mixture was stirred for 16 hour at 25 °C. The reaction mixture was then concentrated under reduced pressure, re-dissolved in 50 mL of DCM, and combined with an equal portion of brine. Product was extracted with 3×100 mL DCM, dried over Na2SO4, and concentrated under reduced pressure. Crude product was purified by normal phase chromatography on a Flash Column ISCO using a DCM:CH3OH gradient. Product fractions were concentrated under reduced pressure. Concentrate was then dissolved in 50 mL DMF in a 250 mL RB flask, to which piperidine (1.70 mL, 20.0 Eq, 16.9 mmol) was added. The reaction mixture was stirred for 16 hour at 25 °C, and produ ct formation was monitored by LCMS. Upon conversion of the Fmoc-protected intermediate to the deprotected product, the reaction mixture was concentrated under reduced pressure. Crude product was purified by reverse phase chromatography on a Flash Column ISCO using a (H2O+0.1% TFA):CH3OH gradient to yield 619 mg (84.6% yield) of the TFA salt of the title compound as a clear oil.
MSI (ESI): 753 [M+H]+. tR = 5.23 min.
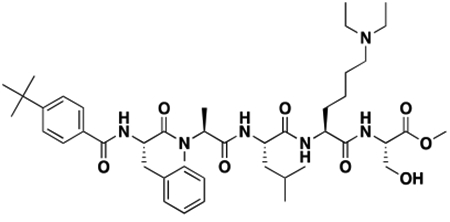
methyl N2-N-((4-(tert-butyl)benzoyl)-L-phenylalanyl)-N-methyl-L-alanyl-L-leucyl-N6,N6-diethyl-L-lysyl-L-serinate (UNC4219):
Intermediate 8 (619 mg, 1.00 Eq, 714 μmol) was dissolved in CH3OH (20 mL) in a 50 mL RB flask to which acetaldehyde (0.810 mL, 20.0 Eq, 14.3 mmol) and sodium cyanoborohydride (224 mg, 5.00 Eq, 3.60 mmol) were added. The reaction was stirred for 16 hour at 25°C, and conve rsion to the di-substituted lysine product was monitored by LCMS. Upon complete conversion to the di-substituted lysine final product, the reaction mixture was concentrated under reduced pressure. Crude product was purified by normal phase chromatography on a Flash Column ISCO using a DCM:CH3OH gradient (to remove excess reducing agent and prevent methyl ester hydrolysis). Product fractions were concentrated under reduced pressure and subsequently purified by reverse phase chromatography on a Flash Column ISCO using a (H2O+0.1% TFA):CH3OH gradient to yield 216 mg (32.8% yield) of the TFA salt of the title compound as a clear oil.Note: Due to the N-
methylation of the alanine residue, the final compound is present as a set of rotamers.
1H NMR (400 MHz, Methanol-d4) δ 7.90 – 7.64 (m, 3H), 7.54 – 7.47 (m, 3H), 7.38 – 7.21 (m, 8H), 5.31 (t, J = 8.0 Hz, 1H), 4.84 – 4.77 (m, 1H), 4.54 – 4.44 (m, 3H), 4.30 – 4.24 (m, 1H), 3.93 (dd, J = 11.3, 4.6 Hz, 1H), 3.81 (dd, J = 11.3, 3.8 Hz, 1H), 3.74 (s, 4H), 3.27 – 2.98 (m, 14H), 2.61 (s, 3H), 2.00 – 1.39 (m, 15H), 1.35 (d, J = 5.6 Hz, 16H), 1.29 (t, J = 7.4 Hz, 9H), 0.85 (t, J = 6.9 Hz, 9H), 0.44 (d, J = 6.8 Hz, 3H).
MSI (ESI): 809 [M+H]+. tR = 5.17 min.
(iv). Synthesis of -COOH Derivatives, UNC4007 and UNC5240; Biotinylated Derivatives, UNC4195 and UNC5355; and HaloTag Derivatives, UNC3866-HT and UNC4976-HT
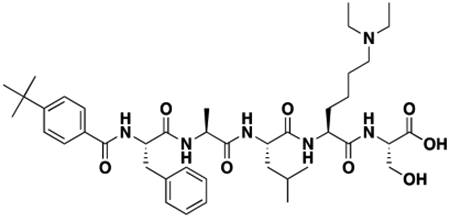
N2-(4-(tert-butyl)benzoyl)-L-phenylalanyl-L-alanyl-L-leucyl-N6,N6-diethyl-L-lysyl-L-serine (UNC4007):
UNC3866 (10.0 mg, 1.00 Eq, 11.0 μmol) was dissolved in THF (5 mL) in a 25 mL RB flask and cooled to 0°C. LiOH (20.0 mg) was then dissolved in 400 μL H2O and added to the reaction for a final concentration of 2.40 mM LiOH. The reaction was stirred for 1 hour at 25 °C and monitored by LCMS. Upon complete hydrolysis of the methyl ester to the carboxylate, the reaction mixture was warmed to 25 °C, acidified to a pH=2 with 1M HCl, and concentrated under reduced pressure. Crude reaction mixture was then re-dissolved in a 50:50 solution of H2O:CH3CN and purified by reverse phase chromatography on a preparative HPLC using a (H2O+0.1% TFA):CH3CN gradient to yield 9.0 mg (91% yield) of the TFA salt of the title compound as a clear oil.
1H NMR (400 MHz, Methanol-d4) δ 7.70 (d, J = 8.6 Hz, 2H), 7.48 (d, J = 8.7 Hz, 2H), 7.34 – 7.26 (m, 4H), 7.24 – 7.19 (m, 1H), 4.74 (dd, J = 9.3, 5.5 Hz, 1H), 4.50 – 4.27 (m, 4H), 3.93 (dd, J = 11.3, 4.6 Hz, 1H), 3.82 (dd, J = 11.3, 3.7 Hz, 1H), 3.29 – 3.04 (m, 8H), 2.01 – 1.42 (m, 9H), 1.37 (d, J = 7.2 Hz, 3H), 1.33 (s, 9H), 1.27 (t, J = 7.3 Hz, 6H), 0.92 (t, 6H). MSI (ESI): 781 [M+H]+. tR = 5.12 min.
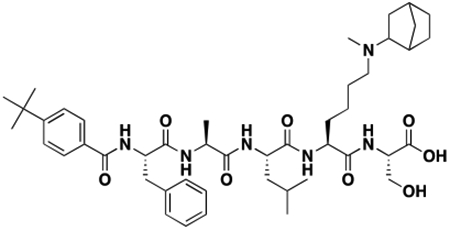
N6-(bicyclo[2.2.1]heptan-2-yl)-N2-(4-(tert-butyl)benzoyl)-L-phenylalanyl-L-alanyl-L-leucyl-N6-methyl-L-lysyl-L-serinate (UNC5240):
UNC4976 (12.3 mg, 1.00 Eq, 12.8 μmol) was dissolved in THF (5 mL) in a 25 mL RB flask and cooled to 0°C. LiOH (20.0 mg) was then dissolved in 400 μL H2O and added to the reaction for a final concentration of 2.40 mM LiOH. The reaction was stirred for 1 hour at 25 °C and monitored by LCMS. Upon complete hydrolysis of the methyl ester to the carboxylate, the reaction mixture was warmed to 25 °C, acidified to a pH=2 with 1M HCl, and concentrated under reduced pressure. Crude reaction mixture was then re-dissolved in a 50:50 solution of H2O:CH3CN and purified by reverse phase chromatography on a preparative HPLC using a (H2O+0.1% TFA):CH3CN gradient to yield 10.0 mg (82.5% yield) of the TFA salt of the title compound as a clear oil.
1H NMR (400 MHz, Methanol-d4) δ 7.70 (d, J = 8.3 Hz, 2H), 7.48 (d, J = 8.5 Hz, 2H), 7.34 – 7.26 (m, 4H), 7.24 – 7.18 (m, 1H), 4.75 – 4.69 (m, 1H), 4.49 – 4.26 (m, 4H), 3.92 (dd, J = 11.3, 4.6 Hz, 1H), 3.81 (dd, J = 11.3, 3.7 Hz, 1H), 3.46 – 3.36 (m, 1H), 3.29 – 2.91 (m, 5H), 2.85 – 2.70 (m, 3H), 2.67 – 2.56 (m, 1H), 2.42 – 2.26 (m, 1H), 2.14 – 2.03 (m, 1H), 2.01 – 1.40 (m, 16H), 1.37 (d, J = 7.2 Hz, 3H), 1.33 (s, 9H), 1.25 – 1.04 (m, 2H), 0.95 – 0.89 (m, 6H). MSI (ESI): 833 [M+H]+. tR = 5.23 min.

4-(tert-butyl)-N-((2S,5S,8S,11S,14S)-11-(4-(diethylamino)butyl)-14-(hydroxymethyl)-8-isobutyl-5-methyl-3,6,9,12,15,53-hexaoxo-57-((3aS,4S,6aR)-2-oxohexahydro-1H-thieno[3,4-d]imidazol-4-yl)-1-phenyl-19,22,25,28,31,34,37,40,43,46,49-undecaoxa-4,7,10,13,16,52-hexaazaheptapentacontan-2-yl)benzamide (UNC4195):
UNC4007 (5.6 mg, 1.0 Eq, 6.3 μmol), TBTU (2.2 mg, 1.1 Eq, 6.9 μmol), and DIPEA (1.6 μL, 1.5 Eq, 9.5 μmol) were dissolved in DMF (5 mL) in a 25 mL RB flask. Separately, N-(35-amino-3,6,9,12,15,18,21,24,27,30,33-undecaoxapentatriacontyl)-5-((3aS,4S,6aR)-2-oxohexahydro-1H-thieno[3,4-d]imidazol-4-yl)pentanamide (6.3 mg, 1.3 Eq, 8.1 μmol) and DIPEA (1.6 μL, 1.5 Eq, 9.5 μmol) were dissolved in 500 μL of DMF. The carboxylic acid of UNC4007 was allowed to pre-activate for 5 min, after which the contents of the second flask were added to the reaction mixture and stirred for 16 hour at 25 °C. The react ion mixture was concentrated under reduced pressure, re-dissolved in a 50:50 solution of H2O:CH3CN, and purified by reverse phase chromatography on a preparative HPLC using a (H2O+0.1% TFA):CH3CN gradient to yield 7.2 mg (70% yield) of the TFA salt of the title compound as a clear oil.
1H NMR (400 MHz, Methanol-d4) δ 7.72 (d, J = 8.5 Hz, 2H), 7.49 (d, J = 8.6 Hz, 2H), 7.35 – 7.27 (m, 4H), 7.26 – 7.19 (m, 1H), 4.72 – 4.66 (m, 1H), 4.49 (dd, J = 7.8, 4.5 Hz, 1H), 4.40 – 4.27 (m, 5H), 3.83 – 3.72 (m, 2H), 3.63 (s, 40H), 3.58 – 3.52 (m, 4H), 3.48 – 3.34 (m, 5H), 3.30 – 3.04 (m, 9H), 2.93 (dd, J = 12.8, 5.0 Hz, 1H), 2.71 (d, J = 12.7 Hz, 1H), 2.22 (t, J = 7.4 Hz, 2H), 2.00 – 1.42 (m, 15H), 1.38 (d, J = 7.2 Hz, 3H), 1.34 (s, 9H), 1.27 (t, J = 7.3 Hz, 6H), 0.96 – 0.89 (m, 6H). MSI (ESI): 767 [M+2H] 2+, 511 [M+3H]3+. tR = 4.88 min.

N-((2S,5S,8S,11S,14S)-11-(4-(bicyclo[2.2.1]heptan-2-yl(methyl)amino)butyl)-14-(hydroxymethyl)-8-isobutyl-5-methyl-3,6,9,12,15,53-hexaoxo-57-((3aS,4S,6aR)-2-oxohexahydro-1H-thieno[3,4-d]imidazol-4-yl)-1-phenyl-19,22,25,28,31,34,37,40,43,46,49-undecaoxa-4,7,10,13,16,52-hexaazaheptapentacontan-2-yl)-4-(tert-butyl)benzamide (UNC5355):
UNC5240 (10.5 mg, 1.00 Eq, 11.1 μmol), TBTU (4.63 mg, 1.30 Eq, 14.4 μmol), and DIPEA (2.20 μL, 1.10 Eq, 12.2 μmol) were dissolved in DMF (5 mL) in a 25 mL RB flask. Separately, N-(35-amino-3,6,9,12,15,18,21,24,27,30,33-undecaoxapentatriacontyl)-5-((3aS,4S,6aR)-2-oxohexahydro-1H-thieno[3,4-d]imidazol-4-yl)pentanamide (9.40 mg, 1.10 Eq, 12.2 μmol) and DIPEA (2.20 μL, 1.10 Eq, 12.2 μmol) were dissolved in 500 μL of DMF. The carboxylic acid of UNC5240 was allowed to pre-activate for 5 min, after which the contents of the second flask were added to the reaction mixture and stirred for 16 hour at 25 °C. The reaction mixture was concentrated under reduced pressure, re-dissolved in a 50:50 solution of H2O:CH3CN, and purified by reverse phase chromatography on a preparative HPLC using a (H2O+0.1% TFA):CH3CN gradient to yield 12.0 mg (64.0% yield) of the TFA salt of the title compound as a clear oil.
1H NMR (400 MHz, Methanol-d4) δ 7.72 (d, J = 8.3 Hz, 2H), 7.50 (d, J = 8.6 Hz, 2H), 7.36 – 7.27 (m, 4H), 7.26 – 7.20 (m, 1H), 4.72 – 4.65 (m, 1H), 4.49 (dd, J = 7.9, 4.6 Hz, 1H), 4.40 – 4.27 (m, 5H), 3.84 – 3.72 (m, 2H), 3.63 (s, 38H), 3.58 – 3.52 (m, 4H), 3.47 – 3.34 (m, 5H), 3.30 – 2.96 (m, 5H), 2.93 (dd, J = 12.8, 5.0 Hz, 1H), 2.86 – 2.77 (m, 3H), 2.71 (d, J = 12.8 Hz, 1H), 2.68 – 2.54 (m, 1H), 2.43 – 2.27 (m, 1H), 2.22 (t, J = 7.4 Hz, 2H), 2.15 – 2.04 (m, 1H), 2.02 – 1.42 (m, 20H), 1.38 (d, J = 7.2, 1.8 Hz, 3H), 1.34 (s, 9H), 1.26 – 1.03 (m, 2H), 0.97 – 0.89 (m, 6H). MSI (ESI): 793 [M+2H] 2+, 529 [M+3H]3+. tR = 5.64 min.

4-(tert-butyl)-N-((2S,5S,8S,11S,14S)-28-chloro-11-(4-(diethylamino)butyl)-14-(hydroxymethyl)-8-isobutyl-5-methyl-3,6,9,12,15-pentaoxo-1-phenyl-19,22-dioxa-4,7,10,13,16-pentaazaoctacosan-2-yl)benzamide (UNC3866-HT):
UNC4007 (5.6 mg, 1.0 Eq, 6.3 μmol), TBTU (2.2 mg, 1.1 Eq, 6.9 μmol), and DIPEA (1.6 μL, 1.5 Eq, 9.5 μmol) were dissolved in DMF (5 mL) in a 25 mL RB flask. Separately, 2-(2-((6-chlorohexyl)oxy)ethoxy)ethan-1-aminium 2,2,2-trifluoroacetate (4.2 mg, 2.0 Eq, 13 μmol) and DIPEA (1.6 μL, 1.5 Eq, 9.5 μmol) were dissolved in 500 μL of DMF to neutralize the TFA salt of the amine. The carboxylic acid of UNC4007 was allowed to pre-activate for 5 min, after which the contents of the second flask were added to the reaction mixture and stirred for 16 hour at 25 °C. The reaction mixture was concentrated under red uced pressure, re-dissolved in a 50:50 solution of H2O:CH3CN, and purified by reverse phase chromatography on a preparative HPLC using a (H2O+0.1% TFA):CH3CN gradient to yield 4.0 mg (58% yield) of the TFA salt of the title compound as a clear oil.
1H NMR (400 MHz, Methanol-d4) δ 7.72 (d, J = 8.6 Hz, 2H), 7.49 (d, J = 8.5 Hz, 2H), 7.35 – 7.27 (m, 4H), 7.25 – 7.20 (m, 1H), 4.72 – 4.66 (m, 1H), 4.40 – 4.25 (m, 4H), 3.84 – 3.72 (m, 2H), 3.63 – 3.52 (m, 8H), 3.51 – 3.34 (m, 5H), 3.30 – 3.05 (m, 8H), 2.00 – 1.40 (m, 16H), 1.38 (d, J = 7.3 Hz, 3H), 1.34 (s, 9H), 1.27 (t, J = 7.3 Hz, 6H), 0.96 – 0.90 (m, 6H). MSI (ESI): 493 [M+2H]+2. tR = 5.28 min.

N-((2S,5S,8S,11S,14S)-11-(4-(bicyclo[2.2.1]heptan-2-yl(methyl)amino)butyl)-28-chloro-14-(hydroxymethyl)-8-isobutyl-5-methyl-3,6,9,12,15-pentaoxo-1-phenyl-19,22-dioxa-4,7,10,13,16-pentaazaoctacosan-2-yl)-4-(tert-butyl)benzamide (UNC4976-HT):
UNC5240 (10 mg, 1.0 Eq, 11 μmol), TBTU (3.7 mg, 1.1 Eq, 12 μmol), and DIPEA (2.8 μL, 1.5 Eq, 16 μmol) were dissolved in DMF (5 mL) in a 25 mL RB flask. Separately, 2-(2-((6-chlorohexyl)oxy)ethoxy)ethan-1-aminium 2,2,2-trifluoroacetate (5.3 mg, 1.5 Eq, 16 μmol) and DIPEA (2.8 μL, 1.5 Eq, 16 μmol) were dissolved in 500 μL of DMF to neutralize the TFA salt of the amine. The carboxylic acid of UNC5240 was allowed to pre-activate for 5 min, after which the contents of the second flask were added to the reaction mixture and stirred for 16 hour at 25 °C. The reaction mixture was concentrated under red uced pressure, re-dissolved in a 50:50 solution of H2O:CH3CN, and purified by reverse phase chromatography on a preparative HPLC using a (H2O+0.1% TFA):CH3CN gradient to yield 9.1 mg (75% yield) of the TFA salt of the title compound as a clear oil.
1H NMR (400 MHz, Methanol-d4) δ 7.73 (d, J = 8.2 Hz, 2H), 7.50 (d, J = 8.5 Hz, 2H), 7.35 – 7.27 (m, 4H), 7.26 – 7.20 (m, 1H), 4.72 – 4.65 (m, 1H), 4.41 – 4.25 (m, 4H), 3.86 – 3.71 (m, 2H), 3.64 – 3.52 (m, 8H), 3.51 – 3.34 (m, 5H), 3.30 – 2.92 (m, 5H), 2.85 – 2.70 (m, 3H), 2.68 – 2.52 (m, 1H), 2.43 – 2.25 (m, 1H), 2.14 – 2.02 (m, 1H), 2.00 – 1.40 (m, 23H), 1.38 (d, J = 7.1 Hz, 3H), 1.33 (s, 9H), 1.32 – 1.26 (m, 2H), 1.25 – 1.03 (m, 2H), 0.93 (dd, J = 8.7, 5.9 Hz, 6H). MSI (ESI): 520 [M+2H]+2. tR = 5.41 min.
Data S1. LCMS and 1H NMR Spectral Data for Synthesized Compounds. Related to STAR* Methods.
QUANTIFICATION AND STATISTICAL ANALYSIS
The method of determining error bars is indicated in the corresponding figure legend with the replicate number also indicated. Statistical tests for ChIP-seq and Capture ChIP-seq data is outlined in the STAR Methods section under the relevant analysis. Data met the assumptions for all tests used.
DATA AND CODE AVAILABILITY
The accession number for the raw RNA-seq data referenced in this paper is GEO: GSE133391. Original data can be found at https://www.ncbi.nlm.nih.gov/geo/query/acc.cgi?acc=GSE133391.
Supplementary Material
SCHEME I.
SYNTHESIS OF PEPTIDE INTERMEDIATES (1–5)
SCHEME II.
SYNTHESIS OF UNC3866, UNC4976, AND OTHER KME MIMETIC FINAL COMPOUNDS
SCHEME III.
SYNTHESIS OF PEPTIDE INTERMEDIATES (6–8) AND UNC4219
SCHEME IV.
SYNTHESIS OF -COOH DERIVATIVES, BIOTINYLATED DERIVATIVES, AND HALOTAG DERIVATIVES
KEY RESOURCES TABLE
| REAGENT or RESOURCE | SOURCE | IDENTIFIER |
|---|---|---|
| Antibodies | ||
| Rabbit anti-CBX2 | Abcam | Cat#: ab184968 |
| Rabbit anti-CBX4 | Abcam | Cat#: ab174300 |
| Rabbit anti-CBX6 | Abcam | Cat#: ab195235 |
| Rabbit anti-CBX7 | Abcam | Cat#: ab21873; RRID: AB_726005 |
| Rabbit anti-CBX8 | Active Motif | Cat#: 61237; RRID: AB_2793563 |
| Rabbit anti-RING1B | Abcam | Cat#: ab101273; RRID: AB_10711495 |
| Mouse anti-BMI1 | Active Motif | Cat#: 39993; RRID: AB_2793422 |
| IRDye 800CW Goat anti-Rabbit IgG (H+L) | LI-COR | Cat#: 926–32211; RRID: AB_621843 |
| IRDye 680RD Goat anti-Mouse IgG (H+L) | LI-COR | Cat#: 926–68070; RRID: AB_10956588 |
| Rabbit anti-H3K27me3 | Diagenode | Cat#: C15410195; RRID: AB_2753161 |
| Rabbit anti-RING1B | Cell Signaling | Cat#: 5694; RRID: AB_10705604 |
| Rabbit anti-SUZ12 | Cell Signaling | Cat#: 3737; RRID: AB_2196850 |
| Rabbit anti-H2AK119ub | Cell Signaling | Cat#: 8240; RRID: AB_10891618 |
| Critical Commercial Assays | ||
| NEXTflex ChIP-Seq Kit | Bioo Scientific | Cat#: NOVA-5143–01 |
| KAPA Real-Time Library Amplification Kit | KAPA Biosystems | Cat#: 07959028001 |
| Monarch DNA Gel Extraction Kit | NEB | Cat#: T1020 |
| High Capacity cDNA Reverse Transcription Kit | Applied Biosystems | Cat#: 4368814 |
| Deposited Data | ||
| RNA-seq Data | This paper | Accession Number GEO: GSE133391 |
| Experimental Models: Cell Lines | ||
| Mouse: ES Cells | This paper | N/A |
| Human: Cell Line HeLa-GFP-Mito | (Peraro et al., 2018) | N/A |
| Human: Cell Line PC3 | ATCC | Cat#: CRL-1435 |
| Human: Cell Line HEK293 | ATCC | Cat#: CRL-1573 |
| Oligonucleotides | ||
| FAM-dsDNA FP Probe: AntiSense: GGA CGT GGA ATA TGG CAA GAA AAC TGA A/36-FAM/ Sense: TTC AGT TTT CTT GCC ATA TTC CAC GTC C |
(Zhen et al., 2016), purchased from IDT | N/A |
| FAM-ANRIL-RNA FP Probe: /56-FAMN/rUrGrG rArGrU rUrGrC rGrUrU rCrCrA | (Ren et al., 2016), purchased from IDT | N/A |
| Primers for ChIP-qPCR, see Table S3 | This paper | N/A |
| Probe Sequences for Capture-ChIP-seq, see Table S4 | This paper | N/A |
| Primers for RT-qPCR, see Table S5 | This paper | N/A |
| Recombinant DNA | ||
| pGEX-6P-1-GST-CD(Cbx7) | (Zhen et al., 2016), purchased from Addgene | Cat#: 82525 |
| HFM009-ZFHD1-GAL4-EF1a-GFP | This paper | N/A |
| HFM0021-ZFHD1-P2A-mCherry | This paper | N/A |
| HFM0022-ZFHD1-CBX7-P2A-mCherry | This paper | N/A |
| Software and Algorithms | ||
| GraphPad Prism Software | GraphPad Software, Inc | https://www.graphpad.com/ |
| ForeCyt Software | Intellicyt | https://intellicyt.com/products/software/ |
| FlowJo Software | FlowJo, LLC | https://www.flowjo.com/ |
| Image Studio Software | LI-COR | https://www.licor.com/bio/image-studio/ |
| Bowtie2 | (Langmead and Salzberg, 2012) | http://bowtie-bio.sourceforge.net/bowtie2/index.shtml |
| SAMtools | (Li et al., 2009) | http://samtools.sourceforge.net/ |
| MACS2 | (Zhang et al., 2008) | https://github.com/taoliu/MACS |
| R package rtracklayer | (Lawrence et al., 2009) | http://www.bioconductor.org/ |
| deepTools | (Ramirez et al., 2016) | https://github.com/deeptools/deepTools |
| R package Rsubread | (Liao et al., 2013) | http://www.bioconductor.org/ |
| DESeq2 package | (Love et al., 2014) | http://www.bioconductor.org/ |
| GROMACS 4.6.3 | GROMACS project | www.gromacs.org |
| Maestro molecular modeling suite 2017–1 | Schrödinger | https://www.schrodinger.com/maestro |
| PyMOL | Schrödinger | https://pymol.org/2/ |
| Pipeline Pilot (Data Processing Software) | BIOVIA | www.3ds.com |
Highlights.
CBX7 mESC reporter line revealed UNC4976 as a more potent antagonist than UNC3866
Unique mechanism of action for UNC4976 as a modulator of DNA/RNA binding to CBX7
UNC4976 reduces CBX7/PRC1 occupancy on chromatin with greater efficacy than UNC3866
UNC4976 reactivates PRC1 target genes more effectively than UNC3866 in HEK293 cells
SIGNIFICANCE
Multivalency is a central theme in chromatin regulatory processes wherein multiple low-affinity interactions can result in sufficient specific binding to selectively control biological processes. An aspect of Polycomb CBX chromodomains that has been relatively underappreciated during the inhibitor development process is the ability of these Kme reader domains to bind to nucleic acids in addition to the histone substrate peptide in a multivalent fashion. UNC4976 simultaneously modulates each of these binding phenomena: directly competing with H3K27me3 binding, while acting as a PAM to enhance nucleic acid affinity. This results in superior cellular efficacy relative to a silent allosteric modulator (SAM) ligand, UNC3866, by increasing equilibration of CBX7 containing PRC1 away from H3K27me3 sites. This phenomena of positive allosteric dilution of a chromatin reader domain could reflect an endogenous regulatory mechanism if non-histone lysine methylated proteins can also bind to CBX domains as PAMs to antagonize specific binding to H3K27me3 while enhancing nonspecific binding to nucleic acids. In this context, positive allosteric dilution could modulate the multivalent affinity of chromatin regulatory proteins and complexes and provide a mechanism for relocalization during dynamic, chromatin-templated processes.
ACKNOWLEDGMENTS
This work was supported by the National Institute of General Medical Sciences, U.S. National Institutes of Health (NIH) (Grant R01GM100919) to S.V.F., by the National Cancer Institute NIH (Grant R01CA218392) to S.V.F. and O.B., by the Austrian Academy of Sciences, the New Frontiers Group of the Austrian Academy of Sciences (NFG-05), by the Human Frontiers Science Programme Career Development Award (CDA00036/2014-C) to O.B., by the National Institute on Drug Abuse NIH (Grant R61DA047023) to L.I.J., the University Cancer Research Fund, University of North Carolina at Chapel Hill to L.I.J., by the UNC Eshelman Institute for Innovation (Grants RX0351210 and RX03712105) to D.B.K, and by the National Cancer Institute NIH (Grant R01CA211336) to G.G.W. G.G.W. is an American Cancer Society (ACS) Research Scholar and a Leukemia and Lymphoma Society (LLS) Scholar. Probing of arrayed methyl-binding domains was made possible via the UT MDACC Protein Array & Analysis Core (PAAC) CPRIT (Grant RP180804) to M.T.B. Flow cytometry work was supported by the North Carolina Biotech Center Institutional Support Grant 2015-IDG-1001. We acknowledge the UNC Longleaf supercomputer cluster and their staff for support. The authors thank Joshua Kritzer (Tufts) for sharing the CAPA HeLa cell line, and Jarod Waybright, Justin Rectenwald, and Sarah Clinkscales for reviewing the primary data supporting this manuscript.
Footnotes
Publisher's Disclaimer: This is a PDF file of an unedited manuscript that has been accepted for publication. As a service to our customers we are providing this early version of the manuscript. The manuscript will undergo copyediting, typesetting, and review of the resulting proof before it is published in its final citable form. Please note that during the production process errors may be discovered which could affect the content, and all legal disclaimers that apply to the journal pertain.
DECLARATION OF INTERESTS
The authors declare no competing interests.
REFERENCES
- Aranda S, Mas G, and Di Croce L (2015). Regulation of gene transcription by Polycomb proteins. Sci Adv 1, e1500737. [DOI] [PMC free article] [PubMed] [Google Scholar]
- Arrowsmith CH, Audia JE, Austin C, Baell J, Bennett J, Blagg J, Bountra C, Brennan PE, Brown PJ, Bunnage ME, et al. (2015). The promise and peril of chemical probes. Nat Chem Biol 11, 536–541. [DOI] [PMC free article] [PubMed] [Google Scholar]
- Berendsen HJC, Postma JPM, van Gunsteren WF, DiNola A, and Haak JR (1984). Molecular dynamics with coupling to an external bath. J Chem Phys 81, 3684–3690. [Google Scholar]
- Bernstein E, Duncan EM, Masui O, Gil J, Heard E, and Allis CD (2006). Mouse polycomb proteins bind differentially to methylated histone H3 and RNA and are enriched in facultative heterochromatin. Mol Cell Biol 26, 2560–2569. [DOI] [PMC free article] [PubMed] [Google Scholar]
- Blackledge NP, Farcas AM, Kondo T, King HW, McGouran JF, Hanssen LL, Ito S, Cooper S, Kondo K, Koseki Y, et al. (2014). Variant PRC1 complex-dependent H2A ubiquitylation drives PRC2 recruitment and polycomb domain formation. Cell 157, 1445–1459. [DOI] [PMC free article] [PubMed] [Google Scholar]
- Boehr DD, Nussinov R, and Wright PE (2009). The role of dynamic conformational ensembles in biomolecular recognition. Nat Chem Biol 5, 789–796. [DOI] [PMC free article] [PubMed] [Google Scholar]
- Bunnage ME, Chekler EL, and Jones LH (2013). Target validation using chemical probes. Nat Chem Biol 9, 195–199. [DOI] [PubMed] [Google Scholar]
- Cai L, Tsai YH, Wang P, Wang J, Li D, Fan H, Zhao Y, Bareja R, Lu R, Wilson EM, et al. (2018). ZFX Mediates Non-canonical Oncogenic Functions of the Androgen Receptor Splice Variant 7 in Castrate-Resistant Prostate Cancer. Mol Cell 72, 341–354 e346. [DOI] [PMC free article] [PubMed] [Google Scholar]
- Cao R, Tsukada Y, and Zhang Y (2005). Role of Bmi-1 and Ring1A in H2A ubiquitylation and Hox gene silencing. Mol Cell 20, 845–854. [DOI] [PubMed] [Google Scholar]
- Cao R, Wang L, Wang H, Xia L, Erdjument-Bromage H, Tempst P, Jones RS, and Zhang Y (2002). Role of histone H3 lysine 27 methylation in Polycomb-group silencing. Science 298, 1039–1043. [DOI] [PubMed] [Google Scholar]
- Chi P, Allis CD, and Wang GG (2010). Covalent histone modifications--miswritten, misinterpreted and mis-erased in human cancers. Nat Rev Cancer 10, 457–469. [DOI] [PMC free article] [PubMed] [Google Scholar]
- Connelly KE, and Dykhuizen EC (2017). Compositional and functional diversity of canonical PRC1 complexes in mammals. Biochim Biophys Acta Gene Regul Mech 1860, 233–245. [DOI] [PubMed] [Google Scholar]
- Connelly KE, Weaver TM, Alpsoy A, Gu BX, Musselman CA, and Dykhuizen EC (2019). Engagement of DNA and H3K27me3 by the CBX8 chromodomain drives chromatin association. Nucleic Acids Res 47, 2289–2305. [DOI] [PMC free article] [PubMed] [Google Scholar]
- Cooper S, Grijzenhout A, Underwood E, Ancelin K, Zhang T, Nesterova TB, Anil-Kirmizitas B, Bassett A, Kooistra SM, Agger K, et al. (2016). Jarid2 binds monoubiquitylated H2A lysine 119 to mediate crosstalk between Polycomb complexes PRC1 and PRC2. Nat Commun 7, 13661. [DOI] [PMC free article] [PubMed] [Google Scholar]
- Copeland RA (2016). The drug-target residence time model: a 10-year retrospective. Nat Rev Drug Discov 15, 87–95. [DOI] [PubMed] [Google Scholar]
- Copeland RA, Pompliano DL, and Meek TD (2006). Drug-target residence time and its implications for lead optimization. Nat Rev Drug Discov 5, 730–739. [DOI] [PubMed] [Google Scholar]
- Czermin B, Melfi R, McCabe D, Seitz V, Imhof A, and Pirrotta V (2002). Drosophila Enhancer of Zeste/ESC Complexes Have a Histone H3 Methyltransferase Activity that Marks Chromosomal Polycomb Sites. Cell 111, 185–196. [DOI] [PubMed] [Google Scholar]
- Dawson MA, and Kouzarides T (2012). Cancer epigenetics: from mechanism to therapy. Cell 150, 12–27. [DOI] [PubMed] [Google Scholar]
- de Napoles M, Mermoud JE, Wakao R, Tang YA, Endoh M, Appanah R, Nesterova TB, Silva J, Otte AP, Vidal M, et al. (2004). Polycomb group proteins Ring1A/B link ubiquitylation of histone H2A to heritable gene silencing and X inactivation. Dev Cell 7, 663–676. [DOI] [PubMed] [Google Scholar]
- De Rubeis S, He X, Goldberg AP, Poultney CS, Samocha K, Cicek AE, Kou Y, Liu L, Fromer M, Walker S, et al. (2014). Synaptic, transcriptional and chromatin genes disrupted in autism. Nature 515, 209–215. [DOI] [PMC free article] [PubMed] [Google Scholar]
- Di Croce L, and Helin K (2013). Transcriptional regulation by Polycomb group proteins. Nat Struct Mol Biol 20, 1147–1155. [DOI] [PubMed] [Google Scholar]
- Ehlert FJ (1988). Estimation of the Affinities of Allosteric Ligands Using Radioligand Binding and Pharmacological Null Methods. Mol Pharmacol 33, 187–194. [PubMed] [Google Scholar]
- Ehlert FJ (2005). Analysis of allosterism in functional assays. J Pharmacol Exp Ther 315, 740–754. [DOI] [PubMed] [Google Scholar]
- Elling U, Wimmer RA, Leibbrandt A, Burkard T, Michlits G, Leopoldi A, Micheler T, Abdeen D, Zhuk S, Aspalter IM, et al. (2017). A reversible haploid mouse embryonic stem cell biobank resource for functional genomics. Nature 550, 114–118. [DOI] [PMC free article] [PubMed] [Google Scholar]
- Essmann U, Perera L, Berkowitz ML, Darden T, Lee H, and Pedersen LG (1995). A smooth particle mesh Ewald method. J Chem Phys 103, 8577–8593. [Google Scholar]
- Fischle W, Wang Y, Jacobs SA, Kim Y, Allis CD, and Khorasanizadeh S (2003). Molecular basis for the discrimination of repressive methyl-lysine marks in histone H3 by Polycomb and HP1 chromodomains. Genes Dev 17, 1870–1881. [DOI] [PMC free article] [PubMed] [Google Scholar]
- Francis NJ, Kingston RE, and Woodcock CL (2004). Chromatin compaction by a polycomb group protein complex. Science 306, 1574–1577. [DOI] [PubMed] [Google Scholar]
- Frye SV (2010). The art of the chemical probe. Nat Chem Biol 6 159–161. [DOI] [PubMed] [Google Scholar]
- Gao Z, Zhang J, Bonasio R, Strino F, Sawai A, Parisi F, Kluger Y and Reinberg D (2012). PCGF homologs, CBX proteins, and RYBP define functionally distinct PRC1 family complexes. Mol Cell 45, 344–356. [DOI] [PMC free article] [PubMed] [Google Scholar]
- Gil J, and O’Loghlen A (2014). PRC1 complex diversity: where is it taking us? Trends Cell Biol 24, 632–641. [DOI] [PubMed] [Google Scholar]
- Hauri S, Comoglio F, Seimiya M, Gerstung M, Glatter T, Hansen K, Aebersold R, Paro R, Gstaiger M, and Beisel C (2016). A High-Density Map for Navigating the Human Polycomb Complexome. Cell Rep 17, 583–595. [DOI] [PubMed] [Google Scholar]
- He Y, Selvaraju S, Curtin ML, Jakob CG, Zhu H, Comess KM, Shaw B, The J, Lima-Fernandes E, Szewczyk MM, et al. (2017). The EED protein-protein interaction inhibitor A-395 inactivates the PRC2 complex. Nat Chem Biol 13, 389–395. [DOI] [PubMed] [Google Scholar]
- Hess B, Bekker H, Berendsen HJC, and Fraaije JGEM (1997). LINCS: A linear constraint solver for molecular simulations. J Comput Chem 18, 1463–1472. [Google Scholar]
- Kaustov L, Ouyang H, Amaya M, Lemak A, Nady N, Duan S, Wasney GA, Li Z, Vedadi M, Schapira M, et al. (2011). Recognition and specificity determinants of the human cbx chromodomains. J Biol Chem 286, 521–529. [DOI] [PMC free article] [PubMed] [Google Scholar]
- Kenakin T (2005). New concepts in drug discovery: collateral efficacy and permissive antagonism. Nat Rev Drug Discov 4, 919–927. [DOI] [PubMed] [Google Scholar]
- Kim J, Daniel J, Espejo A, Lake A, Krishna M, Xia L, Zhang Y, and Bedford MT (2006). Tudor, MBT and chromo domains gauge the degree of lysine methylation. EMBO Rep 7, 397–403. [DOI] [PMC free article] [PubMed] [Google Scholar]
- Kundu S, Ji F, Sunwoo H, Jain G, Lee JT, Sadreyev RI, Dekker J, and Kingston RE (2017). Polycomb Repressive Complex 1 Generates Discrete Compacted Domains that Change during Differentiation. Mol Cell 65, 432–446 e435. [DOI] [PMC free article] [PubMed] [Google Scholar]
- Kwon YU, and Kodadek T (2007). Quantitative evaluation of the relative cell permeability of peptoids and peptides. J Am Chem Soc 129, 1508–1509. [DOI] [PMC free article] [PubMed] [Google Scholar]
- Langmead B, and Salzberg SL (2012). Fast gapped-read alignment with Bowtie 2. Nat Methods 9, 357–359. [DOI] [PMC free article] [PubMed] [Google Scholar]
- Lau MS, Schwartz MG, Kundu S, Savol AJ, Wang PI, Marr SK, Grau DJ, Schorderet P, Sadreyev RI, Tabin CJ, et al. (2017). Mutation of a nucleosome compaction region disrupts Polycomb-mediated axial patterning. Science 355, 1081–1084. [DOI] [PMC free article] [PubMed] [Google Scholar]
- Lawrence M, Gentleman R, and Carey V (2009). rtracklayer: an R package for interfacing with genome browsers. Bioinformatics 25, 1841–1842. [DOI] [PMC free article] [PubMed] [Google Scholar]
- Li H, Handsaker B, Wysoker A, Fennell T, Ruan J, Homer N, Marth G, Abecasis G, Durbin R, and Genome Project Data Processing, S. (2009). The Sequence Alignment/Map format and SAMtools. Bioinformatics 25, 2078–2079. [DOI] [PMC free article] [PubMed] [Google Scholar]
- Liao Y, Smyth GK, and Shi W (2013). The Subread aligner: fast, accurate and scalable read mapping by seed-and-vote. Nucleic Acids Res 41, e108. [DOI] [PMC free article] [PubMed] [Google Scholar]
- Liszczak GP, Brown ZZ, Kim SH, Oslund RC, David Y, and Muir TW (2017). Genomic targeting of epigenetic probes using a chemically tailored Cas9 system. Proc Natl Acad Sci U S A 114, 681–686. [DOI] [PMC free article] [PubMed] [Google Scholar]
- Love MI, Huber W, and Anders S (2014). Moderated estimation of fold change and dispersion for RNA-seq data with DESeq2. Genome Biol 15, 550. [DOI] [PMC free article] [PubMed] [Google Scholar]
- Lu R, Wang P, Parton T, Zhou Y, Chrysovergis K, Rockowitz S, Chen WY, Abdel-Wahab O, Wade PA, Zheng D, et al. (2016). Epigenetic Perturbations by Arg882-Mutated DNMT3A Potentiate Aberrant Stem Cell Gene-Expression Program and Acute Leukemia Development. Cancer Cell 30, 92–107. [DOI] [PMC free article] [PubMed] [Google Scholar]
- Luis NM, Morey L, Di Croce L, and Benitah SA (2012). Polycomb in stem cells: PRC1 branches out. Cell Stem Cell 11, 16–21. [DOI] [PubMed] [Google Scholar]
- Margueron R, Justin N, Ohno K, Sharpe ML, Son J, Drury WJ 3rd, Voigt P, Martin SR, Taylor WR, De Marco V, et al. (2009). Role of the polycomb protein EED in the propagation of repressive histone marks. Nature 461, 762–767. [DOI] [PMC free article] [PubMed] [Google Scholar]
- Margueron R, and Reinberg D (2011). The Polycomb complex PRC2 and its mark in life. Nature 469, 343–349. [DOI] [PMC free article] [PubMed] [Google Scholar]
- Mark P, and Nilsson L (2001). Structure and Dynamics of the TIP3P, SPC, and SPC/E Water Models at 298 K. J Phys Chem A 105, 9954–9960. [Google Scholar]
- McGinty RK, Henrici RC, and Tan S (2014). Crystal structure of the PRC1 ubiquitylation module bound to the nucleosome. Nature 514, 591–596. [DOI] [PMC free article] [PubMed] [Google Scholar]
- Morey L, Pascual G, Cozzuto L, Roma G, Wutz A, Benitah SA, and Di Croce L (2012). Nonoverlapping functions of the Polycomb group Cbx family of proteins in embryonic stem cells. Cell Stem Cell 10, 47–62. [DOI] [PubMed] [Google Scholar]
- Moussa HF, Bsteh D, Yelagandula R, Pribitzer C, Stecher K, Bartalska K, Michetti L, Wang J, Zepeda-Martinez JA, Elling U, et al. (2019). Canonical PRC1 controls sequence-independent propagation of Polycomb-mediated gene silencing. Nat Commun 10, 1931. [DOI] [PMC free article] [PubMed] [Google Scholar]
- Muller J, Hart CM, Francis NJ, Vargas ML, Sengupta A, Wild B, Miller EL, O’Connor MB, Kingston RE, and Simon JA (2002). Histone methyltransferase activity of a Drosophila Polycomb group repressor complex. Cell 111, 197–208. [DOI] [PubMed] [Google Scholar]
- Nosé S, and Klein ML (1983). A study of solid and liquid carbon tetrafluoride using the constant pressure molecular dynamics technique. J Chem Phys 78, 6928–6939. [Google Scholar]
- Peraro L, Deprey KL, Moser MK, Zou Z, Ball HL, Levine B, and Kritzer JA (2018). Cell Penetration Profiling Using the Chloroalkane Penetration Assay. J Am Chem Soc 140, 11360–11369. [DOI] [PMC free article] [PubMed] [Google Scholar]
- Peraro L, Zou Z, Makwana KM, Cummings AE, Ball HL, Yu H, Lin YS, Levine B, and Kritzer JA (2017). Diversity-Oriented Stapling Yields Intrinsically Cell-Penetrant Inducers of Autophagy. J Am Chem Soc 139, 7792–7802. [DOI] [PMC free article] [PubMed] [Google Scholar]
- Price MR, Baillie GL, Thomas A, Stevenson LA, Easson M, Goodwin R, McLean A, McIntosh L, Goodwin G, Walker G, et al. (2005). Allosteric modulation of the cannabinoid CB1 receptor. Mol Pharmacol 68, 1484–1495. [DOI] [PubMed] [Google Scholar]
- Qi W, Zhao K, Gu J, Huang Y, Wang Y, Zhang H, Zhang M, Zhang J, Yu Z, Li L, et al. (2017). An allosteric PRC2 inhibitor targeting the H3K27me3 binding pocket of EED. Nat Chem Biol 13, 381–388. [DOI] [PubMed] [Google Scholar]
- Ramirez F, Ryan DP, Gruning B, Bhardwaj V, Kilpert F, Richter AS, Heyne S, Dundar F, and Manke T (2016). deepTools2: a next generation web server for deep-sequencing data analysis. Nucleic Acids Res 44, W160–165. [DOI] [PMC free article] [PubMed] [Google Scholar]
- Ren C, Morohashi K, Plotnikov AN, Jakoncic J, Smith SG, Li J, Zeng L, Rodriguez Y, Stojanoff V, Walsh M, et al. (2015). Small-molecule modulators of methyl-lysine binding for the CBX7 chromodomain. Chem Biol 22, 161–168. [DOI] [PMC free article] [PubMed] [Google Scholar]
- Ren C, Smith SG, Yap K, Li S, Li J, Mezei M, Rodriguez Y, Vincek A, Aguilo F, Walsh MJ, et al. (2016). Structure-Guided Discovery of Selective Antagonists for the Chromodomain of Polycomb Repressive Protein CBX7. ACS Med Chem Lett 7, 601–605. [DOI] [PMC free article] [PubMed] [Google Scholar]
- Ribich S, Harvey D, and Copeland RA (2017). Drug Discovery and Chemical Biology of Cancer Epigenetics. Cell Chem Biol 24, 1120–1147. [DOI] [PubMed] [Google Scholar]
- Schwarz DMC, and Gestwicki JE (2018). Revisiting the “Art of the Chemical Probe”. ACS Chem Biol 13, 1109–1110. [DOI] [PubMed] [Google Scholar]
- Shinjo K, Yamashita Y, Yamamoto E, Akatsuka S, Uno N, Kamiya A, Niimi K, Sakaguchi Y, Nagasaka T, Takahashi T, et al. (2014). Expression of chromobox homolog 7 (CBX7) is associated with poor prognosis in ovarian clear cell adenocarcinoma via TRAIL-induced apoptotic pathway regulation. Int J Cancer 135, 308–318. [DOI] [PubMed] [Google Scholar]
- Shortt J, Ott CJ, Johnstone RW, and Bradner JE (2017). A chemical probe toolbox for dissecting the cancer epigenome. Nat Rev Cancer 17, 160–183. [DOI] [PubMed] [Google Scholar]
- Simhadri C, Daze KD, Douglas SF, Quon TT, Dev A, Gignac MC, Peng F, Heller M, Boulanger MJ, Wulff JE, et al. (2014). Chromodomain antagonists that target the polycomb-group methyllysine reader protein chromobox homolog 7 (CBX7). J Med Chem 57, 2874–2883. [DOI] [PubMed] [Google Scholar]
- Simon JA, and Kingston RE (2013). Occupying chromatin: Polycomb mechanisms for getting to genomic targets, stopping transcriptional traffic, and staying put. Mol Cell 49, 808–824. [DOI] [PMC free article] [PubMed] [Google Scholar]
- Stockton JM, Birdsall NJ, Burgen AS, and Hulme EC (1983). Modification of the binding properties of muscarinic receptors by gallamine. Mol Pharmacol 23, 551–557. [PubMed] [Google Scholar]
- Strahl BD, and Allis CD (2000). The language of covalent histone modifications. Nature 403, 41–45. [DOI] [PubMed] [Google Scholar]
- Stuckey JI, Dickson BM, Cheng N, Liu Y, Norris JL, Cholensky SH, Tempel W, Qin S, Huber KG, Sagum C, et al. (2016a). A cellular chemical probe targeting the chromodomains of Polycomb repressive complex 1. Nat Chem Biol 12, 180–187. [DOI] [PMC free article] [PubMed] [Google Scholar]
- Stuckey JI, Simpson C, Norris-Drouin JL, Cholensky SH, Lee J, Pasca R, Cheng N, Dickson BM, Pearce KH, Frye SV, et al. (2016b). Structure-Activity Relationships and Kinetic Studies of Peptidic Antagonists of CBX Chromodomains. J Med Chem 59, 8913–8923. [DOI] [PMC free article] [PubMed] [Google Scholar]
- Suh JL, Barnash KD, Abramyan TM, Li F, The J, Engelberg IA, Vedadi M, Brown PJ, Kireev DB, Arrowsmith CH, et al. (2019). Discovery of selective activators of PRC2 mutant EED-I363M. Sci Rep 9, 6524. [DOI] [PMC free article] [PubMed] [Google Scholar]
- Taherbhoy AM, Huang OW, and Cochran AG (2015). BMI1-RING1B is an autoinhibited RING E3 ubiquitin ligase. Nat Commun 6, 7621. [DOI] [PubMed] [Google Scholar]
- Tan NC, Yu P, Kwon YU, and Kodadek T (2008). High-throughput evaluation of relative cell permeability between peptoids and peptides. Bioorg Med Chem 16, 5853–5861. [DOI] [PMC free article] [PubMed] [Google Scholar]
- Tavares L, Dimitrova E, Oxley D, Webster J, Poot R, Demmers J, Bezstarosti K, Taylor S, Ura H, Koide H, et al. (2012). RYBP-PRC1 complexes mediate H2A ubiquitylation at polycomb target sites independently of PRC2 and H3K27me3. Cell 148, 664–678. [DOI] [PMC free article] [PubMed] [Google Scholar]
- van Zundert GCP, Rodrigues J, Trellet M, Schmitz C, Kastritis PL, Karaca E, Melquiond ASJ, van Dijk M, de Vries SJ, and Bonvin A (2016). The HADDOCK2.2 Web Server: User-Friendly Integrative Modeling of Biomolecular Complexes. J Mol Biol 428, 720–725. [DOI] [PubMed] [Google Scholar]
- Vandamme J, Volkel P, Rosnoblet C, Le Faou P, and Angrand PO (2011). Interaction proteomics analysis of polycomb proteins defines distinct PRC1 complexes in mammalian cells. Mol Cell Proteomics 10, M110 002642. [DOI] [PMC free article] [PubMed] [Google Scholar]
- Vanommeslaeghe K, Hatcher E, Acharya C, Kundu S, Zhong S, Shim J, Darian E, Guvench O, Lopes P, Vorobyov I, et al. (2010). CHARMM general force field: A force field for drug-like molecules compatible with the CHARMM all-atom additive biological force fields. J Comput Chem 31, 671–690. [DOI] [PMC free article] [PubMed] [Google Scholar]
- Wang H, Wang L, Erdjument-Bromage H, Vidal M, Tempst P, Jones RS, and Zhang Y (2004). Role of histone H2A ubiquitination in Polycomb silencing. Nature 431, 873–878. [DOI] [PubMed] [Google Scholar]
- Wassenaar TA, van Dijk M, Loureiro-Ferreira N, van der Schot G, de Vries SJ, Schmitz C, van der Zwan J, Boelens R, Giachetti A, Ferella L, et al. (2012). WeNMR: Structural Biology on the Grid. J Grid Comput 10, 743–767. [Google Scholar]
- Weaver TM, Morrison EA, and Musselman CA (2018). Reading More than Histones: The Prevalence of Nucleic Acid Binding among Reader Domains. Molecules 23. [DOI] [PMC free article] [PubMed] [Google Scholar]
- Xu B, Konze KD, Jin J, and Wang GG (2015a). Targeting EZH2 and PRC2 dependence as novel anticancer therapy. Exp Hematol 43, 698–712. [DOI] [PMC free article] [PubMed] [Google Scholar]
- Xu B, On DM, Ma A, Parton T, Konze KD, Pattenden SG, Allison DF, Cai L, Rockowitz S, Liu S, et al. (2015b). Selective inhibition of EZH2 and EZH1 enzymatic activity by a small molecule suppresses MLL-rearranged leukemia. Blood 125, 346–357. [DOI] [PMC free article] [PubMed] [Google Scholar]
- Yap KL, Li S, Munoz-Cabello AM, Raguz S, Zeng L, Mujtaba S, Gil J, Walsh MJ, and Zhou MM (2010). Molecular interplay of the noncoding RNA ANRIL and methylated histone H3 lysine 27 by polycomb CBX7 in transcriptional silencing of INK4a. Mol Cell 38, 662–674. [DOI] [PMC free article] [PubMed] [Google Scholar]
- Zhang Y, Liu T, Meyer CA, Eeckhoute J, Johnson DS, Bernstein BE, Nusbaum C, Myers RM, Brown M, Li W, et al. (2008). Model-based analysis of ChIP-Seq (MACS). Genome Biol 9, R137. [DOI] [PMC free article] [PubMed] [Google Scholar]
- Zhen CY, Tatavosian R, Huynh TN, Duc HN, Das R, Kokotovic M, Grimm JB, Lavis LD, Lee J, Mejia FJ, et al. (2016). Live-cell single-molecule tracking reveals co-recognition of H3K27me3 and DNA targets polycomb Cbx7-PRC1 to chromatin. Elife 5. [DOI] [PMC free article] [PubMed] [Google Scholar]
- Zoete V, Cuendet MA, Grosdidier A, and Michielin O (2011). SwissParam: a fast force field generation tool for small organic molecules. J Comput Chem 32, 2359–2368. [DOI] [PubMed] [Google Scholar]
Associated Data
This section collects any data citations, data availability statements, or supplementary materials included in this article.
Supplementary Materials
Data Availability Statement
The accession number for the raw RNA-seq data referenced in this paper is GEO: GSE133391. Original data can be found at https://www.ncbi.nlm.nih.gov/geo/query/acc.cgi?acc=GSE133391.


