

Abstract
The influence that bacterial adaptation (or niche partitioning) within species has on gene spillover and transmission among bacterial populations occupying different niches is not well understood. Streptococcus agalactiae is an important bacterial pathogen that has a taxonomically diverse host range making it an excellent model system to study these processes. Here, we analyze a global set of 901 genome sequences from nine diverse host species to advance our understanding of these processes. Bayesian clustering analysis delineated 12 major populations that closely aligned with niches. Comparative genomics revealed extensive gene gain/loss among populations and a large pan genome of 9,527 genes, which remained open and was strongly partitioned among niches. As a result, the biochemical characteristics of 11 populations were highly distinctive (significantly enriched). Positive selection was detected and biochemical characteristics of the dispensable genes under selection were enriched in ten populations. Despite the strong gene partitioning, phylogenomics detected gene spillover. In particular, tetracycline resistance (which likely evolved in the human-associated population) from humans to bovine, canines, seals, and fish, demonstrating how a gene selected in one host can ultimately be transmitted into another, and biased transmission from humans to bovines was confirmed with a Bayesian migration analysis. Our findings show high bacterial genome plasticity acting in balance with selection pressure from distinct functional requirements of niches that is associated with an extensive and highly partitioned dispensable genome, likely facilitating continued and expansive adaptation.
Keywords: host adaptation, gene spillover, genome plasticity, bacterial pathogen
Introduction
To survive, bacteria constantly compete for space and resources. Both ecological and biochemical niches are established, either of which can be wide, narrow, strongly partitioned, or overlapping. Overall, those bacteria with broad niches can be thought of as generalists, while those with narrower niches as specialists and it has been suggested that specialists typically evolve from generalists (Scheffer 1991). For example, the ability to survive in an alien environment provides a generalist the opportunity for adaptation and specialization. Molecular typing and phylogenomic studies have reflected this division and numerous studies have shown bacteria species adapting to one or more new niches (Rosinski-Chupin et al. 2013; Baily et al. 2015; Viana et al. 2015), with this adaptation reported several times at the intraspecific level (Price et al. 2012; Shepheard et al. 2013; Spoor et al. 2013). This intraspecific adaptation has the potential to compartmentalize populations and the affect that this process has on bacteria gene transmission and spillover (overflow due to high frequency) among populations is not well understood.
The power of NGS provides an opportunity to study adaptation at the pan genomic level both within and among bacterial populations. Furthermore, intraspecific comparative pan-genomics can provide insight into the influence that adaption has on the transmission of individual genes among populations occupying distinct niches. Streptococcus agalactiae (group B Streptococcus) is an important bacterial pathogen that has an exceptionally wide and taxonomically diverse host range (Johri et al. 2006). This range includes terrestrial and marine mammals, reptiles, amphibians, and teleosts. Although several studies have provided evidence for host adaptation in humans (Manning et al. 2009), bovines (Richards et al. 2011, 2013; Almeida et al. 2016), and fish (Delannoy et al. 2013; Rosinski-Chupin et al. 2013), others have suggested ongoing transmission among hosts, including bovine to human (Manning et al. 2010), human to bovine (Dogan et al. 2005; Sukhnanand et al. 2005; Lyhs et al. 2016), human to fish (Jafar et al. 2008; Delannoy et al. 2014), fish to human (Kalimuddin et al. 2017), and human to wildlife (Delannoy et al. 2013). For human adapted populations, multilocus sequence typing (MLST) studies have provided evidence for adaptation to several distinct niches. For example, clonal complex 17 is strongly correlated with hyperinvasive neonatal infection (Bohnsack et al. 2008; Manning et al. 2009; Joubrel et al. 2015), sequence type 1 is correlated with bloodstream infections (van der Mee-Marquet et al. 2009; Flores et al. 2015), sequence type 22 is correlated with maternal carriage (Bisharat et al. 2005), and clonal complex 19 is correlated with noninvasive neonatal colonization (Fluegge et al. 2011). Conversely, clonal complex 23 appears more generalist in nature occurring in a range of terrestrial mammals, aquatic mammals, and poikilotherms (Brochet et al. 2006; Bishop et al. 2007; Delannoy et al. 2013). Therefore, S. agalactiae likely contains populations with a wide range of generalist and specialist capabilities occupying multiple niches making it an excellent model system to study host adaptation and its influence on gene flow among populations occupying diverse niches.
Here, through the analysis of a global set of 901 genome sequences from nine host species, we show how high bacterial genome plasticity (gene gain/loss) in balance with selection pressure from distinct functional requirements of niches creates an extensive pan genome that is strongly partitioned among a highly diverse range of niches, with this mechanism facilitating continued and expansive adaptation.
Results
Phylogenetic Relationships and Population Structure
Details regarding the 901 S. agalactiae isolates included in this study are presented in supplementary table S1, Supplementary Material online. Bacteria were isolated from the following host sources: human = 795, bovine = 61, fish = 29, frog = 2, canine = 5, gray seal = 5, dolphin = 1, goat = 1, camel = 1, and unknown = 1. Strains were isolated from Africa (26), Asia (27), Australia (25), Central America (4), Eastern Europe (14), Middle East (1), North America (538), Northern Europe (33), South America (6), Western Europe (220), and 7 were of unknown provenance.
To generate a genomic alignment, sequence reads were aligned to a reference genome. However, given that S. agalactiae is a genetically diverse species, selecting the reference is problematic due to bias toward a single reference. To address this issue, we mapped reads to ten reference genomes that gave a good representation of the genetic diversity for the species (see Materials and Methods and ten highlighted genomes in supplementary table S1, Supplementary Material online) and then merged all individual alignments. The merged core genomic consensus alignment was 1,079,564 bp. Of this, 134,036 bp (12.4%) were judged to be recombinant (see Materials and Methods), leaving a putatively nonrecombinant alignment of 954,528 bp that was used for maximum-likelihood phylogenetic analysis. The resulting phylogeny was strongly supported and contained lineages in agreement with those previously reported (fig. 1 and supplementary fig. S1, Supplementary Material online). These were ten lineages that corresponded to: 1) six clonal complexes (CC) (1, 17, 19, 23, and 7/12 combined) previously defined by MLST, 2) six sequence types (ST22, 26, 103/314 combined, and 260/261 combined), and 3) one lineage that was comprised exclusively of strains isolated from bovine sources (with one exception of an unknown source) which we refer to as the “bovine lineage” throughout. Isolates of the ST260/261 lineage belong to a clonal complex that has only been reported from poikilotherms (fish and frogs) (Delannoy et al. 2013) and throughout the manuscript “poikilothermic lineage” refers to this lineage.
Fig. 1.

Maximum likelihood (ML) phylogeny showing relationship among isolates and populations. Phylogeny branches are colored according to population. Lines connecting branch tips to the matrix are colored according to host. Open circles on phylogeny nodes correspond to bootstrap support values (500 replicates). Matrix shows (for each isolate) the presence/absence of lactose operon, fructose operon, nitrogen regulatory gene, 18 antibiotic resistance genes, ICE, IME, prophages, two plasmids, and the type IV conjugation system. The number of ICE, IME, prophage, and conjugation system per isolate is shown with a bar chart. The maximum number of ICE, IME, prophage, and conjugation system per isolate were five, three, five, and five, respectively. Additional columns in the matrix are color coded to show (for each isolate) host, geographic location, clonal complex, and population. The last column in the matrix shows a Bayesian population assignment plot. Bars within the plot show assignment proportions for each isolate. In addition, see supplementary table S1, Supplementary Material online, for the distribution of characters in the matrix.
Of the 60 strains isolated from cows, 31 (51.7%) fell within the bovine lineage, and this lineage contained multiple STs, including ST67, which in some countries is frequently associated with the bovine host (Zadoks et al. 2011). CC22 and CC17 were exclusively isolated from humans, and strains from CC17 are considered highly invasive and are strongly associated with human neonatal infection (in particular late-onset disease—infection after the first week of life) (Jones et al. 2006; Manning et al. 2009). In contrast, the remaining lineages had a broad host range, in particular, CC23 and CC7/12. For example, the CC23 lineage contained strains isolated from humans, cows, dogs, and gray seals, and has also been reported from crocodiles (Bishop et al. 2007), and the CC7/12 lineage contained strains isolated from humans, cows, fish, a frog, a dog, and a dolphin. Geographic partitioning was seen in one of the lineages (fig. 1 and supplementary fig. S1D, Supplementary Material online): a distinct branch of CC23 (all ST452), where all isolates were collected from Canada and United States. Isolates from all other lineages appeared globally distributed.
Bayesian clustering analysis delineated the isolates into 12 populations, which were largely aligned with the topology of the phylogeny (fig. 1). Supplementary table S1, Supplementary Material online, cross-references all isolates in the study to their respective population. This analysis identified several structural features on the phylogeny that have not been observed through traditional MLST or clonal complex analyses. Firstly, CC1 separates into two distinct lineages, the first (population 1) being predominantly composed of ST1, and the second (population 11) predominantly composed of ST459. These two populations have distinct pan genome content and are enriched in unique sets of Gene Ontology terms (the terms are overrepresented), as described later. Clonal complex 23 was likewise split into two populations, a larger group of mixed human and bovine isolates of several STs (population 8), and a smaller group of human isolates all of ST452 (population 2). The bovine lineage formed an independent population (population 5), as did CC19 (population 3), CC17 (population 7), CC22 (population 6), CC26 (population 9), and the poikilothermic lineage CC260 (population 12). CCs 7/12/283 formed a single population (population 4), as did CC103/609/130 (population 10).
We investigated genetic diversity and population dynamics within the 12 populations. Populations 1, 2, 3, 6, 7, and 11 all showed significant negative values for Tajima’s D, Fu and Li’s D*, and Fu and Li’s F*, demonstrating deviation from neutral effects (table 1). This deviation can be caused by factors such as population expansion, positive selection, and migration. Both positive selection and migration were detected in the core genome (see below). All of these six populations were either exclusively composed of human isolates or strongly dominated by them. Conversely, populations either exclusively composed of animal isolates or strongly dominated by them did not show deviation from neutrality. Furthermore, the bovine-associated population (population 5) showed considerably more molecular diversity than any other population. Theta was nearly double that of the other more diverse populations and the lineage had many long tip-branches in the phylogeny.
Table 1.
Population Diversity and Neutrality Tests.
| Population | % Human | % Animal | n | Hap | π | Avg NumDif | Θ | TajimaD | FuLiD* | FuLiF* |
|---|---|---|---|---|---|---|---|---|---|---|
| 1 | 96.7 | 3.3 | 246 | 240 | 0.0016 | 64 | 742 | −2.911*** | −13.912** | −9.613** |
| 2 | 100 | 0 | 18 | 17 | 0.0006 | 23 | 53 | −2.440*** | −3.295*** | −3.538** |
| 3 | 95.0 | 5.0 | 80 | 80 | 0.0092 | 368 | 782 | −1.847* | −3.429*** | −3.309** |
| 4 | 62.7 | 37.3 | 83 | 82 | 0.0191 | 769 | 1,120 | −1.090 | −1.375 | −1.504 |
| 5 | 0 | 100 | 32 | 28 | 0.0608 | 2,443 | 2,172 | 0.484 | 0.424 | 0.528 |
| 6 | 100 | 0 | 13 | 13 | 0.0016 | 63 | 1,180 | −2.123** | −2.849** | −3.039** |
| 7 | 100 | 0 | 190 | 185 | 0.0032 | 127 | 672 | −2.629*** | −10.190** | −7.589** |
| 8 | 84.0 | 18.0 | 75 | 75 | 0.0195 | 783 | 1,149 | −1.117 | −3.503** | −3.003* |
| 9 | 80.0 | 20.0 | 10 | 10 | 0.0088 | 353 | 362 | −0.119 | 0.572 | 0.451 |
| 10 | 81.8 | 18.2 | 11 | 11 | 0.0895 | 3,595 | 3,420 | 0.249 | −0.033 | 0.0454 |
| 11 | 95.3 | 4.7 | 134 | 128 | 0.0100 | 401 | 1,633 | −2.515*** | −5.22** | −4.712** |
| 12 | 0 | 100 | 9 | 9 | 0.0135 | 541 | 784 | −1.621 | −1.651 | −1.848 |
n, number of isolates; Hap, number of haplotypes; π, Nei’s pairwise nucleotide diversity; Avg NumDif, average number of nucleotide differences between isolates; Θ, Watterson’s theta per site (2Neμ); FuLiD*/F*, Fu and Li’s D*/F*.
For neutrality tests: *P < 0.05, **P < 0.01, ***P < 0.001.
Distribution of Virulence Factors and Host-Specificity of Antibiotic Resistance Genes
Using a large-scale BLAST score ratio approach (LS-BSR), genome sequences were searched for the presence or absence of 18 antibiotic resistance (AbxR) genes known or predicted in the S. agalactiae genome (Dogan et al. 2005; Lindahl et al. 2005; Brochet et al. 2006; Lin et al. 2011; Liu et al. 2013; Flores et al. 2015). These genes were generally sparsely distributed throughout the populations (fig. 1 and supplementary fig. S1, Supplementary Material online). In general, AbxR genes were more prevalent in human isolates compared with animal. The mean number of genes per human isolate was 1.40 and 0.53 for animal (t-test: P value < 0.0001). The most commonly detected AbxR gene was the tetracycline resistance gene tetM, detected in 658 (73%) of isolates. Only a single isolate in the bovine lineage and none of the poikilohermic lineage isolates contained tetM, although it was detected in 19 bovine isolates and 2 fish isolates. It was not universally detected in population 7 (CC17), but when absent in this population, tetO, or aadE/art6/aph3/ermB were often present. The tetracycline efflux pump tetL was detected in six isolates throughout the phylogeny, while tetW was detected in a single isolate in population 11. Erythromycin resistance genes ermTR and ermB were detected frequently in populations 1 and 11 (CC1), with ermTR predominantly in population 11 and ermB predominantly in population 1. These genes were detected in 159 (17.6%) and 129 (14.3%) of isolates, respectively, while ermT was detected in 36 isolates in population 7, all but 1 of which also contained tetM. Macrolide efflux pumps mefA and msrD were detected together in 11 isolates in populations 1, 7, and 8, while the aminoglycoside inhibitors aph3, ant6 (always together with aph3), and aadE were detected in 26, 21, and 22 isolates, respectively, in populations 1, 3, 7, 8, and 11. Besides tetM, aph3 was the only (AbxR) gene detected in a fish isolate, although the isolate was in population 4, not the poikilothermic lineage. The remaining genes we screened for, lnuB and lnuC, cat, and spcR, were rare, detected in only 4, 1, 4, and 8 isolates, respectively.
Multiple AbxR genes (two or more) were detected in 327 isolates distributed throughout the phylogeny, with the majority within populations 1, 11, and 7, but including isolates in populations 3, 4, 6, 8, and 9. Just under half of the isolates we examined (416, 46%) had only one of the genes in our screen, while all populations 2 and 12 isolates had none. Two bovine lineage isolates carried tetM, one of which additionally carried tetO, but no AbxR genes were detected in the rest of the bovine lineage isolates. On the other hand, 26 of 29 (90%) bovine isolates not from the bovine lineage had at least one AbxR gene, and several carried multiple AbxR genes.
Again using LS-BSR, we investigated the distribution of genes encoding three pilus island (PI) types (PI-1, PI-2a, and PI-2b) and determined capsule serotypes for all isolates. All three PI and nine capsule serotypes (IA, IB, II, III, IV, V, VI, VIII, and IX) were broadly distributed throughout the lineages (supplementary table S1, Supplementary Material online). The three PI were found within genomes in the following combinations: 1 + 2a, 1 + 2 b, 2a, and 2 b. Although there were numerous exceptions, in general, the PI and serotypes appeared to align with the phylogeny. However, there were several divergent lineages and one sister pair that shared the same serotype. Population 4 was distinctive as it contained a mixture of five serotypes (IA, IB, II, III, and V). For the PI, lineages representing populations 1, 3, 4, and 11, which all shared the same common ancestor, were dominated by the 1 + 2a combination. With the exception of population 7 (CC17), which also had the 1 + 2a combination, all the other populations were dominated by islands 2a or 2 b.
Distribution of Lactose and Fructose Operons
We recently showed that possession of an operon for the catabolism of lactose (Lac.2) was an important adaptation to the bovine environment (more specifically the udder) (Richards et al. 2011, 2013). The operon was carried within an integrative and conjugation element (ICE) accompanied by a nitrogen regulatory protein P-II and a four-gene operon (fruRPCD) possibly involved in fructose catabolism. We searched all genomes for both operons and the nitrogen regulatory gene. The Lac.2 operon was found in 97 isolates: 59 out of 62 bovine (95.2%), 36 out of 759 human (4.7%), 1 out of 1 goat, and 1 out of 1 camel (fig. 1 and supplementary fig. S1 and table S1, Supplementary Material online). Two bovine isolates each possessed two copies of the operon. Each copy within the same genome was genetically divergent. More specifically, a copy within the same genome was considerably more related to a copy in another other genome than it was to a copy within the same genome.
The bovine, human, goat, and camel isolates possessing Lac.2 were widely distributed through the phylogeny. The 59 bovine isolates were distributed through eight populations (1, 3, 4, 5, 8, 9, 10, and 11). However, the majority (31) was found in the bovine-associated population where it was fixed. The 36 human isolates that possessed it were distributed through seven populations (1, 4, 7, 8, 9, 10, and 11). The three bovine isolates that lacked the operon occurred in three divergent populations (3, 4, and 8). The nitrogen regulatory protein P-II and four-gene operon fruRPCD were found to be associated with Lac.2 in 59 isolates, 47 of which were bovine. They were also associated with the goat, camel, and ten human isolates. They were found in all isolates in the bovine lineage. For the remaining isolates, they occurred in four divergent populations (1, 4, 7, and 10).
Distribution of CRISPR Cas Genes
Our pan genome delineation showed the CRISPR1 cas gene cassette (cas9, cas1, cas2, csn2) to be virtually core (it was incomplete in three isolates and missing from one). Interestingly, our delineation also showed that the single isolate lacking the CRISPR1 cassette appeared to have compensated, as it was the only isolate in the entire data set to possess genes for the restriction endonuclease BgcI.
Distribution of Mobile Genetic Elements
We screened all genomes for the presence of four types of mobile genetic element (MGE): prophages, ICE, integrative and mobilizable elements (IME), and plasmids. We detected a total of 2,106 MGEs (ICE, IME, prophage, and plasmid) distributed through 850 (94.3%) of the 901 isolates (supplementary table S1, Supplementary Material online and fig. 1). Two or more MGE were seen in 683 isolates (75.8%) and three or more in 344 isolates (38.2%). The maximum number of MGE seen within a single isolate was eight. There were 626 ICE within 531 isolates, 574 IME within 418 isolates, 892 prophages within 664 isolates, and 13 plasmids within 13 isolates. Within the 1,200 ICE and IME, we detected 666 AbxR gene sequences. The majority was for tetracycline resistance (433 sequences—65.0%) and rRNA adenine N-6-methyltransferase, which imparts resistance to erythromycin (149 sequences—22.4%) (supplementary table S2, Supplementary Material online). For these ICE and IME, we also detected 1,295 virulence factor (VF) gene sequences representing 45 different VF genes (supplementary table S3, Supplementary Material online). Within the 892 prophages, we detected 14 AbxR gene sequences (supplementary table S4, Supplementary Material online). Informative annotations were for vancomycin, beta-lactam, and tetracycline resistance. We also detected 952 VF gene sequences representing 28 different VF genes (supplementary table S5, Supplementary Material online). Additionally, we screened all genomes for the presence of type IV conjugation systems (T4SS, relaxase, and type IV coupling protein). We detected a total of 1,121 systems distributed through 754 genomes (83.7%) (supplementary table S1, Supplementary Material online and fig. 1). The maximum number of systems within a genome was five and for those genomes possessing a system, the average was 1.5. For those genomes with an ICE, we detected at least one system, and with the exception of 17 genomes, we detected an equal or higher number of systems. Within 229 genomes lacking an ICE, we detected 366 systems. Using the VirB4 gene of the T4SS, these systems can be phylogenetically delineated into two types: FA (Firmicutes and Actinobacteria) and FATA (Firmicutes, Actinobacteria, Tenericutes, and Archaea) (Guglielmini et al. 2011). We detected 825 FA and 296 FATA systems (supplementary table S1, Supplementary Material online).
Transmission
We investigated bacteria transmission among human, bovine, and fish hosts using a Bayesian coalescent approach and 362 putatively nonrecombinant single-copy core genes (see Materials and Methods). The strongest signal of transmission was between human and bovine hosts, and transmission was biased, with ∼3.3× as many migrants per generation moving from humans to bovines as opposed to the opposite direction (fig. 2). Although the rate of migration was approximately two-thirds lower between bovine and fish hosts, the direction was again biased with ∼2.3× more migrants per generation moving from fish to bovines. The overall rate of migration between humans and fish was similar to that seen between humans and bovine; however, there was no directional bias.
Fig. 2.
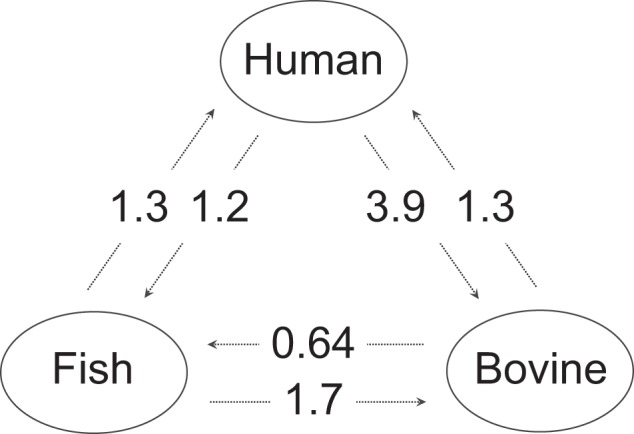
Migrants per generation among human, bovine, and fish hosts. Values shown are medians (averaged over three independent runs). 2.5 and 97.5 percentiles (derived from parameter posterior distributions) were respectively as follows: (human to bovine: 0–8.7), (bovine to human: 0–3.1), (human to fish: 0–3.1), (fish to human: 0–3.1), (bovine to fish: 0–1.7), and (fish to bovine: 0–3.4).
Gene Content and the Pan Genome
Using all genomes, we determined the size of the core, dispensable, and pan genomes. The pan genome attained a size of 9,527 genes, with the core and dispensable genomes 850 and 8,677 genes, respectively. In addition, we generated core and pan genome plots. Using Heaps’ Law, the alpha parameter was calculated to be 0.7396 (the pan genome curve showed no evidence of plateauing) providing strong evidence for an open pan genome (fig. 3A).
Fig. 3.
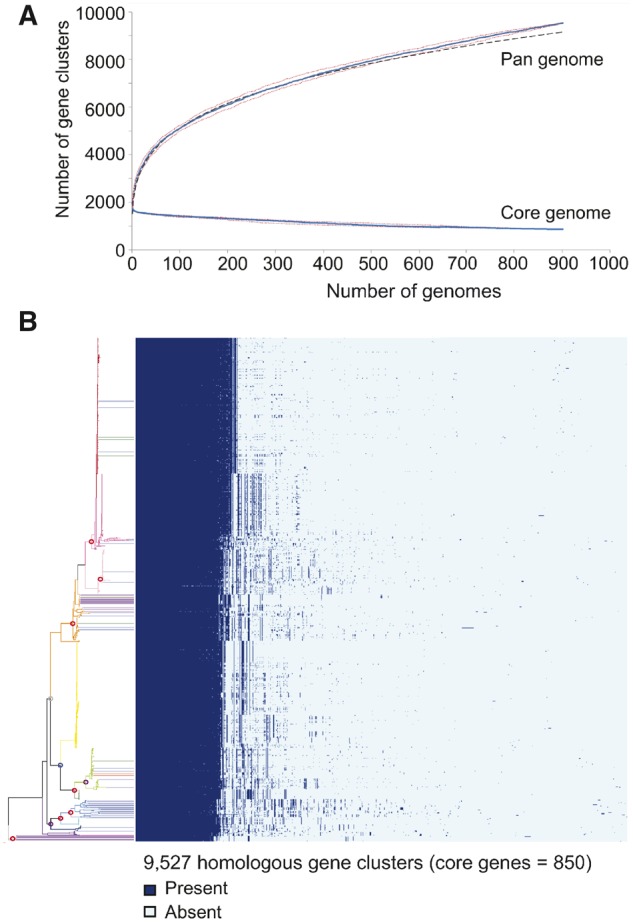
Streptococcus agalactiae pan and core genome content. (A) Core and pan genome plots. The solid blue lines indicate the median total number of gene clusters and number of core gene clusters, detected on successive sampling of the 901 genomes. The dashed black line (hidden behind blue core line) shows the predicted number of pan and core genome gene clusters, respectively. Dotted red lines indicate first and third quartiles. (B) Heatmap showing the distribution of the pan genome among isolates. Dark blue indicates presence of a gene and light blue indicates absence of a gene. The phylogeny is the same as shown in figure 1 and supplementary figure S1, Supplementary Material online, and follows the same color-coding.
To visualize the distribution of the pan genome among isolates, we used a gene presence–absence matrix to generate a heatmap and gene content dendogram (figs. 3B and 4 and supplementary fig. S2, Supplementary Material online). The heatmap showed the distribution of dispensable genes to mirror that of the branching pattern of the phylogeny and 12 populations. The gene content dendogram groups isolates according to shared gene content (the more genes isolates share, the closer they will cluster). With the exception of population 11, the dendogram showed that virtually all isolates grouped together according to their respective population, again showing that the distribution of dispensable genes was concordant with the population structure. Two populations deviated from this pattern. Notably, within the dendogram, seven bovine isolates from predominantly human-associated populations (1, 4, and 8) grouped with the bovine lineage rather than their respective lineages. All of these isolates possessed Lac.2 and they included the two isolates that possessed two copies of the operon. The Pearson and Jaccard distance measures produced virtually identical dendograms (supplementary fig. S2, Supplementary Material online). The only major discrepancy was for populations 3 and 8. In the Pearson dendogram, these populations were sister, whereas in the Jaccard dendogram, part of population 8 grouped immediately external to the population 3/8 grouping.
Gene Enrichment
Using Fisher exact tests, we tested for significant overrepresentation (enrichment) of dispensable genes and GO terms within populations. All populations were enriched for dispensable genes with the number of genes enriched ranging from 1,129 (population 5—bovine) to 94 (population 12—poikilothermic) (table 2 and supplementary table S6, Supplementary Material online). In total, 5,346 dispensable genes were enriched, representing 61.6% of the dispensable genome. With the exception of population 6, all populations showed enrichment for biochemical characteristics (GO terms) (supplementary table S7, Supplementary Material online). The number of terms enriched ranged from 80 (population 1) to 7 (population 10). There were several notable patterns of enrichment. For example, when comparing functional categories involved in human host-specialization (population 7 to all other human isolates, population 7 to all bovine isolates, and the three human-exclusive populations (2, 6, and 7) combined to all other human isolates), we found that human host-specialized populations were enriched in terms related to restriction-modification systems, membrane lipid processing, and DNA synthesis (supplementary table S8 and figs. S3 and S4, Supplementary Material online). Comparison of categories involved in bovine host-specialization (population 5 to all human isolates and population 5 to exclusively human-associated lineage isolates) showed that population 5 (bovine lineage) isolates were enriched in carbohydrate processing (particularly of lactose/disaccharides), genetic exchange, and DNA modification (supplementary table S8 and fig. S5, Supplementary Material online). Comparison of categories between populations 1 and 11 (previously grouped together as CC1), showed that population 1 was significantly enriched in viral structure/replication and DNA modification, whereas population 11 was enriched for genetic exchange and membrane lipid/cell wall processing (supplementary table S8 and fig. S4, Supplementary Material online). Lastly, when comparing population 12 (poikilothermic) and a cluster of fish isolates from population 4 (see below) both comparisons showed enrichment for galactose metabolism (supplementary table S7, Supplementary Material online).
Table 2.
Genes Correlated with Populations.
| Population ID | No. Genes Significantly Positively Correlated | Proportion of Dispensable Genome |
|---|---|---|
| 5 | 1,129 | 13.0 |
| 3 | 722 | 8.3 |
| 11 | 638 | 7.4 |
| 7 | 537 | 6.2 |
| 4 | 414 | 4.8 |
| 8 | 396 | 4.6 |
| 1 | 395 | 4.6 |
| 10 | 291 | 3.4 |
| 2 | 273 | 3.1 |
| 9 | 233 | 2.7 |
| 6 | 224 | 2.6 |
| 12 | 94 | 1.1 |
| Total | 5,346 | 61.6 |
Positive Selection
Using aligned homologous gene clusters that contained four or more gene copies (one gene copy/genome) (3,496 clusters), we assessed positive selection across the pan genome and after correction for multiple testing, 541 genes (15.5% of those tested) were significant for positive selection, with over 85% of these belonging to the dispensable genome (core = 79, dispensable = 462). Biochemical characteristics (1,111 GO terms) for dispensable genes that were under positive selection in each population were evaluated for population enrichment. Specifically, respective GO terms for each population (P1 = 168, P2 = 46, P3 = 107, P4 = 133, P5 = 101, P6 = 7, P7 = 176, P8 = 130, P9 = 2, P10 = 23, P11 = 144, P12 = 74) were compared with a background of terms for all remaining populations using Fisher exact tests as implemented in GOATOOLS (see Materials and Methods). After false discovery rate (FDR) correction, a total of 252 terms were enriched in ten of the 12 populations (1, 2, 3, 4, 5, 6, 7, 8, 11, and 12). Of these 252 terms, 200 were distinct, with 165 (82.5%) terms seen in only one population. The remainder (35–17.5%) was shared in either two or three populations (supplementary table S9, Supplementary Material online). Figure 5 shows the number of terms unique to each population and the number shared. The number of terms enriched in each population ranged from 2 (population 6) to 87 (population 7), with population 7 having over twice as many terms enriched when compared with the second highest population (population 5, 33 terms) (supplementary table S9, Supplementary Material online). There were multiple cases where the pattern of population GO term enrichment for positively selected genes showed concordance with the population enrichment for the entire dispensable genome described earlier (supplementary tables S3 and S5, Supplementary Material online). Notably, in both analyses, population 7 was enriched for cellular lipid/protein metabolic processes and DNA synthesis and population 5 was enriched for lactose/disaccharide catabolism.
Fig. 5.
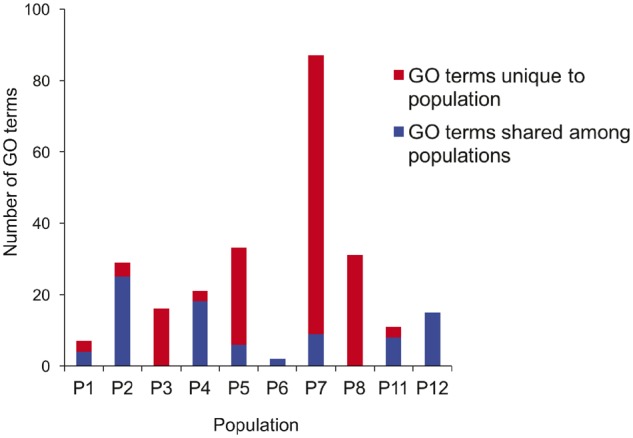
Chart showing the number of GO terms for genes under positive selection that were enriched in each population. Terms for each population were compared with a background of terms for genes under positive selection for all remaining populations. The number of terms unique to a population and the number shared are shown.
Discussion
Our analyses confirm earlier predictions (Tettelin et al. 2005) that the pan genome for S. agalactiae is vast (even when considering false positives). Furthermore, for the 901 S. agalactiae genomes analyzed here, we find that most of the pan genome is dispensable (91.1%), with this proportion likely even higher as the pan genome curve showed no evidence of plateauing (fig. 3A). This large diversity of dispensable gene content was strongly concordant with the population structure and phylogeny. Specifically, over half (61%) of genes within the dispensable genome were significantly correlated with populations, which, with the exception of population 6, additionally all showed enrichment for a diverse range of gene biochemical characteristics. Furthermore, 10 of the 12 populations were enriched for biochemical characteristics for genes under positive selection. This strong partitioning of dispensable gene content was in turn concordant with host range and previously reported niches for certain CCs (fig. 4). Combined, these findings reveal extensive gene gain/loss (genome plasticity) at the intraspecific level that is specific to distinct niches, suggesting that this process (often coupled with positive selection) is a major evolutionary mechanism driving adaptation. Specific examples of this process can be seen in the distribution of AbxR genes (fig. 1 and supplementary fig. S1, Supplementary Material online). For example, while tetM appears to be almost fixed in those populations either exclusively comprised of human isolates or dominated by them, it is absent in populations or lineages comprised of animal isolates (e.g., populations 5 [bovine] and 12 [poikilothermic]). In contrast, while Lac.2 is fixed in population 5, it is rare in the other populations. Similarly, Dogan et al. (2005) showed a skewed distribution of AbxR genes among human and bovine hosts for S. agalactiae and Mather et al. (2013) showed distinct AbxR genes to be largely retained within human and animal populations for Salmonella enterica serovar Typhimurium. Furthermore, Croucher et al. (2014) showed how different populations of Streptococcus pneumoniae could be discriminated by ICE carrying distinct cargo genes.
Fig. 4.

Gene content dendogram that clusters isolates according to the number of shared genes (same color-coding as fig. 1 and supplementary fig. S1, Supplementary Material online).
We recently showed that at the evolutionary scale of the genus the process of gene gain/loss during genome evolution was dynamic through time with periods of gain and periods of loss (Richards et al. 2014). For S. agalactiae, this process appears to continue at the intraspecies level. For example, during host adaptation, Rosinski-Chupin et al. (2013) argued that the poikilothermic lineage (population 12) underwent considerable gene loss and we found this population to have the lowest number of genes per genome. In addition, these isolates clustered tightly and took a basal position in the gene content dendogram reflecting strong dissimilarity in gene content. In contrast, the bovine lineage (population 5), whose isolates also clustered tightly in the gene content dendogram, had on an average the highest number of genes per genome (fig. 6), relatively long branches in the dendogram, and the highest number of genes correlated with a population, suggesting that gene gain was the dominant evolutionary force in this host adaptation. Indeed, this population is enriched for genes involved in genetic exchange (supplementary table S7, Supplementary Material online). The population was also enriched and under positive selection for carbohydrate processing (particularly lactose/disaccharides) likely reflecting adaptation to the high lactose environment of the bovine udder, with a specific example being the acquisition of Lac.2 (Richards et al. 2013).
Fig. 6.

Violin plots showing the density distribution of the number of genes per genome for each population and population groupings.
In addition to the poikilothermic lineage (population 12), population 4 also contained numerous fish isolates (21) and one frog isolate. These isolates clustered tightly in the phylogeny (figs. 1 and 7), with one lineage exclusively poikilotherm (17 fish and one frog). All 22 isolates clustered in a similar fashion in the gene content dendogram (fig. 4). The isolates originated from Taiwan, China, Kuwait, United States, and United Kingdom. These observations would suggest that these isolates share a genetic makeup that enables survival within a poikilotherm host. Furthermore, the exclusiveness of the lineage containing 18 isolates might suggest that this lineage is starting to specialize and adapt to this host. This lineage is highly divergent from the poikilothermic lineage of population 12 showing it to be an independent evolutionary event. Indeed, these isolates 1) clustered tightly and distantly from population 12 in the gene content dendogram, 2) showed a significant correlation in gene content when compared with all other isolates, and 3) showed significant enrichment in gene biochemical characteristics when compared with both this population and all populations combined. However, notably, these isolates shared enrichment for galactose metabolism with population 12. This finding is concordant with the work of Delannoy et al. (2014) who identified an operon for galactose metabolism specific to fish isolates.
Divergent gene content and biochemical enrichment that correlated with host type was also seen for the five seals that all clustered tightly in the phylogeny and gene content dendogram (figs. 1, 4, and 8, andsupplementary table S7, Supplementary Material online). Similarly, the camel isolate was distinct in the gene content dendogram and was biochemically enriched (fig. 4 and supplementary table S7, Supplementary Material online). Highly distinctive gene content and biochemical enrichment was also seen for the populations that either exclusively infect humans or are dominated by human isolates; for example, population 7 (CC17) (correlated with highly invasive neonatal infections) and population 1 (ST1) (an emerging population in nonpregnant adults correlated with bloodstream infections) (figs. 1 and 4 and supplementary fig. S1 and table S7, Supplementary Material online), showing that even when populations adapt to narrow niches within the same host environment, a high level of gene gain/loss specific to the niche is involved.
Fig. 8.

Subsection of figure 1 showing a more detailed view of populations 8 and 2.
Deviation from Population Neutrality and Genetic Diversity
Neutrality test statistics consistently showed that populations exclusively comprised of human isolates or dominated by them to have deviated from neutrality (table 1). However, we acknowledge that a limitation of our study was the skewed distribution of human isolates toward N. America and Europe and that this could have influenced these findings. Nevertheless, the strongest signal was for population 1 (97% human), followed by populations 7, 11, 2, 6, and 3 (100%, 95%, 100%, 100%, and 95% human). In general, these populations were also low for nucleotide diversity and theta. Theta is the product of the effective population size and the neutral mutation rate and reflects the mutation–drift balance occurring within a population. In contrast, population 5 (bovine) had by far the most positive values for the neutrality tests and very high values for nucleotide diversity and theta suggesting that this is an old and stable (nonexpanding) population that considerably outdates the more recent human-associated populations.
Da Cunha et al. (2014) suggested that the acquisition of the AbxR gene tetM and strong selection pressure due to the historically heavy use of tetracylcline was responsible for the expansion of several CCs that typically infect humans (CC1, CC10, CC17, CC19, and CC23). Our analyses delineated these CCs into the following populations: CC1 = populations 1 and 11, CC17 = population 7, CC19 = population 3, and CC23 = populations 2 and 8. With the exception of population 8, all of these populations deviated from neutrality and with one exception (population 2) tetM occurred in high frequency. As described earlier, tetM was absent in the poikilothermic population (12) and occurred in one isolate in the bovine-associated population (5). The remaining 17 AbxR genes showed the same pattern for these populations and appeared correlated with human-associated populations (table 1).
Of note is the high density of three erythromycin resistance genes within populations 1 (56.9%), 7 (25.8%), and 11 (78.4%) (fig. 1 and supplementary fig. S1, Supplementary Material online), with two of these genes (ermT and ermTR) under positive selection. This high level of resistance likely reflects the drug’s frequent use as an alternative to penicillin for patients with serious penicillin allergy (Verani et al. 2010), a practice now discouraged by the CDC. Although combined these findings provide support for the likely role AbxR genes play in the expansion of human-associated populations, it is interesting that tetM did not test positive for positive selection. This finding may be explained by its decreasing use and the consequential release of selective pressure (Chopra and Roberts 2001).
The high frequency of tetM in the human-associated populations is intriguing given that S. agalactiae infection is not treated with tetracycline (the species has maintained sensitivity to beta-lactams) (Verani et al. 2010). However, S. agalactiae is a frequent human commensal and may have developed resistance as a consequence of tetracycline treatment for a different infection. Da Cunha et al. (2014) showed that for S. agalactiae tetM was carried within a MGE and Chen et al. (2018) provided evidence for exchange of the gene within a MGE among numerous distantly related species. Consequently, the diversity of the human microbiome may have provided ample opportunity for S. agalactiae to acquire this resistance from other species.
Although AbxR genes are likely important factors in population expansion, population 2 showed significant deviation from neutrality and yet lacked all 18 resistance genes surveyed. Indeed, all populations showed very distinct gene content and 11 were biochemically enriched, suggesting that more complex combinations of genes may contribute to continued success and expansion of a population (including gene loss as an adaptive strategy for successful occupation of a new niche). It is also reasonable to assume that the gene gain experienced by the bovine-associated population (including acquisition of Lac.2) contributed to a historical population expansion within this host environment (the population has a wide geographic distribution: North/South America, Europe, and Australia) before the population reached its current stable state. It is also interesting that two lactose catabolism genes lacGR and three of the four fructose catabolism genes (fruCPR) were under positive selection further indicating that positive selection is not always correlated with ongoing population expansion. Similar to humans, the bovine gastrointestinal tract may act as an reservoir for S. agalactiae (Jorgensen et al. 2016) and the finding that the putative fructose catabolism genes (present in 1.4% of human isolates, 75.4% of bovine isolates and virtually fixed in the bovine adapted population) are under positive selection lends support to the proposal that possession of these genes is an adaptation that enhances survival in this extramammary environment. A similar adaptive process has been reported for another zoonotic pathogen: multidrug resistant Klebsiella pneumoniae, where bovine adapted isolates acquired an operon for lactose catabolism via lateral gene transfer (LGT) (Holt et al. 2015).
Genome Plasticity and Adaptation
Given the high genome plasticity (gene gain/loss) detected, it seems likely that bacteria with this characteristic can rapidly gain or lose the genes required for adaptation to a new host or niche (Tian et al. 2012; Rosinski-Chupin et al. 2013; Qin et al. 2014; Zhang and Sievert 2014; Almeida et al. 2016; Jeukens et al. 2017; Petrovska et al. 2017). More specifically, once a strain that is capable of surviving in a new environment is introduced, it can rapidly turn over (or sample) genes from other bacteria until a combination suitable for the new environment is achieved. This process serves to continually expand and diversify the dispensable genome, which can result in a vast and open pan genome (as is the case for S. agalactiae). The extent of the dispensable genome and the LGT and recombination detected here coupled with our finding that 94.3% of isolates possessed one or more MGE (an average of 2.3 MGE per isolate) suggests a strong capability for LGT, which would facilitate this rapid gene turn over. However, Sheppard et al. (2014) proposed that ecological niche partitioning might be responsible for restricting LGT mediated gene flow for Campylobacter jejuni among humans and livestock, and a notable finding in our study was the strong gene partitioning among populations, which persisted despite the strong LGT capability. Furthermore, we found strong evidence for distinct positive selection among populations. This suggests that LGT and strong selection pressure created by distinct functional requirements of a niche act in balance to maintain the gene partitioning.
Another mechanism that could maintain gene partitioning despite high LGT is the CRISPR-Cas immunity system, which, by cleaving invading genetic elements, would prevent successful lateral transfer of genes (Bikard et al. 2012). Lopez-Sanchez et al. (2012) reported the presence of two CRISPR-Cas systems in S. agalactiae: CRISPR1 and CRISPR2, with CRISPR1 thought to be active due to its high diversity of repeat arrays. Our pan genome delineation showed the CRISPR1 cas gene cassette to be virtually core, with the single isolate lacking the cassette possessing genes for the restriction endonuclease BgcI. This suggests an essential role for an immunity system and its activity may be contributing to the maintenance of gene partitioning. However, for S. pneumoniae, where restriction-modification systems are the major immunity mechanism, Croucher et al. (2014) suggested that the activity of these systems was not responsible for gene partitioning. Nevertheless, a role for CRISPR1 activity in maintaining S. agalactiae gene partitioning cannot be ruled out. Indeed, cas2 was under positive selection.
Population 4 appears to have opportunistic (generalist) characteristics as it contains human, bovine, fish, frog, canine, and dolphin isolates (63% human, 37% animal, fig. 7 and supplementary table S1, Supplementary Material online). Consequently, the possible poikilotherm adaption discussed earlier may be an example of a generalist to specialist evolutionary process. In general, the clustering within the gene content dendogram was concordant with the phylogeny. However, there was one notable exception: populations 4 and 5, which although distantly related within the phylogeny, grouped together in the gene content dendogram. A likely explanation for this pattern is LGT between these populations. Given the generalist characteristic of population 4 and the large proportion of human isolates it contains, human hosts seem the most likely vector for transmission among these diverse animal hosts (also considering the mobility and size of the human population). These two populations share enrichment for carbohydrate metabolism, which contrasts with the exclusively human or human dominated populations that lack this enrichment. Isolates from other animal hosts also showed enrichment for carbohydrate metabolism: (population 12 [poikilotherm], the poikilotherm lineage within population 4, and the camel). Given that exclusively human or human dominated populations are more recent in origin, a possible explanation for their depletion in carbohydrate metabolism is gene loss (with this being the derived state). It is interesting to note that within the Streptococcus genus, the pyogenic group (which includes S. agalactiae) are also enriched for carbohydrate metabolism (Richards et al. 2014) and relatively speaking within the genus this group contains more species adapted to animal hosts, lending further support for carbohydrate metabolism depletion being the derived state.
Fig. 7.

Subsection of figure 1 showing a more detailed view of population 4.
Transfer of Genes from Human-Associated Populations to Agriculture, Wildlife, and Companion Animals
Our findings show that the process of host/niche adaption is an ongoing and dynamic process through time where populations can take divergent evolutionary trajectories to become adapted and specialized to particular hosts or niches. However, populations can reconnect when strains or genes from one population spillover or leak into another. The gene content and phylogenetic placement of multiple isolates provide evidence for this process. For example, there were 14 cases where strains that had evolved in populations well adapted (specialized) to humans (populations 1, 3, and 11) were isolated from bovines (fig. 1 and supplementary fig. S1, Supplementary Material online). Furthermore, all but one of these isolates possessed Lac.2, which would have most likely been acquired in the bovine udder, demonstrating how quickly the process of gene gain and adaptation to a new environment can occur.
In addition, ten of these strains possessed tetM demonstrating how a gene acquired in one host (here: human) can ultimately be transmitted into another (here: bovine). It is not likely that the gene was acquired within the bovine udder as tetracycline is rarely used to treat bovine mastitis and our analyses show it to be rare in this environment. Furthermore, the biased direction of transmission between humans and bovines support human to bovine transmission. The leakage of tetM was not restricted to bovines as four of the five canine isolates, all five of the seal isolates, and two fish isolates possessed it. The two fish isolates were part of the four isolates from population 4 discussed earlier that were likely isolated transmission events. Human associated bacteria and protozoa have been isolated from several marine mammal species that inhabit coastal urban areas (Conrad et al. 2005; Stoddard et al. 2005; Greig et al. 2007; Shapiro et al. 2012), and Baily et al. (2015) suggested that the zoonotic pathogen C. jejuni might have been transmitted from humans to coastal gray seals via human sewage. Our seal isolates were also collected from coastal animals and a similar infection route has been proposed (Delannoy et al. 2013). For companion dogs, there are multiple reports of possible exchange of pathogens with humans typically due to frequent contact or bites (Morse et al. 1976; Abbott et al. 2010; Ferreira et al. 2011; Konig et al. 2014; Schrieber et al. 2014), and Erwin et al. (2004) reported a specific case of human to companion dog transfer. Although less common, there are also reports of transmission between humans and fish (Jafar et al. 2008; Delannoy et al. 2013; Gauthier 2015), and again sewage has been shown to be a transmission route (Jafar et al. 2008).
The ramifications of gene leakage from human-associated populations into agriculture, companion animals, and wildlife are difficult to predict. However, much will depend on the host environment. For example, tetracycline is currently used to treat companion animal infections and therefore selection pressure for resistance does exist. Indeed, tetracycline resistance has been reported for Streptococcus canis and Streptococcus intermedius isolated from canines (Pedersen et al. 2007). There were 16 examples where human isolates that had evolved in populations well adapted (specialized) to humans (populations 1, 7, and 11) possessed Lac.2. Given that only 2.8% of isolates in these populations possessed the operon, there is a strong possibility that these isolates (or their immediate ancestors) acquired the operon in the bovine environment. If this were the case, then human–bovine–human transmission may have occurred. This scenario describes a situation where genes selected in the bovine environment are able to leak into the human environment. However, the biased direction of transmission between humans and bovines would suggest that this leakage is less frequent than human to bovine. Again, the ramifications of this leakage are difficult to predict. However, as with bovine milk, human milk contains numerous bacteria that include the Streptoccoci, that again similar to bovines are a common cause of human mastitis (Fernandez et al. 2013). Consequently, selection pressure for Lac.2 within the human-associated population does exist. Regardless of the direction and frequency of gene leakage, our findings highlight a mechanism where new and foreign genes can be introduced into hosts.
Conclusion
Our study demonstrates how high bacterial genome plasticity can facilitate an expansive and highly partitioned pan genome. As the pan genome expands, continued adaptation to a diverse landscape of niches produces multiple biochemically diverse and divergent populations. Moreover, this on-going compartmentalization creates multiple pathways for gene acquisition facilitating continued pan genome expansion. Although high plasticity has the potential to break down partitioning, a combination of niche specific selection pressure and active immunity are likely important factors maintaining the partitioning. Despite this compartmentalization, populations can reconnect via gene spillover. In particular, population expansion can cause directionally biased spillover, demonstrating how a gene selected in one niche or host can ultimately be transmitted into another.
Materials and Methods
Isolates, Assembly, Alignment, Recombination Detection, Phylogenetic Analyses, and Population Delineation
As part of this study, 235 isolates were sequenced (representing human, bovine, canine, frog, fish, and seal hosts from all geographic regions) (100 bp paired-end reads—Illumina HiSeq) and assembled using SPAdes v3.1 (Bankevich et al. 2012). To this, we added data for an additional 666 isolates that were available at NCBI (representing all hosts and geographic locations). For consistency, we reassembled (or assembled) as many genomes as possible. The majority (840) were assembled using SPAdes, while 13 were assembled using Velvet (Zerbino and Birney 2008) (Velvet outperformed SPAdes in these instances based on assembly size and N50). The remaining 48 were not reassembled because they were either closed (25) or reads were not available (23).
Mapping of reads was accomplished using the software REALPHY (Bertels et al. 2014) that allows mapping against multiple reference genomes and finally produces a nonredundant alignment merging all the individual alignments. The final alignment also includes nonpolymorphic sites in addition to SNPs. We utilized ten closed genomes that gave a good representation of the genetic diversity for the species (highlighted in supplementary table S1, Supplementary Material online). This determination was obtained from a preliminary Neighbor Joining phylogeny, the alignment for which was obtained by concatenating the putatively nonrecombinant core genes (see below). Using REALPHY, assembled contigs were divided into 50 bp chunks and aligned to each reference. BratNextGen (Marttinen et al. 2012) was used to assess the alignment for recombination, with the default settings using 20 iterations of the estimation. Statistically significant recombinant positions (P < 0.05) were determined through a bootstrap test with 100 permutations. Nucleotide positions predicted to be recombinant were removed from the REALPHY alignment and the remaining putatively recombination-free alignment, 954,528 bp, was used for phylogenetic analysis. A maximum likelihood (ML) phylogeny was constructed using RAxML v8.2 (Stamatakis 2014) using the GTR gamma substitution model and performing 500 bootstrap replicates. All dendrograms in the figures were constructed using the ggtree R package (Yu et al. 2017).
A Bayesian clustering analysis as implemented in BAPS v6 (Cheng et al. 2013) was used to delineate the population structure. Within a Bayesian framework, the approach first determines the optimal number of genetically distinct clusters (populations) (K) such that the genetic variation within clusters is minimized and the variation among is maximized. Each isolate is then assigned to a population (or populations if the isolate has mixed ancestry). More specifically, the posterior probability distribution of model parameters from a mixture model derived using Bayesian predictive classification theory are sampled using a Metropolis-Hastings implementation of Markov Chain Monte Carlo (MCMC) probability distribution sampling. Model parameters represent SNP frequencies and individual/SNP population assignment probabilities. A SNP matrix was generated from the nonrecombinant REALPHY alignment and was used as input for BAPS. Population assignment coefficients were obtained using 100 iterations. The level of admixture (mixed ancestry) was obtained using 10 reference individuals and 50 iterations.
For all 901 assembled genomes, open reading frames were located and annotated using Prokka (Seemann 2014). To delineate the pan genome, amino acid sequences from all genomes were delineated into clusters with putative shared homology using the pan genome pipeline Roary (Page et al. 2015). The pipeline first collapses redundant gene sequences and then uses the Markov cluster (MCL) algorithm of Enright et al. (2002) to assign sequences to clusters with putative shared homology, with this shared homology based on a BLASTp search between all pairs of protein sequences using a sequence identity threshold of 95%. Core gene clusters were those containing at least one gene from each of the 901 genomes.
To perform a Bayesian migration analysis (see below) we identified 450 core clusters that contained only one gene from each genome. The nucleotide sequences for each of these clusters were aligned using PRANK (Loytynoja 2014). Recombination and LGT have the potential to confound this analysis. Consequently, these core gene cluster alignments were assessed for recombination using the Pairwise Homoplasy Index (PHI) as implemented in Phi (Bruen et al. 2006). Phi is compatibility method that examines pairs of aligned nucleotide sites for homoplasy. In addition, amino acid sequences representing these core gene clusters were assessed for LGT using HGTector (Zhu et al. 2014). Utilizing genomic sequence data at NCBI, the approach evaluates BLAST hit distribution patterns to establish thresholds that are used to determine if a gene does or does not conform to a typical pattern of vertical inherence. For the test, representative sequences from 51 isolates distributed throughout the populations identified by BAPS (three to four isolates per population) were used. The isolates selected for HGTector were those that had NCBI taxonomy IDs and could be specifically queried by HGTector. Phi determined 66 gene clusters to be recombinant, while HGTector detected 24 gene clusters that putatively had been subject to lateral transfer (3 clusters were detected by both methods). These gene clusters (87) were removed from the core set. All gaps in the remaining 363 core gene cluster nucleotide alignments were removed using trimAl (Capella-Gutierrez et al. 2009) and a single additional gene cluster was removed because gaps extended across the entire alignment leaving no nucleotides after gap removal. This left 362 putatively nonrecombinant single-copy core gene clusters that were used for Bayesian migration analysis.
Population Genetic Diversity
Genetic diversity indices for each population were calculated using DnaSP (Librado and Rozas 2009). An important consideration when evaluating population genetic diversity measures is sampling bias. Specifically, deviation from neutrality could be due to repeated sampling of the same individual or closely related individuals from an outbreak. However, although the distribution of isolates in most of the human-associated populations was skewed toward either Canada or United States (see below), the generally wide geographic distribution of isolates in these populations, collection time frames of at least 4 years for geographically proximate isolates, and distinct gene content for all isolates should mitigate these concerns. Furthermore, the bovine associated population showed a strong skew toward United States (59%), yet this population showed a very different pattern of genetic diversity to the human-associated populations.
Specifics regarding the human-associated populations are as follows. Populations 1, 3, 7, and 11 all contained isolates from Australia, N. Europe, W. Europe, E. Europe, and N. America (supplementary table S1, Supplementary Material online). In addition, populations 1, 3, and 11 contained isolates from Asia, and populations 7 and 11 contained isolates from Africa. In population 1, 49% of isolates were from Houston and 27% from Toronto. However, these isolates were collected over 21 and 4 years, respectively. The situation was similar for populations 7 and 11. Population 7: France = 19% (collected over 66 years), Toronto = 48% (collected over 4 years). Population 11: Saskatchewan = 24% (collected over 5 years), Manitoba = 32% (collected over 5 years). Populations 2 and 6 were less diverse. Population 6 contained isolates from Australia, W. Europe, and N. America. Population 2 contained isolates from N. America. The isolates in population 2 were collected over 4 years. The time frame for population 6 was unknown.
Core/Pan Gene Content and Gene Ontology Term Enrichment Analyses
A binary gene (cluster) presence–absence matrix describing the pan genome (produced from the homologous gene clustering) was used to generate a heatmap using the default heatmap function in R. The same gene presence–absence matrix was used to create dendograms showing the proportion of genes shared between pairs of isolates. Two different distance measures were employed in each. The first was Pearson correlation coefficient. Glazko et al. (2005) compared 25 distance measures and found the use of a correlation coefficient to be the most accurate. Additional studies evaluating distance measures for microarray and RNAseq data have found the Pearson correlation coefficient to be the most accurate (Jaskowiak et al. 2014; Kim et al. 2018). The second distance measure was Jaccard, which is often used to generate this type of dendogram. The dendogram clustering was performed using the Neighbor Joining agglomerative algorithm. When applied to the clustering of homologous gene clusters, this approach has been shown to be more accurate than divisive clustering algorithms (Glazko and Mushegian 2004).
Pan genome plots were generated by randomizing input order of the genomes 100 times to obtain the median and 1st/3rd quartiles. Heaps’ Law (Heaps 1978) was then used as the model and fitted to the median. Heaps’ Law is a power law model used in data retrieval where the number of distinct words observed in a document is a function of the document length. Tettelin et al. (2008) demonstrated that this law could be used to predict whether a pan genome was open or closed. Heaps’ law can be represented as n = k×Nγ, where N is the number of genomes added, and k and γ are model fitting parameters determined empirically by the data. Whether the pan genome can be considered open or closed is determined using the alpha parameter: α = 1− γ. If α > 1, the pan genome is considered closed (the curve is predicted to plateau). If α ≤ 1, the pan genome is considered open (the curve is predicted to not plateau).
Enrichment of dispensable genes within each population when compared with all others was determined using Fisher exact tests within Scoary (Brynildsrud et al. 2016). Gene Ontology (GO) terms were assigned to each genome using Interproscan (Jones et al. 2014) in default mode, and the output was used to assess term enrichment in different populations when compared with all others using Fisher exact tests as implemented in the find_enrichment.py script in GOATOOLS v0.5.9 (Klopfenstein et al. 2018). In both enrichment tests described earlier, P values were adjusted to account for increased type I errors due to multiple hypothesis testing following the FDR procedure of Benjamini and Hochberg (1995). Tests were judged significant when the adjusted P value fell below the FDR threshold of 0.05.
Significantly enriched/depleted terms were visualized using REVIGO (Supek et al. 2011) by reducing the number of nonredundant terms at an allowed similarity of 0.4, and plotted using multidimensional scaling based on semantic similarity of the GO terms. Custom R scripts generated by REVIGO were downloaded from the REVIGO website and used to generate graphs in R. Circles representing summarized GO terms were sized based on frequency of the GO term in the UniProt database (where higher numbers are more general terms), and colored based on the log10 P value of the representative GO term for the summarized group.
Bayesian Migration Analyses
Using gene sequence (nucleotide) alignments for the 362 putatively nonrecombinant core gene set, we estimated the number of bacteria migrants per generation among human, bovine, and fish hosts using the parallel version of the software MIGRATE-n v3.6.4 (Beerli 2006). The approach estimates effective population size and past migration rates by estimating two parameters (Θ and M) using an expansion of coalescent theory, which includes migration (Beerli and Felsenstein 2001). Θ represents mutation-scaled population size and M represents mutation-scaled immigration rate (immigration rate, m/mutation rate, μ). The parameters were estimated using a Markov chain Monte Carlo (MCMC) sampling procedure. Specifically, we used the program’s Bayesian framework to estimate parameters Θ and M using two chains of 500,000 steps each with a burn in of 100,000 steps. A static heating scheme was used with the following temperatures: 1.0, 1.5, 3.0, and 1,000,000. Boundaries for uniform prior distributions were established empirically via shorter preliminary runs. Posterior probability distributions of preliminary runs were evaluated to assess convergence and used to guide establishment of the above settings and subsequently used to ensure convergence of all final runs. The run examining migration among hosts was performed using all bovine isolates (61) and all fish isolates (29), but an independently, randomly selected set of 61 human isolates for each run. This procedure was repeated three times and results averaged. Migrants per generation for haploid data were calculated using [Θ(m/μ)]/2.
Screening for Antibiotic Resistance Genes, Capsule Genotypes, and PI
The presence or absence of AbxR genes was determine using a large-scale BLAST score ratio approach (LS-BSR) with the tBLASTn option as described in Sahl et al. (2013, 2014). Following Sahl et al. (2015), a gene was considered present with significant similarity if its BSR value was ≥0.80 and absent if BSR was <0.40. A BSR value of 0.80 corresponds to ∼80% protein identity over 80% of the sequence length. We again used a LS-BSR approach to determine capsule serotypes based on previously published serotype-specific primers (Borchardt et al. 2004; Poyart et al. 2007; Imperi et al. 2010). Serotype-specific reference sequences were extracted based on the primer pairs described in Borchardt et al. (2004) (serotype IA, IB, and II to VIII), Poyart et al. (2007) (serotype IA, IB, and II to VIII), and Imperi et al. (2010) (serotype IX). These sequences were then used to search for their homologs in the genome assemblies. We first screened our strains using Borchardt et al.’s method, and if the serotype was not resolved by this method, we used Poyart et al.’s method. Both these methods lacked primers to distinguish serotype IX, so we used Imperi et al.’s primers to identify serotype IX. Serotype-specific reference sequences were always included in all BLAST analyses as a positive control. The distribution of genes encoding three PI types among strains was determined using the type-specific primers described in Martins et al. (2010) and Springman et al. (2014). PI-1, PI-2a, and PI-2b-specific reference sequences were extracted and used in a LSR-BSR to search for their homologues in our strains. They were first screened using Martins et al.’s method, and if the PI type was not resolved by this method, Springman et al.’s method was used. All genomes were searched for the lactose catabolism operon (Lac.2), nitrogen regulatory protein P-II, and fructose catabolism operon (fruRPCD) using BLASTn.
Screening for MGEs
We screened all genomes for the presence of four types of MGE: prophages, ICE, IME, and plasmids. We screened for prophages using the ProphET tool (available from: github.com/jaumlrc/ProphET). ProphET first searches each gene in a genome against a continually updated reference database of all prophage genes available at NCBI (as of 2017 the number was 142,575). Next, an iterative process of a sliding 10-kb windows is used to identify areas of high prophage gene density. Lastly, putative prophages are delineated by searching for flanking tRNAs, as these genes are hotspots for prophage integration. We screened for ICEs and IMEs using a local installation of the ICEfinder tool (ICEfinder_local.pl) available at http://202.120.12.136/ICEfinder/ICEfinder.html; last accessed March 15, 2019. The approach first detects recombination and conjugation gene cassettes using Hidden Markov Model (HMM) profiles. The origin of transfer site (oriT) is detected using a homology search against a database of 1,074 oriT sequences. Elements carrying an integrase gene, a relaxase gene, and a type IV secretion system (T4SS) (typical of virtually all ICE) are considered T4SS-type ICE. Elements with an integrase and relaxase gene, but lacking a T4SS, are considered IME. Genes within the identified prophage, ICE, and IME were searched against databases for AbxR genes and VF genes. These databases contained 2,522 VF gene sequences from the VFDB (Chen et al. 2012) and Victor (www.phidias.us/victors) databases, and 2,454 AbxR gene sequences from the following six databases: ARDB, CARD, BacMet, CBMAR, ResFinder, and ARG-ANNOT (Liu and Pop 2009; McArthur et al. 2013; Gupta et al. 2014; Pal et al. 2014; Srivastava et al. 2014; Zankari 2014). We screened for plasmids using BLASTn. We searched for five plasmid sequences reported in the literature for S. agalactiae: pCCH208 (accession no. KJ778678), pGB2001 (accession no. JF308630), pGB2002 (accession no. JF308629), pPI501 (accession no. KP698941), and pNEM316-1 (extracted from the genome of strain NEM316, see supplementary table S1, Supplementary Material online). pCCH208, pGB2001, and pGB2002 contain the ermT gene for erythromycin resistance and pPI501 contains the aacA-aphD gene for gentamicin resistance. A plasmid was judged present if the BLAST alignment had 80% or greater coverage and 95% or greater sequence identity. Given that conjugation is a frequent mechanism used to transfer genetic material among bacterial cells, we also searched all genomes for the presence of type IV conjugation systems using the CONJscan module of MacSyFinder (Abby et al. 2014). The module uses profile HMMs to search for clusters of T4SS, relaxase, and type IV coupling signature proteins.
Positive Selection
We assessed positive selection across the pan genome using the branch-site unrestricted statistical test for episodic diversification (BUSTED) (Murrell et al. 2015) as implemented in HyPhy (Pond et al. 2005). Homologous gene clusters determined using Roary that contained four or more gene copies (one gene copy per genome) were used in the analysis (3,496 clusters). This minimum number of gene copies was due to the phylogenetic software (RAxML—see below), as it requires four or more OTUs to construct a phylogeny. Each cluster was aligned using a codon guided global alignment with MUSCLE (Edgar 2004). Phylogenies for each alignment were created using RAxML v8.2 (Stamatakis 2014) using the GTR gamma substitution model. FDR was used to correct for multiple hypothesis testing (FDR = 0.05).
Multilocus Sequence Typing
Multilocus sequence types were determined for each isolate by aligning Illumina reads to multilocus sequence type allele nucleotide sequences using Bowtie2 (Langdon 2015) as implemented in the software SRST2 (Inouye et al. 2014) (supplementary table S1, Supplementary Material online).
Supplementary Material
Supplementary data are available at Molecular Biology and Evolution online.
Supplementary Material
Acknowledgments
This work was supported by federal funds from the National Institute of Allergy and Infectious Diseases, National Institutes of Health, Department of Health and Human Services (contract number HHSN272200900007C and grant number AI073368 to M.J.S.); and by the USDA National Institute of Food and Agriculture Research Initiative Postdoctoral Fellowship (grant no. 2013-67012-21020 to V.P.R.). We thank Christian Delannoy, Terutoyo Yoshida, Hugh Ferguson, Carlos Iregui, Paola Barato, Temdoung Somsiri, Janenuj Wongtavatchai, Margaret Crumlish, and Francois Lieffrig for providing fish isolates, and H. Dele Davies and Barbara Spellerberg for providing human isolates from Canada and Germany respectively.
References
- Abbott Y, Acke E, Khan S, Muldoon EG, Markey BK, Pinilla M, Leonard FC, Steward K, Waller A.. 2010. Zoonotic transmission of Streptococcus equi subsp. zooepidemicus from a dog to a handler. J Med Microbiol. 59:120–123. [DOI] [PubMed] [Google Scholar]
- Abby SS, Neron B, Menager H, Touchon M, Rocha EP.. 2014. MacSyFinder: a program to mine genomes for molecular systems with an application to CRISPR-Cas systems. PLoS One 910:e110726.. [DOI] [PMC free article] [PubMed] [Google Scholar]
- Almeida A, Alves-Barroco C, Sauvage E, Bexiga R, Albuquerque P, Tavares F, Santos-Sanches I, Glaser P.. 2016. Persistence of a dominant bovine lineage of group B Streptococcus reveals genomic signatures of host adaptation. Environ Microbiol. 1811:4216–4229. [DOI] [PubMed] [Google Scholar]
- Baily JL, Meric G, Bayliss S, Foster G, Moss SE, Watson E, Pascoe B, Mikhail J, Pizzi R, Goldstone RJ, et al. 2015. Evidence of land-sea transfer of the zoonotic pathogen Campylobacter to a wildlife marine sentinel species. Mol Ecol. 241:208–221. [DOI] [PubMed] [Google Scholar]
- Bankevich A, Nurk S, Antipov D, Gurevich AA, Dvorkin M, Kulikov AS, Lesin VM, Nikolenko SI, Pham S, Prjibelski AD, et al. 2012. SPAdes: a new genome assembly algorithm and its applications to single-cell sequencing. J Comput Biol. 195:455–477. [DOI] [PMC free article] [PubMed] [Google Scholar]
- Beerli P. 2006. Comparison of Bayesian and maximum likelihood inference of population genetic parameters. Bioinformatics 223:341–345. [DOI] [PubMed] [Google Scholar]
- Beerli P, Felsenstein J.. 2001. Maximum likelihood estimation of a migration matrix and effective population sizes in n subpopulations by using a coalescent approach. Proc Natl Acad Sci U S A. 988:4563–4568. [DOI] [PMC free article] [PubMed] [Google Scholar]
- Benjamini Y, Hochberg Y.. 1995. Controlling the false discovery rate: a practical and powerful approach to multiple testing. J R Stat Soc B. 57:289–300. [Google Scholar]
- Bertels F, Silander OK, Pachkov M, Rainey PB, van Nimwegen E.. 2014. Automated reconstruction of whole-genome phylogenies from short-sequence reads. Mol Biol Evol. 315:1077–1088. [DOI] [PMC free article] [PubMed] [Google Scholar]
- Bikard D, Hatoum-Aslan A, Mucida D, Marraffini LA.. 2012. CRISPR interference can prevent natural transformation and virulence acquisition during in vivo bacterial infection. Cell Host Microbe. 122:177–186. [DOI] [PubMed] [Google Scholar]
- Bisharat N, Jones N, Marchaim D, Block C, Harding RM, Yagupsky P, Peto T, Crook DW.. 2005. Population structure of group B Streptococcus from a low-incidence region for invasive neonatal disease. Microbiology 151(Pt 6):1875–1881. [DOI] [PubMed] [Google Scholar]
- Bishop EJ, Shilton C, Benedict S, Kong F, Gilbert GL, Gal D, Godoy D, Spratt BG, Currie BJ.. 2007. Necrotizing fasciitis in captive juvenile Crocodylus porosus caused by Streptococcus agalactiae: an outbreak and review of the animal and human literature. Epidemiol Infect. 1358:1248–1255. [DOI] [PMC free article] [PubMed] [Google Scholar]
- Bohnsack JF, Whiting A, Gottschalk M, Dunn DM, Weiss R, Azimi PH, Philips JB 3rd, Weisman LE, Rhoads GG, Lin FY.. 2008. Population structure of invasive and colonizing strains of Streptococcus agalactiae from neonates of six U.S. Academic Centers from 1995 to 1999. J Clin Microbiol. 46:1285–1291. [DOI] [PMC free article] [PubMed] [Google Scholar]
- Borchardt SM, Foxman B, Chaffin DO, Rubens CE, Tallman PA, Manning SD, Baker CJ, Marrs CF.. 2004. Comparison of DNA dot blot hybridization and lancefield capillary precipitin methods for group B streptococcal capsular typing. J Clin Microbiol. 42:146–150. [DOI] [PMC free article] [PubMed] [Google Scholar]
- Brochet M, Couve E, Zouine M, Vallaeys T, Rusniok C, Lamy MC, Buchrieser C, Trieu-Cuot P, Kunst F, Poyart C, et al. 2006. Genomic diversity and evolution within the species Streptococcus agalactiae. Microbes Infect. 85:1227–1243. [DOI] [PubMed] [Google Scholar]
- Bruen TC, Philippe H, Bryant D.. 2006. A simple and robust statistical test for detecting the presence of recombination. Genetics 1724:2665–2681. [DOI] [PMC free article] [PubMed] [Google Scholar]
- Brynildsrud O, Bohlin J, Scheffer L, Eldholm V.. 2016. Rapid scoring of genes in microbial pan-genome-wide association studies with Scoary. Genome Biol. 171:238.. [DOI] [PMC free article] [PubMed] [Google Scholar]
- Capella-Gutierrez S, Silla-Martinez JM, Gabaldon T.. 2009. trimAl: a tool for automated alignment trimming in large-scale phylogenetic analyses. Bioinformatics 25:1972–1973. [DOI] [PMC free article] [PubMed] [Google Scholar]
- Chen L, Xiong Z, Sun L, Yang J, Jin Q.. 2012. VFDB 2012 update: toward the genetic diversity and molecular evolution of bacterial virulence factors. Nucleic Acids Res. 40(Database issue):D641–645. [DOI] [PMC free article] [PubMed] [Google Scholar]
- Chen Y, Hammer EE, Richards VP.. 2018. Phylogenetic signature of lateral exchange of genes for antibiotic production and resistance among bacteria highlights a pattern of global transmission of pathogens between humans and livestock. Mol Phylogenet Evol. 125:255–264. [DOI] [PubMed] [Google Scholar]
- Cheng L, Connor TR, Siren J, Aanensen DM, Corander J.. 2013. Hierarchical and spatially explicit clustering of DNA sequences with BAPS software. Mol Biol Evol. 305:1224–1228. [DOI] [PMC free article] [PubMed] [Google Scholar]
- Chopra I, Roberts M.. 2001. Tetracycline antibiotics: mode of action, applications, molecular biology, and epidemiology of bacterial resistance. Microbiol Mol Biol Rev. 65:232–260. [DOI] [PMC free article] [PubMed] [Google Scholar]
- Conrad PA, Miller MA, Kreuder C, James ER, Mazet J, Dabritz H, Jessup DA, Gulland F, Grigg ME.. 2005. Transmission of Toxoplasma: clues from the study of sea otters as sentinels of Toxoplasma gondii flow into the marine environment. Int J Parasitol. 35(11–12):1155–1168. [DOI] [PubMed] [Google Scholar]
- Croucher NJ, Coupland PG, Stevenson AE, Callendrello A, Bentley SD, Hanage WP.. 2014. Diversification of bacterial genome content through distinct mechanisms over different timescales. Nat Commun. 5:5471.. [DOI] [PMC free article] [PubMed] [Google Scholar]
- Da Cunha V, Davies MR, Douarre PE, Rosinski-Chupin I, Margarit I, Spinali S, Perkins T, Lechat P, Dmytruk N, Sauvage E, et al. 2014. Streptococcus agalactiae clones infecting humans were selected and fixed through the extensive use of tetracycline. Nat Commun. 5:4544.. [DOI] [PMC free article] [PubMed] [Google Scholar]
- Delannoy CM, Crumlish M, Fontaine MC, Pollock J, Foster G, Dagleish MP, Turnbull JF, Zadoks RN.. 2013. Human Streptococcus agalactiae strains in aquatic mammals and fish. BMC Microbiol. 13:41.. [DOI] [PMC free article] [PubMed] [Google Scholar]
- Delannoy CM, Zadoks RN, Crumlish M, Rodgers D, Lainson FA, Ferguson HW, Turnbull J, Fontaine MC.. 2014. Genomic comparison of virulent and non-virulent Streptococcus agalactiae in fish. J Fish Dis. [DOI] [PubMed] [Google Scholar]
- Dogan B, Schukken YH, Santisteban C, Boor KJ.. 2005. Distribution of serotypes and antimicrobial resistance genes among Streptococcus agalactiae isolates from bovine and human hosts. J Clin Microbiol. 4312:5899–5906. [DOI] [PMC free article] [PubMed] [Google Scholar]
- Edgar RC. 2004. MUSCLE: multiple sequence alignment with high accuracy and high throughput. Nucleic Acids Res. 325:1792–1797. [DOI] [PMC free article] [PubMed] [Google Scholar]
- Enright AJ, Van Dongen S, Ouzounis CA.. 2002. An efficient algorithm for large-scale detection of protein families. Nucleic Acids Res. 307:1575–1584. [DOI] [PMC free article] [PubMed] [Google Scholar]
- Erwin PC, Bemis DA, McCombs SB, Sheeler LL, Himelright IM, Halford SK, Diem L, Metchock B, Jones TF, Schilling MG, et al. 2004. Mycobacterium tuberculosis transmission from human to canine. Emerging Infect Dis. 1012:2258–2210. [DOI] [PMC free article] [PubMed] [Google Scholar]
- Fernandez L, Langa S, Martin V, Maldonado A, Jimenez E, Martin R, Rodriguez JM.. 2013. The human milk microbiota: origin and potential roles in health and disease. Pharmacol Res. 691:1–10. [DOI] [PubMed] [Google Scholar]
- Ferreira JP, Anderson KL, Correa MT, Lyman R, Ruffin F, Reller LB, Fowler VG Jr.. 2011. Transmission of MRSA between companion animals and infected human patients presenting to outpatient medical care facilities. PLoS One 6:e26978.. [DOI] [PMC free article] [PubMed] [Google Scholar]
- Flores AR, Galloway-Pena J, Sahasrabhojane P, Saldana M, Yao H, Su X, Ajami NJ, Holder ME, Petrosino JF, Thompson E, et al. 2015. Sequence type 1 group B Streptococcus, an emerging cause of invasive disease in adults, evolves by small genetic changes. Proc Natl Acad Sci U S A. 11220:6431–6436. [DOI] [PMC free article] [PubMed] [Google Scholar]
- Fluegge K, Wons J, Spellerberg B, Swoboda S, Siedler A, Hufnagel M, Berner R.. 2011. Genetic differences between invasive and noninvasive neonatal group B streptococcal isolates. Pediatr Infect Dis J. 30:1027–1031. [DOI] [PubMed] [Google Scholar]
- Gauthier DT. 2015. Bacterial zoonoses of fishes: a review and appraisal of evidence for linkages between fish and human infections. Vet J. 2031:27–35. [DOI] [PubMed] [Google Scholar]
- Glazko G, Gordon A, Mushegian A.. 2005. The choice of optimal distance measure in genome-wide datasets. Bioinformatics 21(Suppl 3):iii3–11. [DOI] [PubMed] [Google Scholar]
- Glazko GV, Mushegian AR.. 2004. Detection of evolutionarily stable fragments of cellular pathways by hierarchical clustering of phyletic patterns. Genome Biol. 55:R32.. [DOI] [PMC free article] [PubMed] [Google Scholar]
- Greig TW, Bemiss JA, Lyon BR, Bossart GD, Fair PA.. 2007. Prevalence and diversity of antibiotic resistant Escherichia coli in bottlenose dolphins (Tursiops truncatus) from the Indian River Lagoon, Florida, and Charleston Harbor Area, South Carolina. Aquat Mamm. 33:185–194. [Google Scholar]
- Guglielmini J, Quintais L, Garcillan-Barcia MP, de la Cruz F, Rocha EP.. 2011. The repertoire of ICE in prokaryotes underscores the unity, diversity, and ubiquity of conjugation. PLoS Genet. 78:e1002222.. [DOI] [PMC free article] [PubMed] [Google Scholar]
- Gupta SK, Padmanabhan BR, Diene SM, Lopez-Rojas R, Kempf M, Landraud L, Rolain JM.. 2014. ARG-ANNOT, a new bioinformatic tool to discover antibiotic resistance genes in bacterial genomes. Antimicrob Agents Chemother. 581:212–220. [DOI] [PMC free article] [PubMed] [Google Scholar]
- Heaps H. 1978. Information retrieval – computational and theoretical aspects. Orlando (FL: ): Academic Press. [Google Scholar]
- Holt KE, Wertheim H, Zadoks RN, Baker S, Whitehouse CA, Dance D, Jenney A, Connor TR, Hsu LY, Severin J, et al. 2015. Genomic analysis of diversity, population structure, virulence, and antimicrobial resistance in Klebsiella pneumoniae, an urgent threat to public health. Proc Natl Acad Sci U S A. 11227:E3574–3581. [DOI] [PMC free article] [PubMed] [Google Scholar]
- Imperi M, Pataracchia M, Alfarone G, Baldassarri L, Orefici G, Creti R.. 2010. A multiplex PCR assay for the direct identification of the capsular type (Ia to IX) of Streptococcus agalactiae. J Microbiol Methods. 802:212–214. [DOI] [PubMed] [Google Scholar]
- Inouye M, Dashnow H, Raven LA, Schultz MB, Pope BJ, Tomita T, Zobel J, Holt KE.. 2014. SRST2: rapid genomic surveillance for public health and hospital microbiology labs. Genome Med. 611:90.. [DOI] [PMC free article] [PubMed] [Google Scholar]
- Jafar QA, Sameer AZ, Salwa AM, Samee AA, Ahmed AM, Al-Sharifi F.. 2008. Molecular investigation of Streptococcus agalactiae isolates from environmental samples and fish specimens during a massive fish kill in Kuwait Bay. Pak J Biol Sci. 1121:2500–2504. [DOI] [PubMed] [Google Scholar]
- Jaskowiak PA, Campello RJ, Costa IG.. 2014. On the selection of appropriate distances for gene expression data clustering. BMC Bioinformatics 15(Suppl 2):S2.. [DOI] [PMC free article] [PubMed] [Google Scholar]
- Jeukens J, Freschi L, Vincent AT, Emond-Rheault JG, Kukavica-Ibrulj I, Charette SJ, Levesque RC.. 2017. A pan-genomic approach to understand the basis of host adaptation in Achromobacter. Genome Biol Evol. 9(4):1030–1046. [DOI] [PMC free article] [PubMed] [Google Scholar]
- Johri AK, Paoletti LC, Glaser P, Dua M, Sharma PK, Grandi G, Rappuoli R.. 2006. Group B Streptococcus: global incidence and vaccine development. Nat Rev Microbiol. 412:932–942. [DOI] [PMC free article] [PubMed] [Google Scholar]
- Jones N, Oliver KA, Barry J, Harding RM, Bisharat N, Spratt BG, Peto T, Crook DW.. 2006. Enhanced invasiveness of bovine-derived neonatal sequence type 17 group B Streptococcus is independent of capsular serotype. Clin Infect Dis. 427:915–924. [DOI] [PubMed] [Google Scholar]
- Jones P, Binns D, Chang HY, Fraser M, Li W, McAnulla C, McWilliam H, Maslen J, Mitchell A, Nuka G, et al. 2014. InterProScan 5: genome-scale protein function classification. Bioinformatics 309:1236–1240. [DOI] [PMC free article] [PubMed] [Google Scholar]
- Jorgensen HJ, Nordstoga AB, Sviland S, Zadoks RN, Solverod L, Kvitle B, Mork T.. 2016. Streptococcus agalactiae in the environment of bovine dairy herds–rewriting the textbooks? Vet Microbiol. 184:64–72. [DOI] [PubMed] [Google Scholar]
- Joubrel C, Tazi A, Six A, Dmytruk N, Touak G, Bidet P, Raymond J, Trieu Cuot P, Fouet A, Kerneis S, et al. 2015. Group B Streptococcus neonatal invasive infections, France 2007-2012. Clin Microbiol Infect Dis. 21:910–916. [DOI] [PubMed] [Google Scholar]
- Kalimuddin S, Chen SL, Lim CTK, Koh TH, Tan TY, Kam M, Wong CW, Mehershahi KS, Chau ML, Ng LC, et al. 2017. 2015 epidemic of severe Streptococcus agalactiae sequence type 283 infections in singapore associated with the consumption of raw freshwater fish: a detailed analysis of clinical, epidemiological, and bacterial sequencing data. Clin Infect Dis. 64(Suppl 2):S145–S152. [DOI] [PubMed] [Google Scholar]
- Kim T, Chen IR, Lin Y, Wang AY, Yang JYH, Yang P.. 2018. Impact of similarity metrics on single-cell RNA-seq data clustering. Brief Bioinform. doi.org/10.1093/bib/bby076. [DOI] [PubMed] [Google Scholar]
- Klopfenstein DV, Zhang L, Pedersen BS, Ramírez F, Warwick Vesztrocy A, Naldi A, Mungall CJ, Yunes JM, Botvinnik O, Weigel M, et al. 2018. GOATOOLS: A Python library for Gene Ontology analyses. Sci Rep 8:10872. [DOI] [PMC free article] [PubMed] [Google Scholar]
- Konig C, Meinel DM, Margos G, Konrad R, Sing A.. 2014. Multilocus sequence typing of Corynebacterium ulcerans provides evidence for zoonotic transmission and for increased prevalence of certain sequence types among toxigenic strains. J Clin Microbiol. 5212:4318–4324. [DOI] [PMC free article] [PubMed] [Google Scholar]
- Langdon WB. 2015. Performance of genetic programming optimised Bowtie2 on genome comparison and analytic testing (GCAT) benchmarks. BioData Min. 81:1.. [DOI] [PMC free article] [PubMed] [Google Scholar]
- Librado P, Rozas J.. 2009. DnaSP v5: a software for comprehensive analysis of DNA polymorphism data. Bioinformatics 2511:1451–1452. [DOI] [PubMed] [Google Scholar]
- Lin FP, Lan R, Sintchenko V, Gilbert GL, Kong F, Coiera E.. 2011. Computational bacterial genome-wide analysis of phylogenetic profiles reveals potential virulence genes of Streptococcus agalactiae. PLoS One 64:e17964.. [DOI] [PMC free article] [PubMed] [Google Scholar]
- Lindahl G, Stalhammar-Carlemalm M, Areschoug T.. 2005. Surface proteins of Streptococcus agalactiae and related proteins in other bacterial pathogens. Clin Microbiol Rev. 181:102–127. [DOI] [PMC free article] [PubMed] [Google Scholar]
- Liu B, Pop M.. 2009. ARDB–Antibiotic Resistance Genes Database. Nucleic Acids Res. 37(Database issue):D443–447. [DOI] [PMC free article] [PubMed] [Google Scholar]
- Liu G, Zhang W, Lu C.. 2013. Comparative genomics analysis of Streptococcus agalactiae reveals that isolates from cultured tilapia in China are closely related to the human strain A909. BMC Genomics 14:775.. [DOI] [PMC free article] [PubMed] [Google Scholar]
- Lopez-Sanchez MJ, Sauvage E, Da Cunha V, Clermont D, Ratsima Hariniaina E, Gonzalez-Zorn B, Poyart C, Rosinski-Chupin I, Glaser P.. 2012. The highly dynamic CRISPR1 system of Streptococcus agalactiae controls the diversity of its mobilome. Mol Microbiol. 856:1057–1071. [DOI] [PubMed] [Google Scholar]
- Loytynoja A. 2014. Phylogeny-aware alignment with PRANK. Methods Mol Biol. 1079:155–170. [DOI] [PubMed] [Google Scholar]
- Lyhs U, Kulkas L, Katholm J, Waller KP, Saha K, Tomusk RJ, Zadoks RN.. 2016. Streptococcus agalactiae serotype IV in humans and cattle, Northern Europe1. Emerg Infect Dis. 2212:2097–2103. [DOI] [PMC free article] [PubMed] [Google Scholar]
- Manning SD, Springman AC, Lehotzky E, Lewis MA, Whittam TS, Davies HD.. 2009. Multilocus sequence types associated with neonatal group B streptococcal sepsis and meningitis in Canada. J Clin Microbiol. 47:1143–1148. [DOI] [PMC free article] [PubMed] [Google Scholar]
- Manning SD, Springman AC, Million AD, Milton NR, McNamara SE, Somsel PA, Bartlett P, Davies HD.. 2010. Association of Group B Streptococcus colonization and bovine exposure: a prospective cross-sectional cohort study. PLoS One 51:e8795.. [DOI] [PMC free article] [PubMed] [Google Scholar]
- Martins ER, Melo-Cristino J, Ramirez M.. 2010. Evidence for rare capsular switching in Streptococcus agalactiae. J Bacteriol. 1925:1361–1369. [DOI] [PMC free article] [PubMed] [Google Scholar]
- Marttinen P, Hanage WP, Croucher NJ, Connor TR, Harris SR, Bentley SD, Corander J.. 2012. Detection of recombination events in bacterial genomes from large population samples. Nucleic Acids Res. 401:e6.. [DOI] [PMC free article] [PubMed] [Google Scholar]
- Mather AE, Reid SW, Maskell DJ, Parkhill J, Fookes MC, Harris SR, Brown DJ, Coia JE, Mulvey MR, Gilmour MW, et al. 2013. Distinguishable epidemics of multidrug-resistant Salmonella Typhimurium DT104 in different hosts. Science 3416153:1514–1517. [DOI] [PMC free article] [PubMed] [Google Scholar]
- McArthur AG, Waglechner N, Nizam F, Yan A, Azad MA, Baylay AJ, Bhullar K, Canova MJ, De Pascale G, Ejim L, et al. 2013. The comprehensive antibiotic resistance database. Antimicrob Agents Chemother. 57:3348–3357. [DOI] [PMC free article] [PubMed] [Google Scholar]
- Morse EV, Duncan MA, Estep DA, Riggs WA, Blackburn BO.. 1976. Canine salmonellosis: a review and report of dog to child transmission of Salmonella enteritidis. Am J Public Health. 661:82–84. [DOI] [PMC free article] [PubMed] [Google Scholar]
- Murrell B, Weaver S, Smith MD, Wertheim JO, Murrell S, Aylward A, Eren K, Pollner T, Martin DP, Smith DM, et al. 2015. Gene-wide identification of episodic selection. Mol Biol Evol. 325:1365–1371. [DOI] [PMC free article] [PubMed] [Google Scholar]
- Page AJ, Cummins CA, Hunt M, Wong VK, Reuter S, Holden MT, Fookes M, Falush D, Keane JA, Parkhill J.. 2015. Roary: rapid large-scale prokaryote pan genome analysis. Bioinformatics 3122:3691–3693. [DOI] [PMC free article] [PubMed] [Google Scholar]
- Pal C, Bengtsson-Palme J, Rensing C, Kristiansson E, Larsson DG.. 2014. BacMet: antibacterial biocide and metal resistance genes database. Nucleic Acids Res. 42(Database issue):D737–743. [DOI] [PMC free article] [PubMed] [Google Scholar]
- Pedersen K, Pedersen K, Jensen H, Finster K, Jensen VF, Heuer OE.. 2007. Occurrence of antimicrobial resistance in bacteria from diagnostic samples from dogs. J Antimicrob Chemother. 60:775–781. [DOI] [PubMed] [Google Scholar]
- Petrovska L, Tang Y, Jansen van Rensburg MJ, Cawthraw S, Nunez J, Sheppard SK, Ellis RJ, Whatmore AM, Crawshaw TR, Irvine RM.. 2017. Genome reduction for niche association in Campylobacter hepaticus, A cause of spotty liver disease in poultry. Front Cell Infect Microbiol. 7:354. [DOI] [PMC free article] [PubMed] [Google Scholar]
- Pond SLK, Frost SDW, Muse SV.. 2005. HyPhy: hypothesis testing using phylogenies. Bioinformatics 21:676–679. [DOI] [PubMed] [Google Scholar]
- Poyart C, Tazi A, Reglier-Poupet H, Billoet A, Tavares N, Raymond J, Trieu-Cuot P.. 2007. Multiplex PCR assay for rapid and accurate capsular typing of group B streptococci. J Clin Microbiol. 456:1985–1988. [DOI] [PMC free article] [PubMed] [Google Scholar]
- Price LB, Stegger M, Hasman H, Aziz M, Larsen J, Andersen PS, Pearson T, Waters AE, Foster JT, Schupp J, et al. 2012. Staphylococcus aureus CC398: host adaptation and emergence of methicillin resistance in livestock. MBio 3(1):e00305–11. [DOI] [PMC free article] [PubMed] [Google Scholar]
- Qin QL, Xie BB, Yu Y, Shu YL, Rong JC, Zhang YJ, Zhao DL, Chen XL, Zhang XY, Chen B, et al. 2014. Comparative genomics of the marine bacterial genus Glaciecola reveals the high degree of genomic diversity and genomic characteristic for cold adaptation. Environ Microbiol. 166:1642–1653. [DOI] [PubMed] [Google Scholar]
- Richards VP, Choi SC, Pavinski Bitar PD, Gurjar AA, Stanhope MJ.. 2013. Transcriptomic and genomic evidence for Streptococcus agalactiae adaptation to the bovine environment. BMC Genomics 14:920.. [DOI] [PMC free article] [PubMed] [Google Scholar]
- Richards VP, Lang P, Bitar PD, Lefebure T, Schukken YH, Zadoks RN, Stanhope MJ.. 2011. Comparative genomics and the role of lateral gene transfer in the evolution of bovine adapted Streptococcus agalactiae. Infect Genet Evol. 116:1263–1275. [DOI] [PMC free article] [PubMed] [Google Scholar]
- Richards VP, Palmer SR, Pavinski Bitar PD, Qin X, Weinstock GM, Highlander SK, Town CD, Burne RA, Stanhope MJ.. 2014. Phylogenomics and the dynamic genome evolution of the genus Streptococcus. Genome Biol Evol. 64:741–753. [DOI] [PMC free article] [PubMed] [Google Scholar]
- Rosinski-Chupin I, Sauvage E, Mairey B, Mangenot S, Ma L, Da Cunha V, Rusniok C, Bouchier C, Barbe V, Glaser P.. 2013. Reductive evolution in Streptococcus agalactiae and the emergence of a host adapted lineage. BMC Genomics 14:252.. [DOI] [PMC free article] [PubMed] [Google Scholar]
- Sahl JW, Caporaso JG, Rasko DA, Keim P.. 2014. The large-scale blast score ratio (LS-BSR) pipeline: a method to rapidly compare genetic content between bacterial genomes. PeerJ 2:e332.. [DOI] [PMC free article] [PubMed] [Google Scholar]
- Sahl JW, Gillece JD, Schupp JM, Waddell VG, Driebe EM, Engelthaler DM, Keim P.. 2013. Evolution of a pathogen: a comparative genomics analysis identifies a genetic pathway to pathogenesis in Acinetobacter. PLoS One 81:e54287.. [DOI] [PMC free article] [PubMed] [Google Scholar]
- Sahl JW, Sistrunk JR, Fraser CM, Hine E, Baby N, Begum Y, Luo Q, Sheikh A, Qadri F, Fleckenstein JM, et al. 2015. Examination of the Enterotoxigenic Escherichia coli Population Structure during Human Infection. MBio 63:e00501.. [DOI] [PMC free article] [PubMed] [Google Scholar]
- Scheffer R. 1991. Role of toxins in evolution and ecology of plant pathogenic fungi. Experientia 804–811. [Google Scholar]
- Schrieber L, Towers R, Muscatello G, Speare R.. 2014. Transmission of Streptococcus dysgalactiae subsp. equisimilis between child and dog in an Aboriginal Australian community. Zoonoses Public Health. 61:145–148. [DOI] [PubMed] [Google Scholar]
- Seemann T. 2014. Prokka: rapid prokaryotic genome annotation. Bioinformatics 3014:2068–2069.24642063 [Google Scholar]
- Shapiro K, Miller M, Mazet J.. 2012. Temporal association between land-based runoff events and California sea otter (Enhydra lutris nereis) protozoal mortalities. J Wildl Dis. 482:394–404. [DOI] [PubMed] [Google Scholar]
- Shepheard MA, Fleming VM, Connor TR, Corander J, Feil EJ, Fraser C, Hanage WP.. 2013. Historical zoonoses and other changes in host tropism of Staphylococcus aureus, identified by phylogenetic analysis of a population dataset. PLoS One 85:e62369.. [DOI] [PMC free article] [PubMed] [Google Scholar]
- Sheppard SK, Cheng L, Meric G, de Haan CP, Llarena AK, Marttinen P, Vidal A, Ridley A, Clifton-Hadley F, Connor TR, et al. 2014. Cryptic ecology among host generalist Campylobacter jejuni in domestic animals. Mol Ecol. 2310:2442–2451. [DOI] [PMC free article] [PubMed] [Google Scholar]
- Spoor LE, McAdam PR, Weinert LA, Rambaut A, Hasman H, Aarestrup FM, Kearns AM, Larsen AR, Skov RL, Fitzgerald JR.. 2013. Livestock origin for a human pandemic clone of community-associated methicillin-resistant Staphylococcus aureus. MBio 4(4):e00356–13. [DOI] [PMC free article] [PubMed] [Google Scholar]
- Springman AC, Lacher DW, Waymire EA, Wengert SL, Singh P, Zadoks RN, Davies HD, Manning SD.. 2014. Pilus distribution among lineages of group b Streptococcus: an evolutionary and clinical perspective. BMC Microbiol. 14:159.. [DOI] [PMC free article] [PubMed] [Google Scholar]
- Srivastava A, Singhal N, Goel M, Virdi JS, Kumar M.. 2014. CBMAR: a comprehensive beta-lactamase molecular annotation resource. Database 2014:bau111.. [DOI] [PMC free article] [PubMed] [Google Scholar]
- Stamatakis A. 2014. RAxML version 8: a tool for phylogenetic analysis and post-analysis of large phylogenies. Bioinformatics 309:1312–1313. [DOI] [PMC free article] [PubMed] [Google Scholar]
- Stoddard RA, Gulland FMD, Atwill ER, Lawrence J, Jang S, Conrad PA.. 2005. Salmonella and Campylobacter spp. in northern elephant seals. Emerg Infect Dis. 1112:1967–1969. [DOI] [PMC free article] [PubMed] [Google Scholar]
- Sukhnanand S, Dogan B, Ayodele MO, Zadoks RN, Craver MP, Dumas NB, Schukken YH, Boor KJ, Wiedmann M.. 2005. Molecular subtyping and characterization of bovine and human Streptococcus agalactiae isolates. J Clin Microbiol. 433:1177–1186. [DOI] [PMC free article] [PubMed] [Google Scholar]
- Supek F, Bosnjak M, Skunca N, Smuc T.. 2011. REVIGO summarizes and visualizes long lists of gene ontology terms. PLoS One 67:e21800.. [DOI] [PMC free article] [PubMed] [Google Scholar]
- Tettelin H, Masignani V, Cieslewicz MJ, Donati C, Medini D, Ward NL, Angiuoli SV, Crabtree J, Jones AL, Durkin AS, et al. 2005. Genome analysis of multiple pathogenic isolates of Streptococcus agalactiae: implications for the microbial “pan-genome”. Proc Natl Acad Sci U S A. 10239:13950–13955. [DOI] [PMC free article] [PubMed] [Google Scholar]
- Tettelin H, Riley D, Cattuto C, Medini D.. 2008. Comparative genomics: the bacterial pan-genome. Curr Opin Microbiol. 115:472–477. [DOI] [PubMed] [Google Scholar]
- Tian CF, Zhou YJ, Zhang YM, Li QQ, Zhang YZ, Li DF, Wang S, Wang J, Gilbert LB, Li YR, et al. 2012. Comparative genomics of rhizobia nodulating soybean suggests extensive recruitment of lineage-specific genes in adaptations. Proc Natl Acad Sci U S A. 10922:8629–8634. [DOI] [PMC free article] [PubMed] [Google Scholar]
- van der Mee-Marquet N, Domelier AS, Salloum M, Violette J, Arnault L, Gaillard N, Bind JL, Lartigue MF, Quentin R; Bloodstream Infection Study Group of the Reseau des Hygienistes de la Region Centre. 2009. Molecular characterization of temporally and geographically matched Streptococcus agalactiae strains isolated from food products and bloodstream infections. Foodborne Pathog Dis. 6:1177–1183. [DOI] [PubMed] [Google Scholar]
- Verani JR, McGee L, Schrag SJ, Division of Bacterial Diseases NCfI, Respiratory Diseases CfDC, Prevention. 2010. Prevention of perinatal group B streptococcal disease – revised guidelines from CDC, 2010. MMWR 59:1–36. [PubMed] [Google Scholar]
- Viana D, Comos M, McAdam PR, Ward MJ, Selva L, Guinane CM, Gonzalez-Munoz BM, Tristan A, Foster SJ, Fitzgerald JR, et al. 2015. A single natural nucleotide mutation alters bacterial pathogen host tropism. Nat Genet. 474:361–366. [DOI] [PMC free article] [PubMed] [Google Scholar]
- Yu G, Smith D, Zhu H, Guan Y, Lam T.. 2017. ggtree: an R package for visualization and annotation of phylogenetic trees with their covariates and other associated data. Methods Ecol Evol. 8:28–36. [Google Scholar]
- Zadoks RN, Middleton JR, McDougall S, Katholm J, Schukken YH.. 2011. Molecular epidemiology of mastitis pathogens of dairy cattle and comparative relevance to humans. J Mamm Gland Biol Neoplasia. 164:357–372. [DOI] [PMC free article] [PubMed] [Google Scholar]
- Zankari E. 2014. Comparison of the web tools ARG-ANNOT and ResFinder for detection of resistance genes in bacteria. Antimicrob Agents Chemother. 588:4986.. [DOI] [PMC free article] [PubMed] [Google Scholar]
- Zerbino DR, Birney E.. 2008. Velvet: algorithms for de novo short read assembly using de Bruijn graphs. Genome Res. 185:821–829. [DOI] [PMC free article] [PubMed] [Google Scholar]
- Zhang Y, Sievert SM.. 2014. Pan-genome analyses identify lineage- and niche-specific markers of evolution and adaptation in Epsilonproteobacteria. Front Microbiol. 5:110.. [DOI] [PMC free article] [PubMed] [Google Scholar]
- Zhu Q, Kosoy M, Dittmar K.. 2014. HGTector: an automated method facilitating genome-wide discovery of putative horizontal gene transfers. BMC Genomics 15:717.. [DOI] [PMC free article] [PubMed] [Google Scholar]
Associated Data
This section collects any data citations, data availability statements, or supplementary materials included in this article.