Abstract
A highly porous architecture of graphitic carbon nitride g-C3N4/Cu2O nanocomposite in the form of cubes with a side length of ≈ 1 μm, large pores of 1.5 nm, and a high surface area of 9.12 m2/g was realized by an optimized in situ synthesis protocol. The synthesis protocol involves dispersing a suitable “Cu” precursor into a highly exfoliated g-C3N4 suspension and initiating the reaction for the formation of Cu2O. Systematic optimization of the conditions and compositions resulted in a highly crystalline g-C3N4/Cu2O composite. In the absence of g-C3N4, the Cu2O particles assemble into cubes with a size of around 300 nm and are devoid of pores. Detailed structural and morphological evaluations by powder X-ray diffraction and field emission scanning electron microscopy revealed the presence of highly exfoliated g-C3N4, which is responsible for the formation of the porous architecture in the cube like assembly of the composite. The micrographs clearly reveal the porous structure of the composite that retains the cubic shape of Cu2O, and the energy-dispersive spectroscopy supports the presence of g-C3N4 within the cubic morphology. Among the different g-C3N4/Cu2O compositions, CN/Cu-5 with 10% of g-C3N4, which is also the optimum composition resulting in a porous cubic morphology, shows the best visible light photocatalytic performance. This has been supported by the ultraviolet diffuse reflectance spectroscopy (UV-DRS) studies of the composite which shows a band gap of around 2.05 eV. The improved photocatalytic performance of the composite could be attributed to the highly porous morphology along with the suitable optical band gap in the visible region of the solar spectrum. The optimized composite, CN/Cu-5, demonstrates a visible light degradation of 81% for Methylene Blue (MB) and 85.3% for Rhodamine-B (RhB) in 120 min. The decrease in the catalyst performance even after three repeated cycles is less than 5% for both MB and RhB dyes. The rate constant for MB and RhB degradation is six and eight times higher with CN/Cu-5 when compared with the pure Cu2O catalyst. To validate our claim that the dye degradation is not merely decolorization, liquid chromatography–mass spectroscopy studies were carried out, and the end products of the degraded dyes were identified.
1. Introduction
Access to the essential necessities of life, such as clean air, safe and potable water, and so forth, have become a challenge, owing primarily to our lifestyle, industrial development, ever-increasing demands, and unsustainable growth. The challenge of acute shortage of clean drinking water is compounded with the dwindling water bodies and the pollution of the existing ones primarily by human activities that include callous dumping of effluents from industries. To address the issue of water pollution, several measures are concurrently being adopted both at the governmental policy making and at the grass root level but still not enough to solve the problem in its entirety, which is getting more severe. Dyes, an important class of synthetic organic compounds commonly used in many industries, especially textiles, are becoming universal environmental pollutants during their synthesis, fiber dyeing, and later when they are released into the water bodies. From the materials science perspective, global efforts are underway to develop suitable materials that could convert these effluents into benign end products by eco-friendly and safe methodologies. In this context, the first and simplest technique that comes to mind is photocatalysis, where the pollutant in the presence of the photocatalyst under solar irradiation gets degraded and is converted into benign end products. Semiconducting oxides such as TiO2 and ZnO have been extensively studied for their applications in photocatalysis, primarily because of their inherent features such as nontoxicity, stability, insolubility in water, high reactivity, and favorable photochemical properties.1−4 One of the major drawbacks of these materials is their optical band gap in the UV region, limiting their widespread applicability. To some extent, this limitation has been surmounted by combining these oxides with noble metals to extend the absorption into the visible region by the plasmonic effect, thereby improving their performance.5−8 Alternatively, these materials have been combined with low band gap materials such as Cu2O,9,10 WO3,,11,12 In2O3,13,14 CdS,15 and so forth, rendering them favorable for the photocatalytic applications.
Our earlier work on manipulating the electronic properties of TiO2 for photocatalytic applications includes a simple method to obtain high-surface area TiO2 nanoparticles with a tunable brookite/rutile and brookite/anatase phase ratio that demonstrated enhanced visible light photoactivity for RhB degradation.16 In another study, ZnO structures with tunable exposed polar facets synthesized by a hydrothermal route in an aqueous base environment for enhanced visible light photocatalytic activity were reported.17 The versatility of hierarchical CuO/ZnO interleaved heterostructures by impregnation displayed multifunctionality as a CO2 gas sensor and a visible light catalyst for MB degradation.18
Another line of research using C-based materials such as carbon nanotubes or graphene composites led to the development of photocatalytic materials that exhibit properties such as better conductivity, lower charge recombination properties, and suitable band gap, facilitating broader absorption profile.19−23 The most interesting research material in the present scenario is graphitic carbon nitride (g-C3N4) that is similar to graphene and is endowed with exceptional thermal and chemical stability, which is available abundantly, inexpensive, facile to produce24 and possesses hetero atoms, an added advantage over graphene, facilitating greater flexibility in tailoring the properties suitably, to further improve its performance.25−27 Peng et al. reported the synthesis of the g-C3N4/Cu2O composite catalyst by an alcohol-aqueous-based chemical precipitation method where g-C3N4 was loaded onto the surface of Cu2O spheres.28 In an alternative procedure reported by Zuo et al., the synthesis of the acid-treated g-C3N4/Cu2O composite catalyst by the hydrothermal reduction followed by high-temperature calcination and acid exfoliation resulted in flakes of scattered g-C3N4 particles deposited on the surface of Cu2O.29 To improve the conductivity, Yan et al. introduced reduced graphene oxide (RGO) and reported the synthesis of the Cu2O/g-C3N4/RGO composite 3D aerogel photocatalyst, fabricated by the self-assembly method and obtained g-C3N4 in the form of thin sheets with Cu2O in spherical morphology.30 In another report, Liang et al. reported the synthesis of porous g-C3N4/Ag/Cu2O by chemical adsorption of Ag-doped cubic Cu2O onto porous small flat sheets of g-C3N4, leading to enhanced photocatalytic performance.31 In another report, a small amount of 1–5 mol % of Cu(II) salt was incorporated into presynthesized g-C3N4, and the role of Cu concentration on its oxidation state, particle size, and the optical properties of the nanocomposites for their suitability in chemical catalysis was studied.32
In our earlier work, we had optimized a protocol to obtain Cu2O with a cubic and octahedral morphology and further to use the octahedral morphology with TiO2 to synthesize a highly efficient visible light Cu2O@TiO2 photocatalyst for RhB degradation.33 In the present work, we have adopted the protocol of the cubic morphology of Cu2O with g-C3N4 to realize the Cu2O/g-C3N4 composite by an in situ low-temperature sol–gel technique. Further, by systematically increasing the g-C3N4 content, a highly porous morphology was obtained, which could be anticipated to exhibit excellent photocatalytic performance because of the synergy of convenient band gap of Cu2O and the conductivity of g-C3N4 that would help in the separation of the charge carriers and the mesoporous nature of the material, resulting in a high surface area that would greatly enhance the catalytic activity.
The present work details an in situ procedure using a simple sol–gel synthesis technique to obtain mesoporous Cu2O and a detailed study, as will be described in the following section on how g-C3N4 influences the structure, morphology, and the electronic properties of the composite, while retaining the cubical shape of Cu2O making it suitable as an excellent visible light photocatalyst, exhibiting improved performance over the earlier reports.
2. Material Characterization
The first confirmation of the composition of the as-synthesized material was obtained from powder X-ray diffraction (XRD) studies obtained on a PANalytical (Empyrean) X-ray diffractometer. The instrument is equipped with a Cu Kα source operated at 40 kV, 30 mA, and the diffraction data are recorded in the 2θ range of 10°–80° with a standard monochromator provided with a Ni filter to avoid Cu Kβ interference. The morphology of the material was studied by field emission scanning electron microscopy (FESEM) on a JEOL JSM-7610F equipped with an Oxford Instruments energy-dispersive spectroscopy (EDS) analyzer for the elemental analysis. For the FESEM analysis, the sample was spread thinly on a carbon tape fixed on a brass stub. Detailed high-resolution transmission electron microscopy (HRTEM) studies were performed on a Talos 200X high-resolution transmission electron microscope, the selected area electron diffraction (SAED) patterns showed the crystallinity of the nanoparticles, and the elemental composition of the material was analyzed by high-angle annular dark field (HAADF). The samples for the HRTEM analysis were prepared by dispersing the material in water by ultrasonication and drop-drying onto a carbon-coated grid. For the information on binding energies of the elements in the composites, X-ray photoelectron spectroscopy (XPS) analysis was carried out on a KRATOS AXIS SUPRA using an Al Kα anode (hν = 1486.6 eV) to know the chemical state of the different elements in the material from the binding energy values of the photoelectrons emitted from these materials. The photoelectrons emitted were analyzed by a hemispherical analyzer. This study would also shed light on the change in the oxidation states of the individual oxides, if any, when the composites are formed, in order to understand and support the photocatalytic performance. UV–visible spectra of solid samples were recorded using the UV-DRS accessory, and the absorbance was plotted using a Kubelka–Munk function. Brunauer–Emmett–Teller (BET) surface area and pore size analysis of the samples were measured by nitrogen adsorption–desorption isotherm measurements on a Quantachrome NOVA 4000e equipment. Emission spectra of samples were obtained from photoluminescence (PL) studies on a Fluorolog-3 spectrofluorometer (Spex model, Jobin Yvon) with an excitation wavelength of 460 nm. Time-resolved fluorescence spectra of samples were recorded on a picosecond time-correlated single-photon counting setup (Fluorolog 3-Triple Illuminator, IBH HORIBA Jobin Yvon) employing a light-emitting diode laser (NanoLED) under 460 nm laser excitation at room temperature. Finally, the photocatalytic performance of the composites was evaluated by monitoring the characteristic UV–visible absorbance maxima of the dye in water at different time intervals on a Varian Cary 5000 UV–vis spectrophotometer. Liquid chromatography–mass spectroscopy (LC–MS) experiments were performed on a Waters Xevo G2-XS QTof instrument equipped with an electron multiplier ion trap detector using an ESI source, operated under negative mode to estimate the extent of degradation and identify the intermediate and end products. LC–MS separation was achieved on a BEH-C18 column, 100 mmL × 2.1 mm i.d × 1.7 μm d.p. Gradient elution was applied to the mobile phase consisting of a mixture of aqueous 0.1% (v/v) formic acid/H2O (solvent A) and 0.1 (v/v) acetonitrile/formic acid (solvent B). The flow rate was set as 0.2 mL/min. The injected volume was 5 μL.
2.1. Photocatalytic Studies
For the photocatalytic reactions, the dye solutions were initially prepared by dissolving calculated amounts of the dye in deionized water (ρ = 18.2 MΩ). All the photocatalytic dye degradation studies were performed using a 400 W sodium vapor lamp as a visible light source. The photoreactor used in these studies consist of a double jacketed cylindrical tube (length ≈ 28 cm, inner diameter ≈ 5 cm, outer diameter ≈ 7 cm). In a typical photocatalytic study, an aqueous suspension was prepared by taking 0.5 mg/mL of the catalyst and 50 mL of 1 × 10⁻⁵ M dye solution. The mixture was sonicated for 15 min, followed by 1 h continuous stirring in the dark in order to attain adsorption–desorption equilibrium of the dye on the catalyst. Subsequently, the reaction mixture was placed in the photoreactor and irradiated by visible light for different time durations. The reaction progress was monitored by drawing aliquots of the dye solution at regular intervals. The solution was centrifuged to separate out the catalyst, and the UV–visible absorbance of the supernatant solution was recorded. The intensity of the absorbance maximum of the dye is a measure of residual dye in the reaction mixture based on which the extent of the degradation of the dye can be estimated.
3. Results and Discussion
The synthesized materials were characterized in detail to reveal their structure, morphology, and optical properties, and then their photocatalytic performance was evaluated. Thereafter, detailed HRTEM and XPS were carried out on the best-performing catalyst. The photocatalytic activity was then correlated with the structure and electronic properties to understand their behavior, and from the conclusions drawn, a probable reaction mechanism has been put forth.
3.1. Structural and Morphological Characterization
Figure 1 shows the XRD traces of the synthesized materials identified from the characteristic X-ray diffractograms. Figure 1a corresponds to the XRD trace for the synthesized g-C3N4 and Figure 1b for the synthesized Cu2O. Figure 1c presents the XRD patterns for the various compositions of g-C3N4/Cu2O composites with the increasing g-C3N4 content. Figure 1a shows the characteristic peaks at 13.09° (d = 6.754 Å) and 27.48° (d = 3.242 Å) attributed to the (100) and (002) lattice planes of g-C3N4.34 The low-intensity peak of (100) corresponds to the in-plane repeated tri-s-triazine units and the high-intensity peak of (002) corresponds to the interlayer stacking reflection in perfect agreement with reported data.35 The sharp and strong diffraction peaks in Figure 1b observed at 2θ values of 29.55° (d = 3.019 Å), 36.6° (d = 2.452 Å), 42.59° (d = 2.121 Å), 61.31° (d = 1.525 Å), 73.52° (d = 1.286 Å), 77.75° (d = 1.227 Å), the values in parenthesis are the corresponding “d ” values, and can be indexed to the (110), (111), (200), (220), (311), and (222) lattice planes of Cu2O respectively.36 Apart from these indexed peaks corresponding to Cu2O with a face-centered cubic (FCC) structure, no other peaks of Cu or CuO were observed, confirming the phase purity of the synthesized material. For the FCC system, the lattice constant “a ” was calculated to be approximately 4.25 Å, which is in good agreement with the reported value of 4.27 Å.37Figure 1c(i–vi) shows the XRD traces in increasing order of the content of g-C3N4 from 2 to 12 wt %. Figure 1c(i,ii) clearly shows the peaks indexed to Cu2O only because of the low content of g-C3N4 (2 and 4%). With increasing wt % of g-C3N4 to 6 and 8% ((iii) and (iv)), the corresponding g-C3N4 peaks around 14.24° and 27.04° can be identified as small peaks. Interestingly, in the XRD trace (v) corresponding to the CN/Cu-5 composite with 10 wt % of g-C3N4, the interlayer stacking reflection of g-C3N4 can be deciphered only as a small hump at 27.03° shifted from its designated position of 27.48°, and the major peak of Cu2O also shows a slight shift. These two observations have been emphasized by the enlarged views of the XRD traces in Figure 1d,e. Figure 1d shows the shift in the g-C3N4 peak at 28° for g-C3N4 and CN/Cu-5 corresponding to an increase in the interplanar distance from 3.24 to 3.29 Å. Figure 1e shows the peak shift in the Cu2O peak around 36.5° corresponding to an increase in the d-spacing from 2.452 to 2.46 Å. These two observations are suggestive of an interpenetration of the lattices during the composite formation. With further increase in the g-C3N4 content (12 wt %) for the composite, the two peaks of g-C3N4 reappear as independent sharp peaks. This is the first observation that in the CN/Cu-5 composition, g-C3N4 is getting completely assimilated into Cu2O to form the nanocomposite. Further studies would shed more light on the structural, optical, and electrical properties and bonding between the constituent species in the composite.
Figure 1.
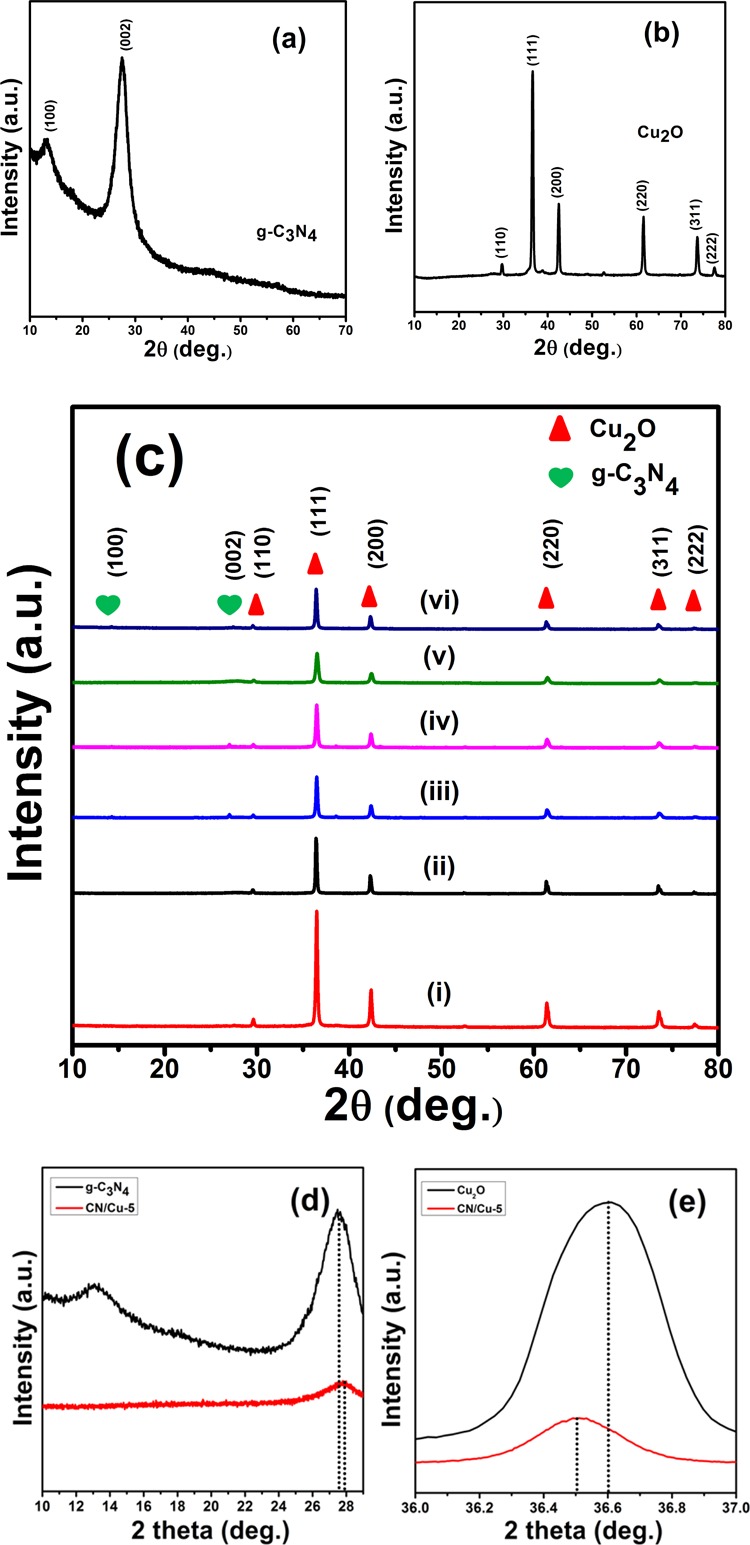
XRD traces of the (a) g-C3N4, (b) Cu2O, and (c) g-C3N4/Cu2O composites. (d) Enlarged trace of the 2θ region around 28° in g-C3N4 and CN/Cu-5 and (e) enlarged trace of the 2θ region around 35.6° in Cu2O and CN/Cu-5.
Figure 2 shows the FESEM micrographs showing the surface morphologies of the as-synthesized g-C3N4, Cu2O, and g-C3N4/Cu2O composite materials. The FESEM micrograph of the pristine g-C3N4 (Figure 2a) can be described as a fluffy sheetlike morphology. Figure 2b shows the micrograph of the as-synthesized Cu2O showing uniform sized cubes with an edge length of around 300 nm. It is seen that with the increasing content of g-C3N4, there is gradual loss of surface smoothness of the Cu2O cubes (Supporting Information, Figure S2a–f). Initially, the surface becomes increasingly rough, and small pores begin to appear. In addition, the FESEM micrographs also show the presence of g-C3N4 flakes around the Cu2O cubes. Figure 2c shows the FESEM micrograph of the CN/Cu-5 composite with 10 wt % of g-C3N4 that shows well-formed highly porous cubes. One important observation is the increase in the size of cubes to about 1 μm compared to the 300 nm-sized pristine Cu2O cubes. The high-magnification micrograph in Figure 2d reveals the highly porous morphology of the CN/Cu-5 composite, and it gives an impression that the in situ synthesis process leads to internalization of g-C3N4 into the Cu2O cubes, resulting in the porous morphology and an increase in the size of the cubes. Interestingly, with further increase in the Cu2O content, the cubical morphology is distorted (Supporting Information, Figure S2). Figure 2e,f shows the EDS data recorded on the surface of Cu2O cubes and on the composite (CN/Cu-5) cubes. The image shows the location, and the corresponding spectra confirm the presence of g-C3N4 in the Cu2O cubes supporting our hypothesis that the synthesis procedure successfully incorporates the flaked g-C3N4 into the Cu2O cubes imparting them the porosity as observed. The EDS data for the remaining compositions have been presented in Figure S3. Further support to this observation was obtained by point EDS analysis that was carried out at different locations on the composite shown in Figure S4, and the corresponding weight percentages of Cu, O, N, and C are presented in Table 1.
Figure 2.
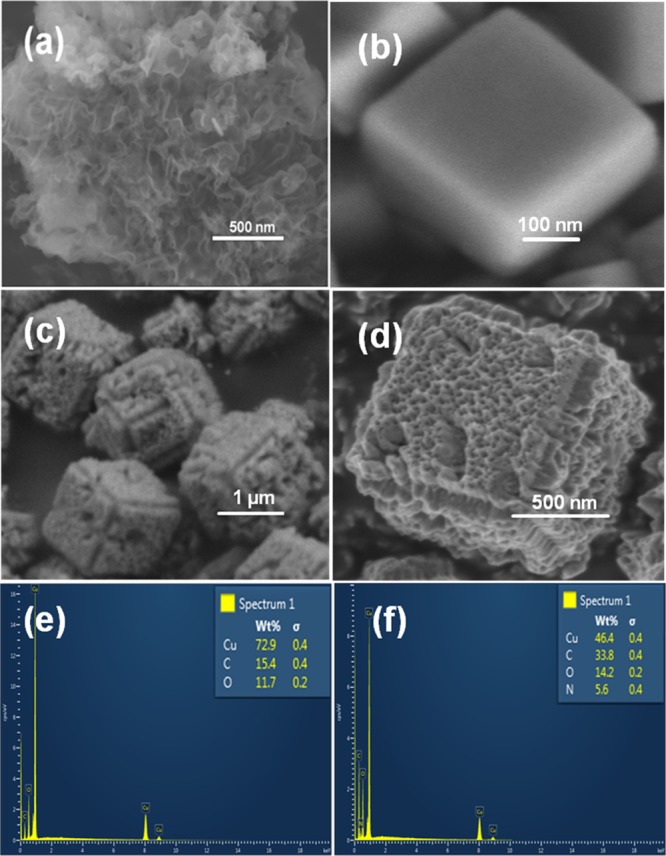
FESEM micrographs of (a) g-C3N4 and (b) Cu2O. (c,d) Low and high magnification images of the CN/Cu-5 composite. (e) EDS spectra of Cu2O and (f) EDS spectra of the CN/Cu-5 composite.
Table 1. Cu, C, N, and O Contents Estimated from the FESEM–EDS Data for the Different g-C3N4/Cu2O Composites.
| S. No. | Sample code | Cu (wt %) | C (wt %) | O (wt %) | N (wt %) |
|---|---|---|---|---|---|
| 1 | CN/Cu-1 | 68.2 | 16.5 | 10.7 | 4.6 |
| 2 | CN/Cu-2 | 63.0 | 24.8 | 11.8 | 0.4 |
| 3 | CN/Cu-3 | 56.8 | 25.7 | 13.5 | 4.0 |
| 4 | CN/Cu-4 | 49.5 | 24.3 | 8.1 | 18.1 |
| 5 | CN/Cu-5 | 46.4 | 33.8 | 14.2 | 5.6 |
| 6 | CN/Cu-6 | 41.0 | 43.0 | 9.3 | 6.7 |
3.1.1. Effect of Ultrasonication on the Morphology of the Composite
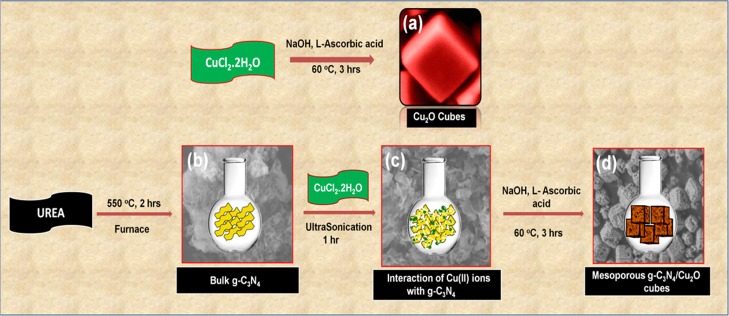
To appreciate the impact of ultrasonication on the morphology of g-C3N4, g-C3N4 was subjected to prolonged ultrasonication in water. This ultrasonication resulted in exfoliation and breakdown of the sheet morphology into smaller-sized petals, which can be seen in the FESEM micrograph (Figure S5). It can be hypothesized that during the composite synthesis, which also involves this ultrasonication step, g-C3N4 undergoes similar morphological change, which manifests itself in the final product that is highly porous. The highly dispersed g-C3N4 and Cu precursors are in intimate contact, and as the Cu salt progressively crystallizes into Cu2O following the steps as described in Scheme 2, the cubic morphology of Cu2O is retained and the presence of highly exfoliated g-C3N4 leads to a porous composite material. It is believed that the internalization of g-C3N4 into the Cu2O cubes leads to the expansion of cubes with high porosity.
Scheme 2. Schematic Representation of As-Synthesized (a) Cu2O Cubes and (b) Bulk g-C3N4 and (c) Interaction of Cu(II) Ions with the g-C3N4 and (d) g-C3N4/Cu2O Composites (the Backgrounds in (b–d) Are the Corresponding FESEM Images).
3.1.2. Effect of Temperature on the Morphology of the Composite
To understand the role of temperature in obtaining the above morphology, the reaction temperature was varied between 60 and 90 °C, and the results are presented in Figure S6. This study reveals that with increasing temperature from 60 to 90 °C, the size of the composite gradually decreases from 1 μm to 500 nm. Similarly, a concomitant clear decrease in the porosity is also observed. These two observations suggest that the higher temperatures lead to more compact structures. Our studies demonstrate that the optimum temperature for the formation of the best porous architecture is 60 °C.
3.1.3. Mechanism of Formation of the Porous g-C3N4/Cu2O Nanocomposite Morphology
On the basis of the findings from the above studies, a probable mechanism to explain the porous cubic morphology of the optimized composition can be put forth. First, our idea was to design a suitable photocatalyst based on Cu2O, a low band gap oxide which shows visible light activity.38 The idea was to make a composite with another material that would impart some sort of conductivity in the photocatalytic mechanism to transport the photogenerated electron–hole pairs to the site where the photodegradation reaction would take place. First, the g-C3N4 ultrasonication step facilitated the delamination and exfoliation of the g-C3N4 sheets in the medium. At this point, the introduction of the precursor salt of Cu, viz., CuCl2·2H2O, into the medium results in the intimate contact between the exfoliated g-C3N4 and Cu salt. Interestingly, during the synthesis of the composite with varying compositions, we observed an evolution in the morphology. In particular, for the CN/Cu-5 composition, we observed cubes of size 1 μm, which on careful inspection revealed a porous structure. The cubes resembled the Cu2O cubes albeit with increased size. This prompted us to speculate that g-C3N4 is responsible for the porous morphology while maintaining the cube structure of Cu2O. The self-polycondensation of Cu2O particles to form a cubelike morphology in the presence of well-dispersed sheetlike g-C3N4 resulted in the porous cubelike g-C3N4/Cu2O composite. Similar formation mechanism is responsible for the formation of a 3D framework as reported for the bioinspired synthesis of 3D porous g-C3N4@carbon microflowers,39 and further, it could be hypothesized that the π-stacking interactions and the hydrogen-bonding interactions favor the formation of such 3D structures similar to those in isosystems of g-C3N440 and coassembly of g-C3N4/GO hybrid nanosheets.41
3.2. Fourier Transform Infrared Spectroscopic Studies
Fourier transform infrared spectroscopy (FT-IR) spectra were recorded for pure Cu2O, g-C3N4, and g-C3N4/Cu2O composite and presented in the Supporting Information (Figure S7). A sharp peak at 630 cm–1 corresponding to the vibrational mode of Cu–O in the Cu2O phase is identified42 along with features at 1624.74 and 3445.37 cm–1 that could be assigned to the −OH bending and stretching vibrational modes from the adsorbed water.43 A small peak at 2922.81 cm–1 is attributed to the vibrational mode of alkane of the L-ascorbic acid that was used during the synthesis (Supporting Information, Figure S7a). Pure g-C3N4 displays a sharp feature around 800 cm–1 attributed to the breathing modes of the s-triazine ring modes.44 The characteristic bands observed in the region from 1240 to 1635 cm–1 can be ascribed to the stretching frequencies of heptazine derivative repeating units of g-C3N4.45 The broad band at 3192.28 cm–1 can be attributed to the terminal −NH2 or −NH groups45 (Supporting Information, Figure S7b). The features observed in Cu2O and g-C3N4 were also observed in the FT-IR data of the composite material, that is, CN/Cu-5, with slight shifts in the peak positions. This observation is in line with our XRD and FESEM data, suggesting that the interaction between Cu2O and g-C3N4 could be the reason for the observed shifts in the FT-IR data (Supporting Information, Figure S7c).
3.3. Surface Area and Pore Size Estimation
The EM images reveal the porous morphology of the composite, but the surface area and pore size distribution are two essential parameters that need to be evaluated in order to ascertain its suitability as a good catalytic material. The BET method was used to estimate the surface area of the as-prepared Cu2O and CN/Cu-5 nanocomposite, and it was carried out by N2 adsorption–desorption experiments.
Nitrogen sorption measurements and pore size distribution curves recorded at 77 K were used to estimate the surface area and porosity of the synthesized catalysts. Figure 3 represents nitrogen adsorption and desorption isotherms of Cu2O and CN/Cu-5, and the corresponding BET surface areas for the Cu2O and CN/Cu-5 composites were estimated to be 7.73 and 9.13 m2/g, respectively. The inset of Figure 3 shows the pore size distribution (BJH) curves of Cu2O and CN/Cu-5 samples that give the mean pore sizes of 1.78 and 1.52 nm, respectively. On addition of g-C3N4 to Cu2O, there is an increase in surface area, but the pore size is seen to decrease. This could be an outcome of the formation of the composite. It could also be anticipated that the incorporation of g-C3N4 into Cu2O resulted in the reduction of the effective pore size.
Figure 3.
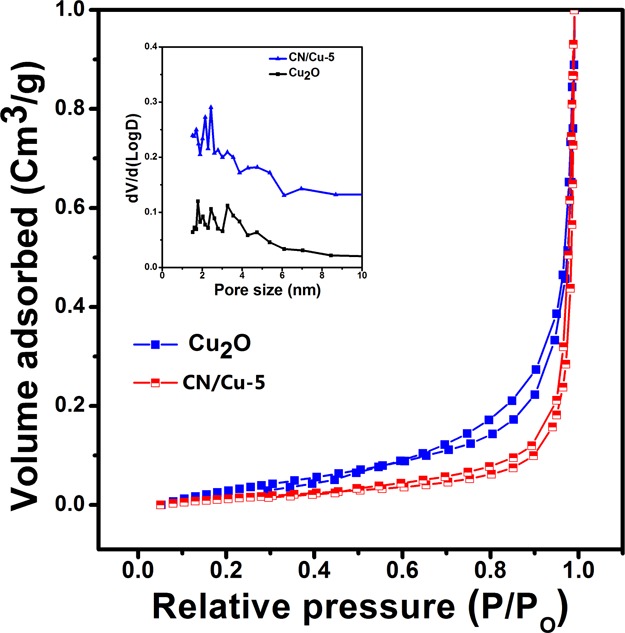
Nitrogen adsorption–desorption isotherm and (inset) the corresponding Barrett–Joyner–Halenda (BJH) pore size distribution curve of Cu2O and CN/Cu-5, respectively.
3.4. Optical Properties
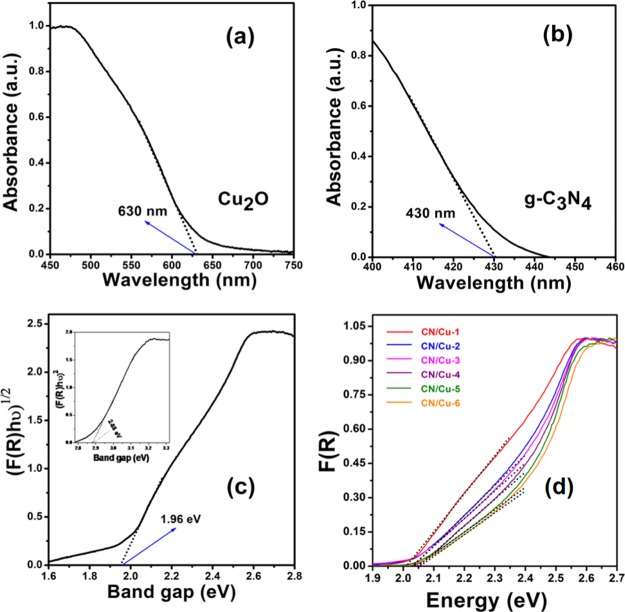
Having confirmed the structure, composition, and morphology of the composites, an understanding of how the composite formation would influence the optical properties is elucidated by the UV-DRS studies. The UV-DRS studies would also shed light on the electronic transitions and photocatalytic performance of composites. The UV-DRS data for pure Cu2O and the pristine g-C3N4 material are shown in Figure 4a,b. The absorbance plot as a function of the wavelength for g-C3N4, which is known to be an indirect band gap material,46 and Cu2O, a direct band gap material,47 shows an absorption edge at around 430 and 630 nm corresponding to the band gap values of about 2.88 and 1.96 eV, respectively, as shown in Figure 4c. This was followed by the UV-DRS studies on the various composites. The absorbance was used to calculate the Kubelka–Munk function F(R).48Figure 4d shows the plots of F(R) versus energy from which the corresponding band gap values were calculated. The F(R) plots for the composites show two distinctly linear regions corresponding to Cu2O and g-C3N4 as expected. We focus on the Cu2O region because it is involved in the visible light activity. It can be clearly seen that with an increase in the g-C3N4 content in the composites, the variation in the band edge shifts minimally from 2.01 to 2.06 eV for the CN/Cu-1 to CN/Cu-6 composite. The composites were attempted with a premise that the capability of the low band gap Cu2O would be augmented by the presence of highly conducting g-C3N4 that would lead to a significant improvement in the photocatalytic response. From Figure 4d, we can see that the UV-DRS plots for the composites show two distinct regions corresponding to each of the components. The intercept corresponding to Cu2O is considered because it is the major part component participating in the photoabsorption process. The observation is that with an increase in the wt % of g-C3N4, the intercept shows a small shift in the absorption edge ∼0.05 eV, suggesting that the composite still maintains the absorption in the visible region and could be a good visible light photocatalyst. Another factor that is also of prime concern is the recombination of the photogenerated electron–hole pairs, which is also a major contributing factor in the photocatalytic performance. To have an idea of the charge carrier recombination of photoexcited species and efficiency of charge carrier trapping, transfer, and migration, PL spectra of the synthesized materials were recorded.
Figure 4.
(a,b) UV–visible absorbance of Cu2O and g-C3N4 as a function of wavelength. (c) Tauc plots showing the direct band gap of Cu2O with an inset showing the indirect band gap of g-C3N4 and (d) Kubelka–Munk function (F(R)) of as-synthesized different wt % of g-C3N4 on the Cu2O (CN/Cu-1 to CN/Cu-6) catalyst showing band gap measurements.
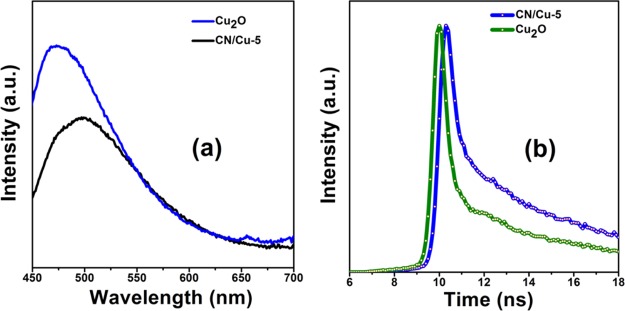
Figure 5a shows the PL emission spectra of the synthesized Cu2O and CN/Cu-5 composites where the samples were excited by the light of 460 nm wavelength. In the PL emission spectrum, Cu2O shows very high PL intensity, which is suggestive of fast recombination of the photogenerated charge carriers. Finally, a look at the PL spectra corresponding to the composite reveals the apparent decrease in the PL intensity of the CN/Cu-5 composite, suggesting that the charge carriers are efficiently separated, inhibiting the recombination of the photogenerated electron–hole pairs. The ease of generating the electron–hole pair coupled with high conductivity of g-C3N4 is anticipated to lead to improved efficiency of the photocatalytic reaction. Further, the interfacial combination between Cu2O and g-C3N4 in CN/Cu-5 creating suitable heterojunctions was also beneficial for the charge separation, thereby improving the photocatalytic performance.
Figure 5.
(a) PL spectra of the as-synthesized Cu2O and CN/Cu-5 composites as a function of wavelength. (b) Time-resolved spectra of the as-synthesized Cu2O and CN/Cu-5 composites as a function of time in nanoseconds.
Improved electron-transfer behavior of the as-synthesized samples was further confirmed by time-resolved PL decays. The calculated lifetime values are presented in Figure 5b. We can clearly see that the CN/Cu-5 composite exhibited a longer average lifetime of about 0.41 ns than the pure Cu2O (0.26 ns), indicating that the recombination of photoexcited species is inhibited in the composite. Finally, the CN/Cu-5 composite shows a lower PL intensity but a greater average lifetime.29 This could be attributed to the heterojunction formation, which inhibits electron–hole recombination, thus increasing the lifetime of the species and decreasing the PL intensity.
3.5. Photocatalytic Activity Studies
The UV-DRS studies of the composite materials showed the absorption edge in the visible region of the solar spectrum, suggesting that the materials show visible light activity and the PL and lifetime measurements showed characteristics that would favor the photocatalytic activity. With this background, we investigated the photocatalytic dye degradation activity of the synthesized samples using visible light radiation. The photocatalytic activities of the as-synthesized catalyst were evaluated by the degradation of two model organic dyes MB and RhB under visible light irradiation.
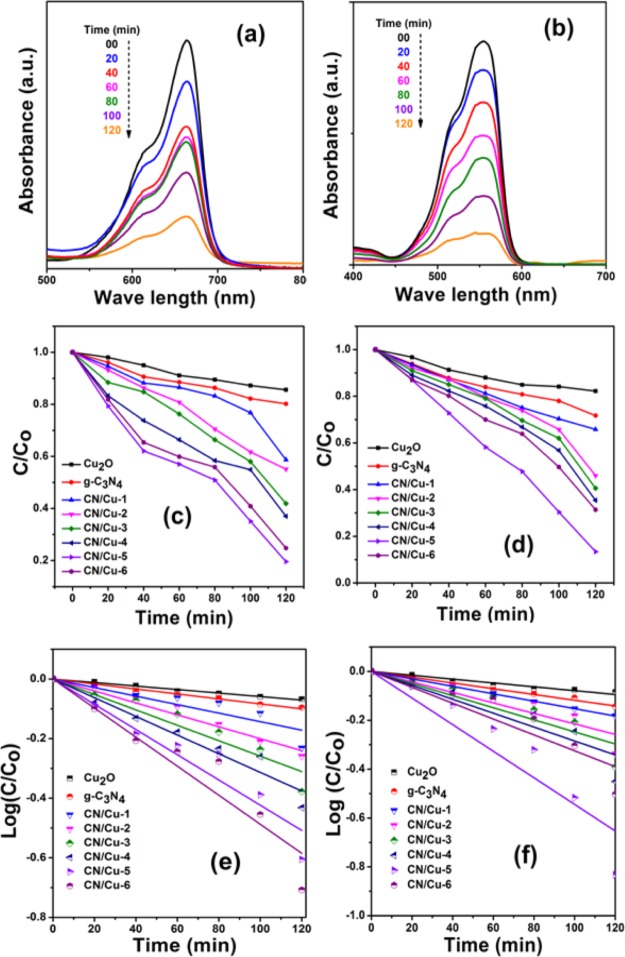
As a reference, a blank reaction was first carried out where MB and RhB photodegradation without the catalyst was exposed to light, and the results showed that the degradation for MB and RhB was negligible even after 120 min under visible light irradiation. Before the illumination with visible light, in order to attain the adsorption–desorption equilibrium of the dye on the catalyst, the dye solution along with the catalyst was kept in dark with continuous stirring for 1 h. The photoactivity of all the synthesized Cu2O, g-C3N4, and g-C3N4/Cu2O catalysts was studied from the degradation kinetics of MB and RhB under visible light irradiation, and data are summarized in Figure 6.
Figure 6.
(a,b) UV–visible absorbance of MB and RhB dyes with the CN/Cu-5 catalyst. (c,d) Corresponding change in the concentration of MB and RhB as a function of time and (e,f) Linear fitting curves of log(C/Co) vs time “t ” for MB and RhB dyes for Cu2O, g-C3N4, CN/Cu-1, CN/Cu-2, CN/Cu-3, CN/Cu-4, CN/Cu-5 and CN/Cu-6 catalysts, respectively.
To have our own benchmark, the photocatalytic degradation studies were carried out using the synthesized Cu2O cubes on MB dye solution in the presence of visible light irradiation. The absorbance maximum for MB at 663 nm and RhB at 553 nm was used for the dye degradation studies. It is seen that with Cu2O, about 15% of degradation in the MB intensity was observed in 120 min. The experiments on MB were then carried out using pure Cu2O, g-C3N4, and the various composite catalysts, viz., CN/Cu-1, CN/Cu-2, CN/Cu-3, CN/Cu-4, CN/Cu-5, and CN/Cu-6, which showed a degradation of 15, 26, 41.4, 48, 62, 75, 81, and 60%, respectively, in 120 min, suggesting CN/Cu-5 as the best composite (Supporting Information, Figure S8). To establish if it is the unique morphology of the composite catalyst that is responsible for the improved photocatalytic performance, the above studies were performed on the RhB dye, a model organic azo group dye with the absorption maxima at 553 nm and the above experiments were repeated under visible light irradiation. Interestingly, even for RhB, the same composite CN/Cu-5 showed the best performance of 85.3% in 120 min with other composition catalysts (Cu2O, g-C3N4, CN/Cu-1, CN/Cu-2, CN/Cu-3, CN/Cu-4, CN/Cu-6) as 16, 29, 36, 54, 61, 68, and 65%, respectively (Supporting Information, Figure S9).
Figure 6a,b shows the UV–visible absorbance data for MB and RhB dyes with the CN/Cu-5 catalyst, which is the optimum composition that showed the best performance of 81 and 85.3% degradation after 120 min. Figure 6c,d shows the C/Co of MB and RhB as a function of time for all synthesized catalysts, where “Co” is the initial concentration of the dye solution and “C ” is the concentration of the dye solution at time “t ”. This result implies that the g-C3N4 content is a crucial factor for improving the photocatalytic activity of g-C3N4/Cu2O heterojunctions and that an optimized ratio of the component is needed to form an efficient heterojunction interface between the two components, which forms a potential barrier, thereby limiting the recombination of photogenerated charges.49 The probable reason for the decrease in performance beyond an optimum composition could be that the excess g-C3N4 which is also observed to alter the cubic morphology as seen from the FESEM images (Figure S2e,f) could also be blocking the active sites on the Cu2O surface, hindering the photocatalytic activity which is a well-known phenomenon.44Figure 6e,f shows the linear correlation between log(C/Co) and time (t) for MB and RhB, which suggests that the photodegradation reaction follows pseudo-first-order kinetics. The pseudo-first-order model gives the information about the degradation rate kinetics of Cu2O, g-C3N4, and all g-C3N4/Cu2O composites for both MB and RhB photocatalytic reactions that can be expressed as follows50
where K = pseudo-first-order rate constant, t = reaction interval time, Co= initial concentration of the dye solution, and C = concentration of the dye solution at time “t ”.
The estimated values of rate constants for all the synthesized catalysts for MB and RhB degradation are presented in Table 2. The photocatalytic activity of the CN/Cu-5 sample for MB degradation is found to be about eight times higher and that for RhB is found to be about six times higher when compared to the activity of pure Cu2O.
Table 2. Pseudo-First-Order Rate Constant Values of g-C3N4/Cu2O with Different Amounts of g-C3N4 for the Degradation of MB and RhB under Visible Light Irradiation.
| S. No | Catalyst | Rate constants (1 × 10⁻³) for MB | Rate constants (1 × 10⁻³) for RhB |
|---|---|---|---|
| 1 | Cu2O | 1.33 | 1.81 |
| 2 | g-C3N4 | 1.91 | 2.71 |
| 3 | CN/Cu-1 | 3.29 | 3.50 |
| 4 | CN/Cu-2 | 4.60 | 4.95 |
| 5 | CN/Cu-3 | 5.96 | 5.68 |
| 6 | CN/Cu-4 | 7.20 | 6.56 |
| 7 | CN/Cu-5 | 11.2 | 12.5 |
| 8 | CN/Cu-6 | 9.76 | 7.48 |
3.5.1. Identification of the Active Species by Scavengers
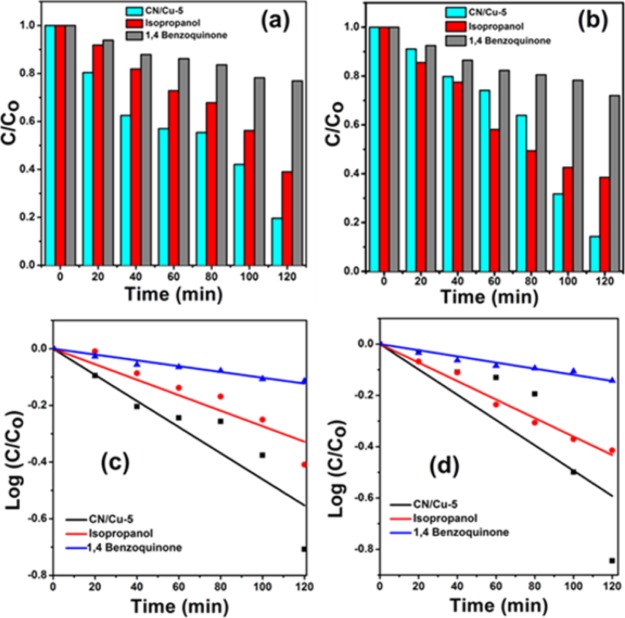
To investigate the active species involved in the photodegradation of the composite, quenching experiments were performed by considering iso propyl alcohol (IPA) as the hydroxy radical scavenger (•OH) and para-benzoquinone (p-BQ) as the superoxide anion radical scavenger (O2•–). The experimental procedure remains the same as that described in the previous section, except that here along with the catalyst and dye to be degraded, scavengers were also added simultaneously to reach the adsorption–desorption equilibrium, and after that in the presence of light, at various intervals the supernatant was collected and rate constants were determined using UV–visible studies. Figure 7a,b shows the corresponding values of change in MB and RhB concentrations in the presence of CN/Cu-5 and CN/Cu-5 with IPA and p-BQ, respectively. Figure 7c,d shows the pseudo-rate constant values of CN/Cu-5 and CN/Cu-5 with IPA and p-BQ under visible light irradiation. The rate constant values for the MB degradation by p-BQ are 4.5 times that of the CN/Cu-5 catalyst and those by IPA are about 1.5 times that of the CN/Cu-5 catalyst. Similarly, the rate constant values for RhB degradation in the presence of p-BQ are 4.1 times higher and that by IPA is 3 times higher than the composite. The rate constant values of MB and RhB are presented in Table 3. The decrease in the rate constant values for p-BQ suggests that superoxide radicals (O2•–) are the major active species responsible for the degradation of both MB and RhB dyes.
Figure 7.
(a,b) Corresponding values of change in MB and RhB concentration in the presence of the CN/Cu-5 catalyst, CN/Cu-5 with IPA, and CN/Cu-5 with p-BQ. (c,d) Pseudo-rate constant values of the CN/Cu-5 catalyst, CN/Cu-5 with IPA, and CN/Cu-5 with p-BQ under visible light irradiation.
Table 3. Pseudo-First-Order Rate Constant Values of the CN/Cu-5 Catalyst, CN/Cu-5 with IPA, and CN/Cu-5 with p-BQ for the Degradation of MB and RhB under Visible Light Irradiation.
| S. No. | Catalyst | Rate constant (1 × 10⁻³) for MB | Rate constant (1 × 10⁻³) for RhB |
|---|---|---|---|
| 1 | CN/Cu-5 | 10.6 | 11.3 |
| 2 | CN/Cu-5 (isopropanol) | 6.28 | 8.31 |
| 3 | CN/Cu-5 (p-BQ) | 2.34 | 2.76 |
3.5.2. LC–MS Studies To Analyze the Degradation of Dyes
To understand the progress of the reaction and identify the intermediate species formed during the degradation process, we have performed LC–MS analysis for both the dyes, that is, MB and RhB. LC–MS is recorded for the samples degraded at time intervals 0, 40, 80, and 120 min. The analysis procedure adopted for each of the dyes can be described as follows:
3.5.2.1. Methylene Blue
MB has an absorption band of 663 nm in the visible region. The peak assigned at m/z 284 is the molecular ion peak of MB. The retention time (tR) of this peak is 3.93 min. For the better understanding of how the degradation is taking place, we have performed further analysis of degradation at around the same tR.
The peak area that is initially very intense gradually decreases from 40 to 60, and finally, at 120 min, it reaches minimum as shown in Figure S10. The percentage of degradation is 66.6%. This confirms that the pollutant dye is getting degraded as a function of time. The intermediates of the dye are recorded by the mass spectra at different positions. The obtained peaks in Figure S10 correspond to the MB-degraded products, which further decompose into ultimate fragments such as CO2 and water as presented in Table S1.51
3.5.2.2. Rhodamine B
RhB has an absorption band of 553 nm in the visible region. The molecular ion peak at 443 could be assigned to RhB with the tR of 4.79 min. As observed in Figure S11, the peak area gradually decreases with increase in time interval, suggesting the degradation of the dye molecule. The percentage degradation was found to be 75.3% at the end of 120 min. Mass spectra of the sample shown in Figure S11 result in smaller fragments, which corresponds to N-deethylated intermediates and 2-hydroxy propanoic acid.52 The corresponding molecular weights of the intermediates are tabulated in Table S2.
3.5.3. Catalyst Reusability Studies
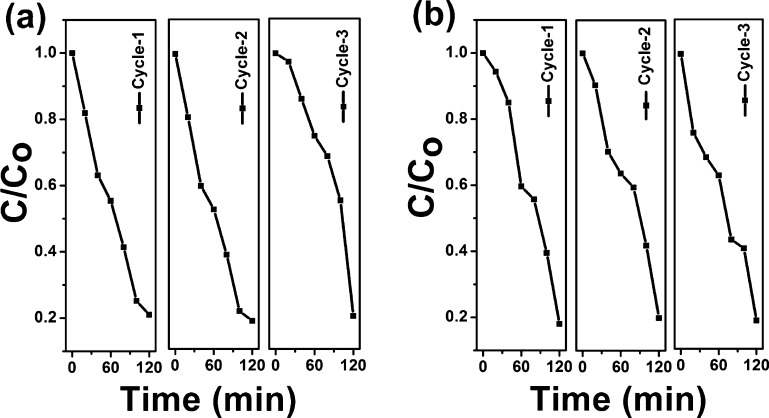
To have an idea of the catalyst stability, reusability studies were carried out. The catalyst was used for three repeated cycles. After each cycle, the catalyst was washed and dried, and the experiment was repeated. Figure 8a,b shows the findings from the recycle studies of the CN/Cu-5 catalyst using MB and RhB under visible light irradiation. As indicated by our results, CN/Cu-5 exhibits the best photocatalytic performance under visible light. It can be seen that even after three repeated cycles, there was < 5% reduction in activity under visible light irradiation, indicating that the CN/Cu-5 catalyst is reasonably stable under the reaction conditions.
Figure 8.
(a,b) Recyclable experiments of the CN/Cu-5 catalyst for the degradation of MB and RhB, respectively, under visible light irradiation for three repeated cycles.
3.6. XPS Studies
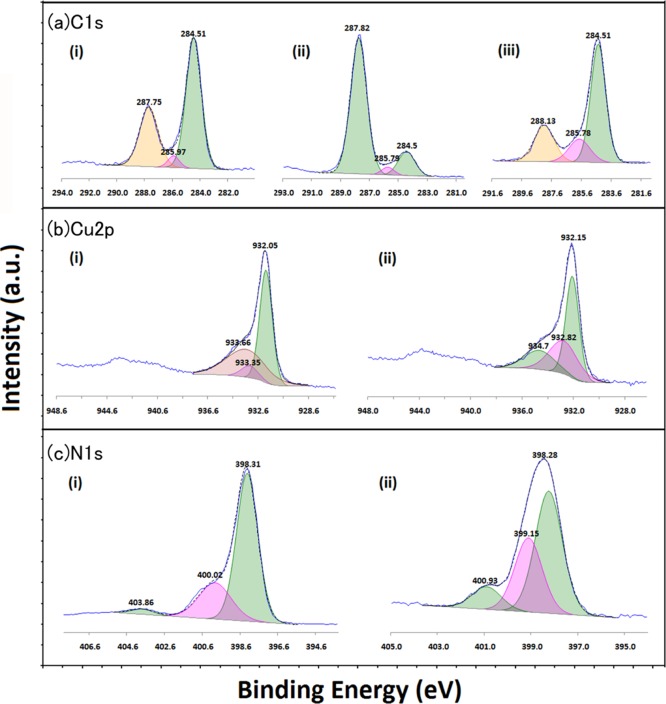
Having confirmed the structure and morphology of the composite, the photocatalytic studies showed that the CN/Cu-5 composite exhibits good catalytic activity under visible light irradiation. XPS studies were carried out to shed light on the chemical composition on the catalyst surfaces, the oxidation states, and any possible interaction that could influence the photocatalytic performance. XPS studies were carried out on Cu2O, g-C3N4, and CN/Cu-5 by first recording the survey scans and the high-resolution core-level spectra of each of the constituent elements. Figure 9 shows the survey scans for the three samples (Cu2O, g-C3N4, and CN/Cu-5 composites), showing the presence of Cu, N, O, and C consistent with our findings from FESEM–EDS analysis. This was followed by the high-resolution XPS study of the individual core level. All spectra were calibrated to adventitious carbon at the binding energy of 284.5 eV.53Figure 10a shows the C 1s spectra in the three samples. Figure 10a(i) shows the C 1s core-level spectra recorded on the Cu2O surface that could be deconvoluted and fitted to three peaks. Apart from the adventitious alkyl-type (C–C, C–H) sp3 carbon, two peaks at higher binding energy, centered around 286 and 287.7 eV, are observed. The former could be attributed to the presence of alcohol (C–OH) and/or ester (C–O–C) functionality and the latter to the C–O functionality. The presence of these species on the surface could be anticipated because of the synthesis protocol involving ascorbic acid.54 The C 1s core-level spectra in g-C3N4 presented as Figure 10a(ii) show two peaks centered around 285.8 and 287.8 eV apart from the 284.5 eV, adventitious carbon peak. The peak at 285.8 due to C–NH and that at 287.8 eV due to C=N binding of the [(N−)2C(=N)] group are in perfect agreement with earlier reports representing the major carbon species in g-C3N4.29 The C 1s peak in the CN/Cu-5 composite in Figure 10a(iii) also shows the presence of the three peaks as in g-C3N4, except that the peak corresponding to the C=N peak at 287.8 eV is reduced in intensity compared to sp2-bonded C at 284.5 eV. This reduced C=N peak is proportional to the g-C3N4 content in the composite, which is in line with the findings of FESEM–EDS analysis.
Figure 9.
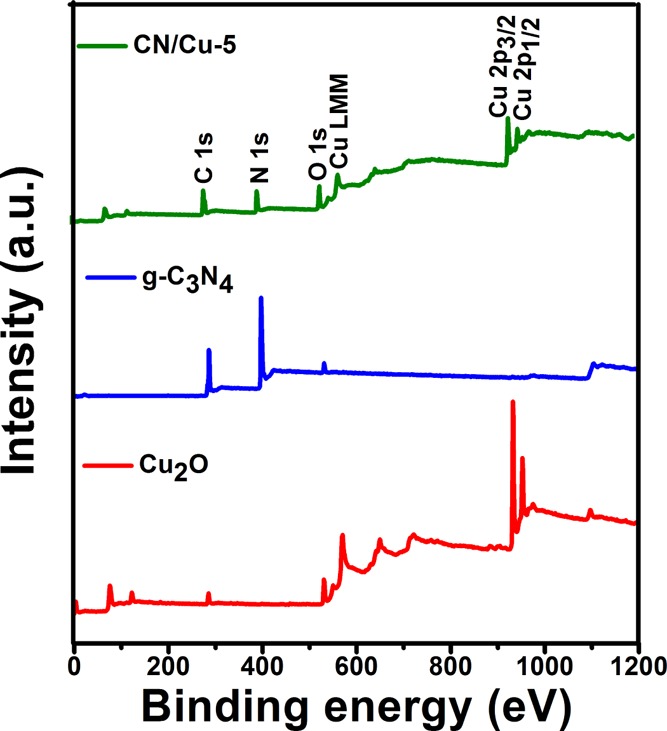
XPS wide-scan spectra of the synthesized Cu2O, g-C3N4, and CN/Cu-5 composites.
Figure 10.
(a) C 1s fitted spectra of (i) Cu2O, (ii) g-C3N4, and (iii) CN/Cu-5 composites. (b) Cu 2p fitted spectra of (i) Cu2O and (ii) CN/Cu-5 composites. (c) N 1s fitted spectra of (i) g-C3N4 and (ii) CN/Cu-5 composites.
Figure 10b shows the core-level spectra of Cu 2p in the Cu2O sample showing the characteristic 2p1/2 and 2p3/2 spin–orbit splitting. The key observation is the broad satellite peak on the higher binding energy side of the Cu 2p3/2 spectra, which hints at the presence of CuO, suggesting the presence of the Cu2+ component in the Cu 2p spectrum. Accordingly, the deconvolution of 2p3/2 revealed the presence of multiple peaks centered around 932.05, 933.35, and 933.66 eV as shown in Figure 10b(i) that can be correlated to the presence of Cu2O (major component) and small amount of CuO taking a clue from the satellite peak and a miniscule amount of Cu(OH)2.55 The latter two components are not totally unexpected considering the possibility of the surface interaction with the atmospheric oxygen and water vapor, leading to the oxidation of Cu2O to CuO and the formation of hydroxide though in disagreement from our XRD studies, which shows the presence of only Cu2O. This disparity could be due to the difference in the sensitivities to surface and bulk of the two techniques. Similarly, the Cu 2p3/2 spectrum in the case of the composite shown in Figure 10b(ii) on deconvolution also shows three peaks at 932, 933.4, and 934.6 eV. The last two peaks are similar to those observed in Cu2O as described in the earlier section. The first one at 932 eV could be attributed to Cu–N in agreement with earlier reports.56 The small peak at 933.4 eV could be assigned to the binding energy position of Cu in CuO, indicating its presence even in the composite, and interestingly, the intensity is higher than that of the Cu2O peak (934.6 eV), suggesting an increased oxidation of Cu2O to CuO on the surface during the formation of the composite. Supporting the presence of this, CuO can be observed strongly in the satellite peak at around 945 eV. Figure 10c(i) represents the deconvoluted N 1s XPS spectrum in which g-C3N4 shows the three peaks, a major one at 398.31 eV assigned to N involved in the triazine ring of g-C3N4, the second one at 400.01 eV due to the tertiary nitrogen groups, and the third one at still higher binding energy at about 403.86 eV, which could be due to the amino groups on the surface.29Figure 10c(ii) shows the N 1s core-level spectrum in the CN/Cu-5 composite, which shows a broad peak centered around 398.2 eV with a full width at half-maximum of nearly 2 eV, which suggests the presence of more than one peak. Deconvolution resulted in two peaks at 398.5 and 399.2 eV corresponding to N in g-C3N4, and the peak at 399.2 eV indicates the presence of Cu–N species in the composite in perfect agreement with earlier reports.57 Further, the peak at about 401.0 eV could be due to the remaining amino groups present on the surface of the composite.
The unambiguous assignment of the peaks both in the core-level N 1s spectra and the corresponding peak in the Cu 2p core-level spectra to the Cu–N binding confirms the formation of some species with Cu–N bonding in the CN/Cu-5 composite. The following section details the HRTEM analysis that could identify the exact species on the composite surface and interface.
3.7. High-Resolution Transmission Electron Microscopy
The final confirmation of the composition on the surface in the CN/Cu-5 composite could be identified from HRTEM studies. Figure 11a shows the HRTEM images of the CN/Cu-5 composite, which shows cubes with rough surface and the contrast clearly identifies two distinct species, the Cu2O cube and g-C3N4. Figure 11b shows the lattice fringes of the g-C3N4, Cu2O, and Cu–N planes recorded at the selected area at the interface of the CN/Cu-5 composite at three different locations. For a better accuracy, sets of three equal thickness fringes were chosen, and the average d-spacing was calculated. The first two sets give a d value of 245.3 pm corresponding to the (111) peak of Cu2O58 and 330 pm to the (002) peak of g-C3N4,59 confirming the presence of Cu2O and g-C3N4, respectively. The third set of lattice fringes with a d-spacing of about 370–380 pm could not be assigned to any of the known d-spacing of Cu2O or g-C3N4. On the basis of the XPS results as described in the earlier section identifying the presence of Cu–N species, the 370–380 pm d-spacing could be assigned to the (100) plane of the Cu3N phase.60Figure 11c shows the SAED pattern of the Cu2O, g-C3N4, and Cu–N major planes, which are taken at the interface of the CN/Cu-5 composite. The spots which are marked with yellow lines correspond to the (220), (200), (311), and (111) planes of Cu2O with the fcc structure. The spots which are marked with green and red colors correspond to the (002) plane of g-C3N4 and the (100) plane of Cu3N. Figure 11d shows a HAADF micrograph of a selected area of the CN/Cu-5 composite. From the elemental analysis, we conclude that Cu, C, and N are present and distributed in the composite.
Figure 11.
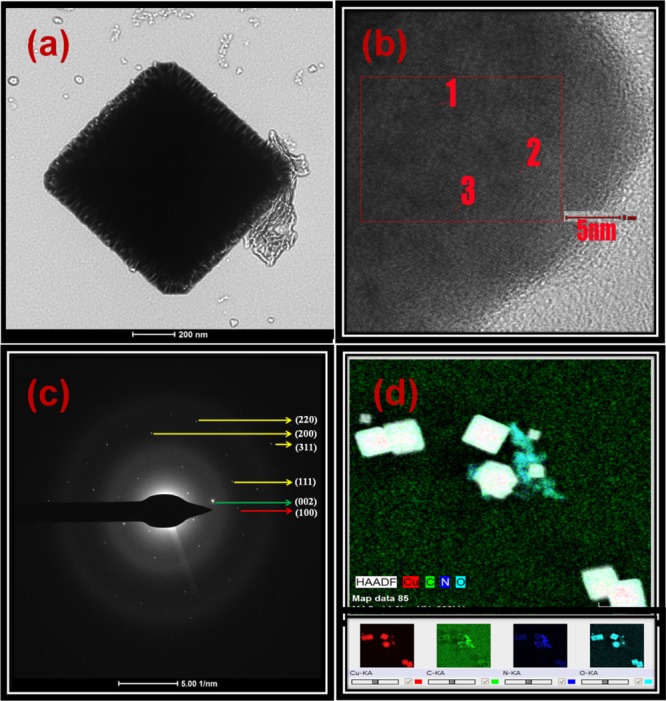
(a) HRTEM images of the as-synthesized CN/Cu-5 composite catalyst. (b) Lattice fringes of Cu2O (1), g-C3N4(2), and Cu–N(3) in the CN/Cu-5 composite and d-spacing for Cu2O, g-C3N4, and Cu–N are 245.3, 330, and 370–380 pm, respectively (value averaged by selecting three fringes). (c) SAED pattern at the CN/Cu-5 interface. (d) HAADF image of the CN/Cu-5 catalyst and corresponding elemental mapping images of Cu, C, N, and O.
Corroborating this finding from the HRTEM studies with the conclusions drawn from the core-level spectra of XPS, the distinct peak of Cu–N in the Cu 2p and N 1s species could be unambiguously attributed to the presence of Cu3N at the interface of the g-C3N4/Cu2O composite. Earlier studies had only shown the presence of the Cu and N61 species, but our studies confirmed a bonding between the Cu and N species, and finally, the SAED pattern confirms the formation of Cu3N. The formation of the Cu–N phase could have been facilitated by interaction of the lone pair of electrons of the N atom of g-C3N4 with the copper(II) ion, and a probable mechanism for its formation could be hypothesized as described in the following section.
3.8. Justification for the Formation of Cu3N
The detailed spectroscopic and microscopic analysis while confirming the structure, morphology, and the electronic properties of the composite also indicates the presence of Cu3N at the interface of Cu2O and g-C3N4. This observation though not totally unexpected is difficult to comprehend in the present synthesis strategy which is a low-temperature process. Cu3N, a metastable semiconducting material with excellent dielectric properties, is conventionally synthesized by radio frequency sputtering, reactive pulsed laser deposition, sputtering, etc.62−65 Some recent reports involve the use of a single source precursor with a 3:1 stoichiometric ratio of Cu/N, resulting in the reasonably low-temperature decomposition to obtain Cu3N.66−68 Synthesis of nitrides and oxynitrides by the nitridation of oxides is also a reported process. The Cu3N observed by the protocol reported falls in this category. Our in situ synthesis could also have been facilitated by the presence of the amine functionality in g-C3N4 in contact with the Cu2O surface, resulting in the localized formation of Cu3N.
3.9. Photocatalytic Mechanism
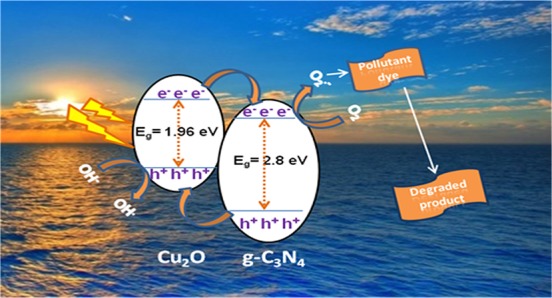
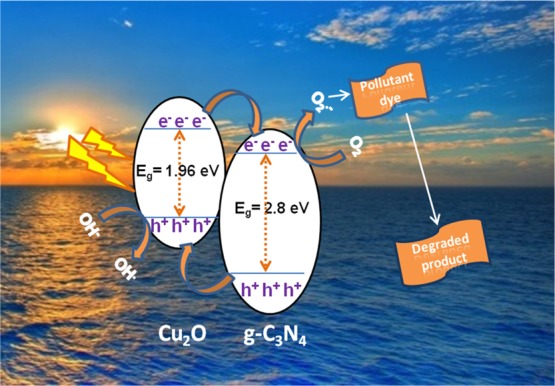
On the basis of the photocatalytic degradation experiments and the characterizations at different stages of our study, the proposed mechanism of photocatalytic degradation of MB and RhB dyes over the CN/Cu-5 catalyst under visible light irradiation is presented in Scheme 1. There are two main reasons for high photocatalytic activity in the CN/Cu-5 heterojunction. The first one is the broad-band width of photoabsorption, leading to an increase in photogenerated electron–hole pairs, and the second one is the catalyst morphology and electronic structure, leading to the buildup of charge at the heterojunction formed at the interface of CN/Cu-5, which is the effective pathway for separation of the photogenerated charge carriers and efficient utilization of the charge carriers in the oxidation/reduction reactions of the dye degradation process. When p-type Cu2O and n-type g-C3N4 are in contact with each other, the Fermi level of p-type and n-type attains equilibrium with the band bending seen as a potential barrier. Under the influence of the internal electric field, the photogenerated electrons are drifted to the positive field (n-g-C3N4) and holes are drifted toward the negative field (p-Cu2O).59 Once light is irradiated at the heterojunctions of the CN/Cu-5 composite, the band bending facilitates movement of electrons from the conduction band (CB) level of Cu2O toward the CB of g-C3N4 and the generated holes move simultaneously from the valence band (VB) level of g-C3N4 to VB of Cu2O. The photogenerated electrons at the CB of g-C3N4 react with O2 present in the system to produce superoxide radical anion O2•–. At the same time, oxidation reaction occurs at the VB of Cu2O to produce OH• radical species. The photogenerated active species OH• and O2•– participate in the degradation process of the pollutant dye. Though both the species are responsible for the dye degradation, controlled experiments in the presence of appropriate scavengers showed that photogenerated electrons play a crucial role in the degradation pathway of the two pollutant dyes MB and RhB.
Scheme 1. Proposed Degradation Mechanism of Dyes MB and RhB over the g-C3N4/Cu2O Composite Catalyst under Visible Light Irradiation.
4. Conclusions
In summary, we have presented a simple method to realize an optimized g-C3N4/Cu2O composite credited with a highly porous morphology, favorable electronic properties such as band gap and PL, facilitating a better adsorption of the dye, and visible light photoactivity with appreciable improvement in the performance. Our studies reveal that the CN/Cu-5 composite with a 10 wt % of g-C3N4 in Cu2O under controlled synthesis conditions resulted in a highly porous architecture while retaining the cubical morphology of Cu2O. The UV-DRS studies assigned an optical band gap Eg from 2.01 to 2.06 eV for the composites, and the PL studies showed a reduced lifetime from 0.41 to 0.26 ns for the composite. The XPS and HRTEM studies confirmed the formation of the heterojunction and the evidence for the presence of Cu–N species at the interface which could be categorically assigned to Cu3N by the “d ” spacing obtained from the SAED pattern in the HRTEM. The composite wasevaluated by the visible light photocatalytic degradation of two well-known dyes MB and RhB, which is much higher than earlier reports. Scavenger experiments suggest that the photocatalytic mechanism involves the electrons as the majority charge carriers in the degradation of dyes. The photostability experiments confirm a minimal decrease in the efficiency by <5% even after three repeated cycles. It can be concluded that the improved performance could be due to several factors such as large surface area and heterojunction formation that builds up the charge to effectively separate the photogenerated charge carriers that synergistically lead to excellent visible light degradation of the dyes.
5. Experimental Section
All chemicals and reagents were of analytical grade and used as received without any further purification. The two components of the composite, Cu2O and g-C3N4, were synthesized independently to serve as benchmarks, followed by an in situ sol–gel process to synthesize the g-C3N4/Cu2O composite.
5.1. Synthesis of Cu2O
In a typical synthesis procedure, 0.171 g of CuCl2·2H2O was dissolved in 100 mL of deionized (DI) water in a 250 mL round-bottom flask and heated to 60 °C, at which stage 10 mL of NaOH (2 M) was added dropwise, where the solution changes color initially from pale green to bluish green, and on complete addition of NaOH, the total solution turns black. The first color change confirms the formation of Cu(OH)2, which is bluish green in color, and later the formation of CuO, which is black in color. At this stage, the solution was heated for another 30 min, followed by addition of 10 mL of L-ascorbic acid (0.6 M) dropwise. This step is very crucial to track the progress of the reaction visually where the black CuO changes to orange-red color, which confirms the conversion of CuO to Cu2O (Supporting Information, Figure S1 is the pictorial representation of reaction with the sequence of color changes). L-Ascorbic acid acts as a reducing agent that is responsible for the reduction of Cu(II) to Cu(I). The above conditions were maintained at 60 °C for 3 h to ensure completion of the reaction. Subsequently, the reaction mixture was cooled, and the product was separated by centrifugation at 10,000 rpm for 10 min and washed repeatedly to eliminate any unreacted precursors or other soluble impurities present. The product was dried overnight and analyzed for the confirmation of composition, structure, and morphology.
5.2. Synthesis of g-C3N4
g-C3N4 was synthesized from urea by a slightly modified procedure of an earlier report.69 Typically, 5 g of urea was dissolved in 5 mL of DI water and placed in an oven at 70 °C overnight. The dried sample was then put into the muffle furnace maintaining the temperature at 550 °C for 2 h at a ramping rate of 5°/min. The synthesized compound that appeared yellow in color was ground finely and used for the further studies.
5.3. Synthesis of g-C3N4/Cu2O
The synthesis procedure to obtain the composite materials, that is, g-C3N4/Cu2O, is similar to that described above in Section 5.1 for Cu2O except that along with CuCl2·2H2O, corresponding stoichiometric ratios of g-C3N4 were added to obtain the different weight percentages (2, 4, 6, 8, 10, 12%), respectively. The mixture was subjected to sonication for 1 h before the addition of NaOH. This step ensured intimate mixing of the two components and also good dispersion of the Cu ions in the g-C3N4 layers, leading to highly dispersed g-C3N4/Cu2O composite particles. All the other steps in the synthesis protocol remain the same. The as-prepared composites are sequentially labeled as CN/Cu-1, CN/Cu-2, CN/Cu-3, CN/Cu-4, CN/Cu-5, and CN/Cu-6 as shown in Table 4.
Table 4. Synthesized Cu2O, g-C3N4, and g-C3N4/Cu2O Composites with Incorporated wt % of g-C3N4.
| S.No | Sample code | wt % of g-C3N4 |
|---|---|---|
| 1 | Cu2O | Nil |
| 2 | g-C3N4 | 100 |
| 3 | CN/Cu-1 | 2 |
| 4 | CN/Cu-2 | 4 |
| 5 | CN/Cu-3 | 6 |
| 6 | CN/Cu-4 | 8 |
| 7 | CN/Cu-5 | 10 |
| 8 | CN/Cu-6 | 12 |
Acknowledgments
G.R.S. and P.B. acknowledge the Department of Science and Technology, India, for the financial assistance in the form of the INSPIRE research fellowship (GAP-0529 and GAP-0740). All the authors are thankful to Y. Swarnalatha and B. Arun Kumar for the analytical support. Dr. Pratyay Basak and Dr. Gousia Begum are gratefully acknowledged for their suggestions on the data and schematic presentation. Support from Dr. Mudiam Mohana Krishna Reddy in the LC–MS analysis and Dr. L Giribabu for the lifetime measurements is appreciated. All authors sincerely thank Director, CSIR-IICT, for his encouragement (IICT Communication no. 204).
Supporting Information Available
The Supporting Information is available free of charge on the ACS Publications website at DOI: 10.1021/acsomega.9b02031.
Visual schematic showing the sequence of color changes, FESEM and EDS images of various composites as well as images of g-C3N4 before and after sonication, point-id image of the studied composite, FESEM images of the studied composite at various temperatures, UV–visible absorbance spectra of MB and RhB for all of the nanocomposites other than those included in the mansscript, and LC–MS of MB and RhB dyes (PDF)
Author Contributions
§ G.R.S. and P.B. equally contributing authors.
The authors declare no competing financial interest.
Supplementary Material
References
- Schneider J.; Matsuoka M.; Takeuchi M.; Zhang J.; Horiuchi Y.; Anpo M.; Bahnemann D. W. Understanding TiO2 Photocatalysis: Mechanisms and Materials. Chem. Rev. 2014, 114, 9919–9986. 10.1021/cr5001892. [DOI] [PubMed] [Google Scholar]
- Kumar S. G.; Devi L. G. Review on Modified TiO2 Photocatalysis under UV/Visible Light: Selected Results and Related Mechanisms on Interfacial Charge Carrier Transfer Dynamics. J. Phys. Chem. A 2011, 115, 13211–13241. 10.1021/jp204364a. [DOI] [PubMed] [Google Scholar]
- Ong C. B.; Ng L. Y.; Mohammad A. W. A review of ZnO nanoparticles as solar photocatalysts: Synthesis, mechanisms and applications. Renewable Sustainable Energy Rev. 2018, 81, 536–551. 10.1016/j.rser.2017.08.020. [DOI] [Google Scholar]
- Fang Y.; Li Z.; Xu S.; Han D.; Lu D. Optical properties and photocatalytic activities of spherical ZnO and flower-like ZnO structures synthesized by facile hydrothermal method. J. Alloys Compd. 2013, 575, 359–363. 10.1016/j.jallcom.2013.05.183. [DOI] [Google Scholar]
- Kim S.; Hwang S.-J.; Choi W. J. Visible Light Active Platinum-Ion-Doped TiO2 Photocatalyst. J. Phys. Chem. B 2005, 109, 24260–24267. 10.1021/jp055278y. [DOI] [PubMed] [Google Scholar]
- Chen Y.; Shen C.; Wang J.; Xiao G.; Luo G. Green Synthesis of Ag–TiO2 Supported on Porous Glass with Enhanced Photocatalytic Performance for Oxidative Desulfurization and Removal of Dyes under Visible Light. ACS Sustainable Chem. Eng. 2018, 6, 13276–13286. 10.1021/acssuschemeng.8b02860. [DOI] [Google Scholar]
- Chang Q.-Q.; Cui Y. W.; Zhang H.-H.; Chang F.; Zhu B.-H.; Yu S.-Y. C-doped ZnO decorated with Au nanoparticles constructed from the metal-organic framework ZIF-8 for photodegradation of organic dyes. RSC Adv. 2019, 9, 12689–12695. 10.1039/c8ra09985e. [DOI] [PMC free article] [PubMed] [Google Scholar]
- Bao Z.; Yuan Y.; Leng C.; Li L.; Zhao K.; Sun Z. One-Pot Synthesis of Noble Metal/Zinc Oxide Composites with Controllable Morphology and High Catalytic Performance. ACS Appl. Mater. Interfaces 2017, 9, 16417–16425. 10.1021/acsami.7b02667. [DOI] [PubMed] [Google Scholar]
- Pham V. V.; Bui D. P.; Tran H. H.; Cao M. T.; Nguyen T. K.; Kim Y. S.; Le V. H. Photoreduction route for Cu2O/TiO2 nanotubes junction for enhanced photocatalytic activity. RSC Adv. 2018, 8, 12420–12427. 10.1039/c8ra01363b. [DOI] [PMC free article] [PubMed] [Google Scholar]
- Zou X.; Fan H.; Tian Y.; Yan S. Synthesis of Cu2O/ZnO hetero-nanorod arrays with enhanced visible light-driven photocatalytic activity. CrystEngComm 2014, 16, 1149–1156. 10.1039/c3ce42144a. [DOI] [Google Scholar]
- Liu K.-I.; Hsueh Y.-C.; Chen H.-S.; Perng T.-P. Mesoporous TiO2/WO3 hollow fibers with interior interconnected nanotubes for photocatalytic application. J. Mater. Chem. A 2014, 2, 5387–5393. 10.1039/c3ta15007k. [DOI] [Google Scholar]
- Adhikari S.; Sarkar D.; Madras G. Highly efficient WO3-ZnO mixed oxides for photocatalysis. RSC Adv. 2015, 5, 11895–11904. 10.1039/c4ra13210f. [DOI] [Google Scholar]
- Mu J.; Chen B.; Zhang M.; Guo Z.; Zhang P.; Zhang Z.; Sun Y.; Shao C.; Liu Y. Enhancement of the Visible-Light Photocatalytic Activity of In2O3-TiO2 Nanofiber Heteroarchitectures. ACS Appl. Mater. Interfaces 2012, 4, 424–430. 10.1021/am201499r. [DOI] [PubMed] [Google Scholar]
- Liu H.; Hu C.; Zhai H.; Yang J.; Liu X.; Jia H. Fabrication of In2O3/ZnO@Ag nanowire ternary composites with enhanced visible light photocatalytic activity. RSC Adv. 2017, 7, 37220–37229. 10.1039/c7ra04929c. [DOI] [Google Scholar]
- Gao S.; Zhang J.; Li Y.; Jiao S.; Yuan J.; Wang G.; Li X.; Wang J.; Yu Q.; Zhang X. Synthesis of a ZnO/CdS/TiO2 Composite with Enhanced Photocatalytic Activity and Stability by a Simple Solution-Based Method. Eur. J. Inorg. Chem. 2018, 2018, 1916–1920. 10.1002/ejic.201800072. [DOI] [Google Scholar]
- Boppella R.; Basak P.; Manorama S. V. Viable Method for the Synthesis of Biphasic TiO2 Nanocrystals with Tunable Phase Composition and Enabled Visible-Light Photocatalytic Performance. ACS Appl. Mater. Interfaces 2012, 4, 1239–1246. 10.1021/am201354r. [DOI] [PubMed] [Google Scholar]
- Boppella R.; Anjaneyulu K.; Basak P.; Manorama S. V. Facile Synthesis of Face Oriented ZnO Crystals: Tunable Polar Facets and Shape Induced Enhanced Photocatalytic Performance. J. Phys. Chem. C 2013, 117, 4597–4605. 10.1021/jp311443s. [DOI] [Google Scholar]
- Joshi S.; Ram Kumar C. B.; Jones L. A.; Mayes E. L. H.; Ippolito S. J.; Sunkara M. V. Modulating Interleaved ZnO Assembly with CuO Nanoleaves for Multifunctional Performance: Perdurable CO2 Gas Sensor and Visible Light Catalyst. Inorg. Chem. Front. 2017, 4, 1848–1861. 10.1039/c7qi00474e. [DOI] [Google Scholar]
- Ma J.; Zhou C.; Long J.; Ding Z.; Yuan R.; Xu C. Reducing the barrier effect of graphene sheets on a Ag cocatalyst to further improve the photocatalytic performance of TiO2. RSC Adv. 2018, 8, 14056–14063. 10.1039/c8ra02268b. [DOI] [PMC free article] [PubMed] [Google Scholar]
- Li X.; Yu J.; Wageh S.; Al-Ghamdi A. A.; Xie J. Graphene in Photocatalysis: A Review. Small 2016, 12, 6640–6696. 10.1002/smll.201600382. [DOI] [PubMed] [Google Scholar]
- Upadhyay R. K.; Soin N.; Roy S. S. Role of graphene/metal oxide composites as photocatalysts, adsorbents and disinfectants in water treatment: A review. RSC Adv. 2014, 4, 3823–3851. 10.1039/c3ra45013a. [DOI] [Google Scholar]
- Yan Y.; Miao J.; Yang Z.; Xiao F.-X.; Yang H. B.; Liu B.; Yang Y. Carbon nanotube catalysts: recent advances in synthesis, characterization and applications. Chem. Soc. Rev. 2015, 44, 3295–3346. 10.1039/c4cs00492b. [DOI] [PubMed] [Google Scholar]
- Olowoyo J. O.; Kumar M.; Jain S. L.; Babalola J. O.; Vorontsov A. V.; Kumar U. Insights into Reinforced Photocatalytic Activity of the CNT–TiO2 Nanocomposite for CO2 Reduction and Water Splitting. J. Phys. Chem. C 2019, 123, 367–378. 10.1021/acs.jpcc.8b07894. [DOI] [Google Scholar]
- Zhao Z.; Sun Y.; Dong F. Graphitic carbon nitride based nanocomposites: a review. Nanoscale 2015, 7, 15–37. 10.1039/c4nr03008g. [DOI] [PubMed] [Google Scholar]
- Chen X.; Zhou B.; Yang S.; Wu H.; Wu Y.; Wu L.; Pan J.; Xiong X. In situ construction of an SnO2/g-C3N4 heterojunction for enhanced visible-light photocatalytic activity. RSC Adv. 2015, 5, 68953–68963. 10.1039/c5ra11801h. [DOI] [Google Scholar]
- Vattikuti S. V. P.; Reddy P. A. K.; Shim J.; Byon C. Visible-Light-Driven Photocatalytic Activity of SnO2–ZnO Quantum Dots Anchored on g-C3N4 Nanosheets for Photocatalytic Pollutant Degradation and H2 Production. ACS Omega 2018, 3, 7587–7602. 10.1021/acsomega.8b00471. [DOI] [PMC free article] [PubMed] [Google Scholar]
- Fu J.; Yu J.; Jiang C.; Cheng B. g-C3N4-Based Heterostructured Photocatalysts. Adv. Energy Mater. 2017, 8, 1701503. 10.1002/aenm.201701503. [DOI] [Google Scholar]
- Peng B.; Zhang S.; Yang S.; Wang H.; Yu H.; Zhang S.; Peng F. Synthesis and characterization of g-C3N4/Cu2O composite catalyst with enhanced photocatalytic activity under visible light irradiation. Mater. Res. Bull. 2014, 56, 19–24. 10.1016/j.materresbull.2014.04.042. [DOI] [Google Scholar]
- Zuo S.; Xu H.; Liao W.; Sun L.; Han D.; Zan J.; Zhang B.; Li D.; Xia D. Acid-treated g-C3N4-Cu2O composite catalyst with enhanced photocatalytic activity under visible-light irradiation. Appl. Organomet. Chem. 2018, 32, e4448 10.1002/aoc.4448. [DOI] [Google Scholar]
- Yan X.; Xu R.; Guo J.; Cai X.; Chen D.; Huang L.; Xiong Y.; Tan S. Enhanced photocatalytic activity of Cu2O/g-C3N4 heterojunction coupled with reduced graphene oxide three-dimensional aerogel photocatalysis. Mater. Res. Bull. 2017, 96, 18–27. 10.1016/j.materresbull.2016.12.009. [DOI] [Google Scholar]
- Liang S.; Zhou Y.; Cai Z.; She C. Preparation of porous g-C3N4/Ag/Cu2O: a new composite with enhanced visible-light photocatalytic activity. Appl. Organomet. Chem. 2016, 30, 932–938. 10.1002/aoc.3523. [DOI] [Google Scholar]
- Mitra A.; Howli P.; Sen D.; Das B.; Chattopadhyay K. K. Cu2O/g-C3N4 nanocomposites: An insight into the band structure tuning and catalytic efficiencies. Nanoscale 2016, 8, 19099–19109. 10.1039/c6nr06837e. [DOI] [PubMed] [Google Scholar]
- Surikanti G. R.; Bandarapu A. K.; Sunkara M. V. A Facile One Pot Synthesis of Cu2O@TiO2: A Nanocomposite Catalyst for Enhanced Visible Light Driven Photocatalysis. ChemistrySelect 2019, 4, 2249–2257. 10.1002/slct.201900003. [DOI] [Google Scholar]
- Zhang W.; Zhou L.; Deng H. Ag modified g-C3N4 composites with enhanced visible-light photocatalytic activity for diclofenac degradation. J. Mol. Catal. A: Chem. 2016, 423, 270–276. 10.1016/j.molcata.2016.07.021. [DOI] [Google Scholar]
- Jayaraman T.; Raja S. A.; Priya A.; Jagannathan M.; Ashokkumar M. Synthesis of a visible-light active V2O5–g-C3N4 heterojunction as an efficient photocatalytic and photoelectrochemical material. New J. Chem. 2015, 39, 1367–1374. 10.1039/c4nj01807a. [DOI] [Google Scholar]
- Lin J.; Liu Y.; Wang Y.; Jia H.; Chen S.; Qi J.; Qu C.; Cao J.; Fei W.; Feng J. Designed formation of NiO@C@Cu2O hybrid arrays as battery-like electrode with enhanced electrochemical performances. Ceram. Int. 2017, 43, 15410–15417. 10.1016/j.ceramint.2017.08.082. [DOI] [Google Scholar]
- Yu H.; Yu J.; Liu S.; Mann S. Template-free Hydrothermal Synthesis of CuO/Cu2O Composite Hollow Microspheres. Chem. Mater. 2007, 19, 4327–4334. 10.1021/cm070386d. [DOI] [Google Scholar]
- Brandt I. S.; Martins C. A.; Zoldan V. C.; Viegas A. D. C.; Dias da Silva J. H.; Pasa A. A. Structural and optical properties of Cu2O crystalline electrodeposited films. Thin Solid Films 2014, 562, 144–151. 10.1016/j.tsf.2014.04.013. [DOI] [Google Scholar]
- Tong Z.; Yang D.; Zhao X.; Shi J.; Ding F.; Zou X.; Jiang Z. Bio-inspired synthesis of three-dimensional porous g-C3N4@carbonmicroflowers with enhanced oxygen evolution reactivity. Chem. Eng. J. 2018, 337, 312–321. 10.1016/j.cej.2017.12.064. [DOI] [Google Scholar]
- Tong Z.; Yang D.; Sun Y.; Nan Y.; Jiang Z.. Tubular g-C3N4 Isotype Heterojunction: Enhanced Visible-Light Photocatalytic Activity through Cooperative Manipulation of Oriented Electron and Hole Transfer. Small 2016, 12, DOI:4093−4101 10.1002/smll.201601660. [DOI] [PubMed] [Google Scholar]
- Tong Z.; Yang D.; Shi J.; Nan Y.; Sun Y.; Jiang Z. Three-Dimensional Porous Aerogel Constructed by g-C3N4 and Graphene Oxide Nanosheets with Excellent Visible-Light Photocatalytic Performance. ACS Appl. Mater. Interfaces 2015, 7, 25693–25701. 10.1021/acsami.5b09503. [DOI] [PubMed] [Google Scholar]
- Ji C.; Yin S.-N.; Sun S.; Yang S. An in situ mediator-free route to fabricate Cu2O/g-C3N4 type-II heterojunctions for enhanced visible-light photocatalytic H2 generation. Appl. Surf. Sci. 2018, 434, 1224–1231. 10.1016/j.apsusc.2017.11.233. [DOI] [Google Scholar]
- Ansari A.; Ali A.; Asif M.; Shamsuzzaman S. Microwave-assisted MgO NP catalyzed one-pot multicomponent synthesis of polysubstituted steroidal pyridines. New J. Chem. 2018, 42, 184–197. 10.1039/c7nj03742b. [DOI] [Google Scholar]
- Xu M.; Han L.; Dong S. Facile Fabrication of Highly Efficient g-C3N4/Ag2O Heterostructured Photocatalysts with Enhanced Visible-Light Photocatalytic Activity. ACS Appl. Mater. Interfaces 2013, 5, 12533–12540. 10.1021/am4038307. [DOI] [PubMed] [Google Scholar]
- Qiu J.; Feng Y.; Zhang X.; Zhang X.; Jia M.; Yao J. Facile stir-dried preparation of g-C3N4/TiO2 homogeneous composites with enhanced photocatalytic activity. RSC Adv. 2017, 7, 10668–10674. 10.1039/c7ra00050b. [DOI] [Google Scholar]
- Tu D.; Liao H.; Deng Q. Synthesis of BN/g-C3N4 as Visible-light-driven Photocatalysts for Degradation of Different Organic Pollutants. ChemistrySelect 2018, 3, 7170–7177. 10.1002/slct.201800921. [DOI] [Google Scholar]
- De Jongh P. E.; Vanmaekelbergh D.; Kelly J. J. Cu2O: Electrodeposition and Characterization. Chem. Mater. 1999, 11, 3512–3517. 10.1021/cm991054e. [DOI] [Google Scholar]
- Praus P.; Svoboda L.; Dvorský R.; Reli M.; Kormunda M.; Mančík P. Synthesis and properties of nanocomposites of WO3 and exfoliated g-C3N4. Ceram. Int. 2017, 43, 13581–13591. 10.1016/j.ceramint.2017.07.067. [DOI] [Google Scholar]
- Ge L.; Han C.; Liu J. Novel visible light-induced g-C3N4/Bi2WO6 composite photocatalysts for efficient degradation of methyl orange. Appl. Catal., B 2011, 108–109, 100–107. 10.1016/j.apcatb.2011.08.014. [DOI] [Google Scholar]
- Reddy T. N.; Begum G.; Rana R. K. A bio-inspired strategy for the interfacial assembly of graphene oxide with in situ generated Ag/AgCl: designing sustainable hybrid photocatalysts. Phys. Chem. Chem. Phys. 2017, 19, 7624–7630. 10.1039/c6cp07854k. [DOI] [PubMed] [Google Scholar]
- Houas A.; Lachheb H.; Ksibi M.; Elaloui E.; Guillard C.; Herrmann J.-M. Photocatalytic degradation pathway of methylene blue in water. Appl. Catal., B 2001, 31, 145–157. 10.1016/s0926-3373(00)00276-9. [DOI] [Google Scholar]
- Yu K.; Yang S.; He H.; Sun C.; Gu C.; Ju Y. Visible Light-Driven Photocatalytic Degradation of Rhodamine B over NaBiO3: Pathways and Mechanism. J. Phys. Chem. A 2009, 113, 10024–10032. 10.1021/jp905173e. [DOI] [PubMed] [Google Scholar]
- Wang W.; Huang X.; Wu S.; Zhou Y.; Wang L.; Shi H.; Liang Y.; Zou B. Preparation of p–n junction Cu2O/BiVO4 heterogeneous nanostructures with enhanced visible-light photocatalytic activity. Appl. Catal., B 2013, 134–135, 293–301. 10.1016/j.apcatb.2013.01.013. [DOI] [Google Scholar]
- Yu L.; Li G.; Zhang X.; Ba X.; Shi G.; Li Y.; Wong P. K.; Yu J. C.; Yu Y. Enhanced Activity and Stability of Carbon-Decorated Cuprous Oxide Mesoporous Nanorods for CO2 Reduction in Artificial Photosynthesis. ACS Catal. 2016, 6, 6444–6454. 10.1021/acscatal.6b01455. [DOI] [Google Scholar]
- Biesinger M. C. Advanced analysis of copper X-ray photoelectron spectra. Surf. Interface Anal. 2017, 49, 1325–1334. 10.1002/sia.6239. [DOI] [Google Scholar]
- Sithole R. K.; Machogo L. F. E.; Airo M. A.; Gqoba S. S.; Moloto M. J.; Shumbula P.; Van Wyk J.; Moloto N. Synthesis and characterization of Cu3N nanoparticles using pyrrole-2-carbaldpropyliminato Cu(II) complex and Cu(NO3)2 as single-source precursors: the search for an ideal precursor. New J. Chem. 2018, 42, 3042. 10.1039/c7nj05181f. [DOI] [Google Scholar]
- Chang Y.-M.; Leu J.; Lin B.-H.; Wang Y.-L.; Cheng Y.-L.. Comparison of H2 and NH3 Treatments for Copper Interconnects. Adv. Mater. Sci. Eng. 2013, 2013, Article ID 1–7, 10.1155/2013/825195 [DOI] [Google Scholar]
- Zhang Z.; Song R.; Yu Z.; Huang W. Crystal-plane effect of Cu2O templates on compositions, structures and catalytic performance of Ag/Cu2O nanocomposites. CrystEngComm 2019, 21, 2002–2008. 10.1039/c8ce02164c. [DOI] [Google Scholar]
- Jiang J.; Zou J.; Wee A. T. S.; Zhang W. Use of Single-Layer g-C3N4/Ag Hybrids for Surface-Enhanced Raman Scattering (SERS). Sci. Rep. 2016, 6, 34599. 10.1038/srep34599. [DOI] [PMC free article] [PubMed] [Google Scholar]
- Meng F.-L.; Zhong H.-X.; Zhang Q.; Liu K.-H.; Yan J.-M.; Jiang Q. Integrated Cu3N porous nanowire array electrode for high-performance supercapacitors. J. Mater. Chem. A 2017, 5, 18972–18976. 10.1039/c7ta05439d. [DOI] [Google Scholar]
- Reichert M. D.; White M. A.; Thompson M. J.; Miller G. J.; Vela J. Preparation and Instability of Nanocrystalline Cuprous Nitride. Inorg. Chem. 2015, 54, 6356–6362. 10.1021/acs.inorgchem.5b00679. [DOI] [PubMed] [Google Scholar]
- Majumdar A.; Drache S.; Wulff H.; Mukhopadhyay A.; Bhattacharyya S.; Helm C.; Hippler R. Strain Effects by Surface Oxidation of Cu3N Thin Films Deposited by DC Magnetron Sputtering. Coatings 2017, 7, 64. 10.3390/coatings7050064. [DOI] [Google Scholar]
- Maruyama T.; Morishita T. Copper nitride thin films prepared by radio-frequency reactive sputtering. J. Appl. Phys. 1995, 78, 4104–4107. 10.1063/1.359868. [DOI] [Google Scholar]
- Kamat H.; Wang X.; Parry J.; Qin Y.; Zeng H. Synthesis and Characterization of Copper-Iron Nitride Thin Films. MRS Adv. 2016, 1, 203–208. 10.1557/adv.2015.13. [DOI] [Google Scholar]
- Gallardo-Vega C.; de la Cruz W. Study of the structure and electrical properties of the copper nitride thin films deposited by pulsed laser deposition. Appl. Surf. Sci. 2006, 252, 8001–8004. 10.1016/j.apsusc.2005.10.007. [DOI] [Google Scholar]
- Takashi N.; Hiromichi H.; Taka-aki H.; Takeo E. Preparation of Copper Nitride (Cu3N) Nanoparticles in Long-Chain Alcohols at 130–200 °C and Nitridation Mechanism. Inorg. Chem. 2014, 53, 710–715. 10.1021/ic4011604. [DOI] [PubMed] [Google Scholar]
- Dick K.; Dhanasekaran T.; Zhang Z.; Meisel D. Size-dependent melting of silica-encapsulated gold nanoparticles. J. Am. Chem. Soc. 2002, 124, 2312–2317. 10.1021/ja017281a. [DOI] [PubMed] [Google Scholar]
- Mudunkotuwa I. A.; Rupasinghe T.; Wu C.-M.; Grassian V. H. Dissolution of ZnO Nanoparticles at Circumneutral pH: A Study of Size Effects in the Presence and Absence of Citric Acid. Langmuir 2012, 28, 396–403. 10.1021/la203542x. [DOI] [PubMed] [Google Scholar]
- Dong F.; Wu L.; Sun Y.; Fu M.; Wu Z.; Lee S. C. Efficient synthesis of polymeric g-C3N4 layered materials as novel efficient visible light driven photocatalysts. J. Mater. Chem. 2011, 21, 15171–15174. 10.1039/c1jm12844b. [DOI] [Google Scholar]
Associated Data
This section collects any data citations, data availability statements, or supplementary materials included in this article.


