eLife logoLink to eLife
. 2019 Sep 23;8:e44522. doi: 10.7554/eLife.44522

Optical estimation of absolute membrane potential using fluorescence lifetime imaging

Julia R Lazzari-Dean 1, Anneliese MM Gest 1, Evan W Miller 1,2,3,
Editors: Lawrence Cohen4, Richard Aldrich5
PMCID: PMC6814365  PMID: 31545164

Abstract

All cells maintain ionic gradients across their plasma membranes, producing transmembrane potentials (Vmem). Mounting evidence suggests a relationship between resting Vmem and the physiology of non-excitable cells with implications in diverse areas, including cancer, cellular differentiation, and body patterning. A lack of non-invasive methods to record absolute Vmem limits our understanding of this fundamental signal. To address this need, we developed a fluorescence lifetime-based approach (VF-FLIM) to visualize and optically quantify Vmem with single-cell resolution in mammalian cell culture. Using VF-FLIM, we report Vmem distributions over thousands of cells, a 100-fold improvement relative to electrophysiological approaches. In human carcinoma cells, we visualize the voltage response to growth factor stimulation, stably recording a 10–15 mV hyperpolarization over minutes. Using pharmacological inhibitors, we identify the source of the hyperpolarization as the Ca2+-activated K+ channel KCa3.1. The ability to optically quantify absolute Vmem with cellular resolution will allow a re-examination of its signaling roles.

Research organism: Human, Other

eLife digest

All living cells are like tiny batteries. As long as a cell is alive, it actively maintains a difference in electrical charge between its interior and exterior. This charge difference, or voltage, is called the membrane potential, and it is vital for our bodies to work properly. For example, fast changes in membrane potential control our heartbeat and underpin the electrical signals that brain cells use to communicate.

Slower changes in membrane potential – ranging from minutes to days – may also play important roles in other organs. To understand how and why membrane potential is important in these contexts, we need methods to measure it accurately in individual cells.

One way is to puncture cells with microscopic electrodes: this yields accurate results but damages the cells and can only measure one cell at a time. Alternative methods treat cells with special fluorescent dyes and then image them with a microscope. The dyes emit light in response to voltage variations: when the cells’ membrane potential changes, the dyes glow brighter. The changes in light intensity give an estimate of the size of the change in membrane potential. This allows many cells to be analyzed without harming them, but it is less accurate.

Fluorescence lifetime refers to how long fluorescent dyes take to finish emitting light, and this phenomenon has already helped researchers to record a variety of processes in the cell. Lazzari-Dean et al. therefore wanted to use fluorescence lifetime to develop a better way of recording membrane potential. This method, called VF-FLIM, relied on measuring how long certain dyes took to finish emitting light at specific voltages, rather than how bright they were.

Experiments using mammalian cells grown in the laboratory showed that the membrane potentials measured with VF-FLIM were similar to those recorded with electrodes, which represent the highest standard of accuracy. The new method was at least eight times more accurate than other techniques using fluorescent dyes. VF-FLIM could also measure many thousands of cells within a few hours, a hundred times faster than electrode-based methods. Finally, tests on human cancer cells revealed that VF-FLIM could detect that these cells go through gradual changes in membrane potential in response to growth signals.

VF-FLIM is a new, non-invasive tool that can measure changes in membrane potential more quickly and accurately. This will help to better understand the many roles membrane potential could play in healthy and diseased cells.

Introduction

Membrane potential (Vmem) is an essential facet of cellular physiology. In electrically excitable cells, such as neurons and cardiomyocytes, voltage-gated ion channels enable rapid changes in membrane potential. These fast membrane potential changes, on the order of milliseconds to seconds, trigger release of neurotransmitters in neurons or contraction in myocytes. The resting membrane potentials of these cells, which change over longer timescales, affect their excitability. In non-electrically excitable cells, slower changes in Vmem—on the order of seconds to hours—are linked to a variety of fundamental cellular processes (Abdul Kadir et al., 2018), including mitosis (Cone and Cone, 1976), cell cycle progression (Huang and Jan, 2014), and differentiation (Tsuchiya and Okada, 1982). Mounting lines of evidence point to the importance of electrochemical gradients in development, body patterning, and regeneration (Levin, 2014).

Despite the importance of membrane potential to diverse processes over a range of time scales, the existing methods for recording Vmem are inadequate for characterizing distributions of Vmem states in a sample or studying gradual shifts in resting membrane potential (Figure 1—source data 1). Patch clamp electrophysiology remains the gold standard for recording cellular electrical parameters, but it is low throughput, highly invasive, and difficult to implement over extended time periods. Where reduced invasiveness or higher throughput analyses of Vmem are required, optical methods for detecting events involving Vmem changes (e.g. whether an action potential occurred) are often employed (Huang et al., 2006; McKeithan et al., 2017; Zhang et al., 2016). However, optical approaches generally use fluorescence intensity values as a readout, which cannot report either the value of Vmem in millivolts (‘absolute Vmem’) or the millivolt amount by which Vmem changed (Peterka et al., 2011). Variations in dye environment (Ross and Reichardt, 1979), dye loading, illumination intensity, fluorophore bleaching, and/or cellular morphology complicate fluorescence intensity measurements, making calibration and determination of absolute membrane potential difficult or impossible. This limitation restricts optical analysis to detection of acute Vmem changes, which can be analyzed without comparisons of Vmem between cells or over long timescales.

One strategy to address these fluorescence intensity artifacts and quantify cellular parameters optically is ratio-based imaging. For Vmem specifically, ratio-based signals can be accessed either with a two-component system or with an electrochromic voltage sensitive dye, but neither strategy has enabled accurate absolute Vmem recordings. Two-component FRET-oxonol systems, with independent chromophores for ratio-based calibration, have seen limited success (González and Tsien, 1997), and they confer significant capacitive load on the cell (Briggman et al., 2010). Further, their performance hinges on carefully tuned loading procedures of multiple lipophilic indicators (Adams and Levin, 2012), which can be challenging to reproduce across different samples and days. On the other hand, electrochromic probes report voltage as changes in excitation and emission wavelengths of a single chromophore (Loew et al., 1979). While they benefit from simpler loading procedures, signals from electrochromic styryl dyes require normalization with an electrode on each cell of interest to determine absolute Vmem accurately (Montana et al., 1989; Zhang et al., 1998; Bullen and Saggau, 1999). As a result, ratiometric Vmem sensors cannot be used to optically quantify slow signals in the resting Vmem, which may be on the order of tens of millivolts. Indeed, ratiometric Vmem probes are most commonly applied to detect - rather than quantify - fast changes in Vmem (Zhang et al., 1998), much like their single wavelength counterparts.

An alternative approach to improved quantification in optical measurements is fluorescence lifetime (τfl) imaging (FLIM), which measures the excited state lifetime of a population of fluorophores. Because fluorescence lifetime is an intrinsic property, FLIM can avoid many of the artifacts that confound extrinsic fluorescence intensity measurements, such as uneven dye loading, fluorophore bleaching, variations in illumination intensity, and detector sensitivity (Berezin and Achilefu, 2010; Yellen and Mongeon, 2015). If a fluorescent probe responds to the analyte of interest via changes in the lifetime of its excited state, there is the opportunity to use fluorescence lifetime to provide a more quantitative estimate of analyte parameters than can be achieved with fluorescence intensity alone. Although FLIM measurements can be affected by environmental factors such as temperature, ionic strength and local environment (Berezin and Achilefu, 2010), FLIM has been widely employed to record a number of biochemical and biophysical parameters, including intracellular Ca2+ concentration (Zheng et al., 2015), viscosity (Levitt et al., 2009), GTPase activity (Harvey et al., 2008), kinase activity (Lee et al., 2009), and redox state (NADH/NAD+ ratio) (Blacker and Duchen, 2016), among others (Yellen and Mongeon, 2015). Attempts to record absolute voltage with FLIM, however, have been limited in success (Dumas and Stoltz, 2005; Hou et al., 2014; Brinks et al., 2015). Previous work focused on genetically encoded voltage indicators (GEVIs), which either possess complex relationships between τfl and voltage (Hou et al., 2014) or show low sensitivity to voltage in lifetime (Brinks et al., 2015) and require complex and technically challenging measurements of fast photochemical kinetics to estimate voltage (Hou et al., 2014). Because of this poor voltage resolution, the fluorescence lifetimes of GEVIs cannot be used to detect most biologically relevant voltage changes, which are on the order of tens of millivolts.

Fluorescent voltage indicators that use photoinduced electron transfer (PeT) as a voltage-sensing mechanism are promising candidates for a FLIM-based approach to optical Vmem quantification. Because PeT affects the nonradiative decay rate of the fluorophore excited state, it has been successfully translated from intensity to τfl imaging with a number of small molecule probes for Ca2+ (Lakowicz et al., 1992). We previously established that VoltageFluor (VF)-type dyes transduce changes in cellular membrane potential to changes in fluorescence intensity and that the voltage response of VF dyes is consistent with a PeT-based response mechanism (Miller et al., 2012; Woodford et al., 2015). Changes in the transmembrane potential alter the rate of PeT (Li, 2007; de Silva et al., 1995) from an electron-rich aniline donor to a fluorescent reporter, thereby modulating the fluorescence intensity of VF dyes (Miller et al., 2012) (Figure 1A,B). VoltageFluors also display low toxicity and rapid, linear responses to voltage.

Figure 1. VoltageFluor FLIM linearly reports absolute membrane potential.

(A) Mechanism of VoltageFluor dyes, in which depolarization of the membrane potential attenuates the rate of photoinduced electron transfer. (B) Structures of the VF molecules used in this study. (C) Schematic of the TCSPC system used to measure fluorescence lifetime. Simultaneous electrophysiology was used to establish lifetime-voltage relationships. (D) Fluorescence intensity and (E) lifetime of HEK293T cells loaded with 100 nM VF2.1.Cl. (F) Intensity and (G) lifetime images of HEK293T cells voltage clamped at the indicated membrane potential. (H) Quantification of the single trial shown in (G), with a linear fit to the data. (I) Evaluation of VF2.1.Cl lifetime-voltage relationships in many individual HEK293T cells. Gray lines represent linear fits on individual cells. Black line is the average lifetime-voltage relationship across all cells (n = 17). (J) VF2.0.Cl lifetime does not exhibit voltage-dependent changes. Gray lines represent linear fits on individual cells, and the black line is the average lifetime-voltage relationship across all cells (n = 17). Scale bars represent 20 μm. Error bars represent mean ± SEM.

Figure 1—source data 1. Comparison of available approaches for measuring membrane potential in cells.
aMeasurements vary too much to be converted to absolute voltage or interpreted across populations of cells. This variability is attributable to numerous confounding factors, including dye loading, photobleaching, and sample movement (Peterka et al., 2011). bWhile in principle less variable than a single-color fluorescence intensity measurement, in practice, the signal depends strongly on the loading of two independent lipophilic indicators (Adams and Levin, 2012; Maher et al., 2007), which can vary substantially. cANEPPS excitation ratios depend on a variety of non-voltage factors, in particular the membrane composition, leading to substantial artifacts in optical Vmem determinations (Zhang et al., 1998; Gross et al., 1994). dWith the GEVI CAESR in our hands, apparently poor protein trafficking produces large amounts of non-voltage-sensitive signal, which contaminates the FLIM recording and contributes to high cell to cell variability (Figure 1—figure supplement 4, Materials and methods). ePatch-clamp electrophysiology requires physical contact with the cell of interest, which causes damage to the cell and, in whole cell configurations, washout of intracellular factors. Slight movement of the cell or sample generally result in loss of the patch. fMovement of the cell and photobleaching of the dye both cause large changes to the signal over seconds to minutes. gRatio-calibrated imaging approaches use a second signal (usually another color of fluorescence) to correct for differences in dye concentration or changes in the region of interest that contaminate single-color intensity signals. If the rate of photobleaching is the same for both components, photobleaching artifacts can also be avoided. hLimited by photon count rates. iLimited by probe movement in the membrane, which depends mostly on lipophilicity (Briggman et al., 2010). jPhoton counting based lifetime imaging, like epifluorescence intensity imaging, is limited by photon count rates. Large numbers of photons per pixel must be collected to fit TCSPC FLIM data, often using a line scanning confocal approach, leading to slower acquisition speeds than epifluorescence-based intensity imaging. kToxicity from capacitive load of the sensor (Briggman et al., 2010). lThe spatial resolution of electrophysiology is compromised by space clamp error, preventing interpretation of Vmem in regions far from the electrode (e.g. many neuronal processes) (Williams and Mitchell, 2008; 35,36). mAs demonstrated by Cohen and co-workers (Brinks et al., 2015); in our hands with CAESR, we also experienced significant improvements in voltage resolution by fitting a single curve per FLIM image instead of processing the images pixel-wise (see Materials and methods) nIn this work, we calibrated VF-FLIM for Vmem measurements with single cell resolution. In principle, subcellular spatial resolution could be achieved with the VF-FLIM technique.
DOI: 10.7554/eLife.44522.008
Figure 1—source data 2. Properties of lifetime standards and VoltageFluor dyes.
Fluorescein and erythrosin B standards were measured in drops of solution placed on a coverslip. For VF dyes, voltage sensitivities from intensity-based fluorescence imaging in HEK293T cells (%ΔF/F, percent change in fluorescence intensity for a voltage step from −60 mV to +40 mV) are from previously published work (Woodford et al., 2015). Lifetime data were obtained from voltage-clamp electrophysiology of HEK293T cells loaded with 100 nM VF. Lifetime listed here is the average 0 mV lifetime from the electrophysiology calibration. % Δτ/τ is the percent change in lifetime corresponding to a 100 mV step from −60 mV to +40 mV. Lifetime sample sizes: fluorescein 25, erythrosin B 25, VF2.1.Cl 17, VF2.0.Cl 17. For lifetime standards, each measurement was taken on a separate day. VF2.1.Cl data in HEK293T is duplicated in Figure 2—source data 1. Values are tabulated as mean ± SEM.
DOI: 10.7554/eLife.44522.009
Figure 1—source data 3. Comparison of optical approaches to absolute Vmem determination in HEK293T cells.
Data are compiled from Figure 1 (VF-FLIM, this work), Figure 1—figure supplement 4 (CAESR; Brinks et al., 2015), and Figure 1—figure supplement 5 (Di-8-ANEPPS; Zhang et al., 1998). All data were obtained by simultaneous whole cell voltage clamp electrophysiology and optical recording in HEK293T (VF-FLIM n = 17 cells, CAESR n = 9, di-8-ANEPPS n = 16). Calculation of intra and inter cell accuracies are performed via root-mean-square deviation (RMSD) and discussed in detail in the Methods (see Resolution of VF-FLIM…). Regions of interest were chosen at the plasma membrane in all cases. Di-8-ANEPPS data are presented as the ratio of signal obtained with blue excitation to signal obtained with green excitation (R, see Materials and methods) and are not normalized to the 0 mV R.
DOI: 10.7554/eLife.44522.010

Figure 1.

Figure 1—figure supplement 1. Overview of data processing to obtain membrane potential recordings from fluorescence lifetime.

Figure 1—figure supplement 1.

Time-correlated photon data (black dots, first panel) collected at each pixel were fit to an exponential decay model (green) with iterative reconvolution of the instrument response function (IRF, blue). The two components of the fluorescence lifetimes were converted to a weighted average (middle panel). Cell membranes (white outlines) were identified, and τm was averaged within each of these regions of interest (ROIs, right panel). These lifetimes were then converted to voltage via a previously determined lifetime-Vmem standard curve with slope m and y-intercept b. Additional details of this process are provided in the Methods. Wtd. Res.: weighted residuals of the fit, τm: weighted average fluorescence lifetime, PC: photon count. τm + PC represents an overlay of the lifetime data (color heat map) onto the photon count image. Pixels that appear black in τm + PC images were below the required photon count threshold for fitting lifetime data; PC only images show photon counts without any such thresholds applied. Scale bar is 20 µm.

Figure 1—figure supplement 2. Concentration dependence of VoltageFluor lifetimes in HEK293T cells.

Figure 1—figure supplement 2.

Changes in lifetime arising from addition of a range of concentrations of (A) VF2.1.Cl or (B) voltage-insensitive control VF2.0.Cl in HEK293T cells. Biexponential fit models were used for all VF2.1.Cl concentrations and 1 μM VF2.0.Cl; a monoexponential model was used for all other VF2.0.Cl concentrations. Box plots represent the interquartile range, with whiskers and outliers determined with the Tukey method. Sample sizes indicate number of cell groups. Data were obtained over 2 to 4 different days from a total of 3 or 4 coverslips at each concentration. Asterisks indicate significant differences between the indicated concentration and the VF concentration used for electrophysiology experiments (n.s. p>0.05, *p<0.05, **p<0.01, ***p<0.001, ****p<0.0001, two-sided, unpaired, unequal variances t-test).

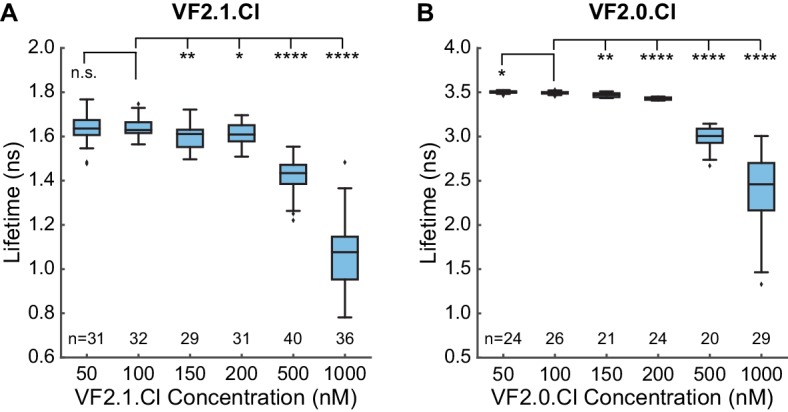
Figure 1—figure supplement 3. VF2.0.Cl lifetime does not depend on membrane potential.

Figure 1—figure supplement 3.

(A) Photon count and (B) lifetime images of a single HEK293T cell loaded with 100 nM VF2.0.Cl, with the membrane potential held at the indicated value via whole-cell voltage clamp electrophysiology. White arrow indicates patch pipette. Scale bar is 20 μm. (C) Quantification of images shown in (B) for this individual cell. Black line is the line of best fit.

Figure 1—figure supplement 4. The GEVI CAESR shows variable lifetime-voltage relationships.

Figure 1—figure supplement 4.

(A) Photon count and (B) lifetime images of a HEK293T cell expressing CAESR and held at the indicated Vmem with voltage-clamp electrophysiology. White arrow indicates voltage-clamped cell. (C) Lifetime-Vmem relationship from the cell in (B), based on a single fit from combined fluorescence decays of all pixels in the cell membrane at each potential (see Materials and methods). Points indicate recordings at a given potential; solid line is line of best fit. (D) Evaluation of VF2.1.Cl lifetime-voltage relationships in many individual CAESR-expressing HEK293T cells. Gray lines represent linear fits on individual cells. Black line is the average fit across all cells (n = 9). (E) Representative lifetime images of CAESR in HEK293T cells. Scale bars represent 20 μm.

Figure 1—figure supplement 5. Ratiometric Vmem determinations with Di-8-ANEPPS in HEK293T cells.

Figure 1—figure supplement 5.

Different fluorescence excitation wavelengths (blue and green) were used to generate ratiometric images; emission wavelengths were constant throughout the experiment. Details of epifluorescence ratiometric imaging and data processing are described in the Materials and methods Simultaneous ratiometric imaging and whole cell patch clamp electrophysiology were used to determine the ratio between the blue and green excitation channels (blue/green ratio, R). Representative images of (A) blue-excited signal, (B) green-excited signal and (C) R of a HEK293T cell held at the indicated membrane potential with whole cell voltage clamp electrophysiology. White arrow indicates voltage clamped cell. Differences in background brightness between images are attributable to photobleaching of the probe; images were acquired in the order: 0,–80, +40,–40, +80 mV. (D) Time course of the voltage step protocol used for each cell (black line, top), along with a representative response in the fluorescence ratio (orange), blue excited fluorescence intensity (blue) and green excited fluorescence intensity (green). AU, arbitrary units. (E) R at various potentials for an individual HEK293T cell (black dots), along with an R-Vmem line of best fit (black line). Values shown are the average of all ratio images from a particular cell at a given potential, excluding the first and last ratio image taken for each Vmem value. Data shown in (D) and (E) are from the cell depicted in (A)-(C). (F) Aggregated lines of best fit (gray) for R-Vmem calibrations on multiple HEK293T cells. Average response is shown in black; ratios at each potential are depicted as mean ± SEM (n = 16 cells). (G) Additional representative R images of Di-8-ANEPPS in HEK293T cells. The cell indicated with the white arrow is held at 0 mV with electrophysiology; other cells are unperturbed. Images represent one frame at the given voltage and are not averaged. Regions of interest (ROIs) were drawn around the membrane only, avoiding both the internalized dye signal and the artificially high ratios just outside the cells (which appear as white edges) as much as possible. Scale bars represent 20 µm.

Here, we develop fluorescence lifetime imaging of VoltageFluor dyes (VF-FLIM) as a quantitative, all-optical approach for recording absolute membrane potential with single cell resolution. Using patch-clamp electrophysiology as a standard, we demonstrate that VF-FLIM reports absolute membrane potential in single trials with 10 to 23 mV accuracy (root mean square deviation, RMSD; 15 s acquisition), depending on the cell line. In all cases tested, VF-FLIM tracks membrane potential changes with better than 5 mV accuracy (RMSD). We benchmark VF-FLIM against previously reported optical absolute Vmem recording approaches and demonstrate resolution improvements of 8-fold over ratiometric strategies and 19-fold over other lifetime-based strategies. To highlight the increased throughput relative to manual patch-clamp electrophysiology, we document resting membrane potentials of thousands of cells. To our knowledge, this work represents the first broad view of the distribution of resting membrane potentials present in situ. VF-FLIM is limited to acquisition speeds on the order of seconds, but it is well-suited for studying gradual Vmem dynamics. Using VF-FLIM, we quantify and track the evolution of a 10–15 mV Vmem hyperpolarization over minutes following epidermal growth factor (EGF) stimulation of human carcinoma cells. Through pharmacological perturbations, we conclude that the voltage changes following EGF stimulation arise from activation of the calcium-activated potassium channel KCa3.1. Our results show that fluorescence lifetime of VF dyes is a generalizable and effective approach for studying resting membrane potential in a range of cell lines (Lakowicz et al., 1992).

Results

VoltageFluor fluorescence lifetime varies linearly with membrane potential

To characterize how the photoinduced electron transfer process affects fluorescence lifetime, we compared the τfl of the voltage-sensitive dye VF2.1.Cl with its voltage-insensitive counterpart VF2.0.Cl (Figure 1B). We recorded the τfl of bath-applied VF dyes in HEK293T cells using time-correlated single-photon counting (TCSPC) FLIM (Figure 1C–EScheme 1). VF2.1.Cl is localized to the plasma membrane and exhibits a biexponential τfl decay with decay constants of approximately 0.9 and 2.6 ns (Figure 1—figure supplement 1). For all subsequent analysis of VF2.1.Cl lifetime, we refer to the weighted average τfl, which is approximately 1.6 ns in HEK293T cell membranes at rest. VF2.0.Cl (Figure 1B), which lacks the aniline substitution and is therefore voltage-insensitive (Woodford et al., 2015), shows a τfl of 3.5 ns in cell membranes, which is similar to the lifetime of an unsubstituted fluorescein (Magde et al., 1999) (Figure 1—source data 2). We also examined VoltageFluor lifetimes at a variety of dye loading concentrations to test for concentration-dependent changes in dye lifetime, which have been reported for fluorescein derivatives (Chen and Knutson, 1988). Shortened VF lifetimes were observed at high dye concentrations (Figure 1—figure supplement 2); all subsequent VF-FLIM studies were conducted at dye concentrations low enough to avoid this concentration-dependent change in lifetime.

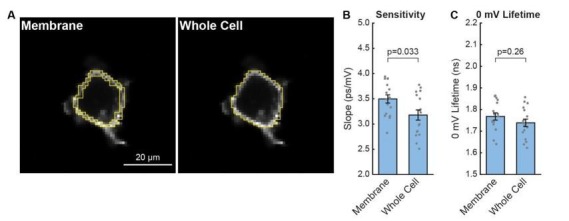
To assess the voltage dependence of VoltageFluor τfl, we controlled the plasma membrane potential of HEK293T cells with whole-cell voltage-clamp electrophysiology while simultaneously measuring the τfl of VF2.1.Cl (Figure 1C). Single-cell recordings show a linear τfl response to applied voltage steps, and individual measurements deviate minimally from the linear fit (Figure 1F–H). VF2.1.Cl τfl is reproducible across different cells at the same resting membrane potential, allowing determination of Vmem from τfl images taken without concurrent electrophysiology (Figure 1I). Voltage-insensitive VF2.0.Cl shows no τfl change in response to voltage (Figure 1J, Figure 1—figure supplement 3), consistent with a τfl change in VF2.1.Cl arising from a voltage-dependent PeT process. In HEK293T cells, VF2.1.Cl exhibits a sensitivity of 3.50 ± 0.08 ps/mV and a 0 mV lifetime of 1.77 ± 0.02 ns, corresponding to a fractional change in τfl (Δτ/τ) of 22.4 ± 0.4% per 100 mV. These values are in good agreement with the 27% ΔF/F intensity change per 100 mV originally observed for VF2.1.Cl (Miller et al., 2012; Woodford et al., 2015). Because %ΔF/F is a fluorescence intensity-based metric, it cannot be used to measure absolute Vmem; however, agreement between %ΔF/F and %Δτ/τ is consistent with a PeT-based Vmem sensing mechanism in VFs. To estimate the voltage resolution of VF-FLIM, we analyzed the variability in successive measurements on the same cell (intra-cell resolution) and on different cells (inter-cell resolution, see Materials and methods). We estimate that the resolution for tracking and quantifying voltage changes in a single HEK293T cell is 3.5 ± 0.4 mV (intra-cell resolution, average RMSD from each electrophysiological calibration, Scheme 2), whereas the resolution for single-trial determination of a particular HEK293T cell’s absolute Vmem is 19 mV (inter-cell resolution, RMSD of each calibration slope to the average calibration, Scheme 2) within a 15 s bandwidth.

We compared the performance of VF-FLIM in HEK293T cells to that of two previously documented strategies for optical absolute Vmem determination. We first tested the voltage resolution of CAESR, the best previously reported GEVI for recording absolute Vmem with FLIM (Brinks et al., 2015). Using simultaneous FLIM and voltage-clamp electrophysiology, we determined the relationship between τfl and Vmem for CAESR under one photon excitation (Figure 1—figure supplement 4). We recorded a sensitivity of −1.2 ± 0.1 ps/mV and a 0 mV lifetime of 2.0 ± 0.2 ns, which corresponds to a −6.1 ± 0.8% Δτ/τ per 100 mV (mean ± SEM of 9 measurements), in agreement with the reported sensitivity of −0.9 ps/mV and 0 mV lifetime of 2.7 ns with 2 photon excitation (Brinks et al., 2015). Relative to VF2.1.Cl, CAESR displays 3-fold lower sensitivity (−1.2 ps/mV vs 3.5 ps/mV in HEK293T cells) and 7-fold higher voltage-independent variability in lifetime (0.46 ns vs 0.07 ns, standard deviation of the 0 mV lifetime measurement). For CAESR in HEK293T cells, we calculate a voltage resolution of 33 ± 7 mV for quantifying voltage changes on an individual cell (intra-cell RMSD, compared to 3.5 mV for VF2.1.Cl, see Materials and methods) and resolution of 370 mV for determination of a particular cell’s absolute Vmem (inter-cell RMSD, compared to 19 mV for VF2.1.Cl).

We also measured the absolute voltage resolution of the ratio-based sensor di-8-ANEPPS, which reports membrane potential by the wavelength of its excitation and emission spectra (Loew et al., 1979). Ratio-based imaging can be achieved by comparing the fluorescence emission at different excitation wavelengths (Zhang et al., 1998); here, we used the ratio, R, of the blue-excited emission to the green-excited emission (see Materials and methods). Via simultaneous ratio imaging and whole cell voltage clamp electrophysiology, we record a sensitivity of 0.0039 ± 0.0004 R per mV, with a y-intercept (0 mV) R value of 1.8 ± 0.2 (Figure 1—figure supplement 5; mean ± SEM of n = 16 HEK293T cells). R depends on the excitation and emission conditions used but should be relatively reproducible on a given microscope rig. To compare R from our system with previous work, we normalized all R values to the R value at 0 mV for each cell. Using the above data, we obtain a sensitivity of 0.0022 ± 0.0002 normalized R per mV, with a 0 mV normalized R of 1.02 ± 0.02, in good agreement with reported values (0.0015 normalized R per mV) (Zhang et al., 1998). For analysis of voltage resolution, we compare VF-FLIM to the non-normalized R, since normalization requires an electrode-based measurement for every recording and is thus not a truly optical strategy. From the non-normalized di-8-ANEPPS R, we obtain an intra-cell resolution (RMSD) of 18 ± 3 mV (5-fold less accurate than VF-FLIM) and an inter-cell resolution (RMSD) of 150 mV (8-fold less accurate than VF-FLIM). The sensitivities and resolutions of VF-FLIM, CAESR, and di-8-ANEPPS in HEK293T are tabulated in Figure 1—source data 3. Because cellular resting membrane potentials and voltage changes (e.g. action potentials) are on the order of tens of millivolts, the resolution improvements achieved by VF-FLIM enable biologically relevant absolute Vmem recordings: impossible with previous approaches.

Evaluation of VF-FLIM across cell lines and culture conditions

To test the generalizability of VF-FLIM, we determined τfl-Vmem calibrations in four additional commonly used cell lines: A431, CHO, MDA-MB-231, and MCF-7 (Figure 2, Figure 2—figure supplement 1, Figure 2—figure supplement 2). We observe a linear τfl response in all cell lines tested. The slope (voltage sensitivity) and y-intercept (0 mV lifetime) of the τfl-Vmem response varied slightly across cell lines, with average sensitivities of 3.1 to 3.7 ps/mV and average 0 mV lifetimes ranging from 1.74 to 1.87 ns. In all cell lines, we observed better voltage resolution for quantification of Vmem changes on a given cell versus comparisons of absolute Vmem between cells. Changes in voltage for a given cell could be quantified with resolutions at or better than 5 mV (intra-cell resolution, Materials and methods). For absolute Vmem determination of a single cell, we observed voltage resolutions ranging from 10 to 23 mV (inter-cell resolution, 15 s acquisition time, Figure 2—source data 1). Statistically significant differences among the cell lines tested were observed for cellular τfl-Vmem calibrations in both the slope (One-way ANOVA with Welch’s correction: F(4, 23.07)=18.12, p<0.0001) and average 0 mV lifetime (One-way ANOVA: F(4, 67)=14.43, p<0.0001). There were no statistically significant differences between A431, CHO, and HEK293T cells (p>0.05, Games-Howell and Tukey-Kramer post hoc tests for the slope and 0 mV lifetime respectively). MDA-MB-231 and MCF-7 cells showed statistically significant variability from other cell lines in slope and/or 0 mV lifetime.

Figure 2. VF-FLIM is a general and portable method for optically determining membrane potential.

VF2.1.Cl lifetime-voltage relationships were determined with whole cell voltage clamp electrophysiology in five cell lines. (A) Slopes of the linear fits for single cell lifetime-voltage relationships, shown as mean ± S.E.M. Gray dots indicate results from individual cells. Statistically significant differences exist between groups (One-way ANOVA with Welch’s correction: F(4, 23.07)=18.12, p<0.0001). Data were tested for normality (Shapiro-Wilk test, p>0.05 for all cell lines) and homoscedasticity (Levene’s test on the median, F(4,67) = 5.07, p=0.0013). ** indicates p<0.01; if significance is not indicated, p>0.05 (Games-Howell post hoc test). (B) 0 mV reference point of linear fits for the lifetime-voltage relationship, shown as mean ± S.E.M. Gray dots indicate results from individual cells. Significant differences exist between groups (One-way ANOVA: F(4, 67)=14.43, p<0.0001). Data were tested for normality (Shapiro-Wilk test, p>0.05 for all cell lines) and homoscedasticity (Levene’s test on the median, F(4,67) = 1.29, p=0.28). ** indicates p<0.01; if significance is not indicated, p>0.05 (Tukey-Kramer post hoc test). (C) Representative lifetime-intensity overlay images for each cell line with the indicated cells (white arrow) held at −80 mV (top) or +80 mV (bottom). Lifetime scales are in ns. Scale bar is 20 μm.

Figure 2—source data 1. Lifetime-Vmem standard curves for VF2.1.Cl lifetime in various cell lines.
Whole-cell voltage-clamp electrophysiology was used to determine the relationship between VF2.1.Cl lifetime and membrane potential in five different cell lines. Parameters of this linear model are listed above. The %Δτ/τ is the percent change in the lifetime observed for a voltage step from −60 mV to +40 mV. The intra-cell RMSD represents the accuracy for quantifying voltage changes in a particular cell (see Materials and methods). The inter-cell RMSD represents the expected variability in single-trial absolute Vmem determinations. Sample sizes: A431 12, CHO 8, HEK293T 17, MCF-7 24, MDA-MB-231 11. All values are tabulated as mean ± SEM.
DOI: 10.7554/eLife.44522.018

Figure 2.

Figure 2—figure supplement 1. VoltageFluor lifetime reports voltage in diverse cell lines.

Figure 2—figure supplement 1.

(A) Representative photon count and (B) lifetime images of a VF2.1.Cl in A431 cells with Vmem held at the indicated value with voltage-clamp electrophysiology. A431 cells were not serum starved for these experiments. (C) Quantification of the images in (B), with the line of best fit for this single trial. (D) Lines of best fit for the lifetime-Vmem relationships of 12 A431 cells (gray lines). Average lifetime at each potential is shown as mean ± SEM, with the average line of best fit in black. (E)-(H) Lifetime-Vmem standard curve determination in CHO cells (n = 8). (I)-(L) Lifetime-Vmem standard curve determination in MCF-7 cells (n = 24). (M)-(P) Lifetime-Vmem standard curve determination in MDA-MB-231 cells (n = 11). VF2.1.Cl concentration was 100 nM in all cases. White arrows indicates the voltage-clamped cell. Scale bars are 20 μm..
Figure 2—figure supplement 2. Additional parameters of linear lifetime-voltage standard curves.

Figure 2—figure supplement 2.

(A) Percent change in VF2.1.Cl lifetime per 100 mV change in voltage, relative to the lifetime at −60 mV. Significant differences exist between cell lines (one-way ANOVA with Welch’s correction, F(4,24.08) = 41.75, p<0.0001). Data were tested for normality (Shapiro-Wilk test, p>0.05 for all cell lines) and homoscedasticity (Levene’s test on the median, F(4,67) = 5.74, p=0.00049). Asterisks indicate statistically significant differences (*p<0.05, **p<0.01, Games-Howell post hoc test). (B) Correlation coefficients (r2) for the lines of best fit of VF2.1.Cl lifetime versus membrane potential. No significant differences exist in r2values between cell lines (Kruskal-Wallis test, H = 3.20, 4 degrees of freedom, p=0.53). Data were tested for normality (Shapiro-Wilk test, p<0.05 for 4 of 5 cell lines) and homoscedasticity (Levene’s test on the median, F(4,67) = 1.55, p=0.20). In both (A) and (B), data are shown as mean ± S.E.M., with gray dots indicating values from individual patches.
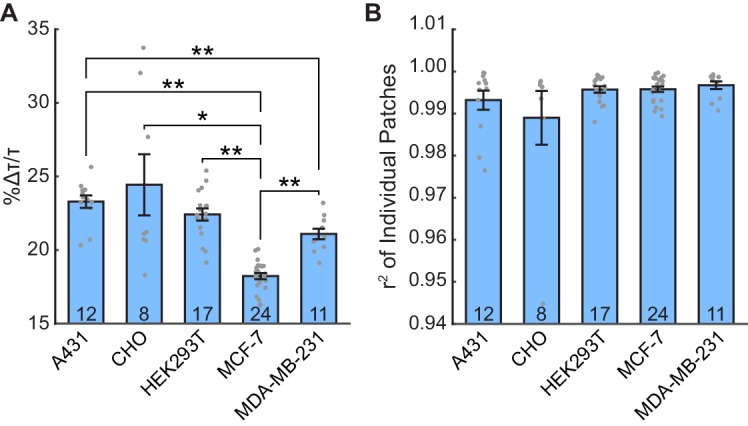
Figure 2—figure supplement 3. Relationship between lifetime and membrane potential extends to groups of cells and across culture conditions.

Figure 2—figure supplement 3.

Electrophysiological calibration of lifetime was performed on small groups of A431 cells and on serum starved (SS) A431 cells to verify that the Vmem-lifetime standard curves for a given cell line are generalizable across many cellular growth conditions. For all graphs, each line represents a group of cells. Letters on the graphs indicate the subfigure where images from that recording are shown. (A) Lifetime-voltage relationships in cell pairs, in which only one cell was directly controlled with voltage-clamp electrophysiology. (B) Lifetime-voltage relationships in groups of three cells, in which only one cell was directly controlled with voltage-clamp electrophysiology. (C) Lifetime for the most responsive cell from pairs and groups of three in (A) and (B). Line color codes are maintained from (A) and (B). (D, E) Representative lifetime images from (A) and (B) respectively. White arrow indicates cell directly controlled with electrophysiology. (F) Lifetime-voltage relationship in SS single cells, (G) pairs, and (H) groups of three cells. (I)-(K) Representative images from (F)-(H). Scale bars are 20 μm.
Figure 2—figure supplement 4. Concentration dependence of VoltageFluor lifetime in four cell lines.

Figure 2—figure supplement 4.

A431 cells were analyzed with VF2.1.Cl both in (A) full serum and (B) serum-starved conditions. (C) VF2.0.Cl in serum-starved A431 cells. (D) VF2.1.Cl in CHO cells. (E) VF2.1.Cl in MCF-7 cells. (F) VF2.1.Cl in MDA-MB-231 cells. All VF2.1.Cl data were fit with a biexponential model, and all VF2.0.Cl data were fit with a monoexponential model. Box plots represent the interquartile range, with whiskers and outliers determined with the Tukey method. Sample sizes indicate number of cell groups. Data were acquired over 2 to 4 different days from a total of 3 or 4 coverslips at each concentration. Asterisks indicate significant differences between the indicated concentration and the VF concentration selected for additional experiments (n.s. p>0.05, *p<0.05, **p<0.01, ***p<0.001, ****p<0.0001, two-sided, unpaired, unequal variances t-test).

To verify that VF-FLIM was robust in groups of cells in addition to the isolated, single cells generally used for patch clamp electrophysiology, we determined lifetime-voltage relationships for small groups of A431 cells (Figure 2—figure supplement 3A–E). We found that calibrations made in small groups of cells are nearly identical to those obtained on individual cells, indicating that VF-FLIM only needs to be calibrated once for a given type of cell. For pairs or groups of three cells we recorded a sensitivity of 3.3 ± 0.2 ps/mV and a 0 mV lifetime of 1.78 ± 0.02 ns (mean ± SEM of 7 cells (5 pairs and 2 groups of 3); values are for the entire group, not just the cell in contact with the electrode), which is similar to the sensitivity of 3.55 ± 0.08 ps/mV and 0 mV lifetime of 1.74 ± 0.02 ns we observe in single A431 cells. The slight reduction in sensitivity seen in cell groups is likely attributable to space clamp error, which prevents complete voltage clamp of the cell group (Williams and Mitchell, 2008; Armstrong and Gilly, 1992). Indeed, when we analyzed only the most responsive cell in the group (in contact with the electrode), we obtained a slope of 3.7 ± 0.1 ps/mV and 0 mV lifetime of 1.79 ± 0.02 ns, in good agreement with the single cell data. The space clamp error can be clearly visualized in Figure 2—figure supplement 3E, where one cell in the group of 3 responded much less to the voltage command.

To test whether VF-FLIM is also extensible to cells maintained with different culture conditions, we recorded lifetime-Vmem relationship in serum-starved A431 cells (Figure 2—figure supplement 3F–K), obtaining an average sensitivity of 3.6 ± 0.1 ps/mV and a 0 mV lifetime of 1.76 ± 0.01 ns (n = 7; two single cells, two pairs, 3 groups of 3 cells; values are average lifetime across the whole cell group), in excellent agreement with the values obtained for non-serum starved cells. We also tested for concentration-dependent changes in VF lifetime in all five cell lines and in serum starvation conditions. Similar to VF2.1.Cl lifetime in HEK293T cells (Figure 1—figure supplement 2), we observed shortening of VF2.1.Cl lifetimes beginning between 200 and 500 nM dye in all cases (Figure 2—figure supplement 4). All subsequent experiments were carried out at VF2.1.Cl concentrations well below the regime where VF concentration-dependent lifetime changes were observed.

Optical determination of resting membrane potential distributions

The throughput of VF-FLIM enables cataloging of resting membrane potentials of thousands of cells in only a few hours of the experimenter’s time. We optically recorded resting membrane potential distributions for A431, CHO, HEK293T, MCF-7, and MDA-MB-231 cells using VF-FLIM (Figure 3, Figure 3—figure supplement 1, Figure 3—figure supplement 2). We report resting membrane potentials by cell group (Materials and methods, Figure 1—figure supplement 1) because adjacent cells in these cultures are electrically coupled to some degree via gap junctions (Meşe et al., 2007). Each group of cells represents an independent sample for Vmem. In addition, the fluorescent signal originating from membranes of adjacent cells cannot be separated with a conventional optical microscope, so assignment of a region of membrane connecting multiple cells would be arbitrary. VF-FLIM images (Figure 3, Figure 3—figure supplement 1, Figure 3—figure supplement 2) contain spatially resolved voltage information, but caution should be employed in interpreting pixel to pixel differences in lifetime. Because VF-FLIM was calibrated here using the average plasma membrane τfl for each cell, optical Vmem should be interpreted per cell or cell group.

Figure 3. Rapid optical profiling of Vmem at rest and in high extracellular K+.

Fluorescence lifetime images of cells incubated with 100 nM VF2.1.Cl were used to determine Vmem from previously performed electrophysiological calibration (Figure 2). (A) Histograms of Vmem values recorded in A431 cells incubated with 6 mM extracellular K+ (commercial HBSS, n = 1056) or 120 mM K+ (high K+ HBSS, n = 368). (B) Representative lifetime image of A431 cells in 6 mM extracellular K+. (C) Representative lifetime image of A431 cells in 120 mM extracellular K+. (D) Histograms of Vmem values observed in CHO cells under normal (n = 2410) and high K+ (n = 1310) conditions. Representative lifetime image of CHO cells in (E) 6 mM and (F) 120 mM extracellular K+. Histogram bin sizes were determined by the Freedman-Diaconis rule. Intensities in the lifetime-intensity overlay images are not scaled to each other. Scale bars, 20 μm.

Figure 3—source data 1. Vmem measurements made with VF-FLIM agree with previously reported values.
Comparison of optically-determined resting membrane potential values (in millivolts) and previously reported values. This table summarizes data presented in Figure 3 and Figure 3—figure supplement 1. Optically determined membrane potentials were calculated from lifetime-Vmem standard curves (Figure 2—source data 1). For tabulated literature values, measures of error and central tendency were used from the original publication. In some cases, none were given or only ranges were discussed. The mean of the reported ephys values is the mean of the values listed here. Sample sizes for resting and elevated K+, respectively: A431 1056, 368; CHO 2410, 1310; HEK293T 1613, 520; MCF-7 1259, 681; MDA-MB-231 1840, 558.
DOI: 10.7554/eLife.44522.022

Figure 3.

Figure 3—figure supplement 1. Optically recorded Vmem distributions in HEK293T, MCF-7 and MDA-MB-231 cells.

Figure 3—figure supplement 1.

Fluorescence lifetime images of cells incubated with 100 nM VF2.1.Cl were used to determine Vmem from previously performed electrophysiological calibration (Figure 2). (A) Histograms of Vmem values recorded in HEK293T cells incubated with 6 mM extracellular K+ (commercial HBSS, n = 1613) or 120 mM K+ (high K+ HBSS, n = 520). (B) Representative lifetime image of HEK293T cells with 6 mM extracellular K+. (C) Representative lifetime image of HEK293T cells in 120 mM extracellular K+. (D) Histograms of Vmem values observed in MCF-7 cells under normal (n = 1259) and high K+ (n = 681) conditions. Representative lifetime images of MCF-7 cells in (E) 6 mM and (F) 120 mM extracellular K+. (G) Histograms of Vmem values observed in MDA-MB-231 cells under normal (n = 1840) and high K+ (n = 558) conditions. Representative lifetime images of MDA-MB-231 cells in (H) 6 mM and (I) 120 mM extracellular K+. Histogram bin sizes were determined by the Freedman-Diaconis rule. Intensities in the lifetime-intensity overlay images are not scaled to each other. Scale bars, 20 μm.
Figure 3—figure supplement 2. Representative images of cultured cell resting membrane potential.

Figure 3—figure supplement 2.

Representative VF-FLIM images of cells in standard imaging buffer (HBSS, 6 mM extracellular K+) and high K+ imaging buffer (high K+ HBSS, 120 mM extracellular K+). Membrane potential was calculated per cell group; analyses of pixel by pixel differences in lifetime fall beyond the resolution limit of the VF-FLIM calibrations in this work. Images depict A431 cells in (A) HBSS and (B) high K+ HBSS, CHO cells in (C) HBSS and (D) high K+ HBSS, HEK293T cells in (E) HBSS and (F) high K+ HBSS, MCF-7 cells in (G) HBSS and (H) high K+ HBSS, and MDA-MB-231 cells in (I) HBSS and (J) high K+ HBSS.

Mean resting membrane potentials recorded by VF-FLIM range from −53 to −29 mV, depending on the cell line. These average Vmem values fall within the range reported in the literature for all of the cell lines we measured (Figure 3—source data 1). We also recorded resting membrane potentials in a high K+ buffer (120 mM K+, ‘high K+ HBSS’), where we observed a depolarization of 15 to 41 mV, bringing the mean Vmem up to −26 mV to +4 mV, again depending on the cell line. Although 120 mM extracellular K+ should be strongly depolarizing, it will not necessarily produce a membrane potential of 0 mV. Because few literature reports of electrophysiological measurements in 120 mM K+ exist as a point of comparison, we obtained a rough estimate of Vmem in 6 mM extracellular K+ and 120 mM extracellular K+ using the Goldman-Hodgkin-Katz (GHK) equation (Hodgkin and Katz, 1949). Under our imaging conditions and with a broad range of possible ion permeabilities and intracellular ion concentrations, the GHK equation allows Vmem ranging from −91 to −27 mV in 6 mM extracellular K+ and −25 to +2 mV in 120 mM extracellular K+ (see Materials and methods). Recorded VF-FLIM values fall well within this allowed range. Notably, although the GHK equation can determine ranges of reasonable Vmem values, GHK-based Vmem results are approximate at best because of the difficulty in obtaining accurate values of permeabilities and intracellular ion concentrations for specific cell lines. Direct measurement of Vmem, rather than theoretical calculation, is required to obtain accurate values.

Membrane potential dynamics in epidermal growth factor signaling

We thought VF-FLIM was a promising method for elucidating the roles of membrane potential in non-excitable cell signaling. Specifically, we wondered whether VF-FLIM might be well-suited to dissect conflicting reports surrounding changes in membrane potential during EGF/EGF receptor (EGFR)-mediated signaling. Receptor tyrosine kinase (RTK)-mediated signaling is a canonical signaling paradigm for eukaryotic cells, transducing extracellular signals into changes in cellular state. Although the involvement of second messengers like Ca2+, cyclic nucleotides, and lipids are well characterized, membrane potential dynamics and their associated roles in non-excitable cell signaling remain less well-defined. In particular, the activation of EGFR via EGF has variously been reported to be depolarizing (Rothenberg et al., 1982), hyperpolarizing (Pandiella et al., 1989), or electrically silent (Moolenaar et al., 1982; Moolenaar et al., 1986).

We find that treatment of A431 cells with EGF results in a 15 mV hyperpolarization within 60–90 s in approximately 80% of cells (Figure 4A–C, Figure 4—figure supplement 1, Figure 4—figure supplement 2), followed by a slow return to baseline within 15 min (Figure 4D–F, Figure 4—figure supplements 3 and 0 second acquisitions). The voltage response to EGF is dose-dependent, with an EC50 of 90 ng/mL (14 nM) (Figure 4—figure supplement 4). Vehicle-treated cells show very little τfl change (Figure 4A–F). Identical experiments with voltage-insensitive VF2.0.Cl (Figure 4G–H, Figure 4—figure supplement 1, Figure 4—figure supplement 3, Figure 4—figure supplement 5) reveal little change in τfl upon EGF treatment, indicating the drop in τfl arises from membrane hyperpolarization. We observe the greatest hyperpolarization 1 to 3 min after treatment with EGF, which is abolished by inhibition of EGFR and ErbB2 tyrosine kinase activity with the covalent inhibitor canertinib (Figure 4I–J, Figure 4—figure supplement 6). Blockade of the EGFR kinase domain with gefitinib, a non-covalent inhibitor of EGFR, also results in a substantial decrease in the EGF-evoked hyperpolarization (Figure 4I–J, Figure 4—figure supplement 6). Together, these results indicate that A431 cells exhibit an EGF-induced hyperpolarization, which depends on the kinase activity of EGFR and persists on the timescale of minutes.

Figure 4. EGFR-mediated receptor tyrosine kinase activity produces a transient hyperpolarization in A431 cells.

(A) Representative VF-FLIM time series of A431 cells treated with imaging buffer vehicle (top) or 500 ng/mL EGF (80 nM, bottom). (B) Quantification of images in (A), with Vehicle (Veh.)/EGF added at black arrow. (C) Aggregated responses for various trials of cells treated with vehicle or EGF. (D) Lifetime images of longer-term effects of vehicle (top) or EGF (bottom) treatment. (E) Quantification of images in (D). (F) Average response of cells over the longer time course. (G) Images of VF2.0.Cl (voltage insensitive) lifetime before and after EGF treatment. No τfl change is observed 2.5 (top) or 15 min (bottom) following EGF treatment. (H) Average VF2.0.Cl lifetime changes following EGF treatment. VF2.0.Cl graphs and images are scaled across the same lifetime range (350 ps) as VF2.1.Cl plots and images. The small drift observed would correspond to 2–4 mV of voltage change in VF2.1.Cl lifetime. (I) Lifetime images of A431 cells before and after EGF addition, with 500 nM canertinib (top) or 10 μM gefitinib (bottom). (J) Voltage changes 2.5 min after EGF addition in cells treated with DMSO (vehicle control) or an EGFR inhibitor. Scale bars are 20 μm. (C,F,H): Asterisks indicate significant differences between vehicle and EGF at that time point. (J): Asterisks reflect significant differences between EGF-induced voltage responses with DMSO vehicle or an EGFR inhibitor (n.s. p>0.05, *p<0.05, **p<0.01, ***p<0.001, ****p<0.0001, two-tailed, unpaired, unequal variances t-test).

Figure 4.

Figure 4—figure supplement 1. Individual VF-FLIM recordings of A431 EGF response.

Figure 4—figure supplement 1.

(A) Representative 3 min VF-FLIM recordings of A431 cells loaded with 50 nM VF2.1.Cl. 500 ng/mL EGF was added 30 s into the time series (black arrow). (B) Quantification of the images in (A), with a single trace per image series shown. (C) Average voltage change in A431 cells following the addition of imaging buffer vehicle (gray) or EGF (purple). (D) Control VF2.0.Cl (not voltage sensitive, 50 nM) images of A431 cells treated as in (A). Images are scaled across the same amount of lifetime space (350 ps) as the VF2.1.Cl images. (E) Quantification of the images in (D). (F) Average VF2.0.Cl lifetime change seen in A431 cells following the addition of imaging buffer vehicle (gray) or EGF (purple) in A431 cells. Graph is scaled across the same amount of lifetime space as the VF2.1.Cl data in (C). Asterisks indicate significant differences between vehicle and EGF treated cells at a given time point (n.s. p>0.05, *p<0.05, **p<0.01, ***p<0.001, ****p<0.0001, two-sided, unpaired, unequal variances t-test). Scale bars are 20 μm.
Figure 4—figure supplement 2. Membrane potential changes in A431 cells 2.5 min after EGF treatment.

Figure 4—figure supplement 2.

Comparison of Vmem changes observed in A431 cells 2.5 min after treatment with (A) imaging buffer vehicle or (B) 500 ng/mL EGF. Data shown here are compiled from Figure 4C and Figure 5A to provide a sense of overall distribution of the responses. Each recording contained a single group of approximately 5 to 10 cells. Sample sizes (number of recordings): Vehicle 93, EGF 92.
Figure 4—figure supplement 3. VF-FLIM reports A431 Vmem changes over 15 min.

Figure 4—figure supplement 3.

(A) Representative longer term VF-FLIM recordings of A431 cells loaded with 50 nM VF2.1.Cl. 500 ng/mL EGF was added 30 s into the time series. (B) Quantification of the images in (A), with a single trace per image series shown. (C) Control VF2.0.Cl (not voltage sensitive, 50 nM) images of A431 cells treated as in (A). Images are scaled across the same total lifetime range (350 ps) as the VF2.1.Cl images. (D) Quantification of the recordings in (C). (E) Average VF2.0.Cl lifetime change seen in A431 cells following the addition of imaging buffer vehicle (gray) or EGF (purple). Asterisks indicate significant differences between vehicle and EGF treated cells at a given time point (***p<0.001, ****p<0.0001, two-sided, unpaired, unequal variances t-test). Scale bars are 20 μm.
Figure 4—figure supplement 4. Dose-response relationship of A431 voltage response to EGF.

Figure 4—figure supplement 4.

Data were fit to a four-parameter logistic function to obtain an EC50 of 90 ng/mL (95% CI: 47–130 ng/mL). Response to each EGF concentration is shown as mean ± SEM of 6 or 7 recordings (one group of 5–10 cells per recording).
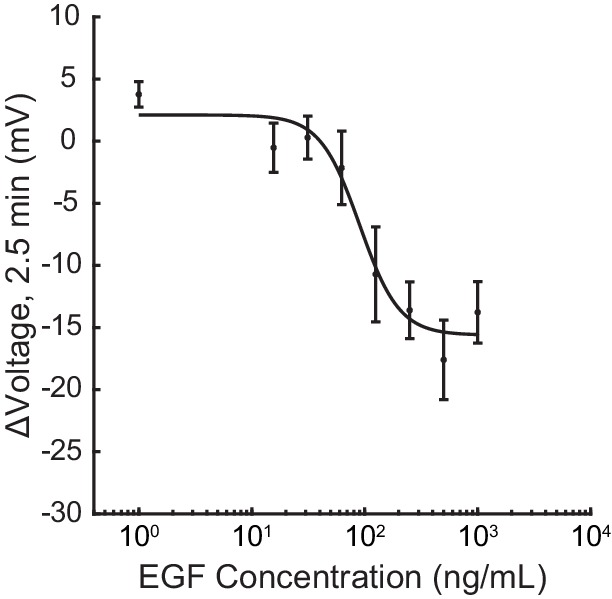
Figure 4—figure supplement 5. Effect sizes of VF2.1.Cl and VF2.0.Cl response to EGF treatment.

Figure 4—figure supplement 5.

Average lifetime changes observed in A431 cells following the addition (black arrow) of imaging buffer vehicle (gray) or 500 ng/mL EGF (purple). (A) Cells incubated with 50 nM VF2.1.Cl and imaged for 3 min. (B) Cells incubated with 50 nM VF2.0.Cl (not voltage sensitive) and imaged for 3 min. (C) Cells incubated with 50 nM VF2.1.Cl and imaged intermittently for 15 min. (D) Cells incubated with 50 nM VF2.0.Cl (not voltage sensitive) and imaged intermittently for 15 min. Data are reproduced from Figure 4, Figure 4—figure supplement 1, and Figure 4—figure supplement 3, but here data are scaled in units of lifetime rather than voltage for facile comparison. Data are shown as mean ± SEM for the indicated number of recordings (one group of 5–10 cells per recording). Asterisks indicate significant differences between vehicle and EGF treated cells at a given time point (n.s. p>0.05, *p<0.05, **p<0.01, ***p<0.001, ****p<0.0001, two-sided, unpaired, unequal variances t-test).
Figure 4—figure supplement 6. EGFR inhibitors abolish voltage response to EGF in A431 cells.

Figure 4—figure supplement 6.

Average Vmem changes following the addition (black arrow) of imaging buffer vehicle (gray) or 500 ng/mL EGF (purple) to A431 cells pre-treated with the indicated drug or DMSO vehicle. 2.5 min time points from this data are shown elsewhere (Figure 4J); entire time series are shown here. Data are presented as mean ± SEM for the indicated number of recordings (one group of 5–10 cells per recording). Asterisks indicate significant differences between vehicle and EGF treated cells at a given time point (n.s. p>0.05, *p<0.05, **p<0.01, ***p<0.001, ****p<0.0001, two-sided, unpaired, unequal variances t-test).

Outward K+ currents could mediate EGF-induced hyperpolarization. Consistent with this hypothesis, dissipation of the K+ driving force by raising extracellular [K+] completely abolishes the typical hyperpolarizing response to EGF and instead results in a small depolarizing potential of approximately 3 mV (Figure 5A, Figure 5—figure supplement 1B). Blockade of voltage-gated K+ channels (Kv) with 4-aminopyridine (4-AP) prior to EGF treatment enhances the hyperpolarizing response to EGF (Figure 5A and B, Figure 5—figure supplement 1C). In contrast, blockade of Ca2+-activated K+ channels (KCa) with charybdotoxin (CTX) results in a depolarizing potential of approximately 4 mV after exposure to EGF, similar to that observed with high extracellular [K+] (Figure 5A and B, Figure 5—figure supplement 1D). TRAM-34, a specific inhibitor of the intermediate-conductance Ca2+ activated potassium channel KCa3.1 (Wulff et al., 2000), also abolishes EGF-induced hyperpolarization (Figure 5A, Figure 5—figure supplement 1E). CTX treatment has little effect on the resting membrane potential, while TRAM-34 or 4-AP depolarizes cells by approximately 5–10 mV (Figure 5—figure supplement 2).

Figure 5. EGF-induced hyperpolarization is mediated by a Ca2+ activated K+ channel.

(A) Comparison of the Vmem change 2.5 min after EGF addition in cells incubated in unmodified imaging buffer (HBSS) or in modified solutions. (B) Lifetime images of A431 cells treated with 4-AP or CTX. (C) Model for membrane hyperpolarization following EGFR activation. Scale bar is 20 μm. Bars are mean ± SEM. Sample sizes listed are (Veh, EGF); where only one number is given, sample size was the same for both. Asterisks reflect significant differences in EGF-stimulated Vmem change between the unmodified control (HBSS or DMSO) and modified solutions (n.s. p>0.05, *p<0.05, **p<0.01, ***p<0.001, ****p<0.0001, two-tailed, unpaired, unequal variances t-test). DMSO: 0.1% DMSO, high K+: 120 mM K+, 4-AP: 5 mM 4-aminopyridine, CTX: 100 nM charybdotoxin, TRAM-34: 200 nM TRAM-34, Ca2+ free: 0 mM Ca2+ and Mg2+, BAPTA-AM: 10 μM bisaminophenoxyethanetetraacetic acid acetoxymethyl ester, Na3VO4: 100 μM sodium orthovanadate, wortmannin: 1 μM wortmannin.

Figure 5.

Figure 5—figure supplement 1. A431 voltage response to EGF with pharmacological intervention.

Figure 5—figure supplement 1.

Average Vmem changes following the addition (black arrow) of imaging buffer vehicle (gray) or 500 ng/mL EGF (purple) to A431 cells pre-treated with the indicated drug or ionic composition change. 2.5 min time points from this data are shown elsewhere (Figure 5); entire time series are shown here to illustrate the time courses of the large hyperpolarizing current and small depolarizing current. Data are shown as mean ± SEM for the indicated number of recordings (one group of 5–10 cells per recording). Asterisks indicate significant differences between vehicle and EGF treated cells at a given time point (n.s. p>0.05, *p<0.05, **p<0.01, ***p<0.001, ****p<0.0001, two-sided, unpaired, unequal variances t-test).
Figure 5—figure supplement 2. Effects of pharmacological and ionic perturbations on A431 resting membrane potential.

Figure 5—figure supplement 2.

Data are the initial Vmem reference images for recordings used in EGF addition time series. Data are shown as mean ± SEM for the indicated number of images (one group of 5–10 cells per image), and gray dots represent individual images. Asterisks indicate significant differences between the appropriate vehicle (HBSS or 0.1% DMSO) and pharmacology treated cells (n.s. p>0.05, *p<0.05, **p<0.01, ***p<0.001, ****p<0.0001, two-sided, unpaired, unequal variances t-test). CTX = charybdotoxin, 4-AP = 4-aminopyridine, BAPTA-AM = bisaminophenoxyethanetetraacetic acid acetoxymethyl ester.

To explore the effects of other components of the EGFR pathway on EGF-induced hyperpolarization, we perturbed intra- and extracellular Ca2+ concentrations during EGF stimulation. Reduction of extracellular Ca2+ concentration did not substantially alter the EGF response (Figure 5A, Figure 5—figure supplement 1F). However, sequestration of intracellular Ca2+ with BAPTA-AM disrupts the hyperpolarization response. BAPTA-AM treated cells show a small, 4 mV depolarization in response to EGF treatment, similar to CTX-treated cells (Figure 5A, Figure 5—figure supplement 1G). Perturbation of Ca2+ levels had little effect on the resting membrane potential (Figure 5—figure supplement 2). Introduction of wortmannin (1 μM) to block downstream kinase activity has no effect on the membrane potential response to EGF, while orthovanadate addition (Na3VO4, 100 μM) to block phosphatase activity results in a small increase in the hyperpolarizing response (Figure 5A, Figure 5—figure supplement 1H–I). These results support a model for EGF-EGFR mediated hyperpolarization in which RTK activity of EGFR causes release of internal Ca2+ stores to in turn open KCa channels and hyperpolarize the cell (Figure 5C).

Discussion

We report the design and implementation of a new method for optically quantifying absolute membrane potential in living cells. VF-FLIM enjoys 100-fold improved throughput over patch clamp electrophysiology, as well as improved spatial resolution. The performance of VF-FLIM hinges on a balance between resolution in three dimensions: membrane potential, space, and time. We discuss the advantages and disadvantages of VF-FLIM in this light, as well as the new application space that is made accessible by VF-FLIM.

Resolution of VF-FLIM: voltage, space, and time

The key advantage of VF-FLIM over previously reported optical approaches is its superior Vmem resolution. Resolution can be interpreted as stability of the τfl-Vmem calibration over time and between cells. Any factors other than Vmem that change τfl decrease resolution. VF-FLIM exhibits a 19-fold improvement in inter-cell Vmem resolution over FLIM with the GEVI CAESR (Brinks et al., 2015) and a 8-fold improvement over di-8-ANEPPS excitation ratios (Zhang et al., 1998). Although all optical strategies, including VF-FLIM, have worse Vmem resolution than modern electrophysiology, the greater throughput, improved spatial resolution, and reduced invasiveness of optical strategies make them a powerful complement to electrode-based recordings.

The sources of variability that reduce resolution of optical Vmem measurements are manifold, but two major contributors are membrane specificity of the stain and the complexity of the lipid environment. Nonspecific staining is fluorescence signal from anywhere other than the plasma membrane, such as contaminating intracellular staining from poorly trafficked (CAESR) or internalized (ANEPPS) sensor. In contrast, exogenously loaded VF2.1.Cl exhibits little fluorescence contribution from regions other than the plasma membrane. Secondly, membrane composition and dipole potential can vary between cells and cell lines, changing the local environment of the fluorescent indicator (Wang, 2012; Brügger, 2014). Styryl dyes like di-8-ANEPPS can respond to changes in dipole potential (Zhang et al., 1998; Gross et al., 1994), and VF dyes may be similarly sensitive to dipole potential. Additionally, fluorescence lifetime depends on certain environmental factors (e.g. temperature, viscosity, ionic strength) (Berezin and Achilefu, 2010), which may introduce variability. These parameters are usually determined by the biological system under study, and re-calibration is important if they change dramatically in an experiment.

VF-FLIM, like all optical approaches, improves upon the spatial resolution of patch clamp electrophysiology. While VF-FLIM records the Vmem of an optically defined region of interest (in this study a cell or cell group), electrophysiology records Vmem at an individual cell or part of a cell where the electrode makes contact, which may or may not reflect the Vmem of the entire cell or group. In this study, we interpret VF-FLIM at the whole cell level only, since that is the smallest unit in which the Vmem can be reliably calibrated by whole cell patch clamp electrophysiology. Intriguingly, there are differences in lifetime within some cells in VF-FLIM images at the pixel to pixel level. In small, mostly spherical cells under voltage clamp, one would expect uniform membrane potential (Armstrong and Gilly, 1992), so these subcellular differences are most likely noise in the measurement. We speculate that most of this pixel-to-pixel noise comes from variability in fitting the biexponential lifetime model. Lifetime estimates at each pixel are calculated from 20 to 100-fold fewer photons than the lifetime value for the entire ROI. These lower photon counts at the single pixel level produce Vmem estimates that are less precise than the Vmem estimate for the entire ROI. Collection of more photons at each pixel could likely reduce this noise but would require longer acquisition times. We also cannot fully rule out an alternative explanation that the observed subcellular variability is the result of local differences in membrane composition (Gross et al., 1994).

Vmem recordings in systems too large or too small for electrophysiological study could be an important application of VF-FLIM. Despite the improbability of Vmem compartmentalization in individual HEK293T cells, other cells with complex morphology and processes may display real, subcellular Vmem differences. In addition, delocalized Vmem patterns across tissues could in theory be stable (Cervera et al., 2016a) and have been proposed to contribute to tissue development (Levin, 2014). One remaining challenge in expanding VF-FLIM to these areas is the requirement for an initial calibration with voltage clamp electrophysiology. Alternative ways to control Vmem, such as ionophores or optogenetic actuators (Berndt et al., 2009), may prove useful in these systems. When applying VF-FLIM to tissues, the cellular specificity of the VF stain becomes a consideration, as the VF2.1.Cl indicator used in this study labels all cell membranes efficiently. Looking ahead, recordings in tissue are an exciting area for future development of VF-FLIM, particularly in conjunction with cellular and sub-cellular strategies for targeting VF dyes (Liu et al., 2017; Grenier et al., 2019).

To obtain absolute Vmem measurements with fluorescence lifetime, VF-FLIM sacrifices some of the temporal resolution of electrophysiology or intensity-based voltage imaging. VF-FLIM acquisition times are limited by the large numbers of photons needed per pixel in time-correlated single photon counting (see Materials and methods). As a result, VF-FLIM in its current implementation can track Vmem events lasting longer than a few seconds. For ‘resting’ membrane potential or Vmem dynamics associated with cell growth or differentiation, this temporal resolution is likely sufficient. Nevertheless, in the future, we envision allying VF-FLIM with recently developed, faster lifetime imaging technology to enable optical quantification of more rapid Vmem responses (Raspe et al., 2015; Gao et al., 2014).

Resting membrane potential distributions in cultured cells

Using the improved Vmem resolution and throughput of VF-FLIM, we optically documented resting membrane potential distributions in cultured cells to characterize the membrane potential state(s) present. The presence and significance of distinct Vmem states in cell populations is mostly uncharacterized due to the throughput limitations of patch-clamp electrophysiology, but some reports suggest that distinct Vmem states arise during the various phases of the cell cycle (Ouadid-Ahidouch et al., 2001; Wonderlin et al., 1995). Vmem histograms presented in this work appear more or less unimodal, showing no clear sign of cell cycle-related Vmem states (Figure 3A,D; Figure 3—figure supplement 1A,D,G). We considered the possibility that VF-FLIM does not detect cell-cycle-related Vmem states because we report average Vmem across cell groups in cases where cells are in contact (Figure 1—figure supplement 1). This explanation is unlikely for two reasons. First, Vmem distributions for CHO cells appear unimodal, even though CHO cultures were mostly comprised of isolated cells under the conditions tested (Figure 3D–F). Second, theoretical work suggests that dramatically different Vmem states in adjacent cells are unlikely, as electrical coupling often leads to equilibration of Vmem across the cell group (Cervera et al., 2016a; Cervera et al., 2016b). Although we cannot rule out the possibility of poorly separated Vmem populations (i.e. with a mean difference in voltage below our resolution limit), VF-FLIM both prompts and enables a re-examination of the notion that bi- or multimodal Vmem distributions exist in cultured cells. Furthermore, VF-FLIM represents an exciting opportunity to experimentally visualize theorized Vmem patterns in culture and in more complex tissues. Studies towards this end are ongoing in our laboratory.

Epidermal growth factor induces Vmem signaling in A431 cells

In the present study, we use VF-FLIM to provide the first cell-resolved, direct visualization of voltage changes induced by growth factor signaling. For long term Vmem recordings during growth-related processes, an optical approach is more attractive than an electrode-based one. Electrophysiology becomes increasingly challenging as time scale lengthens, especially if cells migrate, and washout of the cytosol with pipette solution can change the very signals under study (Horn and Korn, 1992; Malinow and Tsien, 1990). Previous attempts to electrophysiologically record Vmem in EGF-stimulated A431 cells were unsuccessful due to these technical challenges (Pandiella et al., 1989). Because whole cell voltage-clamp electrophysiology was intractable, the Vmem response in EGF-stimulated A431 cells was addressed indirectly through model cell lines expressing EGFR exogenously (Pandiella et al., 1989), bulk measurements on trypsinized cells in suspension (Magni et al., 1991), or cell-attached single channel recordings (Peppelenbosch et al., 1991; Lückhoff and Clapham, 1994; Mozhayeva et al., 1989). By stably recording Vmem during EGF stimulation, VF-FLIM enables direct study of Vmem signaling in otherwise inaccessible pathways.

In conjunction with physiological manipulations and pharmacological perturbations, we explore the molecular mechanisms underlying EGF-induced hyperpolarization. We find that signaling along the EGF-EGFR axis results in a robust hyperpolarizing current carried by K+ ions, passed by the Ca2+-activated K+ channel KCa3.1, and mediated by intracellular Ca2+ (Figure 5C). We achieve a complete loss of the hyperpolarizing response to EGF by altering the K+ driving force (‘High K+Figure 5A, Figure 5—figure supplement 1B), blocking calcium-activated K+ currents directly (‘CTX’ and ‘TRAM-34’, Figure 5A, Figure 5—figure supplement 1D,E), or intercepting cytosolic Ca2+ (‘BAPTA-AM’, Figure 5A, Figure 5—figure supplement 1G). These results, combined with transcriptomic evidence that KCa3.1 is the major KCa channel in A431 cells (Thul et al., 2017), indicate that KCa3.1 mediates the observed hyperpolarization. Interestingly, under some conditions where K+-mediated hyperpolarization is blocked (‘CTX,’ ‘high K+', ‘BAPTA-AM’), VF-FLIM reveals a small, secondary depolarizing current not visible during normal EGF stimulation. This current likely arises from initial Ca2+ entry into the cell, as previously observed during EGF signaling (Pandiella et al., 1987; Marquèze-Pouey et al., 2014). Although we have obtained direct and conclusive evidence of EGF-induced hyperpolarization in A431 cells, the interactions between this voltage change and downstream targets of EGFR remain incompletely characterized. Enhancing EGF signaling by blockade of cellular tyrosine phosphatases with orthovanadate (Reddy et al., 2016) correspondingly increases EGF-mediated hyperpolarization (‘Na3VO4Figure 5A, Figure 5—figure supplement 1H), but inhibition of downstream kinase activity appears to have little effect on hyperpolarization (‘wortmannin’ Figure 5A, Figure 5—figure supplement 1I).

In the context of RTK signaling, Vmem may serve to modulate the driving force for external Ca2+ entry (Huang and Jan, 2014; Yang and Brackenbury, 2013) and thereby act as a regulator of this canonical signaling ion. Alternatively, Vmem may play a more subtle biophysical role, such as potentiating lipid reorganization in the plasma membrane (Zhou et al., 2015). Small changes in Vmem likely affect signaling pathways in ways that are currently completely unknown, but high throughput discovery of Vmem targets remains challenging. Combination of electrophysiology with single cell transcriptomics has begun to uncover relationships between Vmem and other cellular pathways in excitable cells (Cadwell et al., 2016); such approaches could be coupled to higher throughput VF-FLIM methods to explore pathways that interact with Vmem in non-excitable contexts.

VF-FLIM represents a novel and general approach for interrogating the roles of membrane potential in fundamental cellular physiology. Future improvements to the voltage resolution could be made by use of more sensitive indicators, which may exhibit larger changes in fluorescence lifetime (Woodford et al., 2015). VF-FLIM can be further expanded to include the entire color palette of PeT-based voltage indicators (Huang et al., 2015; Deal et al., 2016), allied with targeting methods to probe absolute membrane potential in heterogeneous cellular populations (Liu et al., 2017; Grenier et al., 2019), and coupled to high-speed imaging techniques for optical quantification of fast voltage events (Raspe et al., 2015; Gao et al., 2014).

Materials and methods

Key resources table.

Reagent type (species)
or resource
Designation Source or
reference
Identifiers Additional information
Cell line (Homo sapiens, female) A431 UC Berkeley Cell Culture Facility RRID:CVCL_0037 Cell line maintained in E. Miller lab
Cell line (Homo sapiens, female) HEK293T UC Berkeley Cell Culture Facility RRID:CVCL_0063 Cell line maintained in E. Miller lab
Cell line (Homo sapiens, female) MCF-7 UC Berkeley Cell Culture Facility RRID:CVCL_0031 Cell line maintained in E. Miller lab
Cell line (Homo sapiens, female) MDA-MB-231 UC Berkeley Cell Culture Facility RRID:CVCL_0062 Cell line maintained in E. Miller lab
Cell line (Cricetulus griseus, female) CHO UC Berkeley Cell Culture Facility RRID:CVCL_0214 Cell line maintained in E. Miller lab
Recombinant DNA reagent CAESR, FCK-QuasAR2-Citrine Addgene, PMID: 25118186 Addgene:59172,
RRID:Addgene_59172
Developed by Adam Cohen, Harvard University
Peptide, recombinant protein Recombinant human epidermal growth factor (EGF) PeproTech Cat#:AF10015500UG
Commercial assay or kit Lipofectamine 3000 Thermo Fisher Scientific Cat#:L3000008
Commercial assay or kit QIAprep spin miniprep kit VWR International Cat#:27106
Chemical compound, drug Sodium orthovanadate Sigma-Aldrich CAS:13721-39-6, Cat#:S6508 Activated before use (Gordon, 1991)
Chemical compound, drug Canertinib other CAS:267243-28-7 Gift from John Kuriyan, UC Berkeley
Chemical compound, drug Gefitinib Fisher Scientific CAS:184475-35-2, Cat#:50-101-6270
Chemical compound, drug 4-aminopyridine, 4-AP Sigma-Aldrich CAS:504-24-5, Cat#:A78403
Chemical compound, drug Charybdotoxin, CTX Sigma-Aldrich CAS:95751-30-7, Cat#:C7802
Chemical compound, drug TRAM-34 Sigma-Aldrich CAS:289905-88-0, Cat#:T6700
Chemical compound, drug BAPTA-AM, bisamino-phenoxy-ethanetetra-acetic acid acetoxymethyl ester Fisher Scientific CAS:126150-97-8, Cat#:50-101-0334
Chemical compound, drug wortmannin Fisher Scientific CAS:19545-26-7, Cat#:ICN19569001
Software, algorithm SPCM Becker and Hickl
Other Di-8-ANEPPS Thermo Fisher Scientific CAS:157134-53-7, Cat#:D3167
Other VF2.1.Cl Synthesized in-house (Woodford et al., 2015)
Other VF2.0.Cl Synthesized in-house (Woodford et al., 2015)

VoltageFluor (VF) dyes VF2.1.Cl and VF2.0.Cl were synthesized in house according to previously described syntheses (Woodford et al., 2015). VFs were stored either as solids at room temperature or as 1000x DMSO stocks at −20°C. VF stock concentrations were normalized to the absorption of the dichlorofluorescein dye head via UV-Vis spectroscopy in Dulbecco’s phosphate buffered saline (dPBS, Thermo Fisher Scientific, Waltham, MA) pH 9 with 0.1% sodium dodecyl sulfate (w/v, SDS). Di-8-ANEPPS was purchased from Thermo Fisher Scientific. Di-8-ANEPPS was prepared as a 2 mM (2000x) stock solution in DMSO and stored at −20°C. Di-8-ANEPPS concentrations were determined via UV-Vis spectroscopy in methanol (ε at 498 nm: 41,000 cm−1 M−1 according to the manufacturer’s certificate of analysis).

All salts and buffers were purchased from either Sigma-Aldrich (St. Louis, MO) or Fisher Scientific. TRAM-34, 4-aminopyridine, and charybdotoxin were purchased from Sigma-Aldrich. Gefitinib, wortmannin, sodium orthovanadate, and BAPTA-AM were purchased from Fisher Scientific. Canertinib was a gift from the Kuriyan laboratory at UC Berkeley. Gefitinib, wortmannin, canertinib, and TRAM-34 were made up as 1000x-10000x stock solutions in DMSO and stored at −20°C. Charybdotoxin was made up as a 1000x solution in water and stored at −80°C. 4-aminopyridine was made up as a 20x stock in imaging buffer (HBSS) and stored at 4°C. Recombinantly expressed epidermal growth factor was purchased from PeproTech (Rocky Hill, NJ) and aliquoted as a 1 mg/mL solution in water at −80°C.

Solid sodium orthovanadate was dissolved in water and activated before use (Gordon, 1991). Briefly, orthovanadate solutions were repeatedly boiled and adjusted to pH 10 until the solution was clear and colorless. 200 mM activated orthovanadate stocks were aliquoted and stored at −20°C.

Unless otherwise noted, all imaging experiments were performed in Hank’s Balanced Salt Solution (HBSS; Gibco/Thermo Fisher Scientific). HBSS composition in mM: 137.9 NaCl, 5.3 KCl, 5.6 D-glucose, 4.2 NaHCO3, 1.3 CaCl2, 0.49 MgCl2, 0.44 KH2PO4, 0.41 MgSO4, 0.34 Na2HPO4. High K+ HBSS was made in-house to 285 mOsmol and pH 7.3, containing (in mM): 120 KCl, 23.3 NaCl, 5.6 D-glucose, 4.2 NaHCO3, 1.3 CaCl2, 0.49 MgCl2, 0.44 KH2PO4, 0.41 MgSO4, 0.34 Na2HPO4. Nominally Ca2+/Mg2+ free HBSS (Gibco) contained, in mM: 137.9 NaCl, 5.3 KCl, 5.6 D-glucose, 4.2 NaHCO3, 0.44 KH2PO4, 0.34 Na2HPO4.

Methods

Cell culture

All cell lines were obtained from the UC Berkeley Cell Culture Facility and discarded after twenty-five passages. A431, HEK293T, MCF-7, and MDA-MB-231 cells were authenticated by short tandem repeat (STR) profiling. All cells were routinely tested for mycoplasma contamination. Cells were maintained in Dulbecco’s Modified Eagle Medium (DMEM) with 4.5 g/L D-glucose supplemented with 10% FBS (Seradigm (VWR); Radnor, PA) and 2 mM GlutaMAX (Gibco) in a 5% CO2 incubator at 37°C. Media for MCF-7 cells was supplemented with 1 mM sodium pyruvate (Life Technologies/Thermo Fisher Scientific) and 1x non-essential amino acids (Thermo Fisher Scientific). Media for CHO.K1 (referred to as CHO throughout the text) cells was supplemented with 1x non-essential amino acids. HEK293T and MDA-MB-231 were dissociated with 0.05% Trypsin-EDTA with phenol red (Thermo Fisher Scientific) at 37°C, whereas A431, CHO, and MCF-7 cells were dissociated with 0.25% Trypsin-EDTA with phenol red at 37°C. To avoid potential toxicity of residual trypsin, all cells except for HEK293T were spun down at 250xg or 500xg for 5 min and re-suspended in fresh complete media during passaging.

For use in imaging experiments, cells were plated onto 25 mm diameter poly-D-lysine coated #1.5 glass coverslips (Electron Microscopy Sciences) in six well tissue culture plates (Corning; Corning, NY). To maximize cell attachment, coverslips were treated before use with 1–2 M HCl for 2–5 hr and washed overnight three times with 100% ethanol and three times with deionized water. Coverslips were sterilized by heating to 150°C for 2–3 hr. Before use, coverslips were incubated with poly-D-lysine (Sigma-Aldrich, made as a 0.1 mg/mL solution in phosphate-buffered saline with 10 mM Na3BO4) for 1–10 hr at 37°C and then washed twice with water and twice with Dulbecco’s phosphate buffered saline (dPBS, Gibco).

A431, CHO, HEK293T, and MCF-7 were seeded onto glass coverslips 16–24 hr before microscopy experiments. MDA-MB-231 cells were seeded 48 hr before use because it facilitated formation of gigaseals during whole-cell voltage clamp electrophysiology. Cell densities used for optical resting membrane potential recordings (in 103 cells per cm2) were: A431 42; CHO 42; HEK293T 42; MCF-7 63; MDA-MB-231 42. To ensure the presence of single cells for whole-cell voltage clamp electrophysiology, fast-growing cells were plated more sparsely (approximately 20% confluence) for electrophysiology experiments. Cell densities used for electrophysiology (in 103 cells per cm2) were: A431 36–52; CHO 21; HEK293T 21; MCF-7 63; MDA-MB-231 42. To reduce their rapid growth rate, HEK293T cells were seeded onto glass coverslips in reduced glucose (1 g/L) DMEM with 10% FBS, 2 mM GlutaMAX, and 1 mM sodium pyruvate for electrophysiology experiments.

Cellular loading of VoltageFluor dyes

Cells were loaded with 1x VoltageFluor in HBSS for 20 min in a 37°C incubator with 5% CO2. For most experiments, 100 nM VoltageFluor was used. Serum-starved A431 cells were loaded with 50 nM VoltageFluor. After VF loading, cells were washed once with HBSS and then placed in fresh HBSS for imaging. All imaging experiments were conducted at room temperature under ambient atmosphere. Cells were used immediately after loading the VF dye, and no cells were kept for longer than an hour at room temperature.

Whole-cell patch-clamp electrophysiology

Pipettes were pulled from borosilicate glass with filament (Sutter Instruments, Novato, CA) with resistances ranging from 4 to 7 MΩ with a P97 pipette puller (Sutter Instruments). Internal solution composition, in mM (pH 7.25, 285 mOsmol/L): 125 potassium gluconate, 10 KCl, 5 NaCl, 1 EGTA, 10 HEPES, 2 ATP sodium salt, 0.3 GTP sodium salt. EGTA (tetraacid form) was prepared as a stock solution in either 1 M KOH or 10 M NaOH before addition to the internal solution. Pipettes were positioned with an MP-225 micromanipulator (Sutter Instruments). A liquid junction potential of −14 mV was determined by the Liquid Junction Potential Calculator in the pClamp software package (Barry, 1994) (Molecular Devices, San Jose, CA), and all voltage step protocols were corrected for this offset.

For VF-FLIM and CAESR, electrophysiology recordings for VF-FLIM and CAESR were made with an Axopatch 200B amplifier and digitized with a Digidata 1440A (Molecular Devices). The software package used was pClamp 10.3. Signals were filtered with a 5 kHz low-pass Bessel filter. Correction for pipette capacitance was performed in the cell attached configuration. Voltage-lifetime calibrations were performed in V-clamp mode, with the cell held at the potential of interest for 15 or 30 s while lifetime was recorded. Potentials were applied in random order, and membrane test was conducted between each step to verify the quality of the patch. For single cell patching, recordings were only included if they maintained a 30:1 ratio of membrane resistance (Rm) to access resistance (Ra) and an Ra value below 30 MΩ throughout the recording. Due to the reduced health of HEK293T cells transfected with CAESR, recordings were used as long as they maintained a 10:1 Rm:Ra ratio, although most recordings were better than 30:1 Rm:Ra. Only recordings stable for at least four voltage steps (roughly 2 min) were included in the dataset.

For di-8-ANEPPS, electrophysiology recordings were made in the same manner as the above, with the following minor differences. Signals were digitized with a Digidata 1550B; the pClamp 10.6 software package was used (Molecular Devices). Potentials were applied in the order 0 mV, −80 mV, +40 mV, −40 mV, +80 mV for ten seconds at each step. Patch parameters were tested at the beginning and end of the patch program, rather than between each step. Only patches that retained a 30:1 ratio of Rm to Ra and access resistance below 30 MΩ throughout the recording were included in the dataset.

For electrophysiology involving small groups of cells (Figure 2—figure supplement 3), complete voltage clamp across the entire cell group was not possible. Recordings were used as long as Ra remained below 30 MΩ for at least three voltage steps. Most recordings also retained Rm:Ra ratios greater than 20:1.

Epidermal growth factor treatment

A431 cells were serum starved prior to epidermal growth factor studies. Two days before the experiment, cells were trypsizined and suspended in complete media with 10% FBS. Cells were then spun down for 5 min at 500xg and re-suspended in reduced serum DMEM (2% FBS, 2 mM GlutaMAX, 4.5 g/L glucose). Cells were seeded onto 25 mm coverslips in six well plates at a density of 84 × 103 cells per cm2. 4–5.5 hr before the experiment, the media was exchanged for serum-free DMEM (0% FBS, 2 mM GlutaMAX, 4.5 g/L glucose).

After 4–5.5 hr in serum-free media, cells were loaded with 50 nM VF dye as described above. In pharmacology experiments, the drug or vehicle was also added to the VF dye loading solution. All subsequent wash and imaging solutions also contained the drug or vehicle. For changes to buffer ionic composition, VoltageFluor dyes were loaded in unmodified HBSS to avoid toxicity from prolonged incubation with high K+ or without Ca2+. Immediately prior to use, cells were washed in the modified HBSS (120 mM K+ or 0 mM Ca2+) and recordings were made in the modified HBSS.

For analysis of short-term responses to EGF (3 min time series), VF lifetime was recorded in 6 sequential 30 s exposures. Immediately after the conclusion of the first frame (30–35 s into the recording), EGF or vehicle (imaging buffer only) was added to the indicated final concentration from a 2x solution in HBSS imaging buffer. For analysis of long-term responses to EGF (15 min time series), EGF addition occurred in the same way, but a gap of 150 s (without laser illumination) was allotted between each 30 s lifetime recording. Times given throughout the text correspond to the start of an exposure. Voltage changes at 2.5 min were calculated from the difference between an initial image (taken before imaging buffer vehicle or EGF addition) and a final image (a 30 s exposure starting 2.5 min into the time series).

Transfection and imaging of CAESR in HEK293T

The CAESR plasmid was obtained as an agar stab (FCK-Quasar2-Citrine, Addgene #59172), cultured overnight in LB with 100 μg/mL ampicillin, and isolated via a spin miniprep kit (Qiagen). HEK293T cells were plated at a density of 42,000 cells per cm2directly onto a six well tissue culture plate and incubated at 37°C in a humidified incubator for 24 hr prior to transfection. Transfections were performed with Lipofectamine 3000 according to the manufacturer’s protocol (Thermo Fisher Scientific). Cells were allowed to grow an additional 24 hr after transfection before they were plated onto glass coverslips for microscopy experiments (as described above for electrophysiology of untransfected HEK293T cells).

Determination of EC50 for EGF in A431 cells

Average voltage changes 2.5 min after addition of EGF to serum deprived A431 cells were determined at different EGF concentrations, and these means were fit to a four parameter logistic function in MATLAB (MathWorks, Natick, MA).

Goldman-Hodgkin-Katz estimation of Vmem ranges in different imaging buffers

If intracellular and extracellular concentrations, as well as relative permeabilities, of all ionic species are known, the Goldman-Hodgkin-Katz (GHK) equation (Equation 1) can be used to calculate the resting membrane potential of a cell (Hodgkin and Katz, 1949). In practice, the intracellular ion concentrations [X]in and relative permeabilities Px are difficult to determine, so the GHK equation is not a substitute for direct measurement of Vmem. To obtain a range of reasonable Vmem values in systems where these concentrations and relative permeabilities are not known, we calculated possible Vmem using the ‘standard’ parameters derived from Hodgkin and Katz (1949), as well as a value above and a value below each ‘standard’ point. The values evaluated were the following: PK 1; PNa 0.01, 0.05, 0.2; PCl 0.2, 0.45, 0.9; [K+]in 90, 150, 200 mM; [Na+]in 5, 15, 50 mM; [Cl-]in 2, 10, 35 mM. Extracellular ion concentrations [X]out were known (see Materials and methods). In Equation 1, R is the universal gas constant, T is the temperature (293 K for this experiment), and F is Faraday’s constant.

Vmem=RTFlnPK[K+]out+PNa[Na+]out+PCl[Cl-]inPK[K+]in+PNa[Na+]in+PCl[Cl-]out (1)

Fluorescence lifetime data acquisition

Fluorescence lifetime imaging was conducted on a LSM 510 inverted scanning confocal microscope (Carl Zeiss AG, Oberkochen, Germany) equipped with an SPC-150 or SPC-150N single photon counting card (Becker and Hickl GmbH, Berlin, Germany) (Scheme 1). 80 MHz pulsed excitation was supplied by a Ti:Sapphire laser (MaiTai HP; SpectraPhysics, Santa Clara, CA) tuned to 958 nm and frequency-doubled to 479 nm. The laser was cooled by a recirculating water chiller (Neslab KMC100). Excitation light was directed into the microscope with a series of silver mirrors (Thorlabs, Newton, NJ or Newport Corporation, Irvine, CA).

Scheme 1. Optical diagram for time correlated single photon counting microscope.

Scheme 1.

Excitation light was supplied by a Ti:Sapphire laser tuned to 958 nm. A small amount of light was redirected by a beam sampler (S) to a reference photodiode. The remaining light was passed through a frequency doubler to obtain 479 nm excitation light, which entered the LSM510 confocal microscope. A polarizer (P) followed by a polarizing beamsplitter (BS), as well as a neutral density (ND) wheel, allowed control of the amount of light passed to the sample.

Excitation light power at the sample was controlled with a neutral density (ND) wheel and a polarizer (P) followed by a polarizing beamsplitter (BS). Light was titrated such that VoltageFluor lifetime did not drift during the experiment, no phototoxicity was visible, and photon pile-up was not visible on the detector. For recordings at high VoltageFluor concentrations (Figure 1—figure supplement 2, Figure 2—figure supplement 4), reduced power was used to avoid saturating the detector. For optical voltage determinations using 50 or 100 nM VoltageFluor, typical average power at the sample was 5 μW.

Fluorescence emission was collected through a 40x oil immersion objective (Zeiss) coated with immersion oil (Immersol 518F, Zeiss). Emitted photons were detected with a hybrid detector, HPM-100–40 (Becker and Hickl), based on a Hamamatsu R10467 GaAsP hybrid photomultiplier tube. Detector dark counts were kept below 1000 per second during acquisition. Emission light was collected through a 550/49 bandpass filter (Semrock, Rochester, NY) after passing through a 488 LP dichroic mirror (Zeiss). The reference photons for determination of photon arrival times were detected with a PHD-400-N high speed photodiode (Becker and Hickl). Data were acquired with 256 time bins in the analog-to-digital-converter and either 64 × 64 or 256 × 256 pixels of spatial resolution (see discussion of pixel size below).

Routine evaluation of the proper functioning of the lifetime recording setup was performed by measurement of three standards (Figure 1—source data 2): 2 μM fluorescein in 0.1 N NaOH, 1 mg/mL erythrosin B in water (pH 7), and the instrument response function (IRF). The IRF was determined from a solution of 500 μM fluorescein and 12.2 M sodium iodide in 0.1 N NaOH. Because of the high concentration of iodide quencher, the IRF solution has a lifetime shorter than the detector response time, allowing approximation of the instrument response function under identical excitation and emission conditions as data acquisition (Liu et al., 2014).

IRF deconvolution

Signal from photons detected in a TCSPC apparatus are convolved with the instrument response (IRF). IRFs can be approximated by the SPCImage fitting software, but consistency of lifetime fits on VF-FLIM datasets was improved by using a measured IRF. Measured IRFs were incorporated by the iterative reconvolution method using SPCImage analysis software (Becker, 2012).

VoltageFluor lifetime fitting model

All VoltageFluor lifetime data were fit using SPCImage (Becker and Hickl), which solves the nonlinear least squares problem using the Levenberg-Marquadt algorithm. VF2.1.Cl lifetime data were fit to a sum of two exponential decay components (Equation 2). Attempts to fit the VF2.1.Cl data with a single exponential decay (Equation 3) were unsatisfactory.

Ft=a1e-tτ1+a2e-tτ2 (2)

The fluorescence lifetime of VF2.0.Cl was adequately described by a single exponential decay for almost all data (Equation 3). A second exponential component was necessary to fit data at VF2.0.Cl concentrations above 500 nM, likely attributable to the concentration-dependent decrease in lifetime that was observed high VF concentrations.

Ft=ae-tτ (3)

For all data fit with the two component model, the weighted average of the two lifetimes, τm (Equation 4), was used in subsequent analysis.

τm=a1τ1+a2τ2a1+a2 (4)

All lifetime images are represented as an overlay of photon count (pixel intensity) and weighted average lifetime (pixel color) throughout the text (τm + PC, Figure 1—figure supplement 1). Pixels with insufficient signal to fit a fluorescence decay are shown in black. The photon counts, as well as the lifetimes, in image sequences on the same set of cells are scaled across the same range.

Additional fit parameters for VoltageFluor lifetimes

Pixels with photon counts below 300 (VF2.1.Cl) or 150 (VF2.0.Cl) photons at the peak of the decay (time bin with the most signal) were omitted from analysis to ensure reproducible fits. Because the lifetime of VFs does not fully decay to baseline in a single 12.5 ns laser cycle, the incomplete multiexponentials fitting option was used, allowing the model to attribute some signal early in the decay to the previous laser cycle. Out of 256 time bins from the analog-to-digital converter (ADC), only data from time bins 23 to 240 were used in the final fit. The offset parameter (detector dark counts per ADC time bin per pixel) was set to zero. The number of iterations for the fit in SPCImage was increased to 20 to obtain converged fits. Shift between the IRF and the decay trace was fixed to 0.5 (in units of ADC time bins), which consistently gave lifetimes of standards erythrosin B (1 mg/mL in H2O) (Boens et al., 2007) and fluorescein (2 μM in 0.1 N NaOH, H2O) (Magde et al., 1999) closest to reported values (Figure 1—source data 2).

Acquisition time and effective pixel size in lifetime data

To obtain sufficient photons but keep excitation light power minimal, binning between neighboring pixels was employed during fitting. This procedure effectively takes the lifetime as a spatial moving average across the image by including adjacent pixels in the decay for a given pixel. To obtain larger photon counts, the confocal pinhole was set between 2.5 and 3.5 airy units, which corresponds to optical section thickness of approximately 2.5 µm.

Data type Acquired pixel
width (μm)
Binned pixel
width (μm)
Acquisition
time (s)
Img size (pixels)
Concentration Curve
(Figure 1—figure supplement 2, Figure 2—figure supplement 4)
0.44 3.08 75–90 256 × 256
Vmem Distributions (Figure 3) 1.24 8.68 90–120 256 × 256
Electrophysiology Recording 1.00 3.01 15–30 64 × 64
EGF Time Series 0.88 2.64 30 64 × 64

All tabulated values are for an individual frame, although multiple sequential frames were recorded in both the electrophysiology and EGF experiments. For each recording type, the width of each pixel at acquisition is reported, as well as the width of the area included in the binned lifetime signal during fitting. All pixels are square. The acquisition time reflects the total time to collect the image, not the total time exposing each pixel. All FLIM images have 256 time bins in the ns regime, so a 256 × 256 spatial image size represents a 256 × 256 × 256 total dataset. Img = image.

Determination of regions of interest

Images were divided into cell groups, with each cell group as a single region of interest (ROI). ROIs were determined from photon count images, either manually from the cell morphology in FIJI (Schindelin et al., 2012) or automatically by sharpening and then thresholding the signal intensity with custom MATLAB code (Source code 2). Regions of images that were partially out of the optical section or contained punctate debris were omitted. Sample ROIs are shown in Figure 1—figure supplement 1.

For cells that adjoin other cells, attribution of a membrane region to one cell versus the other is not possible. As such, we chose to interpret each cell group as an independent sample (‘n’) instead of extracting Vmem values for individual cells. Adjacent cells in a group are electrically coupled to varying degrees, and their resting membrane potentials are therefore not independent (Meşe et al., 2007). While this approach did not fully utilize the spatial resolution of VF-FLIM, it prevented overestimation of biological sample size for the effect in question.

Conversion of lifetime to transmembrane potential

The mean τm across all pixels in an ROI was used as the lifetime for that ROI. Lifetime values were mapped to transmembrane potential via the lifetime-Vmem standard curves determined with whole-cell voltage-clamp electrophysiology. For electrophysiology measurements, the relationship between the weighted average lifetime (Equation 4) and membrane potential for each patched cell was determined by linear regression, yielding a sensitivity (m, ps/mV) and a 0 mV lifetime (b, ps) for each cell (Equation 5). The average sensitivity and 0 mV point across all cells of a given type were used to convert subsequent lifetime measurements (τ) to Vmem (Figure 2—source data 1, Equation 6). For quantifying changes in voltage (ΔVmem) from changes in lifetime (Δτ), only the average sensitivity is necessary (Equation 7).

τ=m*Vmem+b (5)
Vmem=(τ-b)m (6)
ΔVmem=(Δτ)m (7)

Where standard error of the mean of a voltage determination (δVmem) is given, error was propagated to include the standard errors of the slope (δm) and y-intercept (δb) of the voltage calibration, as well as the standard error of the lifetime measurements (δτ) in the condition of interest (Equation 8). For error in a voltage change (δΔVmem), only error in the calibration slope was included in the propagated error (Equation 9). Where standard deviation of VF-FLIM derived Vmem values is shown, a similar error propagation procedure was applied, using the standard deviation of the average sensitivity and 0 mV lifetime for that cell line.

δVmem=Vmemδτ2+δb2τ-b2+δmm2 (8)
δΔVmem=ΔVmemδΔτΔτ2+δmm2 (9)

Resolution of VF-FLIM voltage determination

The intrinsic nature of fluorescence lifetime introduces a point of reference into the voltage measurement, from which a single lifetime image can be interpreted as resting membrane potential. Differences in this reference point (reported here as the 0 mV lifetime) over time and across cells provides an estimate of the voltage-independent noise in VF-FLIM. We report resolution as the root-mean-square deviation (RMSD) between the optically calculated voltage (VFLIM) and the voltage set by whole-cell voltage clamp (Vephys), which is analogous to the resolution calculations described previously by Cohen and co-workers (Hou et al., 2014). The RMSD of n measurements (Equation 10) can be determined from the variance σ (Cone and Cone, 1976) (Equation 11) and the bias (Equation 12) of the estimator (in this case, VF-FLIM) relative to the ‘true’ value (in this case, electrophysiology). These calculations are described graphically in Scheme 2 below.

RMSD=σ2+Bias2 (10)
σ2=1ni=1n(VFLIM,i-Vephys,i)2 (11)
Bias=1ni=1nVFLIM,i-1ni=1nVephys,i (12)

The voltage-independent variations in lifetime are much larger between cells than within a cell. Therefore, the error in measuring absolute voltage changes on a given cell (‘intra-cell’ comparisons) is lower than the error in determining the absolute Vmem of that cell (‘inter-cell’ comparisons, since the calibration used is from another cell). We can therefore determine an ‘intra-cell’ RMSD and an ‘inter-cell’ RMSD to reflect the voltage resolution of these two types of measurements. To calculate ‘intra-cell’ error, we look at the RMSD between Vephys and VFLIM using the τfl-Vmem relationship for that specific cell. Phrased another way, we are looking at the amount of error that would be expected in estimating Vmem of a cell if its exact τfl-Vmem relationship were known. This ‘intra cell’ RMSD estimates the error expected in quantifying changes in Vmem on a given cell. We calculate an intra cell error for each cellular recording, so intra cell errors are reported throughout the text as a mean ± SEM of the intra cell errors for all individual cells of a given type. The average intra cell error was at or below 5 mV for all cell lines tested (Figure 2—source data 1).

Scheme 2. Intra and inter-cell Vmem resolution calculations.

Scheme 2.

Data are taken directly from Figure 1H,I as an example. (A) Intra cell values are the RMSD between the voltage equivalent of the measured lifetime (VFLIM) and voltage set by electrophysiology (Vephys). VFLIM values are calculated using that particular cell’s line of best fit, so one value is obtained per cell. Here, we present intra cell error as the mean ± SEM of all cells from a given cell line. (B) Inter cell errors are the RMSD between the voltage-equivalent of the 0 mV lifetime for all cells tested from a cell line (VFLIM, determined with the average slope and y-intercept for that cell line) and the ground truth value of 0 mV. Inter-cell accuracy is calculated from all of the calibration data for a cell line, so there is one value per cell line. Black points are experimental y-intercepts and blue points are the VFLIM optical voltage determinations from those lifetimes. Gray lines are lines of best fit for individual cells. Green line in (B) represents the average τfl-Vmem relationship for a cell line.

The error in the absolute membrane potential determination (‘inter-cell’) is calculated here as the RMSD between the y-intercept (0 mV lifetime) of all of the individual cells’ lifetime-voltage relationships and the 0 mV value for the averaged calibration for all cells of a given type. This metric quantifies how well the lifetime-Vmem relationship for a given cell line represents an individual cell’s lifetime-Vmem relationship. This ‘inter cell’ RMSD ranged from 10 to 23 mV for the tested cell lines (Figure 2—source data 1). Much smaller errors for a population value of Vmem can be obtained by averaging Vmem recordings from multiple cells.

This method of calculating error assumes that the electrophysiology measurement is perfectly accurate and precise. Realistically, it is likely that some of the variation seen is due to the quality of the voltage clamp. As a result, these RMSD values provide a conservative upper bound for the voltage errors in VF-FLIM.

Analysis of CAESR lifetimes

For sample images of CAESR in HEK293T (Figure 1—figure supplement 4), fluorescence decays were fit using SPCImage to a biexponential decay model as described for VF2.1.Cl above, using a peak photon threshold of 150 and a bin of 2 (binned pixel width of 5 μm). To better match the studies by Cohen and co-workers (Brinks et al., 2015), which isolated the membrane fluorescence from cytosolic fluorescence by directing the laser path, the lifetime-voltage relationships were not determined with these square-binned images. Instead, membranes were manually identified, and the fluorescence decays from all membrane pixels were summed together before fitting once per cell. (This is in contrast to the processing of VoltageFluor data, where the superior signal to noise and localization enables fitting and analysis of the lifetime on a pixel by pixel basis). This ‘one fit per membrane’ analysis of CAESR was performed in custom MATLAB code implementing a Nelder-Mead algorithm (Source code 1, adapted from Enderlein and Erdmann, 1997). CAESR data were fit to a biexponential model with the offset fixed to 0 and the color shift as a free parameter.

Di-8-ANEPPS ratio-based imaging

In preparation for imaging, HEK293T cells were plated as described above for electrophysiology. 1 µM di-8-ANEPPS was loaded for ten minutes in HBSS at room temperature and atmospheric CO2. Coverslips were washed twice in HBSS and transferred to fresh HBSS for imaging. No surfactants were used in the loading (e.g. Pluronic F-127) because their presence worsened cell robustness for whole-cell patch-clamp electrophysiology. All recordings were made with HBSS as an extracellular solution; no cells were kept for more than 30 min after dye loading due to the increasing presence of internalized dye.

Epifluorescence imaging was performed with an inverted Observer.Z1 (Carl Zeiss Microscopy) controlled with µManager 1.4 (Open Imaging) (Edelstein et al., 2014). Images were acquired with an Orca Flash 4 Digital CMOS camera (Hamamatsu Corporation; San Jose, CA). Excitation light was provided with a Spectra X light engine (Lumencor, Inc.; Beaverton, OR). Excitation wavelengths were selected with built-in filters in the Spectra X (440/20 bandpass filter for blue and 550/15 bandpass filter for green). Blue-excited images were obtained with an excitation power of 71 mW/mm2 and an exposure time of 50 ms. Green-excited images were obtained with an excitation power of 136 mW/mm2 and an exposure time of 500 ms. Emission light was collected with a 40x magnification oil immersion objective lens using Immersol 518F immersion oil (Zeiss). Fluorescence emission was selected with a 562 nm long pass dichroic mirror and further filtered by a 593/40 bandpass filter (Semrock). Excitation and emission wavelengths were selected to match previous work with this probe as closely as possible (Zhang et al., 1998) (current excitation [blue]: 440 ± 10 nm; reported excitation [blue]: 440 ± 15 nm; current excitation [green]: 550 ± 7.5 nm; reported excitation [green]: 530 ± 15 nm; current dichroic: 562 nm long-pass; reported dichroic: 565 nm; current emission: 593 ± 20 nm; reported emission: 570 nm long pass).

Di-8-ANEPPS data analysis

Single color (e.g. blue excited or green excited) fluorescence images were background subtracted at each pixel before ratios were calculated. The background value was determined from a region of interest near the center of the image that contained no cells and minimal fluorescent debris. Excitation ratios (‘R’, blue signal divided by green signal, B/G) were then calculated pixelwise from the background subtracted fluorescence images. Pixels with less than 100 arbitrary units of signal in either the blue or the green channel were excluded from analysis and are depicted in black. Regions of interest (ROIs) were manually selected in FIJI to include only area corresponding to the cell membrane. The ratio was averaged across all pixels in a given ROI (similar to the treatment for VF-FLIM, as described in Figure 1—figure supplement 1). The ratio values per value of Vmem (set by whole cell patch clamp electrophysiology) in Figure 1—figure supplement 5E,F are the average of these cell-averaged ratios obtained in 6 or 7 sequential images acquired while the Vmem was held at the indicated value.

Where normalized R values are discussed, these values were calculated by dividing the ratio at a given potential (averaged for an ROI as discussed above) by the ratio at 0 mV, as reported previously (Zhang et al., 1998). This normalization procedure requires electrode-based calibration for every individual recording and cannot be stably extended to all cells from a particular cell line. Therefore, it is not analogous to VF-FLIM and is not the point of comparison for voltage resolution.

Statistical analysis

Mean ± standard error of the mean (SEM) of data is reported throughout the text. Hypothesis testing was performed as indicated with either analysis of variance (ANOVA) followed by appropriate post hoc tests or two-sided, unpaired, unequal variances t-tests. Statistical tests were performed in Python 2 or 3 with the SciPy, pandas and Pingouin (Vallat, 2018) packages. Unless otherwise noted, all data shown reflect at least three biological replicates (independent cultures measured on different days). Each of these biological replicates contained between 1 and 5 technical replicates (different samples of cells that were measured on the same day and had been prepared from the same cell stock). For tandem electrophysiology-FLIM measurements, each τfl-Vmem calibration includes at least three biological replicates to capture the variability expected during applications of VF-FLIM. No power analyses were performed before data were collected. Sample sizes throughout the text refer to the total number of cells or cell groups of a given type analyzed across all biological and technical replicates. Cell group identification is discussed in Methods. For experiments where resting membrane potential or resting membrane potential changes are compared to a baseline (Figures 35 and supplements), both control measurements and their physiologically or pharmacologically altered counterparts were recorded on each experimental day. Masking was not used during data collection or analysis.

Acknowledgements

We thank Holly Aaron and Vadim Degtyar for expert technical assistance and training in the use of FLIM, Prof. John Kuriyan and Dr. Sean Peterson for helpful discussions, and members of the Miller lab for providing VF dyes. FLIM experiments were performed at the CRL Molecular Imaging Center, supported by NSF DBI-0116016. Cell lines were from the UCB Cell Culture Facility which is supported by The University of California Berkeley. FCK-QuasAr2-Citrine was a gift from Adam Cohen (Addgene plasmid # 59172). JLD was supported by an NSF Graduate Research Fellowship. EWM acknowledges support from the Sloan Foundation (FG-2016–6359), March of Dimes (5-FY16-65), and the NIH (R35GM119855).

Funding Statement

The funders had no role in study design, data collection and interpretation, or the decision to submit the work for publication.

Contributor Information

Evan W Miller, Email: evanwmiller@berkeley.edu.

Lawrence Cohen, Yale, United States.

Richard Aldrich, The University of Texas at Austin, United States.

Funding Information

This paper was supported by the following grants:

  • National Science Foundation GRFP to Julia R Lazzari-Dean.

  • National Institutes of Health R35GM119855 to Evan W Miller.

  • Alfred P. Sloan Foundation FG-2016-6359 to Evan W Miller.

  • March of Dimes Foundation 5-FY-16-65 to Evan W Miller.

Additional information

Competing interests

No competing interests declared.

is listed as an inventor on a patent describing voltage-sensitive fluorophores. This patent (US20170315059) is owned by the Regents of the University of California.

Author contributions

Software, Formal analysis, Validation, Investigation, Visualization, Methodology, Writing—original draft, Writing—review and editing.

Formal analysis, Validation, Investigation, Methodology, Writing—review and editing.

Conceptualization, Formal analysis, Supervision, Validation, Methodology, Writing—original draft, Writing—review and editing.

Additional files

Source code 1. Global analysis of CAESR fluorescence lifetimes.
elife-44522-code1.zip (4.3KB, zip)
DOI: 10.7554/eLife.44522.034
Source code 2. Automated thresholding and cell group identification.
elife-44522-code2.zip (16.2KB, zip)
DOI: 10.7554/eLife.44522.035
Transparent reporting form
DOI: 10.7554/eLife.44522.036

Data availability

All data presented in the manuscript is available in the supporting/supplementary information.

References

  1. Abdul Kadir L, Stacey M, Barrett-Jolley R. Emerging roles of the membrane potential: action beyond the action potential. Frontiers in Physiology. 2018;9:1661. doi: 10.3389/fphys.2018.01661. [DOI] [PMC free article] [PubMed] [Google Scholar]
  2. Adams DS, Levin M. General principles for measuring resting membrane potential and ion concentration using fluorescent bioelectricity reporters. Cold Spring Harbor Protocols. 2012;2012:397:pdb.top067710. doi: 10.1101/pdb.top067710. [DOI] [PMC free article] [PubMed] [Google Scholar]
  3. Armstrong CM, Gilly WF. Access resistance and space clamp problems associated with whole-cell patch clamping. Methods in Enzymology. 1992;207:100–122. doi: 10.1016/0076-6879(92)07007-b. [DOI] [PubMed] [Google Scholar]
  4. Barry PH. JPCalc, a software package for calculating liquid junction potential corrections in patch-clamp, intracellular, epithelial and bilayer measurements and for correcting junction potential measurements. Journal of Neuroscience Methods. 1994;51:107–116. doi: 10.1016/0165-0270(94)90031-0. [DOI] [PubMed] [Google Scholar]
  5. Becker W. The bh TCSPC Handbook. 5th edn. Becker & Hickl; 2012. [Google Scholar]
  6. Berezin MY, Achilefu S. Fluorescence lifetime measurements and biological imaging. Chemical Reviews. 2010;110:2641–2684. doi: 10.1021/cr900343z. [DOI] [PMC free article] [PubMed] [Google Scholar]
  7. Berndt A, Yizhar O, Gunaydin LA, Hegemann P, Deisseroth K. Bi-stable neural state switches. Nature Neuroscience. 2009;12:229–234. doi: 10.1038/nn.2247. [DOI] [PubMed] [Google Scholar]
  8. Blacker TS, Duchen MR. Investigating mitochondrial redox state using NADH and NADPH autofluorescence. Free Radical Biology and Medicine. 2016;100:53–65. doi: 10.1016/j.freeradbiomed.2016.08.010. [DOI] [PMC free article] [PubMed] [Google Scholar]
  9. Boens N, Qin W, Basarić N, Hofkens J, Ameloot M, Pouget J, Lefèvre JP, Valeur B, Gratton E, vandeVen M, Silva ND, Engelborghs Y, Willaert K, Sillen A, Rumbles G, Phillips D, Visser AJ, van Hoek A, Lakowicz JR, Malak H, Gryczynski I, Szabo AG, Krajcarski DT, Tamai N, Miura A. Fluorescence lifetime standards for time and frequency domain fluorescence spectroscopy. Analytical Chemistry. 2007;79:2137–2149. doi: 10.1021/ac062160k. [DOI] [PMC free article] [PubMed] [Google Scholar]
  10. Briggman KL, Kristan WB, González JE, Kleinfeld D, Tsien RY. Membrane Potential Imaging in the Nervous System: Methods and Applications. Springer; 2010. Monitoring integrated activity of individual neurons using FRET-based voltage-sensitive dyes; pp. 61–70. [DOI] [PubMed] [Google Scholar]
  11. Brinks D, Klein AJ, Cohen AE. Two-photon lifetime imaging of voltage indicating proteins as a probe of absolute membrane voltage. Biophysical Journal. 2015;109:914–921. doi: 10.1016/j.bpj.2015.07.038. [DOI] [PMC free article] [PubMed] [Google Scholar]
  12. Brügger B. Lipidomics: analysis of the lipid composition of cells and subcellular organelles by electrospray ionization mass spectrometry. Annual Review of Biochemistry. 2014;83:79–98. doi: 10.1146/annurev-biochem-060713-035324. [DOI] [PubMed] [Google Scholar]
  13. Bullen A, Saggau P. High-speed, random-access fluorescence microscopy: ii. fast quantitative measurements with voltage-sensitive dyes. Biophysical Journal. 1999;76:2272–2287. doi: 10.1016/S0006-3495(99)77383-2. [DOI] [PMC free article] [PubMed] [Google Scholar]
  14. Cadwell CR, Palasantza A, Jiang X, Berens P, Deng Q, Yilmaz M, Reimer J, Shen S, Bethge M, Tolias KF, Sandberg R, Tolias AS. Electrophysiological, transcriptomic and morphologic profiling of single neurons using Patch-seq. Nature Biotechnology. 2016;34:199–203. doi: 10.1038/nbt.3445. [DOI] [PMC free article] [PubMed] [Google Scholar]
  15. Cervera J, Alcaraz A, Mafe S. Bioelectrical signals and ion channels in the modeling of multicellular patterns and cancer biophysics. Scientific Reports. 2016a;6:srep20403. doi: 10.1038/srep20403. [DOI] [PMC free article] [PubMed] [Google Scholar]
  16. Cervera J, Meseguer S, Mafe S. The interplay between genetic and bioelectrical signaling permits a spatial regionalisation of membrane potentials in model multicellular ensembles. Scientific Reports. 2016b;6:srep35201. doi: 10.1038/srep35201. [DOI] [PMC free article] [PubMed] [Google Scholar]
  17. Chen RF, Knutson JR. Mechanism of fluorescence concentration quenching of carboxyfluorescein in liposomes: energy transfer to nonfluorescent dimers. Analytical Biochemistry. 1988;172:61–77. doi: 10.1016/0003-2697(88)90412-5. [DOI] [PubMed] [Google Scholar]
  18. Cone CD, Cone CM. Induction of mitosis in mature neurons in central nervous system by sustained depolarization. Science. 1976;192:155–158. doi: 10.1126/science.56781. [DOI] [PubMed] [Google Scholar]
  19. de Silva AP, Gunaratne HQN, Habib-Jiwan J-L, McCoy CP, Rice TE, Soumillion J-P. New fluorescent model compounds for the study of photoinduced electron transfer: the influence of a molecular electric field in the excited state. Angewandte Chemie International Edition in English. 1995;34:1728–1731. doi: 10.1002/anie.199517281. [DOI] [Google Scholar]
  20. Deal PE, Kulkarni RU, Al-Abdullatif SH, Miller EW. Isomerically pure tetramethylrhodamine voltage reporters. Journal of the American Chemical Society. 2016;138:9085–9088. doi: 10.1021/jacs.6b05672. [DOI] [PMC free article] [PubMed] [Google Scholar]
  21. Dumas D, Stoltz JF. New tool to monitor membrane potential by FRET voltage sensitive dye (FRET-VSD) Using spectral and fluorescence lifetime imaging microscopy (FLIM). Interest in cell engineering. Clinical Hemorheology and Microcirculation. 2005;33:293–302. [PubMed] [Google Scholar]
  22. Edelstein AD, Tsuchida MA, Amodaj N, Pinkard H, Vale RD, Stuurman N. Advanced methods of microscope control using μManager software. Journal of Biological Methods. 2014;1:10. doi: 10.14440/jbm.2014.36. [DOI] [PMC free article] [PubMed] [Google Scholar]
  23. Enderlein J, Erdmann R. Fast fitting of multi-exponential decay curves. Optics Communications. 1997;134:371–378. doi: 10.1016/S0030-4018(96)00384-7. [DOI] [Google Scholar]
  24. Gao L, Liang J, Li C, Wang LV. Single-shot compressed ultrafast photography at one hundred billion frames per second. Nature. 2014;516:74–77. doi: 10.1038/nature14005. [DOI] [PMC free article] [PubMed] [Google Scholar]
  25. González JE, Tsien RY. Improved indicators of cell membrane potential that use fluorescence resonance energy transfer. Chemistry & Biology. 1997;4:269–277. doi: 10.1016/S1074-5521(97)90070-3. [DOI] [PubMed] [Google Scholar]
  26. Gordon JA. Use of vanadate as protein-phosphotyrosine phosphatase inhibitor. Methods in Enzymology. 1991;201:477–482. doi: 10.1016/0076-6879(91)01043-2. [DOI] [PubMed] [Google Scholar]
  27. Grenier V, Daws BR, Liu P, Miller EW. Spying on neuronal membrane potential with genetically targetable voltage indicators. Journal of the American Chemical Society. 2019;141:1349–1358. doi: 10.1021/jacs.8b11997. [DOI] [PMC free article] [PubMed] [Google Scholar]
  28. Gross E, Bedlack RS, Loew LM. Dual-wavelength ratiometric fluorescence measurement of the membrane dipole potential. Biophysical Journal. 1994;67:208–216. doi: 10.1016/S0006-3495(94)80471-0. [DOI] [PMC free article] [PubMed] [Google Scholar]
  29. Harvey CD, Yasuda R, Zhong H, Svoboda K. The spread of ras activity triggered by activation of a single dendritic spine. Science. 2008;321:136–140. doi: 10.1126/science.1159675. [DOI] [PMC free article] [PubMed] [Google Scholar]
  30. Hodgkin AL, Katz B. The effect of sodium ions on the electrical activity of giant axon of the squid. The Journal of Physiology. 1949;108:37–77. doi: 10.1113/jphysiol.1949.sp004310. [DOI] [PMC free article] [PubMed] [Google Scholar]
  31. Horn R, Korn SJ. Prevention of rundown in electrophysiological recording. Methods in Enzymology. 1992;207:149–155. doi: 10.1016/0076-6879(92)07010-l. [DOI] [PubMed] [Google Scholar]
  32. Hou JH, Venkatachalam V, Cohen AE. Temporal dynamics of microbial rhodopsin fluorescence reports absolute membrane voltage. Biophysical Journal. 2014;106:639–648. doi: 10.1016/j.bpj.2013.11.4493. [DOI] [PMC free article] [PubMed] [Google Scholar]
  33. Huang CJ, Harootunian A, Maher MP, Quan C, Raj CD, McCormack K, Numann R, Negulescu PA, González JE. Characterization of voltage-gated sodium-channel blockers by electrical stimulation and fluorescence detection of membrane potential. Nature Biotechnology. 2006;24:439–446. doi: 10.1038/nbt1194. [DOI] [PubMed] [Google Scholar]
  34. Huang YL, Walker AS, Miller EW. A photostable silicon rhodamine platform for optical voltage sensing. Journal of the American Chemical Society. 2015;137:10767–10776. doi: 10.1021/jacs.5b06644. [DOI] [PMC free article] [PubMed] [Google Scholar]
  35. Huang X, Jan LY. Targeting potassium channels in cancer. The Journal of Cell Biology. 2014;206:151–162. doi: 10.1083/jcb.201404136. [DOI] [PMC free article] [PubMed] [Google Scholar]
  36. Lakowicz JR, Szmacinski H, Johnson ML. Calcium imaging using fluorescence lifetimes and long-wavelength probes. Journal of Fluorescence. 1992;2:47–62. doi: 10.1007/BF00866388. [DOI] [PMC free article] [PubMed] [Google Scholar]
  37. Lee SJ, Escobedo-Lozoya Y, Szatmari EM, Yasuda R. Activation of CaMKII in single dendritic spines during long-term potentiation. Nature. 2009;458:299–304. doi: 10.1038/nature07842. [DOI] [PMC free article] [PubMed] [Google Scholar]
  38. Levin M. Molecular bioelectricity: how endogenous voltage potentials control cell behavior and instruct pattern regulation in vivo. Molecular Biology of the Cell. 2014;25:3835–3850. doi: 10.1091/mbc.e13-12-0708. [DOI] [PMC free article] [PubMed] [Google Scholar]
  39. Levitt JA, Kuimova MK, Yahioglu G, Chung P-H, Suhling K, Phillips D. Membrane-bound molecular rotors measure viscosity in live cells via fluorescence lifetime imaging. The Journal of Physical Chemistry C. 2009;113:11634–11642. doi: 10.1021/jp9013493. [DOI] [Google Scholar]
  40. Li LS. Fluorescence probes for membrane potentials based on mesoscopic electron transfer. Nano Letters. 2007;7:2981–2986. doi: 10.1021/nl071163p. [DOI] [PubMed] [Google Scholar]
  41. Liu M, Jia M, Pan H, Li L, Chang M, Ren H, Argoul F, Zhang S, Xu J. Instrument response standard in time-resolved fluorescence spectroscopy at visible wavelength: quenched fluorescein sodium. Applied Spectroscopy. 2014;68:577–583. doi: 10.1366/13-07236. [DOI] [PubMed] [Google Scholar]
  42. Liu P, Grenier V, Hong W, Muller VR, Miller EW. Fluorogenic targeting of voltage-sensitive dyes to neurons. Journal of the American Chemical Society. 2017;139:17334–17340. doi: 10.1021/jacs.7b07047. [DOI] [PMC free article] [PubMed] [Google Scholar]
  43. Loew LM, Scully S, Simpson L, Waggoner AS. Evidence for a charge-shift electrochromic mechanism in a probe of membrane potential. Nature. 1979;281:497–499. doi: 10.1038/281497a0. [DOI] [PubMed] [Google Scholar]
  44. Lückhoff A, Clapham DE. Calcium channels activated by depletion of internal calcium stores in A431 cells. Biophysical Journal. 1994;67:177–182. doi: 10.1016/S0006-3495(94)80467-9. [DOI] [PMC free article] [PubMed] [Google Scholar]
  45. Magde D, Rojas GE, Seybold PG. Solvent dependence of the fluorescence lifetimes of xanthene dyes. Photochemistry and Photobiology. 1999;70:737–744. doi: 10.1111/j.1751-1097.1999.tb08277.x. [DOI] [Google Scholar]
  46. Magni M, Meldolesi J, Pandiella A. Ionic events induced by epidermal growth factor: evidence that hyperpolarization and stimulated cation influx play a role in the stimulation of cell growth. The Journal of Biological Chemistry. 1991;266:6329–6335. [PubMed] [Google Scholar]
  47. Maher MP, Wu NT, Ao H. pH-Insensitive FRET voltage dyes. Journal of Biomolecular Screening. 2007;12:656–667. doi: 10.1177/1087057107302113. [DOI] [PubMed] [Google Scholar]
  48. Malinow R, Tsien RW. Presynaptic enhancement shown by whole-cell recordings of long-term potentiation in hippocampal slices. Nature. 1990;346:177–180. doi: 10.1038/346177a0. [DOI] [PubMed] [Google Scholar]
  49. Marquèze-Pouey B, Mailfert S, Rouger V, Goaillard JM, Marguet D. Physiological epidermal growth factor concentrations activate high affinity receptors to elicit calcium oscillations. PLOS ONE. 2014;9:e106803. doi: 10.1371/journal.pone.0106803. [DOI] [PMC free article] [PubMed] [Google Scholar]
  50. McKeithan WL, Savchenko A, Yu MS, Cerignoli F, Bruyneel AAN, Price JH, Colas AR, Miller EW, Cashman JR, Mercola M. An automated platform for assessment of congenital and drug-induced arrhythmia with hiPSC-derived cardiomyocytes. Frontiers in Physiology. 2017;8:766. doi: 10.3389/fphys.2017.00766. [DOI] [PMC free article] [PubMed] [Google Scholar]
  51. Meşe G, Richard G, White TW. Gap junctions: basic structure and function. The Journal of Investigative Dermatology. 2007;127:2516–2524. doi: 10.1038/sj.jid.5700770. [DOI] [PubMed] [Google Scholar]
  52. Miller EW, Lin JY, Frady EP, Steinbach PA, Kristan WB, Tsien RY. Optically monitoring voltage in neurons by photo-induced electron transfer through molecular wires. PNAS. 2012;109:2114–2119. doi: 10.1073/pnas.1120694109. [DOI] [PMC free article] [PubMed] [Google Scholar]
  53. Montana V, Farkas DL, Loew LM. Dual-wavelength ratiometric fluorescence measurements of membrane potential. Biochemistry. 1989;28:4536–4539. doi: 10.1021/bi00437a003. [DOI] [PubMed] [Google Scholar]
  54. Moolenaar WH, Yarden Y, de Laat SW, Schlessinger J. Epidermal growth factor induces electrically silent Na+ influx in human fibroblasts. The Journal of Biological Chemistry. 1982;257:8502–8506. [PubMed] [Google Scholar]
  55. Moolenaar WH, Aerts RJ, Tertoolen LG, de Laat SW. The epidermal growth factor-induced calcium signal in A431 cells. The Journal of Biological Chemistry. 1986;261:279–284. [PubMed] [Google Scholar]
  56. Mozhayeva GN, Naumov AP, Kuryshev YA. Epidermal growth factor activates calcium-permeable channels in A 431 cells. Biochimica Et Biophysica Acta (BBA) - Molecular Cell Research. 1989;1011:171–175. doi: 10.1016/0167-4889(89)90206-1. [DOI] [PubMed] [Google Scholar]
  57. Ouadid-Ahidouch H, Le Bourhis X, Roudbaraki M, Toillon RA, Delcourt P, Prevarskaya N. Changes in the K+ current-density of MCF-7 cells during progression through the cell cycle: possible involvement of a h-Ether.a-Gogo K+ channel. Receptors & Channels. 2001;7:345–356. [PubMed] [Google Scholar]
  58. Pandiella A, Malgaroli A, Meldolesi J, Vicentini LM. EGF raises cytosolic Ca2+ in A431 and Swiss 3T3 cells by a dual mechanism. Redistribution from intracellular stores and stimulated influx. Experimental Cell Research. 1987;170:175–185. doi: 10.1016/0014-4827(87)90127-3. [DOI] [PubMed] [Google Scholar]
  59. Pandiella A, Magni M, Lovisolo D, Meldolesi J. The effects of epidermal growth factor on membrane potential. J. Biol. Chem. 1989;264:12914–12921. [PubMed] [Google Scholar]
  60. Peppelenbosch MP, Tertoolen LGJ, De Laat SW. Epidermal growth factor-activated calcium and potassium channels. J. Biol. Chem. 1991;266:19938–19944. [PubMed] [Google Scholar]
  61. Peterka DS, Takahashi H, Yuste R. Imaging voltage in neurons. Neuron. 2011;69:9–21. doi: 10.1016/j.neuron.2010.12.010. [DOI] [PMC free article] [PubMed] [Google Scholar]
  62. Raspe M, Kedziora KM, van den Broek B, Zhao Q, de Jong S, Herz J, Mastop M, Goedhart J, Gadella TWJ, Young IT. SiFLIM: single-image frequency-domain FLIM provides fast and photon-efficient lifetime data. Methods. 2015;6:3836. doi: 10.1038/nmeth.3836. [DOI] [PubMed] [Google Scholar]
  63. Reddy RJ, Gajadhar AS, Swenson EJ, Rothenberg DA, Curran TG, White FM. Early signaling dynamics of the epidermal growth factor receptor. PNAS. 2016;113:3114–3119. doi: 10.1073/pnas.1521288113. [DOI] [PMC free article] [PubMed] [Google Scholar]
  64. Ross WN, Reichardt LF. Species-specific effects on the optical signals of voltage-sensitive dyes. The Journal of Membrane Biology. 1979;48:343–356. doi: 10.1007/BF01869445. [DOI] [PubMed] [Google Scholar]
  65. Rothenberg P, Reuss L, Glaser L. Serum and epidermal growth factor transiently depolarize quiescent BSC-1 epithelial cells. PNAS. 1982;79:7783–7787. doi: 10.1073/pnas.79.24.7783. [DOI] [PMC free article] [PubMed] [Google Scholar]
  66. Schindelin J, Arganda-Carreras I, Frise E, Kaynig V, Longair M, Pietzsch T, Preibisch S, Rueden C, Saalfeld S, Schmid B, Tinevez JY, White DJ, Hartenstein V, Eliceiri K, Tomancak P, Cardona A. Fiji: an open-source platform for biological-image analysis. Nature Methods. 2012;9:676–682. doi: 10.1038/nmeth.2019. [DOI] [PMC free article] [PubMed] [Google Scholar]
  67. Thul PJ, Åkesson L, Wiking M, Mahdessian D, Geladaki A, Ait Blal H, Alm T, Asplund A, Björk L, Breckels LM, Bäckström A, Danielsson F, Fagerberg L, Fall J, Gatto L, Gnann C, Hober S, Hjelmare M, Johansson F, Lee S, Lindskog C, Mulder J, Mulvey CM, Nilsson P, Oksvold P, Rockberg J, Schutten R, Schwenk JM, Sivertsson Å, Sjöstedt E, Skogs M, Stadler C, Sullivan DP, Tegel H, Winsnes C, Zhang C, Zwahlen M, Mardinoglu A, Pontén F, von Feilitzen K, Lilley KS, Uhlén M, Lundberg E. A subcellular map of the human proteome. Science. 2017;356:eaal3321. doi: 10.1126/science.aal3321. [DOI] [PubMed] [Google Scholar]
  68. Tsuchiya W, Okada Y. Membrane potential changes associated with differentiation of enterocytes in the rat intestinal villi in culture. Developmental Biology. 1982;94:284–290. doi: 10.1016/0012-1606(82)90348-7. [DOI] [PubMed] [Google Scholar]
  69. Vallat R. Pingouin: statistics in python. Journal of Open Source Software. 2018;3:1026. doi: 10.21105/joss.01026. [DOI] [Google Scholar]
  70. Wang L. Measurements and implications of the membrane dipole potential. Annual Review of Biochemistry. 2012;81:615–635. doi: 10.1146/annurev-biochem-070110-123033. [DOI] [PubMed] [Google Scholar]
  71. Williams SR, Mitchell SJ. Direct measurement of somatic voltage clamp errors in central neurons. Nature Neuroscience. 2008;11:790–798. doi: 10.1038/nn.2137. [DOI] [PubMed] [Google Scholar]
  72. Wonderlin WF, Woodfork KA, Strobl JS. Changes in membrane potential during the progression of MCF-7 human mammary tumor cells through the cell cycle. Journal of Cellular Physiology. 1995;165:177–185. doi: 10.1002/jcp.1041650121. [DOI] [PubMed] [Google Scholar]
  73. Woodford CR, Frady EP, Smith RS, Morey B, Canzi G, Palida SF, Araneda RC, Kristan WB, Kubiak CP, Miller EW, Tsien RY. Improved PeT molecules for optically sensing voltage in neurons. Journal of the American Chemical Society. 2015;137:1817–1824. doi: 10.1021/ja510602z. [DOI] [PMC free article] [PubMed] [Google Scholar]
  74. Wulff H, Miller MJ, Hansel W, Grissmer S, Cahalan MD, Chandy KG. Design of a potent and selective inhibitor of the intermediate-conductance Ca2+-activated K+ channel, IKCa1: a potential immunosuppressant. PNAS. 2000;97:8151–8156. doi: 10.1073/pnas.97.14.8151. [DOI] [PMC free article] [PubMed] [Google Scholar]
  75. Yang M, Brackenbury WJ. Membrane potential and cancer progression. Frontiers in Physiology. 2013;4:1–10. doi: 10.3389/fphys.2013.00185. [DOI] [PMC free article] [PubMed] [Google Scholar]
  76. Yellen G, Mongeon R. Quantitative two-photon imaging of fluorescent biosensors. Current Opinion in Chemical Biology. 2015;27:24–30. doi: 10.1016/j.cbpa.2015.05.024. [DOI] [PMC free article] [PubMed] [Google Scholar]
  77. Zhang J, Davidson RM, Wei MD, Loew LM. Membrane electric properties by combined patch clamp and fluorescence ratio imaging in single neurons. Biophysical Journal. 1998;74:48–53. doi: 10.1016/S0006-3495(98)77765-3. [DOI] [PMC free article] [PubMed] [Google Scholar]
  78. Zhang H, Reichert E, Cohen AE. Optical electrophysiology for probing function and pharmacology of voltage-gated ion channels. eLife. 2016;5:e15202. doi: 10.7554/eLife.15202. [DOI] [PMC free article] [PubMed] [Google Scholar]
  79. Zheng K, Bard L, Reynolds JP, King C, Jensen TP, Gourine AV, Rusakov DA. Time-resolved imaging reveals heterogeneous landscapes of nanomolar Ca2+ in neurons and astroglia. Neuron. 2015;88:277–288. doi: 10.1016/j.neuron.2015.09.043. [DOI] [PMC free article] [PubMed] [Google Scholar]
  80. Zhou Y, Wong CO, Cho KJ, van der Hoeven D, Liang H, Thakur DP, Luo J, Babic M, Zinsmaier KE, Zhu MX, Hu H, Venkatachalam K, Hancock JF. Membrane potential modulates plasma membrane phospholipid dynamics and K-Ras signaling. Science. 2015;349:873–876. doi: 10.1126/science.aaa5619. [DOI] [PMC free article] [PubMed] [Google Scholar]

Decision letter

Editor: Lawrence Cohen1
Reviewed by: Bill Ross2, Leslie M Loew3, Bradley Baker4

In the interests of transparency, eLife includes the editorial decision letter and accompanying author responses. A lightly edited version of the letter sent to the authors after peer review is shown, indicating the most substantive concerns; minor comments are not usually included.

Thank you for submitting your article "Optical determination of absolute membrane potential" for consideration by eLife. Your article has been reviewed by four peer reviewers and the evaluation has been overseen by a Reviewing Editor and Richard Aldrich as the Senior Editor. The following individuals involved in review of your submission have agreed to reveal their identity: Bill Ross (Reviewer #1); Leslie M Loew (Reviewer #2); Bradley Baker (Reviewer #3).

We concluded that it was a potentially interesting and useful method and recommend "revise". We ask that you respond to all of the individual reviewers suggestions and criticisms as well as the items below.

We ask that you carry out additional experiments to compare your method with the method published previously by the Leslie Loew laboratory. In one cell type, determine whether your dye and FLIM give a better estimate of membrane potential than ratio imaging and wide-field imaging with the Les Loew dye.

Lastly, we ask that you be more circumspect in advertising the method. The title, "Optical determination of absolute membrane potential", and wording in the text imply that the method will have millivolt accuracy for every cell and every cell type. The results in the paper do not support such a claim. In addition, the limitations of the method should be more explicitly addressed in the Discussion section. Will the method break down for long recordings because the dye gets internalized? There is a claim that the FLIM measurement is sensitive only to membrane potential, but if you would like to state this you would have to test other variables such as temperature, membrane lipid composition, ion concentration, age of cultured cells etc.

Reviewer #1:

This paper describes measurements of membrane potential using FLIM of a class of fluorescent molecules previously shown to respond well to voltage via a PeT mechanism. FLIM of these molecules is much more sensitive to membrane potential changes and more accurately calibrated than similar measurements on GEVIs. The authors show how they calibrate these signals, how they can be used to assay the resting membrane potentials of large numbers of cells, and demonstrate one particular application of this technique to analyze the effect of EGF stimulation of human carcinoma cells. They suggest that this technique could have wide application in situations where it would be helpful to assay slow changes of membrane potential in many cells at the same time.

The measurements appear to be carefully done. I have only a few questions.

1) The paper suggests that all the measurements are made from the surface membrane of the cell, but they do not demonstrate this point. When they calibrate the changes in single cells using voltage clamp, they certainly only record the surface membrane signals. This is partly why the signals are so linear with little difference from cell to cell. But when they look at the resting potential, they cannot be sure there is no signal from internal compartments. They say that, "the vast majority of the fluorescence signal is voltage-sensitive and at the membrane." The confocal images support this claim. But there are no numbers, and confocal images will exaggerate the contribution of surface fluorescence. Since mitochondria and other internal compartments have membranes with different potentials, their contributions must be shown to be small.

2) They claim that the variation from cell to cell is about 20 mV. This appears to be an RMSD evaluation. Figure 1I seems to show that the variation from cell to cell is about 40 mV. These two numbers may be consistent, but in many cases the 40 mV range may the important one to consider. Physiological variations in membrane potential are usually much less than that amount.

Reviewer #2:

Overall, this is a careful and thorough study and could have practical applications for screening membrane potential in cell-based assays.

The novelty of this work is diminished, however, since Adam Cohen's lab has already published 2 papers (Hou, Venkatachalam and Cohen, 2014; Brinks, Klein and Cohen, 2015) showing that absolute membrane potential could be measured via time domain recordings. Some comparisons (subsection “VoltageFluor Fluorescence Lifetime Varies Linearly with Membrane Potential”) are made to CAESR from Brinks et al. (2015), which used 2-photon excited fluorescence lifetime measurements to determine absolute membrane potential with lower accuracy than in the current study.

Hou, Venkatachalam and Cohen (2014) reports on 1-photon time-domain measurements of Arch(D95H) and is not fully considered here. There, they report very little cell to cell variation and a sensitivity of a factor of 2 per 100 mV with accuracy of ~10 mV. These measurements are not of fluorescence lifetimes, but rather of voltage-dependent fast photochemical kinetics. Still, this Cohen paper does also show how time domain measurements can allow determination of absolute membrane potential with good accuracy and little cell to cell variability. So together these 2 older papers diminish the novelty of this report.

In subsection “Optical Determination of Resting Membrane Potential Distributions” the authors report ranges of Vmem at rest and in the presence of high K+. They refer to the calculations using the HGK equation to justify these ranges. However, in the Materials and Methods section, the authors acknowledge that they don't know the appropriate parameters needed by the HGK equation for these cells. Instead, they calculate the HGK equations with many combinations of parameters and claim that the resultant calculated range of values spans the measured range of values. But these ranges are so broad that any cell line would probably fit and really don't prove anything about the validity or accuracy of these resting potential estimates. We are also left with the open question of whether these variations are really due to differences in resting transmembrane potential or some other factor that could alter the lifetime, such as the membrane dipole potential. My lab showed many years ago that dual wavelength ratio imaging of electrochromic VSDs could be used to measure resting potential in single cells (Zhang et al., 1998). But there were some cell to cell differences and even differences in ratio within a single cell that could be attributed to membrane dipole potentials (see: Bedlack et al., 1994; Gross, Bedlack Jr and Loew, 1994). Dipole potentials arise from the particular lipid composition of the membrane and therefore can vary from cell line to cell line or along the surface of a differentiated neuron. I don't see any reason that the PeT mechanism used by VF2.1.Cl wouldn't also be sensitive to the electric field produced by the dipole potential. This could all be checked by doing current clamp measurements of resting potential in the same cell that you measure the fluorescence lifetime.

Exposing the cells to high K+ is likely to cause irreversible damage and any assumptions about specific levels of depolarization would be suspect. This might compromise the interpretation of several experiments.

Reviewer #3:

I have reviewed the manuscript, “Optical determination of absolute membrane potential”, where the authors employ fluorescent lifetime measurements (FLIM) to quantify membrane potential using a voltage sensing dye. This report is a major improvement over a previous attempt to use FLIM with a genetically encoded voltage indicator. While the information gained by optically measuring membrane potential in response to treatment with EGF shows the power of this technique, I have several concerns that should be addressed before I can completely support publication.

The last paragraph of the Introduction states that this approach can be used in a range of biological contexts. The most glaring concern is what is not in this report. There are no recordings of membrane potential from excitable cells. Why? I see from Figure 1—figure supplement 1 the temporal time scale is in seconds. Is this the problem with recording from neurons? If so, please state this in the main text. If not, please state why.

The last paragraph of the Introduction states a 20-fold improvement in accuracy over previous optical methods yet there is no direct comparison in the manuscript. Please move the CAESR data from the supplementary material (Figure 1—figure supplement 5) into Figure 1. Subsection “VoltageFluor Fluorescence Lifetime Varies Linearly with Membrane Potential” also compares VF2.1.Cl to the genetically encoded voltage indicator giving another reason to include the CAESR data into Figure 1.

In Figure 1G there is a significant range of lifetime measurements in a single cell for the +40 mV membrane potential but it is uniform at +80 mV. Why is that? Is this a common occurrence? I noticed the same thing in the CAESR paper which I contributed to the probe not really working. Perhaps this is a function of lifetime imaging? Or the binning protocol? I think it would also be helpful to have Scheme 2 be Figure 1 to show how the measurement is made and change current Figure 1 to Figure 2.

In subsection “VoltageFluor Fluorescence Lifetime Varies Linearly with Membrane Potential” the authors state that the fractional change in τ(22.4 +/- 0.4%) is in good agreement with the ∆F/F value of 27%. Am I to infer from this that the ∆F/F value is due primarily to a change in lifetime fluorescence? If so, why not use ∆F/F to quantitate membrane potential?

In subsection “VoltageFluor Fluorescence Lifetime Varies Linearly with Membrane Potential” the resolution of membrane potential for a cell is estimated at 4 mV for intra-cellular measurements and 20 mV between different cells. Figure 1H and I show that the slope is more consistent than the absolute value of Lifetime fluorescence. However, this claim is important and should be demonstrated experimentally. Please add a supplementary figure showing 4 mV steps effect on lifetime measurements.

Subsection “VoltageFluor Fluorescence Lifetime Varies Linearly with Membrane Potential” states a resolution of 390 mV. That number does not make sense. Is it supposed to be 39 mV?

Subsection “Evaluation of VF-FLIM across Cell Lines and Culture Conditions” states that despite the variances shown in Figure 2A, all cell lines' membrane potential can be resolved at or under 5 mV. Please show this for CHO cells since it has the most varied slope and MCF-7 cells which showed the highest variance for 0 mV measurement.

Reviewer #4:

I felt that the paper promises more than was delivered. The paper claims to have developed "a new method for optically quantifying absolute membrane potential in living cells.....with single cell resolution".

Figure 2I shows that the fluorescence is not a measure of the absolute voltage but that each cell has a different FLIM vs. voltage curve. Thus, calibration with an electrode is needed. Furthermore, the cell to cell differences are not the same from one cell type to another; MCF-7 cells displayed greater variability than other cell lines tested (Figure 2B). Thus, calibration for a new cell type will need to include measuring the FLIM vs. voltage response from many cells.

Many images show blobs (Figure 1E and F, Figure 2C, Figure 3, Figure 4, Figure 5B). Sometimes the blobs seem voltage dependent, sometimes not. I would presume that the blobs are the result of non-specific staining. This subject was not discussed. Were the presented images selected for relatively good membrane staining?

In Figure 4A and Figure 5B different parts of the cell membrane appear to have different voltage responses and these response differences do not seem to be stochastic. This result does not fit with expected membrane voltage uniformity for small cells.

Drawbacks of the method are not discussed. The time resolution seems relatively slow. Will the method will be applicable to preparations with substantial light scattering? How will it work in three dimensional preparations? The differences from cell type to cell type will require calibration for each cell type and perhaps for each developmental age of each cell type.

[Editors' note: further revisions were requested prior to acceptance, as described below.]

Thank you for resubmitting your work entitled "Optical estimation of absolute membrane potential using fluorescence lifetime imaging" for further consideration at eLife. Your revised article has been favorably evaluated by Richard Aldrich (Senior Editor), and Lawrence Cohen (Reviewing Editor), and three other reviewers. The following reviewer has agreed to share their identity: Leslie M Loew (Reviewer #2).

The manuscript has been improved but there are some remaining issues that need to be addressed before acceptance, as outlined below:

Reviewer #1:

I am satisfied with the revision.

Reviewer #2:

The authors have significantly revised and thereby strengthened the paper. In particular, they did scale back on some of the over-enthusiastic claims for their method. They also did a good job comparing their method to previous lifetime-based and dual wavelength ratio-based approaches. The new method with the VF dyes is indeed more sensitive and seems to have less cell to cell variability for estimating absolute Vmem. I appreciate the clearer explanation of how the GHK equation was used to understand the high K+ experiments. I still would have preferred some current clamp electrophysiology experiments to validate the resting potential determinations, but this is not essential. There are still 2 areas related to my own previous work where there is need for some clarification:

1) In comparing the ratiometric electrochromic dyes in the Introduction, they state: "Although they benefit from simpler loading procedures, signals from electrochromic styryl dyes display a strong dependence on local membrane properties other than transmembrane potential, reducing the accuracy of Vmem determinations (Gross et al., 1994; Montana et al., 1989; Zhang et al., 1998)". This is correct when examining different cell lines or cells in different states of differentiation, where the lipid composition, for example, can affect the ratio. But saying this in the Introduction appears to suggest that the new method that is about to be described does not have this problem; it likely does and even shows differences within the same cell line. And, actually, examination of Figure 2 in Zhang et al. (1998) shows that the cell to cell variation for the normalized ratiometric approach is remarkably small for the 40 cells examined. Figure 4 in Zhang et al. (1998) shows remarkably little variation in Vrest for undifferentiated neuroblastoma cells; the small variation in Vrest for differentiated cells, may be attributed to different degrees of differentiation.

2) In discussing the influence of membrane dipole potential, the authors misunderstand some of the studies from my lab, subsection “Resolution of VF-FLIM: Voltage, Space, and Time”:

"Relative to di-8-ANEPPS, where this effect was documented (Gross et al., 1994; Zhang et al., 1998), VF-FLIM displays less cell to cell variability, suggesting reduced dependence on the membrane dipole potential. The reason for this is unclear, as both sensors putatively detect Vmem from within the plasma membrane (Loew et al., 1979; Miller et al., 2012)." Our studies deliberately sought to establish the sensitivity of d-8-ANEPPS to dipole potential by systematically measuring ratios with different lipid compositions in lipid vesicles and by adding or depleting cholesterol in cell membranes. As a side benefit, these studies showed that membrane composition had to be considered when using dual wavelength ratio measurements to determine absolute Vmem. Until the authors do a deliberate investigation of this effect on FLIM of their probes, I don't think they can say that FLIM of the VF dyes is less sensitive to membrane composition.

Reviewer #3:

No further major comments.

Reviewer #4:

The revision is greatly improved. However, there are several areas where the paper remains overstated.

In the Abstract add the words "in culture" after the words "single cell resolution".

The first paragraph of the Introduction leads the reader to think that the paper is about signals that can be measured rapidly and can be measured in complex tissues even though the reported measurements have a time resolution that is ~four orders of magnitude slower than presently available from other methods and the measurements are only from single cells in culture. This needs toning down. The timing issue would be clearer for the reader if the table in subsection "Acquisition Time and Effective Pixel Size in Lifetime Data”" was in the main body of the paper.

A discussion of the difficulties of applying this method to other applications should be added to the Discussion section.

The Discussion section notes that faster apparatus is available. How much faster? One order?

Please discuss the possible explanations for "between regions" in the following sentence in the Discussion section: "Intriguingly, there are differences in lifetime within some cells in VF-FLIM images, both at the pixel to pixel level and between regions of the cell membrane."

eLife. 2019 Sep 23;8:e44522. doi: 10.7554/eLife.44522.040

Author response


We ask that you carry out additional experiments to compare your method with the method published previously by the Leslie Loew laboratory. In one cell type, determine whether your dye and FLIM give a better estimate of membrane potential than ratio imaging and wide-field imaging with the Les Loew dye.

First and foremost, we would like to apologize for omitting any mention of the ratiometric voltage sensors developed by Leslie Loew in our original submission. We thank the reviewers for pointing out this oversight and giving us an opportunity to address this.

We performed wide-field epifluorescence imaging of di-8-ANEPPS excitation ratios as requested (Figure 1—figure supplement 5) and compared the voltage resolution with VF-FLIM. We find that VF-FLIM outperforms di-8-ANEPPS in voltage resolution by 8-fold. With di-8-ANEPPS in HEK293T, we record a membrane potential resolution of 150 mV (“inter cell,” see Materials and Methods section); with VF-FLIM this resolution is 19 mV. We have incorporated description of these data in the subsection “VoltageFluor Fluorescence Lifetime Varies Linearly with Membrane Potential”, as well as in subsection “Resolution of VF-FLIM: Voltage, Space, and Time”.

Imaging and data processing for di-8-ANEPPS are described in the subsection “Di-8-ANEPPS Ratio-based Imaging”; we matched experimental conditions described by Zhang et al. (1998) as closely as possible with our microscope.

Notably, di-8-ANEPPS has 3-fold better Vmem resolution than the GEVI CAESR, our previous point of comparison. We appreciate this insightful experiment suggestion from the reviewers, as inclusion of the di-8-ANEPPS data has allowed us to more comprehensively compare VF-FLIM with the previous state-of-the-art in optical Vmem determinations.

Lastly, we ask that you be more circumspect in advertising the method. The title, "Optical determination of absolute membrane potential", and wording in the text imply that the method will have millivolt accuracy for every cell and every cell type. The results in the paper do not support such a claim.

We appreciate this feedback about representation of the VF-FLIM method, as well as the opportunity to offer clarification. We were surprised to hear that the reviewers got the impression of 1 mV accuracy in all cell types from the text. This was not our intent.

In our original submission, we report the accuracy as ~20 mV for absolute Vmem (“inter-cell” comparisons) and ~5 mV for absolute Vmem changes (“intra-cell” comparison). In the original submission, the values for the 5 tested cell lines can be found in subsection “VoltageFluor Fluorescence Lifetime Varies Linearly with Membrane Potential” and in Figure 2—source data 1. These data are still present in our revised manuscript. In our initial submission, we also show all of our single-cell electrophysiology results for all cell types/lines (Figure 1F-J, Figure 2, and Figure 2—figure supplement 1), which gives the reader a transparent view of the lifetime data.

We believe that some of the misunderstanding may arise from the term “absolute Vmem.” Absolute Vmem, in our usage, does not imply any particular level of voltage resolution. The term absolute Vmem has been used previously in the literature to describe optical Vmem recordings that can be interpreted as Vmem rather than arbitrary fluorescence units (Hou et al., 2014 and Brinks et al., 2015). We have clarified the meaning of this term in the Introduction and added additional mention of the voltage resolution.

Regarding the advertising of the method, we are excited about VF-FLIM and the advantages that it brings to the field. We had no intention of misleading readers. We have therefore carefully reviewed the entire manuscript in detail and identified areas with ambiguous, or potentially confusing, text about the performance of VF-FLIM. We have made the following updates in this revised version, which we believe provides a transparent and well-rounded description of VF-FLIM.

1) We restructured and expanded the early paragraphs of subsection “Resolution of VF-FLIM: Voltage, Space, and Time” to address the different dimensions of VF-FLIM’s resolution (voltage, space, and time).

2) We elaborated upon factors other than Vmem that can affect lifetime (Introduction, subsection “Resolution of VF-FLIM: Voltage, Space, and Time”). We also added a reference to an excellent review that discusses this topic in depth (Berezin and Achilefu, 2010).

3) We recognize that the second-timescale acquisitions of VF-FLIM make certain applications challenging (especially those in excitable cells), so we have added this information to the Introduction in anticipation of questions from readers.

4) We have edited the language describing the scope of biological applications tested throughout the text, as all of the data presented here are in cultured cell lines. We have changed the less specific terms “cell type” and “biological context” to “cell line” when we refer to the experiments we performed.

5) We have added specific commentary in the Discussion about the requirement for initial calibration (subsection “Resolution of VF-FLIM: Voltage, Space, and Time”). We believe the importance of calibration is clear from the abundance of voltage clamp data throughout the manuscript, but we want to be sure that readers are bearing this in mind when they consider other possible applications of VF-FLIM.

6) We added a new Scheme 2 to the Materials and methods section, which graphically describes the voltage resolution (reported as root mean square deviation, RMSD) calculations and supplements existing mathematical description in the text. In addition, we now state that the reported Vmem resolutions are RMSD-based when we mention them in the main text.

7) We agree that the title would benefit from additional specificity, so we propose “Optical estimation of absolute membrane potential using fluorescence lifetime imaging”.

In addition, the limitations of the method should be more explicitly addressed in the Discussion section. Will the method break down for long recordings because the dye gets internalized? There is a claim that the FLIM measurement is sensitive only to membrane potential, but if you would like to state this you would have to test other variables such as temperature, membrane lipid composition, ion concentration, age of cultured cells etc.

We appreciate the invitation to discuss the nuances of FLIM further, and we have amended the Discussion section to reflect the reviewers’ points. We are not able to find a location in our original submission where we state that FLIM is only dependent on Vmem, and we certainly did not mean to imply it. Our best guess is that the confusion arose in the Introduction, where we discuss how FLIM avoids drawbacks of intensity imaging. We have modified this text to make it clear that FLIM is not a panacea.

In our original submission, we included detailed analysis of the dependence of VoltageFluor lifetime on certain factors other than Vmem: (a) dye concentration (subsection “VoltageFluor Fluorescence Lifetime Varies Linearly with Membrane Potential”, subsection “Evaluation of VF-FLIM across Cell Lines and Culture Conditions”, Figure 1—figure supplement 2 and Figure 2—figure supplement 4); (b) cell groups vs. individual cells, (c) and in culture conditions involving removal of serum (subsection “Evaluation of VF-FLIM across Cell Lines and Culture Conditions”,, Figure 2—figure supplement 3). We did not see substantial changes in VF-FLIM under these different growth conditions.

This information is key to readers who wish to implement VF-FLIM in their own laboratories.

Nevertheless, we do agree with the reviewers that the previous discussion did not provide sufficient commentary on potential pitfalls of the approach. We have included more discussion of this (Introduction, subsection “Resolution of VF-FLIM: Voltage, Space, and Time”). We also included additional specificity about FLIM’s time resolution and discussed the variability in lifetime between pixels in images, which is most likely noise from the biexponential fitting process (subsection “Resolution of VF-FLIM: Voltage, Space, and Time”).

We would like to specifically address some of the potential confounding factors mentioned by the reviewers above. We did not test effects of temperature and ion concentration because these variables are tightly constrained by the biological system of interest. The cellular toxicity from dramatic shifts in temperature or ionic strength would likely supersede effects on the lifetime-Vmem calibration and make electrophysiology challenging. However, we now mention these potential confounding factors in subsection “Resolution of VF-FLIM: Voltage, Space, and Time”. Regarding age and condition of cultured cells, we used cells ranging from freshly thawed to passage 25 (as documented in subsection “Cell culture”) and did not see any obvious trends with passage number.

The effects of membrane composition on voltage sensors are highly nuanced and interesting. We had previously omitted this from the Discussion because we did not want to speculate excessively as to which factors limit the resolution in VF-FLIM recordings. Membrane composition is inherently complex and difficult to assess comprehensively. While membrane compositional differences between cells perhaps contributes to the noise in VF-FLIM, we have not conclusively shown that majority of the noise in our Vmem measurements is the result of membrane composition. We agree, though, that knowledge of this possible confounding factor is important for readers and potential future users of the method, so we now mention this in subsection “Resolution of VF-FLIM: Voltage, Space, and Time”.

Regarding stability of VF2.1.Cl stain on the plasma membrane, we retain good membrane staining and see relatively little internalized dye, even following two hours of incubation of stained cells at 37°C. We believe that the high percentage of active, correctly localized VoltageFluor is one source of the Vmem resolution improvements over other optical strategies. Some punctate fluorescence spots do accumulate, but they are generally separable from the membrane fluorescence and do not interfere with recordings. These puncta are presumably attributable to internalized dye. We show that these puncta have little effect in Author response image 1, where we analyze VF-FLIM data using pixels from the cell’s interior in addition to pixels from the plasma membrane. Furthermore, in previous work, we have shown that the vast majority of the VF signal is located at the membrane (through quenching experiments with Trypan Blue in Grenier et al., 2019).

Author response image 1. Effect of internal signal on HEK293T VF-FLIM calibrations.

Author response image 1.

(A) Illustration of different regions of interest (ROIs) used for processing the data. All VF-FLIM analysis in other parts of the manuscript was performed with “membrane” ROIs. Whole cell ROIs include all interior pixels that are above the threshold for lifetime fitting (300 peak photons, see Materials and Methods section). (B) Effect of internal signal on the sensitivity (slope) of the HEK293T τfl-Vmem data shown in Figure 1 of the main text. Gray points are results from individual cells; aggregated data are shown as mean ± SEM of n=17 cells. (C) Effect of internal signal on the 0 mV lifetime (y-intercept) of the lifetime-Vmem calibration. P values for (B) and (C) were determined using paired Student’s t tests.

Reviewer #1:

[…]

1) The paper suggests that all the measurements are made from the surface membrane of the cell, but they do not demonstrate this point. When they calibrate the changes in single cells using voltage clamp, they certainly only record the surface membrane signals. This is partly why the signals are so linear with little difference from cell to cell. But when they look at the resting potential, they cannot be sure there is no signal from internal compartments. They say that, "the vast majority of the fluorescence signal is voltage-sensitive and at the membrane." The confocal images support this claim. But there are no numbers, and confocal images will exaggerate the contribution of surface fluorescence. Since mitochondria and other internal compartments have membranes with different potentials, their contributions must be shown to be small.

The specificity of the stain is an important point; we have looked at this in a few different ways. First, although the VF-FLIM data shown here were taken on a laser scanning confocal, we use a relatively large pinhole (2.5-3.5 Airy units, which corresponds to a ~2.5 µm optical section). We choose to sacrifice optical sectioning for the sake of photon count, as exponential fitting of lifetime data requires large numbers of photons. We have added this information to the subsection “Acquisition Time and Effective Pixel Size in Lifetime Data“. Second, in previously published work (Grenier et al., 2019), our lab determined that >80% of the signal from VF2.1.Cl at the cell membrane can be quenched by the addition of extracellular trypan blue. This experiment was performed under epifluorescence conditions, and it is a conservative estimate of the percentage of plasma membrane signal, as it is unlikely that trypan blue would completely quench all plasma membrane associated dye.

To answer your question for VF-FLIM specifically, we quantified the contribution of internal signal in one of our lifetime datasets (see Author response image 1). We processed the HEK293T lifetime-Vmem electrophysiology calibration data with different regions of interest (ROIs, Author response image 1A) to explore the effects of internal signal. In this analysis, we documented the effect of including all interior pixels (“whole cell”) ROIs instead of just selecting membrane pixels (Author response image 1B,C). Inclusion of this interior signal produces a small decrease in both the average slope (3.2 ± 0.1 ps/mV including the interior versus 3.50 ± 0.08 ps/mV with plasma membrane only, p = 0.033; data are mean ± SEM and p values are from a paired Student’s t-test) and average 0 mV lifetime (1.74 ± 0.02 ns including the interior versus 1.77 ± 0.02 ps/mV with plasma membrane only, p = 0.26). Using one slope and intercept estimate as opposed to the other results in Vmem values that differ by less than 10 mV in the range -100 to 0 mV.

Because we have reasonable spatial resolution in our images, it is feasible to select an ROI that largely encompasses the plasma membrane. Selection of different, smaller ROIs does not introduce systematic error into the measured lifetimes, which indicates that the vast majority of signal in all areas of the cell results from plasma membrane-localized VF2.1.Cl.

Taken together, these analyses reveal that the internal signal from VF2.1.Cl stain is minimal and does not interfere with VF-FLIM measurements.

2) They claim that the variation from cell to cell is about 20 mV. This appears to be an RMSD evaluation. Figure 1I seems to show that the variation from cell to cell is about 40 mV. These two numbers may be consistent, but in many cases the 40 mV range may the important one to consider. Physiological variations in membrane potential are usually much less than that amount.

Yes, the voltage resolution calculations are based on an RMSD. We now clearly state this in the main text (Introduction, subsection “VoltageFluor Fluorescence Lifetime Varies Linearly with Membrane Potential”), in addition to our description in the subsection “Resolution of VF-FLIM Voltage Determination”. A similar calculation was also performed in previous work with GEVIs (Hou et al., 2014) to determine voltage accuracy of their approach. We agree that the spread, not the RMSD, estimates the maximal potential error in an individual measurement. Given the throughput of VF-FLIM, we envision that the vast majority of users will be repeating their measurements multiple times, in which case measures of standard deviation are more informative. To illustrate the resolution calculations more clearly, we have expanded upon our description of this (subsection “Resolution of VF-FLIM Voltage Determination”) and added a new Scheme 2 to the Materials and Methods section, which graphically depicts the RMSD calculation as well as the spread of the HEK293T data. We also report all of the single cell lifetime-membrane potential standard curves, which show the full raw datasets and thereby illustrate spread (Figure 1, Figure 2, Figure 2—figure supplement 1).

Reviewer #2:

[…]

The novelty of this work is diminished, however, since Adam Cohen's lab has already published 2 papers (Hou, Venkatachalam and Cohen, 2014; Brinks, Klein and Cohen, 2015) showing that absolute membrane potential could be measured via time domain recordings. Some comparisons (subsection “VoltageFluor Fluorescence Lifetime Varies Linearly with Membrane Potential”) are made to CAESR from Brinks et al. (2015), which used 2-photon excited fluorescence lifetime measurements to determine absolute membrane potential with lower accuracy than in the current study.

We recognize and appreciate the contribution of Adam Cohen’s lab in this area. We demonstrate that the use of VoltageFluors rather than CAESR with FLIM greatly improves the voltage resolution of absolute membrane potential recordings (Figure 1—figure supplement 4); this voltage resolution improvement makes it possible to map biological Vmem signals optically.

Hou, Venkatachalam and Cohen (2014) reports on 1-photon time-domain measurements of Arch(D95H) and is not fully considered here. There, they report very little cell to cell variation and a sensitivity of a factor of 2 per 100 mV with accuracy of ~10 mV. These measurements are not of fluorescence lifetimes, but rather of voltage-dependent fast photochemical kinetics. Still, this Cohen paper does also show how time domain measurements can allow determination of absolute membrane potential with good accuracy and little cell to cell variability. So together these 2 older papers diminish the novelty of this report.

The use of fast photochemical kinetics with Arch(D95H) to record membrane potential is indeed an interesting strategy. We were unable to compare VF-FLIM directly to this approach because we lack instrumentation suitable for fast photochemical kinetics. We have amended the Introduction to state this more explicitly. Unlike the instruments for fast photochemical kinetics used in Hou, et al. (2014), lifetime instruments are commercially available from a number of different suppliers. Therefore, we believe that FLIM may be a more accessible strategy for general use in absolute membrane potential recording. Additionally, the presence of non-specific intracellular fluorescence is a major concern with GEVI-based absolute Vmem strategies. To remedy this, GEVI-based images (including those in Hou et al., 2014) are often masked or processed to include only pixels responding to an external stimulus in the analysis. Such image processing becomes challenging when there are no fast dynamics in Vmem, as is the case with resting membrane potential or slow changes. Thus, we believe that VF-FLIM represents an important step forward in feasibility, resolution, and ease of interpretation of absolute Vmem data.

In subsection “Optical Determination of Resting Membrane Potential Distributions” the authors report ranges of Vmem at rest and in the presence of high K+. They refer to the calculations using the HGK equation to justify these ranges. However, in the Materials and Methods section, the authors acknowledge that they don't know the appropriate parameters needed by the HGK equation for these cells. Instead, they calculate the HGK equations with many combinations of parameters and claim that the resultant calculated range of values spans the measured range of values. But these ranges are so broad that any cell line would probably fit and really don't prove anything about the validity or accuracy of these resting potential estimates.

We do not mean to imply that the Goldman equation with estimated permeabilities and ion concentration is in any way an accurate prediction of membrane potential. To provide direct support for our optically recorded resting membrane potentials, we cite literature examples of whole cell patch clamp recordings of resting membrane potential for each cell line in Figure 3—source data 1. Because high K+ electrophysiology recordings are uncommon in the literature, our intention with the Goldman equation calculations was to provide some context for the high K+ VF-FLIM measurements (Figure 3, Figure 3—figure supplement 1 and Figure 3—figure supplement 2). It was initially counter-intuitive to us that the 120 mM K+ treatment does not depolarize all cells to 0 mV, so we wanted to provide a basis for the ranges we observe. Indeed, with the Goldman equation, we predict that variations in the intracellular ion concentrations and permeabilities can produce a range of Vmem values at 120 mM external K+. We have modified the text in the Results and Materials and Methods sections to make this clear (subsection “Optical Determination of Resting Membrane Potential Distributions”, Materials and methods section).

We are also left with the open question of whether these variations are really due to differences in resting transmembrane potential or some other factor that could alter the lifetime, such as the membrane dipole potential. My lab showed many years ago that dual wavelength ratio imaging of electrochromic VSDs could be used to measure resting potential in single cells (Zhang et al., 1998). But there were some cell to cell differences and even differences in ratio within a single cell that could be attributed to membrane dipole potentials (see: Bedlack et al., 1994; Gross, Bedlack Jr and Loew, 1994.). Dipole potentials arise from the particular lipid composition of the membrane and therefore can vary from cell line to cell line or along the surface of a differentiated neuron. I don't see any reason that the PeT mechanism used by VF2.1.Cl wouldn't also be sensitive to the electric field produced by the dipole potential. This could all be checked by doing current clamp measurements of resting potential in the same cell that you measure the fluorescence lifetime.

We apologize for not initially referencing work using di-8-ANEPPS to record absolute Vmem optically; this was an oversight on our part. We address first our quantification of non-Vmem factors, followed by discussion of the effects of membrane dipole potential.

The RMSD-based resolution calculations we performed quantify the effects of variations in any non-Vmem factors on the lifetime measurement. Anything that is not Vmem but changes lifetime (including membrane composition) would be seen as a higher RMSD between the theoretical Vmem from electrophysiology and the value of our lifetime measurement. We have modified the text in the subsection “Resolution of VF-FLIM Voltage Determination” and added a Scheme 2 to clarify our resolution calculations.

The RMSD-based resolution that we calculate gets at the same idea as the simultaneous current clamp and fluorescence ratio experiments described with di-8-ANEPPS ratios (Zhang et al., 1998). In both cases, a Vmem recorded with electrophysiology is compared to a simultaneous optical estimate of Vmem on that cell, and any difference between the two is presumed to arise from artifacts in the lifetime measurement. The difference between our approach here and the published one is the use of voltage clamp versus current clamp mode in the electrophysiology. This change shouldn’t make a difference in the case of HEK293T, which can be voltage clamped accurately over a relatively large range of Vmem.

Regarding the effects of the membrane dipole potential absolute Vmem recordings, it is intriguing to compare our results with di-8-ANEPPS to those with VF2.1.Cl. We have added this comparison to the manuscript, both as a figure supplement (Figure 1—figure supplement 5) and as additional text (subsection “VoltageFluor Fluorescence Lifetime Varies Linearly with Membrane Potential”, subsection “Resolution of VF-FLIM: Voltage, Space, and Time”). In these experiments, we observed that the Vmem resolution of VF-FLIM is ~8 fold better than the Vmem resolution of di-8-ANEPPS ratios (19 mV inter-cell resolution for VF-FLIM vs. 150 mV for di-8-ANEPPS in HEK293T). Put another way, VF-FLIM is 8-fold less sensitive to factors other than Vmem than di-8-ANEPPS based ratio measurements. This result is a bit surprising: both probes sense Vmem from within the hydrophobic core of the membrane and therefore could be affected by the membrane dipole potential.

Two possibilities seem likely to us: either (1) VF2.1.Cl is less sensitive to the membrane dipole potential than di-8-ANEPPS or (2) some of the variability in di-8-ANEPPS measurements is from factors other than the membrane dipole potential. Both of these explanations are plausible, and both may play some role. The fluorescein chromophore in VF2.1.Cl is putatively not in the plasma membrane (Kulkarni et al., 2017), which may partially insulate VFs from dipole potential effects. We also did not see differences in the lifetime-Vmem calibration in serum-starved versus normally cultured A431 cells (Figure 2—figure supplement 3). Such a growth perturbation is likely to have some effect on membrane composition and dipole potential. Towards point (2), in our hands, the VF2.1.Cl stain appears to be more stably and specifically localized to the plasma membrane than the di-8-ANEPPS stain, so some variability in di-8-ANEPPS signals may be from probe that is adhered to the coverslip or internalized in the immediate vicinity of the membrane (and is therefore not spatially separable, even with a membrane-only ROI).

In sum, the inter-cell Vmem resolution values include contributions from all non-Vmem factors, including membrane composition effects. We agree that it is important for readers to know about possible effects of membrane composition, so we now address this, as well as other potential confounding factors in FLIM measurement, in the subsection “Resolution of VF-FLIM: Voltage, Space, and Time”.

Exposing the cells to high K+ is likely to cause irreversible damage and any assumptions about specific levels of depolarization would be suspect. This might compromise the interpretation of several experiments.

We agree with this assessment of high K+ toxicity. We largely use the high K+ disruption as an endpoint perturbation to get a sense of the shift in resting membrane potential distributions (Figure 3 and supplements). We also used high K+ as one piece of evidence to suggest that the current was K+ mediated in the pharmacology studies with EGF treatment of A431 cells (Figure 5A, and Figure 5—figure supplement 1B). In the absence of any other data, we agree this result would not be conclusive. However, we also see loss of the hyperpolarizing response in A431 cells when Ca2+ activated K+ channels are blocked more specifically with CTX and TRAM-34 (Figure 5A, and Figure 5—figure supplement 1D,E), as well as when intracellular Ca2+ is perturbed by addition of the intracellular Ca2+ chelator, BAPTA-AM (Figure 5A, and Figure 5—figure supplement 1G). The interpretation that the hyperpolarizing step is mediated by KCa3.1 does not hinge on the high K+ perturbation alone.

Reviewer #3:

[…]

The last paragraph of the Introduction states that this approach can be used in a range of biological contexts. The most glaring concern is what is not in this report. There are no recordings of membrane potential from excitable cells. Why? I see from Figure 1—figure supplement 1 the temporal time scale is in seconds. Is this the problem with recording from neurons? If so, please state this in the main text. If not, please state why.

“Biological contexts” is an ambiguous term. We have edited the Introduction to read “cell lines,” which is the context in which we have demonstrated VF-FLIM’s function in this work.

We focused on non-excitable cells in this work, as our current research interests lie in slower changes in resting membrane potential present in these systems. That said, the time resolution of the FLIM approach does make recording of action potentials from neurons challenging. In our original manuscript, we outlined this in Figure 1—source data 1. We now have incorporated this point more prominently in both the Introduction and subsection “Resolution of VF-FLIM: Voltage, Space, and Time”. While it will probably be always be challenging to accurately record lifetimes at the ~1 kHz frame rate required for neuronal activity imaging, VF-FLIM could likely be used to analyze resting membrane potentials of neurons or other excitable tissue. However, the VoltageFluor used in this text (VF2.1.Cl) labels all plasma membranes, not just those of particular cells of interest. In samples with complex processes and intertwined membranes, attribution of signal to a particular cell is challenging. In the Discussion section, we mention that the use of VF-FLIM in more complex samples and tissues may be most successful in conjunction cell-targeted VoltageFluors, which is ongoing work in our laboratory (e.g. Liu et al., 2017; Grenieret al., 2019).

The last paragraph of the Introduction states a 20-fold improvement in accuracy over previous optical methods yet there is no direct comparison in the manuscript. Please move the CAESR data from the supplementary material (Figure 1—figure supplement 5) into Figure 1. Subsection “VoltageFluor Fluorescence Lifetime Varies Linearly with Membrane Potential” also compares VF2.1.Cl to the genetically encoded voltage indicator giving another reason to include the CAESR data into Figure 1.

We have now added another direct comparison to VF-FLIM, this time an assessment of the ratio-based VSD, di-8-ANEPPS, to Figure 1—figure supplement 4. Together with the comparison to CAESR, which should be readily accessible to readers in eLife’s online format, we think that this does a nice job of comparing alternative methods for estimation of absolute Vmem. We now include additional discussion of these comparisons in the main text (subsection “VoltageFluor Fluorescence Lifetime Varies Linearly with Membrane Potential”, subsection “VoltageFluor Fluorescence Lifetime Varies Linearly with Membrane Potential”).

In Figure 1G there is a significant range of lifetime measurements in a single cell for the +40 mV membrane potential but it is uniform at +80 mV. Why is that? Is this a common occurrence? I noticed the same thing in the CAESR paper which I contributed to the probe not really working. Perhaps this is a function of lifetime imaging? Or the binning protocol? I think it would also be helpful to have Scheme 2 be Figure 1 to show how the measurement is made and change current Figure 1 to Figure 2.

The pixel to pixel differences in lifetime are interesting, and we didn’t discuss this sufficiently in the original manuscript. We have added text to subsection “VoltageFluor Fluorescence Lifetime Varies Linearly with Membrane Potential” to address this for the readers. We also moved the former Scheme 2 about how the FLIM measurements are made to be Figure 1—figure supplement 1 so that it is more readily accessible, especially in the eLife online format.

We believe the pixel to pixel variability is primarily noise in the measurement, as the Vmem of a small, approximately spherical cell should be uniform. The differences between pixels occur at a constant rate at different potentials, but the rainbow color scale perhaps highlights the differences in some color ranges more than others. The pixel to pixel variability seems to be random noise in the measurement. The most likely source of this noise is the fitting of lifetime data to a biexponential model. Lifetime values at the pixel level are determined from 20 to 100-fold fewer photons than the lifetime value for the region of interest as a whole. This reduction in signal leads to an increase in noise at single pixels versus the region of interest overall. We do not interpret pixel to pixel differences as Vmem differences in our studies. In principle, more photons could be acquired per pixel to decrease this variability and enable subcellular interpretation, although it would result in longer acquisition times.

In subsection “VoltageFluor Fluorescence Lifetime Varies Linearly with Membrane Potential” the authors state that the fractional change in τ(22.4 +/- 0.4%) is in good agreement with the ∆F/F value of 27%. Am I to infer from this that the ∆F/F value is due primarily to a change in lifetime fluorescence? If so, why not use ∆F/F to quantitate membrane potential?

ΔF/F is still fundamentally a fluorescence intensity measurement, so it suffers from the fluorescence intensity artifacts that we discuss in the Introduction. ΔF/F therefore cannot be robustly calibrated as absolute Vmem. A deeper discussion of this topic, as well as how lifetime avoids many of these issues, is available in a review we cite in our Introduction (Yellen and Mongeon, 2015). We also add a citation to an excellent review by Berezin and Achilefu (2010), that provides additional context and clarification for using FLIM (vs. intensity-only measurements) in biological contexts.

We mention the agreement with ΔF/F because it is relevant for our hypothesis that VoltageFluor-type dyes sense voltage via a photoinduced electron transfer (PeT) mechanism. For PeT-based sensors, fluorescence lifetime and fluorescence intensity should be complementary readouts of the same PeT process, although each is useful for different biological applications. The similarity in the ΔF/F and Δτ/τ is consistent with our conclusion that the lifetime recordings represent voltage sensing via a PeT-based mechanism (but, of course, does not entirely rule out other mechanisms). We have modified subsection “VoltageFluor Fluorescence Lifetime Varies Linearly with Membrane Potential” to clarify this point.

In subsection “VoltageFluor Fluorescence Lifetime Varies Linearly with Membrane Potential” the resolution of membrane potential for a cell is estimated at 4 mV for intra-cellular measurements and 20 mV between different cells. Figure 1H and I show that the slope is more consistent than the absolute value of Lifetime fluorescence. However, this claim is important and should be demonstrated experimentally. Please add a supplementary figure showing 4 mV steps effect on lifetime measurements.

The values of our voltage resolution are root mean square deviations (RMSD) measurements, which give a sense of the ‘typical’ amount of error in a measurement (or, put another way, give a sense of our limit of detection). Determination of this RMSD does not require voltage clamping a cell every 4 mV, although the RMSD we determine indicates that statistically significant differences would be seen when comparing a few patches at, say -56 mV, with measurements at, say -60 mV. To clarify where our resolution estimates are coming from, we have expanded/modified our discussion of accuracy and the RMSD calculation (subsection “Resolution of VF-FLIM Voltage Determination”) and added a graphical explanation of this (Scheme 2).

Subsection “VoltageFluor Fluorescence Lifetime Varies Linearly with Membrane Potential” states a resolution of 390 mV. That number does not make sense. Is it supposed to be 39 mV?

No. We obtained the value of 390 mV for inter cellular voltage resolution for CAESR by using the same RMSD calculations that we applied to get the resolution of VF-FLIM. We have now applied the same methods to an analysis of di-8-ANEPPS, which has a resolution of 150 mV. The VF-FLIM approach, with an inter-cellular resolution of 19 mV (RMSD), represents approximately 8- to 19-fold improvement in resolution in this regard, which allows us to use VF-FLIM to explore biologically relevant differences in Vmem, which are on the order of tens of millivolts, rather than hundreds of millivolts.

We do have a small correction to make: the value of 390 mV should have read 370 mV because of a minor error in the calculation of all RMSDs (for both VF-FLIM and CAESR), causing all values for all approaches to be slightly too high. All numbers are now updated and correct as written (inter-cell resolution in HEK293T of 370 mV for CAESR, 150 mV for di-8-ANEPPS, and 19 mV for VF-FLIM).

Subsection “Evaluation of VF-FLIM across Cell Lines and Culture Conditions” states that despite the variances shown in Figure 2A, all cell lines' membrane potential can be resolved at or under 5 mV. Please show this for CHO cells since it has the most varied slope and MCF-7 cells which showed the highest variance for 0 mV measurement.

To clarify – in our initially submitted manuscript, we do not state that we are able to resolve absolute Vmem at or under 5 mV. The resolution for this calculation is 10-23 mV (inter-cell error), depending on the cell line. We are able to resolve absolute membrane potential changes with accuracy at or under 5 mV (intra-cell error). These values are stated in the text (subsection “VoltageFluor Fluorescence Lifetime Varies Linearly with Membrane Potential”, subsection “Evaluation of VF-FLIM across Cell Lines and Culture Conditions”) and are tabulated in Figure 2—source data 1.

Our resolution estimates come from root mean square deviation calculations (RMSD) between the Vmem values from electrophysiology and the optically determined Vmem values. Resolution is calculated per cell line, so it already takes into account variations in slope and y intercept. We have added a new Scheme 2 to the Materials and methods section that visually illustrates how this calculation is performed as a supplement to the existing mathematical description in the Materials and methods section.

Reviewer #4:

I felt that the paper promises more than was delivered. The paper claims to have developed "a new method for optically quantifying absolute membrane potential in living cells.....with single cell resolution".

Figure 2I shows that the fluorescence is not a measure of the absolute voltage but that each cell has a different FLIM vs. voltage curve. Thus, calibration with an electrode is needed. Furthermore, the cell to cell differences are not the same from one cell type to another; MCF-7 cells displayed greater variability than other cell lines tested (Figure 2B). Thus, calibration for a new cell type will need to include measuring the FLIM vs. voltage response from many cells.

Fluorescence lifetime of VoltageFluors is a reporter for absolute voltage; it indeed is not voltage. However, the requirement for calibration exists with essentially all indicators. Even electrode-based membrane potential measurements are generally comparisons between two electrodes – one that is recording from within the cell and one that is a reference in the bath. The advantage of VF-FLIM is in the reproducibility and extensibility of the lifetime-voltage calibration. In stark contrast to calibrations that are obtained with other indicators (CAESR lifetime or di-8-ANEPPS excitation ratios; Figure 1—figure supplement 4 and Figure 1—figure supplement 5, Figure 1—source data 3), we demonstrate that the lifetime-voltage calibrations we record are consistent enough between cells such that calibrations on a subset of cells can be extended to other cells of the same line. This extensibility is relatively new; in the case of di-8-ANEPPS, the Loew laboratory showed that concurrent electrophysiology is necessary on each cell to compensate for the effects of membrane dipole potential (Zhang et al., 1998).

While collecting data for VF-FLIM, we tested the stability of the calibrations rigorously. Recordings in HEK293T cells in this manuscript are compiled data collected intermittently across 18 months, using many thaws of cells and a range of passage numbers. Over these 18 months, the instrument itself underwent a factory rebuild of the laser, multiple realignments of the optical table, and replacement of the photon counting card to a newer model. We have also made the same measurements on a separate TCSPC FLIM instrument (Zeiss LSM 880 confocal with FLIM electronics from a different supplier and a diode laser instead of the MaiTai Ti:Sapphire laser). On this other system, we found that the measured lifetime-Vmem calibration in HEK293T was almost identical (slope [this manuscript] = 3.50 ± 0.08 ps/mV; slope [other system] = 3.43 ± 0.08 ps/mV; 0 mV τ [this manuscript]=1.77 ± 0.02 ns; 0 mV τ [other system] = 1.75 ± 0.03 ns; mean ± SEM of n=17 cells for this manuscript, n=6 cells for the other system). So, we believe that the calibrations are stable and extensible enough to be useful without excessive re-testing with an electrode.

While some cell lines display differences in slope or 0 mV lifetime from other cell lines, the spread in 0 mV lifetimes is actually not cell type dependent. The variance in 0 mV lifetimes is statistically identical among cell lines (Levene’s test on the median for homoscedasticity: F(4,67) = 1.29, p = 0.28; Bartlett’s test: T = 3.76, p = 0.44). We were incorrect in stating this previously; the request for more explicit statistical analysis from Reviewer 4 in Question 6 below brought this to our attention. The higher inter-cell error in MCF-7s is partially the result of the lower sensitivity, which makes the Vmem equivalent noise higher. We appreciate this comment from the reviewer and have modified the Results section to enumerate differences between cell lines in a more statistically accurate way (subsection “Evaluation of VF-FLIM across Cell Lines and Culture Conditions”).

Yes, the τfl-Vmem calibration would need to be established for each new cell type under study. While we think the need for calibration is clear throughout the text, we have added more discussion of the extensibility of the calibration (subsection “Resolution of VF-FLIM: Voltage, Space, and Time”).

Many images show blobs (Figure 1E and F, Figure 2C, Figure 3, Figure 4, Figure 5B). Sometimes the blobs seem voltage dependent sometimes not. I would presume that the blobs are the result of non-specific staining. This subject was not discussed. Were the presented images selected for relatively good membrane staining?

All images in the manuscript are representative. Enabling readers to assess the quality of data is of primary importance to us. To address this, in our original submission, we provided many images in both the main text and supporting info to orient readers to the type and quality of data that is generated with VF-FLIM. See, for example, Figure 2—figure supplement 1, Figure 3—figure supplement 1, Figure 3—figure supplement 2, Figure 4—figure supplement 1, Figure 4—figure supplement 3. In total, we include over 240 separate images, taken from greater than 70 separate samples.

We are not certain what is meant by the term blobs, so we address two potential aspects of this comment below.

First, there is small, extracellular debris in some fields of view (see for example the red punctum Figure 3—figure supplement 2C). This sparse lipophilic debris is inherent in cultured cell preparations. VF2.1.Cl stains these blobs, but we exclude these particles from the analysis based on the clear morphological difference between the debris and cells. These blobs therefore have no effect on the VF-FLIM technique or analysis.

Second, there is punctate fluorescence inside some cells. We believe this signal originates from internalized VoltageFluor. We generally have sufficient spatial resolution to exclude these puncta from the analysis. All region of interest identification was done on morphology alone and without knowledge of the lifetime data. Regardless, inclusion of this internal signal does not substantially affect the lifetime results. We addressed the effects of this small amount of internal signal in Author response image 1. In that analysis, we show that naively including all internal pixels in the HEK293T electrophysiology dataset does not have a large effect on the optical Vmem determinations.

In Figure 4A and Figure 5B different parts of the cell membrane appear to have different voltage responses and these response differences do not seem to be stochastic. This result does not fit with expected membrane voltage uniformity for small cells.

Yes, we agree that pixel to pixel differences in the lifetime are unlikely to reflect differences in Vmem in small, isolated, approximately spherical cells. We think that the lifetime differences across groups of adjacent cells such as those in Figure 4 and Figure 5 may reflect true voltage differences arising from differences in electrical coupling, which we indirectly saw by attempting to voltage clamp groups of cells (now Figure 2—figure supplement 3). Generally, though, pixel-to-pixel lifetime differences are probably not true voltage differences. We think the most likely source of this variability is noise in the fit of a biexponential decay model at each pixel. Instead, individual pixels of the image show higher random noise at each Vmem; averages across multiple pixels produce more robust results. Indeed, lifetime determinations at individual pixels incorporate information from 20- to 100-fold fewer photons than the lifetime determinations for the ROI as a whole. We interpret lifetimes as a cellular average (see Figure 1—figure supplement 1), so we do not interpret pixel-to-pixel variability as Vmem in our analysis. In principle, we likely could reduce this pixel to pixel variability by collecting many more photons per image, but this would require longer acquisition times. We now mention heterogeneity in FLIM images in our discussion of the spatial resolution of VF-FLIM (subsection “Resolution of VF-FLIM: Voltage, Space, and Time”).

Drawbacks of the method are not discussed. The time resolution seems relatively slow. Will the method will be applicable to preparations with substantial light scattering? How will it work in three dimensional preparations? The differences from cell type to cell type will require calibration for each cell type and perhaps for each developmental age of each cell type.

We agree that a more complete analysis of the pros and cons of VF-FLIM is helpful to readers. In our original submission, we compare advantages and disadvantages of various voltage measurement approaches in Figure 1—source data 1. In our revised submission, we have expanded the Discussion section to elaborate upon other factors that can affect the FLIM measurement (subsection “Resolution of VF-FLIM: Voltage, Space, and Time”), as well as the acquisition time required.

Regarding more complex samples, lifetime imaging can be performed in 3D preparations and in preparations with substantial light scattering. Ryohei Yasuda’s lab has extensively employed FLIM in such contexts, for example to monitor CAMKII activity in dendritic spines in cultured hippocampal slices (Lee et al., 2009). FLIM has also been demonstrated in clinical diagnostic settings (e.g. Dysli et al., 2017; Sparks et al., 2015). So, in principle, FLIM is extensible to such systems, although we have not yet attempted to do this. As part of the combined review comment that we modify our wording to be more circumspect, we have changed wording throughout the text to more precisely refer to “cell lines” rather than “cell types” or “biological contexts,” making it clear that we have not yet explored VF-FLIM in systems other than immortalized cell culture.

There are a few considerations to be addressed before FLIM for absolute voltage imaging could be applied in complex preparations. The identification of signal from specific cells would require targeting of VoltageFluors, which we mention in subsection “Resolution of VF-FLIM: Voltage, Space, and Time” and “Epidermal Growth Factor Induces Vmem Signaling in A431 Cells”). Furthermore, there is the issue of changes in calibration between cell types.

We discuss the extensibility of the lifetime-Vmem calibration in detail in response to reviewer 4, above.

[Editors' note: further revisions were requested prior to acceptance, as described below.]

The manuscript has been improved but there are some remaining issues that need to be addressed before acceptance, as outlined below:

Reviewer #2:

[…]

1) In comparing the ratiometric electrochromic dyes in the Introduction, they state: "Although they benefit from simpler loading procedures, signals from electrochromic styryl dyes display a strong dependence on local membrane properties other than transmembrane potential, reducing the accuracy of Vmem determinations (Gross et al., 1994; Montana et al., 1989; Zhang et al., 1998)". This is correct when examining different cell lines or cells in different states of differentiation, where the lipid composition, for example, can affect the ratio. But saying this in the Introduction appears to suggest that the new method that is about to be described does not have this problem; it likely does and even shows differences within the same cell line. And, actually, examination of Figure 2 in Zhang et al. (1998) shows that the cell to cell variation for the normalized ratiometric approach is remarkably small for the 40 cells examined. Figure 4 in Zhang et al. (1998) shows remarkably little variation in Vrest for undifferentiated neuroblastoma cells; the small variation in Vrest for differentiated cells, may be attributed to different degrees of differentiation.

In these lines, we did not mean to indicate that VoltageFluors are insensitive to membrane composition. We removed the reference to dipole potential sensitivity from this part of the Introduction, reserving it for the Discussion section where we talk about Vmem resolution (Gross, Bedlack, and Loew, 1994).

We now include an additional reference to illustrate the performance of normalized and nonnormalized ANEPPS ratios (Bullen and Saggau, 1999).

The text now reads (Introduction):

“While they benefit from simpler loading procedures, signals from electrochromic styryl dyes require normalization with an electrode on each cell of interest to determine absolute Vmem accurately (Bullen and Saggau, 1999; Montana et al., 1989; Zhang et al., 1998). As a result, ratiometric Vmem sensors cannot be used to optically quantify slow signals in the resting Vmem, which may be on the order of tens of millivolts. Indeed, ratiometric Vmem probes are most commonly applied to detect – rather than quantify – fast changes in Vmem (Zhang et al., 1998), much like their single wavelength counterparts.”

Although the normalized ratiometric signal from di-8-ANEPPS does display low variability, we do not believe this is the most appropriate comparison to VF-FLIM (see our discussion of this in the manuscript in subsection “VoltageFluor Fluorescence Lifetime Varies Linearly with Membrane Potential). While normalized signals are effective for detecting and quantifying changes in Vmem with high signal to noise, they cannot be used to quantify absolute Vmem without a point of reference. The use of electrode on each cell of interest (as in Zhang et al., 1998) improves the Vmem resolution, but the technique then suffers from many of the drawbacks of patch clamp electrophysiology. A key feature of VF-FLIM is that the calibration generated can be applied to many cells without an electrode, opening up the possibility of analyzing 1000s of cells (Figure 3) or Vmem dynamics accompanied by cellular movement (Figure 4 and Figure 5).

2) In discussing the influence of membrane dipole potential, the authors misunderstand some of the studies from my lab, subsection “Resolution of VF-FLIM: Voltage, Space, and Time”:

"Relative to di-8-ANEPPS, where this effect was documented (Gross et al., 1994; Zhang et al., 1998), VF-FLIM displays less cell to cell variability, suggesting reduced dependence on the membrane dipole potential. The reason for this is unclear, as both sensors putatively detect Vmem from within the plasma membrane (Loew et al., 1979; Miller et al., 2012)." Our studies deliberately sought to establish the sensitivity of d-8-ANEPPS to dipole potential by systematically measuring ratios with different lipid compositions in lipid vesicles and by adding or depleting cholesterol in cell membranes. As a side benefit, these studies showed that membrane composition had to be considered when using dual wavelength ratio measurements to determine absolute Vmem. Until the authors do a deliberate investigation of this effect on FLIM of their probes, I don't think they can say that FLIM of the VF dyes is less sensitive to membrane composition.

We agree; we did not evaluate the sensitivity of VF dyes to membrane composition or dipole potential. In the quoted lines above, we meant that VF-FLIM shows less cell to cell variability than di-8-ANEPPS does in HEK cells. Since we do not have direct evidence that the dipole potential is the reason for these differences, we have removed this text. We realize that the ability of di-8-ANEPPS to report dipole potential can be advantageous, and we did not mean to imply that this was a downside of the indicator. The text now reads as follows (subsection “Resolution of VF-FLIM: Voltage, Space, and Time”):

“Secondly, membrane composition and dipole potential can vary between cells and cell lines, changing the local environment of the fluorescent indicator (Wang, 2012; Brügger, 2014). Styryl dyes like di-8-ANEPPS can respond to changes in dipole potential (Gross et al., 1994; Zhang et al., 1998), and VF dyes may be similarly sensitive to dipole potential.”

Reviewer #4:

[…]

In the Abstract add the words "in culture" after the words "single cell resolution".

We have added “…in mammalian cell culture…” to the Abstract.

The line in question now reads, “To address this need, we developed a fluorescence lifetime-based approach (VF-FLIM) to visualize and optically quantify Vmem with single-cell resolution in mammalian cell culture.”

The first paragraph of the Introduction leads the reader to think that the paper is about signals that can be measured rapidly and can be measured in complex tissues even though the reported measurements have a time resolution that is ~four orders of magnitude slower than presently available from other methods and the measurements are only from single cells in culture. .

We removed the clause “At the tissue and organismal level…” from the final sentence of the first paragraph. Now there is no mention of tissues, allowing us to direct the attention of the reader to thinking about (1) the diversity of time scales over which voltage may be important and (2) the distinction between fast activity and the more gradual “resting” membrane potential signals which we go on to study in this work. We think this introduction now firmly places the focus on cellular studies.

Regarding time resolution, in the first round of revisions, we provided detailed information regarding the resolution that we achieved in these systems: in the Introduction, extensively detailed in the Materials and methods section, and Discussion section. To improve the clarity surrounding the temporal resolution, we have added additional emphasis on this throughout the text (see response to reviewer 4’s third point below).

The timing issue would be clearer for the reader if the table in subsection "Acquisition Time and Effective Pixel Size in Lifetime Data” was in the main body of the paper.

To ensure that this aspect of our experimental design is clear to the reader, we increased the visibility of the time resolution throughout the Introduction and Results sections, mentioning acquisition times when the associated data is presented, in addition to the tabulated imaging parameters in the supporting information. Changes are listed below.

a) In the Introduction where we first mention the Vmem resolution of VF-FLIM: “Using patch-clamp electrophysiology as a standard, we demonstrate that VF-FLIM reports absolute membrane potential in single trials and 10 to 23 mV accuracy (root mean square deviation, RMSD; 15 second acquisition), depending on the cell line.”

b) With the results of VF-FLIM calibration in HEK293T (subsection “VoltageFluor Fluorescence Lifetime Varies Linearly with Membrane Potential”): “We estimate that the resolution for tracking and quantifying voltage changes in a single HEK293T cell is 3.5 ± 0.4 mV […] whereas the resolution for single-trial determination of a particular HEK293T cell’s absolute Vmem is 19 mV […] within a 15 second bandwidth.”

c) With the VF-FLIM calibration in A431, CHO, MCF-7, and MDA-MB-231 cells (subsection “Evaluation of VF-FLIM across Cell Lines and Culture Conditions”): “For absolute Vmem determination of a single cell, we observed voltage resolutions ranging from 10 to 23 mV (inter-cell resolution, 15 second acquisition time, Figure 2—source data 1).”

d) With the EGFR dynamics data in Figure 4 (subsection “Membrane potential dynamics in epidermal growth factor signalling”): “We find that treatment of A431 cells with EGF results in a 15 mV hyperpolarization within 60-90 seconds in approximately 80% of cells (Figure 4A-C, Figure 4—figure supplement 1, Figure 4—figure supplement 2), followed by a slow return to baseline within 15 minutes (Figure 4D-F, Figure 4—figure supplement 3, 30 second acquisitions).”

The time resolution of VF-FLIM is not an invariant quantity. It depends on many factors, including the efficiency of the confocal light path and the desired level of Vmem accuracy. Faster TCSPC FLIM measurements could be (and have been) made, especially with improved equipment (see response to reviewer 4’s fifth point, below).

A discussion of the difficulties of applying this method to other applications should be added to the Discussion section.

We expanded our discussion for applying VF-FLIM to tissues. We now discuss the considerations of probe loading into specific cells of interest in subsection “Resolution of VF-FLIM: Voltage, Space, and Time”.

“When applying VF-FLIM to tissues, the cellular specificity of the VF stain becomes a consideration, as the VF2.1.Cl indicator used in this study labels all cell membranes efficiently.”

As part of the first round of revisions, we added discussion of difficulties and considerations for applying VF-FLIM to other applications, including the following:

1) Confounding factors such as temperature, viscosity, etc. (see subsection “Resolution of VF-FLIM: Voltage, Space, and Time”, quoted below):

“Additionally, fluorescence lifetime depends on certain environmental factors (e.g. temperature, viscosity, ionic strength) (Berezin and Achilefu, 2010), which may introduce variability. These parameters are usually determined by the biological system under study, and recalibration is important if they change dramatically in an experiment.”

2) Pixel to pixel variability in the lifetime images (subsection “Resolution of VF-FLIM: Voltage, Space, and Time”)

“Intriguingly, there are differences in lifetime within some cells in VF-FLIM images at the pixel to pixel level. In small, mostly spherical cells under voltage clamp, one would expect uniform membrane potential (Armstrong and Gilly, 1992), so these subcellular differences are most likely noise in the measurement. […] Lifetime estimates at each pixel are calculated from 20 to 100-fold fewer photons than the lifetime value for the entire ROI. These lower photon counts at the single pixel level produce Vmem estimates that are less precise than the Vmem estimate for the entire ROI.”

3) The need for calibration (subsection “Resolution of VF-FLIM: Voltage, Space, and Time”)

“One remaining challenge in expanding VF-FLIM to these areas is the requirement for an initial calibration with voltage clamp electrophysiology. Alternative ways to control Vmem, such as ionophores or optogenetic actuators (Berndt et al., 2009), may prove useful in these systems.”

4) Slower acquisition speed than intensity-based imaging (subsection “Resolution of VF-FLIM: Voltage, Space, and Time”)

“[…] VF-FLIM sacrifices some of the temporal resolution of electrophysiology or intensity-based voltage imaging. VF-FLIM acquisition times are limited by the large numbers of photons needed per pixel in time-correlated single photon counting (see Materials and methods section). As a result, VF-FLIM in its current implementation can track Vmem events lasting longer than a few seconds. For “resting” membrane potential or Vmem dynamics associated with cell growth or differentiation, this temporal resolution is likely sufficient. Nevertheless, in the future, we envision allying VF-FLIM with recently developed, faster lifetime imaging technology to enable optical quantification of more rapid Vmem responses (Gao et al., 2014; Raspe et al., 2016).”

5) The need for improved voltage sensitivity/voltage resolution, (subsection “Epidermal Growth Factor Induces Vmem Signaling in A431 Cells”)

“Future improvements to the voltage resolution could be made by use of more sensitive indicators, which may exhibit larger changes in fluorescence lifetime (Woodford et al., 2015). VF-FLIM can be further expanded to include the entire color palette of PeT-based voltage indicators (Deal et al., 2016; Huang et al., 2015) […]”

6) As well as for targeting for use in complex tissues (subsection “Epidermal Growth Factor Induces Vmem Signaling in A431 Cells”)

“VF-FLIM can be […] allied with targeting methods to probe absolute membrane potential in heterogeneous cellular populations (Grenier et al., 2019; Liu et al., 2017) […]”

We’re happy to elaborate on other specific applications, as necessary.

The Discussion section notes that faster apparatus is available. How much faster? One order?

We think that two orders of magnitude improvement can be readily achieved.

The simplest upgrade is an improvement to the optics and photon economy of the current confocal microscope, which is 20 years old. We recently evaluated a new time-domain lifetime microscope, and we find that we are able to acquire lifetime data in beating cardiomyocytes derived from human induced pluripotent stem cells at a rate of approximately 8 Hz (>200-fold improvement over our current 0.033 Hz rate). After an exhaustive review by the NIH, we were recently informed that our core facility’s S10 application was funded, so the real possibility of using this microscope looms on the horizon.

In addition to upgrading to a more modern confocal microscopy equipped with TCSPC, there are two new instrumentation schemes that we think, in principle, should allow faster acquisition, which we refer to in subsection “Resolution of VF-FLIM: Voltage, Space, and Time” and subsection “Epidermal Growth Factor Induces Vmem Signaling in A431 Cells”, quoted below:

Subsection “Resolution of VF-FLIM: Voltage, Space, and Time”: “Nevertheless, in the future, we envision allying VF-FLIM with recently developed, faster lifetime imaging technology to enable optical quantification of more rapid Vmem responses (Gao et al., 2014; Raspe et al., 2016).”

Subsection “Epidermal Growth Factor Induces Vmem Signaling in A431 Cells”: “VF-FLIM can be further expanded to include the entire color palette of PeT-based voltage indicators (Deal et al., 2016; Huang et al., 2015), allied with targeting methods to probe absolute membrane potential in heterogeneous cellular populations (Grenier et al., 2019; Liu et al., 2017), and coupled to highspeed imaging techniques for optical quantification of fast voltage events (Gao et al., 2014; Raspe et al., 2016).”

In Raspe et al. (2016), the authors show that it is possible to track Ca2+ transients with Oregon Green BAPTA 1 in HeLa cells at a rate of 6 Hz and in HL-1 cardiomyocytes at a rate of 20 Hz. We have not evaluated the performance of VF dyes with this camera system. An acquisition rate of 6 Hz (~170 ms acquisition time) would be a ~180-fold increase over our current acquisition rate for the EGF signaling data, which was 0.033 Hz (30 second acquisition time). A 20 Hz acquisition rate would represent ~600-fold increase.

In Gao et al. (2014), the authors combine a streak camera with compressed sensing to achieve framerates of up to 100 GHz. They estimate that, in this current iteration, a frame size of 150 x 500 pixels could be achieved. In principle, this approach could provide exceptionally fast lifetime imaging.

Please discuss the possible explanations for "between regions" in the following sentence in the Discussion section: "Intriguingly, there are differences in lifetime within some cells in VF-FLIM images, both at the pixel to pixel level and between regions of the cell membrane."

We think that the two most likely explanations for subcellular differences in lifetime are fit noise and membrane composition, which we discussed in the first round of revisions of the manuscript immediately after the aforementioned line. We have changed the wording of this paragraph slightly to clarify this point (see below).

We did not mean to imply a mechanistic distinction between the “pixel to pixel” noise and the “between regions” noise. As such, we have edited the sentence you mention to the following (subsection “Resolution of VF-FLIM: Voltage, Space, and Time”):

“Intriguingly, there are differences in lifetime within some cells in VF-FLIM images at the pixel to pixel level.”

We also have reworded the final sentence of this paragraph to more accurately represent the potential effects of membrane composition difference (creating subcellular differences rather than simply pixel to pixel ones; subsection “Resolution of VF-FLIM: Voltage, Space, and Time”).

“We also cannot fully rule out an alternative explanation that the observed subcellular variability is the result of local differences in membrane composition (Gross et al., 1994).”

Associated Data

    This section collects any data citations, data availability statements, or supplementary materials included in this article.

    Supplementary Materials

    Figure 1—source data 1. Comparison of available approaches for measuring membrane potential in cells.

    aMeasurements vary too much to be converted to absolute voltage or interpreted across populations of cells. This variability is attributable to numerous confounding factors, including dye loading, photobleaching, and sample movement (Peterka et al., 2011). bWhile in principle less variable than a single-color fluorescence intensity measurement, in practice, the signal depends strongly on the loading of two independent lipophilic indicators (Adams and Levin, 2012; Maher et al., 2007), which can vary substantially. cANEPPS excitation ratios depend on a variety of non-voltage factors, in particular the membrane composition, leading to substantial artifacts in optical Vmem determinations (Zhang et al., 1998; Gross et al., 1994). dWith the GEVI CAESR in our hands, apparently poor protein trafficking produces large amounts of non-voltage-sensitive signal, which contaminates the FLIM recording and contributes to high cell to cell variability (Figure 1—figure supplement 4, Materials and methods). ePatch-clamp electrophysiology requires physical contact with the cell of interest, which causes damage to the cell and, in whole cell configurations, washout of intracellular factors. Slight movement of the cell or sample generally result in loss of the patch. fMovement of the cell and photobleaching of the dye both cause large changes to the signal over seconds to minutes. gRatio-calibrated imaging approaches use a second signal (usually another color of fluorescence) to correct for differences in dye concentration or changes in the region of interest that contaminate single-color intensity signals. If the rate of photobleaching is the same for both components, photobleaching artifacts can also be avoided. hLimited by photon count rates. iLimited by probe movement in the membrane, which depends mostly on lipophilicity (Briggman et al., 2010). jPhoton counting based lifetime imaging, like epifluorescence intensity imaging, is limited by photon count rates. Large numbers of photons per pixel must be collected to fit TCSPC FLIM data, often using a line scanning confocal approach, leading to slower acquisition speeds than epifluorescence-based intensity imaging. kToxicity from capacitive load of the sensor (Briggman et al., 2010). lThe spatial resolution of electrophysiology is compromised by space clamp error, preventing interpretation of Vmem in regions far from the electrode (e.g. many neuronal processes) (Williams and Mitchell, 2008; 35,36). mAs demonstrated by Cohen and co-workers (Brinks et al., 2015); in our hands with CAESR, we also experienced significant improvements in voltage resolution by fitting a single curve per FLIM image instead of processing the images pixel-wise (see Materials and methods) nIn this work, we calibrated VF-FLIM for Vmem measurements with single cell resolution. In principle, subcellular spatial resolution could be achieved with the VF-FLIM technique.

    DOI: 10.7554/eLife.44522.008
    Figure 1—source data 2. Properties of lifetime standards and VoltageFluor dyes.

    Fluorescein and erythrosin B standards were measured in drops of solution placed on a coverslip. For VF dyes, voltage sensitivities from intensity-based fluorescence imaging in HEK293T cells (%ΔF/F, percent change in fluorescence intensity for a voltage step from −60 mV to +40 mV) are from previously published work (Woodford et al., 2015). Lifetime data were obtained from voltage-clamp electrophysiology of HEK293T cells loaded with 100 nM VF. Lifetime listed here is the average 0 mV lifetime from the electrophysiology calibration. % Δτ/τ is the percent change in lifetime corresponding to a 100 mV step from −60 mV to +40 mV. Lifetime sample sizes: fluorescein 25, erythrosin B 25, VF2.1.Cl 17, VF2.0.Cl 17. For lifetime standards, each measurement was taken on a separate day. VF2.1.Cl data in HEK293T is duplicated in Figure 2—source data 1. Values are tabulated as mean ± SEM.

    DOI: 10.7554/eLife.44522.009
    Figure 1—source data 3. Comparison of optical approaches to absolute Vmem determination in HEK293T cells.

    Data are compiled from Figure 1 (VF-FLIM, this work), Figure 1—figure supplement 4 (CAESR; Brinks et al., 2015), and Figure 1—figure supplement 5 (Di-8-ANEPPS; Zhang et al., 1998). All data were obtained by simultaneous whole cell voltage clamp electrophysiology and optical recording in HEK293T (VF-FLIM n = 17 cells, CAESR n = 9, di-8-ANEPPS n = 16). Calculation of intra and inter cell accuracies are performed via root-mean-square deviation (RMSD) and discussed in detail in the Methods (see Resolution of VF-FLIM…). Regions of interest were chosen at the plasma membrane in all cases. Di-8-ANEPPS data are presented as the ratio of signal obtained with blue excitation to signal obtained with green excitation (R, see Materials and methods) and are not normalized to the 0 mV R.

    DOI: 10.7554/eLife.44522.010
    Figure 2—source data 1. Lifetime-Vmem standard curves for VF2.1.Cl lifetime in various cell lines.

    Whole-cell voltage-clamp electrophysiology was used to determine the relationship between VF2.1.Cl lifetime and membrane potential in five different cell lines. Parameters of this linear model are listed above. The %Δτ/τ is the percent change in the lifetime observed for a voltage step from −60 mV to +40 mV. The intra-cell RMSD represents the accuracy for quantifying voltage changes in a particular cell (see Materials and methods). The inter-cell RMSD represents the expected variability in single-trial absolute Vmem determinations. Sample sizes: A431 12, CHO 8, HEK293T 17, MCF-7 24, MDA-MB-231 11. All values are tabulated as mean ± SEM.

    DOI: 10.7554/eLife.44522.018
    Figure 3—source data 1. Vmem measurements made with VF-FLIM agree with previously reported values.

    Comparison of optically-determined resting membrane potential values (in millivolts) and previously reported values. This table summarizes data presented in Figure 3 and Figure 3—figure supplement 1. Optically determined membrane potentials were calculated from lifetime-Vmem standard curves (Figure 2—source data 1). For tabulated literature values, measures of error and central tendency were used from the original publication. In some cases, none were given or only ranges were discussed. The mean of the reported ephys values is the mean of the values listed here. Sample sizes for resting and elevated K+, respectively: A431 1056, 368; CHO 2410, 1310; HEK293T 1613, 520; MCF-7 1259, 681; MDA-MB-231 1840, 558.

    DOI: 10.7554/eLife.44522.022
    Source code 1. Global analysis of CAESR fluorescence lifetimes.
    elife-44522-code1.zip (4.3KB, zip)
    DOI: 10.7554/eLife.44522.034
    Source code 2. Automated thresholding and cell group identification.
    elife-44522-code2.zip (16.2KB, zip)
    DOI: 10.7554/eLife.44522.035
    Transparent reporting form
    DOI: 10.7554/eLife.44522.036

    Data Availability Statement

    All data presented in the manuscript is available in the supporting/supplementary information.


    Articles from eLife are provided here courtesy of eLife Sciences Publications, Ltd

    RESOURCES