Abstract
The T1-weighted and T2-weighted MRI contrasts of the infant brain evolve drastically during the first year of life. This poses significant challenges to inter- and intra-subject registration, which is key to subsequent statistical analyses. Existing registration methods that do not consider temporal contrast changes are ineffective for infant brain MRI data. To address this problem, we present in this paper a method for deformable registration of infant brain MRI. The key advantage of our method is threefold: (i) To deal with appearance changes, registration is performed based on segmented tissue maps instead of image intensity. Segmentation is performed by using an infant-centric algorithm previously developed by our group. (ii) Registration is carried out with respect to both cortical surfaces and volumetric tissue maps, thus allowing precise alignment of both cortical and subcortical structures. (iii) A dynamic elasticity model is utilized to allow large non-linear deformation. Experimental results in comparison with well-established registration methods indicate that our method yields superior accuracy in both cortical and subcortical alignment.
Keywords: Infant magnetic resonance imaging, joint cortical surface, volumetric registration
Graphical Abstract
1. Introduction
The infant brain grows and develops at a rapid pace during the first two years of life, resulting in drastic structural changes (Gilmore et al., 2018; Li et al., 2018, 2015a; Lyall et al., 2015; Meng et al., 2014; Nie et al., 2014, 2012; Geng et al., 2017). For instance, the overall brain volume doubles to about 65% of the adult brain volume in the first year of life (Knickmeyer et al., 2008). During this time span, gray matter (GM) grows more rapidly (108% – 149%) than white matter (WM) (~11%) (Matsuzawa et al., 2001). Cortical thickness and surface area increase immensely from birth to one year of age. Understanding the longitudinal trajectory of early brain development is of critical importance for neuroscience and neuropsychology (Hazlett et al., 2017; Paterson et al., 2006).
To this end, a pivotal step for quantifying morphological changes is establishing anatomical correspondence using deformable registration (Shi et al., 2013; Li et al., 2014b; Nie et al., 2013; Xue et al., 2006a). However, deformable registration of infant brain data is challenging owing to rapid brain structural changes in relation to development, with cortical and subcortical structures exhibiting different growth trajectories (Choe et al., 2013). Brain tissues exhibit dynamic appearance changes over the first year of life (Fig. 1). More specifically, WM appears dark in the neonatal T1-weighted image as most of the WM is not yet myelinated, resulting in a low GM-WM contrast. As myelination progresses with development, WM gains a brighter appearance (Xue et al., 2007).
Fig. 1:
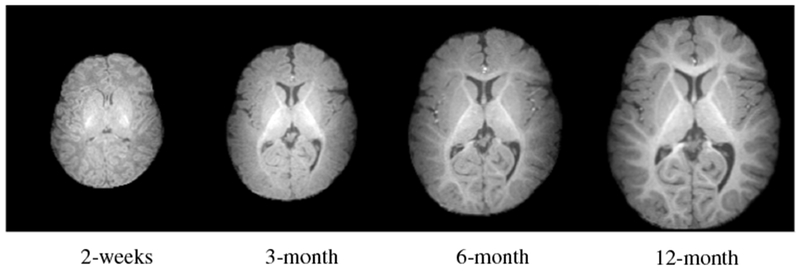
Dynamic morphological and appearance changes in a typical infant brain from 2 weeks to 12 months of age demonstrated using T1-weighted MR images.
Existing deformable registration methods (Tang et al., 2018; Yang et al., 2017; Chen et al., 2017; Wu et al., 2016; Kim et al., 2015; Wang et al., 2015b; Avants et al., 2008; Wu et al., 2006; Xue et al., 2006b) are designed for adult brain images and have limited applicability to infant brain images. The key limiting factor of these methods is their inability to deal with dramatic appearance changes. Only a few registration methods are developed specifically for infant brain images. In (Wu et al., 2015), growth trajectories learned from a longitudinal image training set are used to guide registration. In (Wei et al., 2017), auto-context random forest regression is employed to learn structural shape and appearance changes from longitudinal infant brain data.
Accurate volumetric registration does not necessarily guarantee accurate alignment of cortical surfaces (Park et al., 2012; Hellier et al., 2003). Cortical surfaces are highly convoluted with complex shapes and their alignment is important for studying cortical growth in early brain development (Li et al., 2014a). Surface-based registration methods (Park et al., 2012; Yeo et al., 2010; Zou et al., 2007; Joshi et al., 2012; Acosta et al., 2010) typically rely on information drawn from surface geometry (e.g., gyral and sulcal lines, sulcal depth, curvature, etc.). Although these methods provide accurate cortical surface correspondence, alignment of subcortical structures is totally ignored.
Combined surface and volumetric registration methods have emerged as a solution to the above limitations by concurrently aligning the cortical and subcortical structures. These methods not only work well for structural MRI, but have also shown efficacy in functional MRI (fMRI) registration (Gholipour et al., 2007) and improving alignment of fiber streamlines in diffusion MRI (dMRI) (Zöllei et al., 2010). This is typically achieved by reliably establishing correspondence across high-resolution structural MRI scans and then applying this to low-resolution fMRI or dMRI data. Surface-volume consistent infant brain atlases can also be constructed using combined surface and volume registration methods (Ahmad et al., 2019). While there are existing concurrent surface and volumetric registration methods (Postelnicu et al., 2009; Joshi et al., 2007), they are infeasible for infant brain images. The rapid appearance changes affect both segmentation and registration. For example, Fig. 2 indicates that the low contrast of T1-weighted MR brain image of 6-month-old and 12-month-old infant confuses FreeSurfer (Dale et al., 1999) and BrainSuite1, resulting in tissue segmentation that cannot be used for surface reconstruction and registration.
Fig. 2:
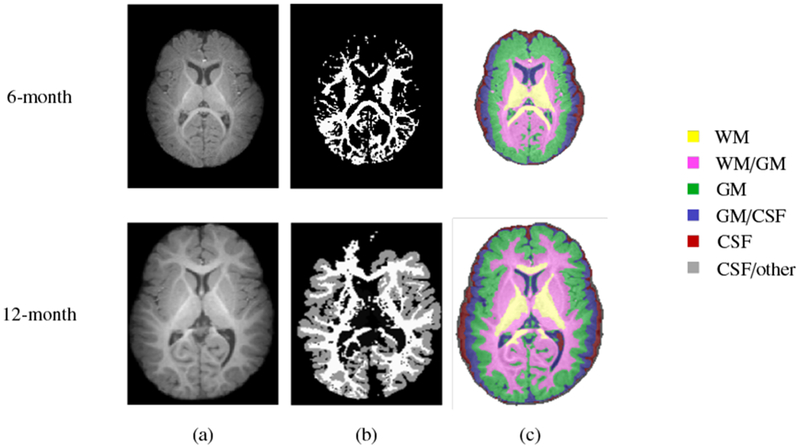
Tissue segmentation of a typical 6-month-old (first row) and 12-month-old (second row). (a) T1-weighted MR brain image and segmentation results using (b) FreeSurfer and (c) BrainSuite.
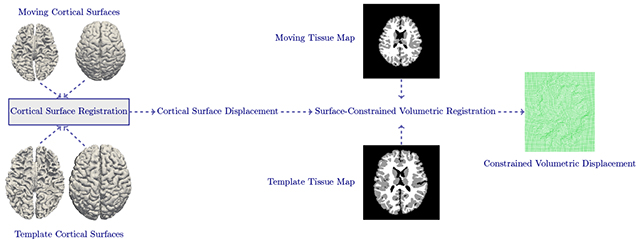
In this paper, we introduce a surface-constrained volumetric registration method for infant brain MRI. The key steps involve (i) tissue segmentation using an infant-centric method developed by our group (Wang et al., 2015a); (ii) surface-based registration using cortical surfaces reconstructed based on the tissue segmentation outcome; and (iii) volumetric registration constrained by surface correspondences. We show that our method yields improvement in the alignment of cortical and subcortical structures over well-established registration methods.
The remainder of the paper is organized as follows. In Section 2, we present the dataset used in this study. In Section 3, we describe the proposed registration method. In Section 4, we show evaluation results for inter- and intra-subject registration. Finally, we conclude the paper in Section 5.
2. Materials
An infant brain MRI dataset consisting of images acquired for 19 healthy infant subjects (males: 14, females: 5) was used to validate the performance of the proposed method. T1- and T2-weighted MR images of each subject were scanned at 2 weeks, 3 months, 6 months and 12 months. The imaging parameters for T1-weighted MR images were TR = 1900 ms, TE = 4.38 ms, flip angle = 7°, 144 sagittal slices and 1 mm isotropic voxel size. The imaging parameters for T2-weighted MR images were TR = 7380 ms, TE = 119 ms, flip angle = 150°, 64 sagittal slices, and 1.25 × 1.25 × 1.95 mm3 voxel size.
3. Methods
We present a surface-constrained volumetric registration method with the goal of aligning a moving image at time point i and template image at time point j. Due to significant appearance changes, registration cannot be performed directly on the intensity images. As an alternative, we register the tissue maps generated using our infant-centric segmentation method (Wang et al., 2015a). Therefore, and are tissue maps instead of intensity images, making the registration process insensitive to contrast changes. Fig. 3 shows the complete pipeline of the proposed technique, consisting of (i) data preprocessing for obtaining tissue maps and cortical surfaces, and (ii) surface-constrained non-linear volumetric registration.
Fig. 3:
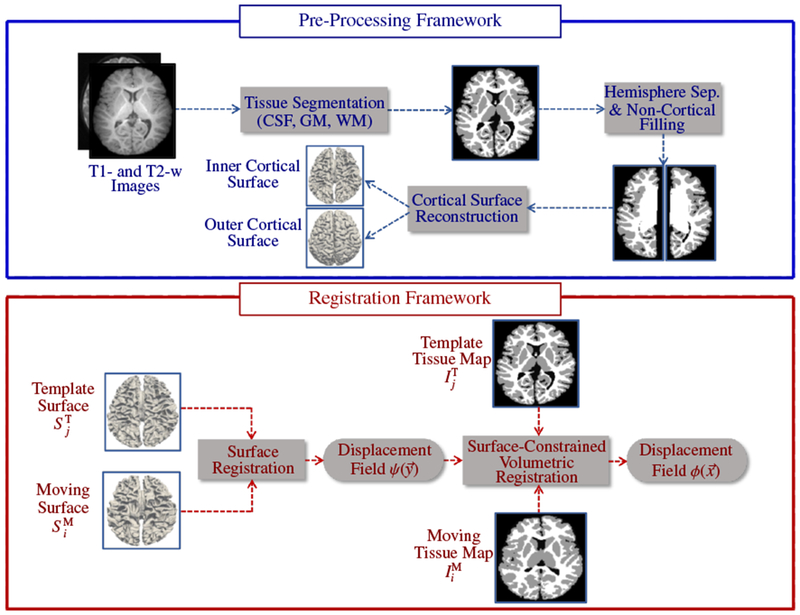
Pipeline for surface-constrained volumetric registration.
3.1. Pre-Processing Framework
The longitudinally acquired infant images were processed using the UNC infant cortical surface processing pipeline (Li et al., 2014a, 2013, 2015b, 2014c), which includes: (i) N3 intensity inhomogeneity correction (Sled et al., 1998); (ii) skull stripping by a learning-based method (Shi et al., 2012); (iii) cerebellum and brain stem removal by registration (Shen and Davatzikos, 2002); (iv) rigid alignment of all longitudinal images of the same subject and rigid alignment of T2-weighted images with the corresponding T1-weighted images; (v) longitudinally consistent tissue segmentation (CSF, GM and WM) using a learning-based multi-source integration framework (Wang et al., 2015a); (vi) masking and filling of non-cortical structures and separation of each brain into left and right hemispheres (Li et al., 2013, 2014b); (vii) construction of topologically correct and geometrically accurate inner (WM-GM interface) and outer (GM-CSF interface) cortical surfaces (Li et al., 2014a, 2012).
3.2. Registration Framework
The registration framework begins with cortical surface registration, followed by surface-guided volumetric registration.
3.2.1. Cortical Surface Registration
The cortical surfaces (left/right, inner/outer) of the moving subject at time point i are registered to the corresponding cortical surfaces of the template at time point j, thus aligning cortical folds. In order to simplify cortical surface registration, spherical mapping is performed by inflating the inner cortical surface and mapping the outcome onto a sphere (Fig. 4) by minimizing the metric distortion between the original cortical surface and its spherical representation (Fischl et al., 1999). We first use Spherical Demons (Yeo et al., 2010) to align the spherical cortical surfaces in a pairwise manner. The registration is driven by two commonly used folding attributes, i.e., average convexity and mean curvature (Fischl et al., 1999). The vertex-to-vertex correspondences established by spherical registration are then propagated to the inner and outer cortical surfaces by leveraging the one-to-one vertex mapping between the spherical representation and, the inner and outer cortical surfaces. Finally, based on the correspondences between cortical surfaces, we obtain the displacement for each vertex of the template cortical surface with respect to the moving surface. This displacement field will be used to constrain subsequent volumetric registration, as detailed below.
Fig. 4:
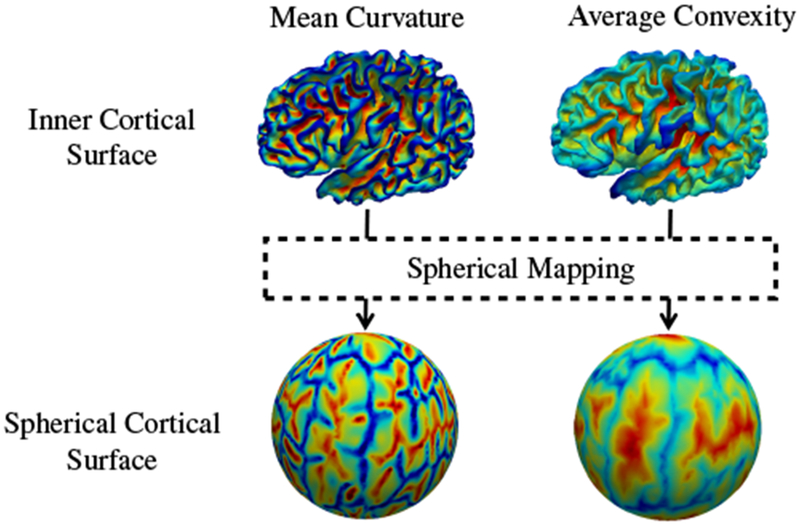
Spherical mapping of the inner cortical surface.
3.2.2. Surface-Constrained Volumetric Registration
Cortical and subcortical structures can be consistently aligned by constraining the volumetric registration with the displacement obtained by cortical surface registration. The deformation is defined as , where ϕ : Ω → ℝ3 is a displacement field defined on the brain region Ω ⊂ ℝ3 and denotes the 3D spatial coordinates. Here, our objective is to seek an optimal displacement such that , for every vertex of . We use the dynamic elasticity model (DEM) (Ahmad and Khan, 2017) to represent the underlying large non-linear displacement. DEM registration is formulated based on the principle of elastodynamics dealing with dynamic displacements. The image is modeled as an elastic body that is disturbed from its resting state by an abrupt external force. This disturbance takes the form of elastic waves propagating across the entire body. These elastic waves characterize the non-linear displacements, which can be recovered using the elastodynamics wave equation given as:
| (1) |
where parameter α influences the smoothness of the displacement field and β controls the contribution of the volumetric force field , which is computed as the gradient of the L2 distance between and , i.e.,
| (2) |
given as
| (3) |
Volumetric registration is steered by , which is influenced by two terms as given in Eq. (3). The first term (within square brackets) defines the discrepancy between the template and the moving tissue map warped using the estimated deformation field. The second term is the gradient of the warped moving tissue map. Voxels associated with high gradient magnitudes are structural edges that drive the registration. The volumetric force field diminishes with the alignment of template and moving tissue maps. When the force is close to zero, the displacement field converges with no further significant changes.
Here, we incorporate the cortical surface constraint into Eq. (1) by defining a surface force field , computed as the difference between the displacements estimated respectively from surface and volumetric registration:
| (4) |
Accordingly, the elastodynamics wave equation is modified as
| (5) |
where the parameter γ controls the contribution of the surface force. The modified elastodynamics wave equation is governed by two forces i.e., volumetric and surface force fields. These force fields reflect the misalignment between a pair of tissue maps and the corresponding cortical surfaces. The magnitudes of these force fields are initially high but diminish with alignment, resulting in the convergence of the displacement field. The surface-constrained dynamic elasticity model (SC-DEM) based registration algorithm is described below:
Step 1: Initialize the displacement fields for the first two iterations (i.e., t = 0 and t = 1) with zero:
Step 2: Estimate the displacement at vertices of the template cortical surface:
Step 3: Deform with the current estimated deformation and compute the volumetric force field using Eq. (3).
Step 4: Calculate the surface force field by extrapolating the difference between and over the entire volumetric space:
Step 5: and are then combined and convolved with a Gaussian kernel of size 3 × 3 × 3 and σ2 = 0.8 to obtain the combined force field as follows:
| (6) |
Step 6: If , where is the mean of and Γ is a threshold, then the displacement field for the next iteration is computed using
| (7) |
Step 7: Compute surface displacement error as follows:
Step 8: Increment β with step size Δβ. Repeat Steps 2 – 7 until either or . Proceed to the next level as soon as one of the conditions is met.
Step 9: At the next level, initialize with , decrement α and increment γ with step size Δα and Δγ, respectively.
Step 10: Loop over Steps 2 – 9 until the highest level is reached. Warp with final estimated deformation to obtain aligned moving tissue map.
The optimal displacement is obtained by formulating image registration as a wave motion problem. The moving tissue map is deformed toward the template tissue map by the minimization of an energy functional given by tissue map dissimilarity and surface displacement error. If during minimization, the error gets worse (Step 8, ), then the change in parameter settings allows further minimization of the error. Thus, the proposed multi-level registration strategy avoids local minima and recovers residual displacements, improving the registration quality (Fig. 5). The second condition in Step 8 guarantees sufficient minimization of the error function, such that the algorithm converges. This condition also prevents estimation of excessive deformations that may cause the algorithm to oscillate near convergence. In practice, we observed that the algorithm converges to a reasonable solution within 20 iterations with Γ = 1 × 10⁻⁵.
Fig. 5:
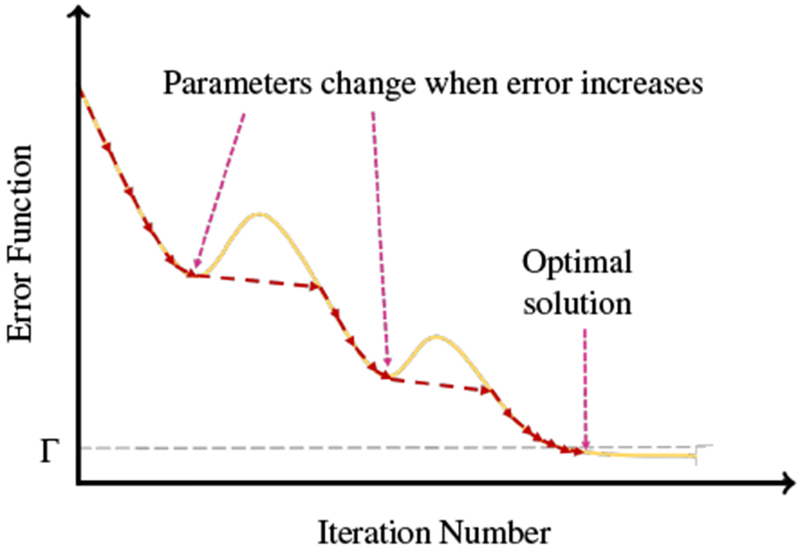
Illustration of optimization procedure.
3.3. Implementation Details
Here, we describe the implementation details of SC-DEM. In Step 2, we use trilinear interpolation to estimate the value of displacement at surface vertices (non-grid points) from the displacement field of image voxels (grid points). In Step 4, the surface force field is extrapolated over the volumetric space using Delaunay triangulation to generate the mesh and then the mesh vertices are displaced by distance specified as the magnitude of surface force field. In order to determine the value of force field at a particular voxel, first the triangulation data structure is traversed to find the triangle that encloses the given voxel. Then, the value at voxel is determined by the weighted sum of the values associated with the enclosing triangle vertices and the corresponding weights are pre-computed using barycentric coordinates.
In Eq. (6), the values of parameters β and γ are tweaked to balance the volumetric and surface force fields. Initially, the value of β is set to 1.1, which is iteratively incremented with Δβ = 0.012. γ is defined as a spatially varying parameter, i.e., its value is initialized with 2 × 10⁻⁴ for the voxels representing cortical region and zero for all other voxels. With this, the alignment of cortical region is driven by both volumetric and surface force fields, whereas the subcortical region is aligned under the influence of volumetric force field. In Step 9, γ is incremented for cortical voxels with Δγ = 2 × 10⁻⁴. These values were empirically chosen such that the two forces are of the same order.
The regularization constant α in Eq. (7) is also defined as a spatially varying parameter, i.e., the voxels representing different tissue types have different values. We set the value in accordance with the mechanical properties of the tissues. According to (Budday et al., 2015), WM is more rigid than GM due to the presence of myelinated axons in WM. Thus, in view of the elastic properties of WM and GM, WM voxels are assigned lower value than GM voxels as follows:
| (8) |
The heterogeneous α ensures that the different brain tissues deform at the same rate and the estimated displacement field is smooth. Otherwise, the displacement field would be under-regularized if α is kept small for all the tissues. On the other hand, a higher value would result in an over-regularized displacement field. At each level, the value of α is decremented for GM and WM voxels with a step size Δα = 0.006. This allows the recovery of residual local displacements. α is kept constant once it drops to 0.06. If we keep on decreasing α beyond 0.06, then the tissue map would undergo excessive displacement, resulting in an irregular displacement field. Lastly, Eq. (7) is solved using finite difference approximation.
The parameter setting is in general insensitive to the type of dataset used as we do not work directly with the intensity images but rather the tissue maps, provided tissue segmentation can be performed reliably.
4. Results and Discussion
4.1. Inter-Subject Registration
We registered the tissue maps of all subjects at 2 weeks, 3 months and 6 months to a 12 month template tissue map. The tissue map of a 12-month subject with the minimum median dissimilarity with the tissue maps of all other 12-month subjects was selected as the template in order to reduce potential bias associated with template selection. All moving tissue maps, T1-weighted MR images and cortical surfaces were affinely registered to the template using FLIRT (Jenkinson and Smith, 2001; Jenkinson et al., 2002). We compared the performance of SC-DEM with state-of-the-art registration methods, including diffeomorphic Demons (Vercauteren et al., 2009), ANTs (Avants et al., 2008) and DEM (Ahmad and Khan, 2017). For all methods, registration was based on tissue maps instead of intensity images. We did not compare our method with existing surface-constrained registration methods because they give unsatisfactory segmentation results (Fig. 2), negatively affecting subsequent surface and volumetric registration. The cortical surfaces generated by BrainSuite using our tissue maps are inaccurate (see Fig. 6) and hence cannot be used for surface-constrained registration. No option was provided to use our own cortical surface for registration.
Fig. 6:
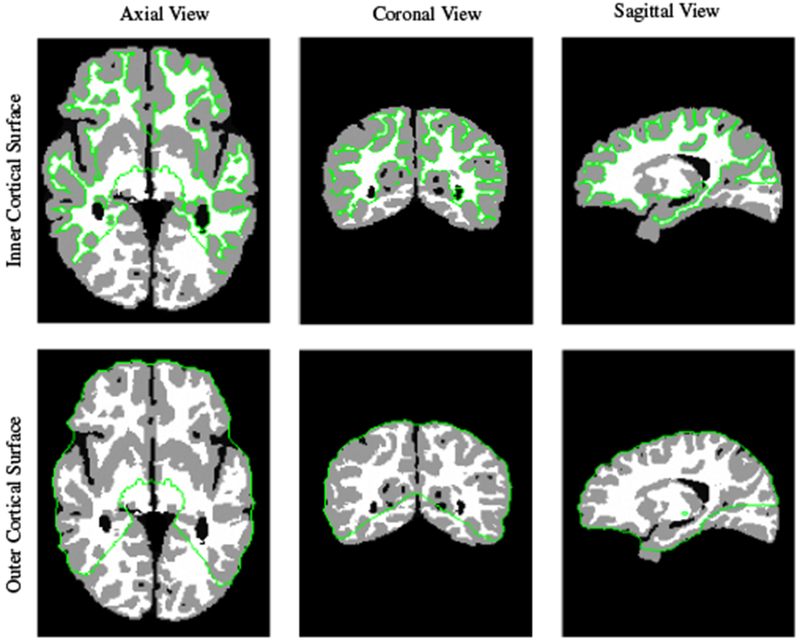
Inner and outer cortical surfaces generated by BrainSuite.
4.1.1. Qualitative Evaluation
We qualitatively evaluated the registration performance using multiple criteria. First, we visually inspected the alignment of cortical surface reconstructed from the warped moving tissue map. Fig. 7 shows the warped inner cortical surface given by five different methods for registration from 2 weeks to 12 months (Fig. 7(a)), 3 months to 12 months (Fig. 7(b)), and 6 months to 12 months (Fig. 7(c)). As indicated by the zoomed-in views of the dashed boxes, SC-DEM achieves good alignment of the cortical surfaces with the tissue maps. Fig. 8(a – c) shows the surface distance (computed using Hausdorff metric) between the warped moving cortical surface and the template cortical surface for registration from 2 weeks, 3 months, and 6 months to 12 months, respectively. It can be seen that SC-DEM yields smaller surface error (Fig. 8(fifth column)) compared with FLIRT, diffeomorphic Demons, ANTs and DEM (Fig. 8(first column – fourth column)). Fig. 9 shows the inter-subject registration results for T1-weighted MR images. The first row shows the 12-month-old template image toward which the moving images at 2 weeks, 3 months and 6 months were deformed. The 2nd–6th rows show the registration results of FLIRT, diffeomorphic Demons, ANTs, DEM and SC-DEM, respectively. Fig. 9 highlights certain regions where SC-DEM yields better alignment than the other methods.
Fig. 7:
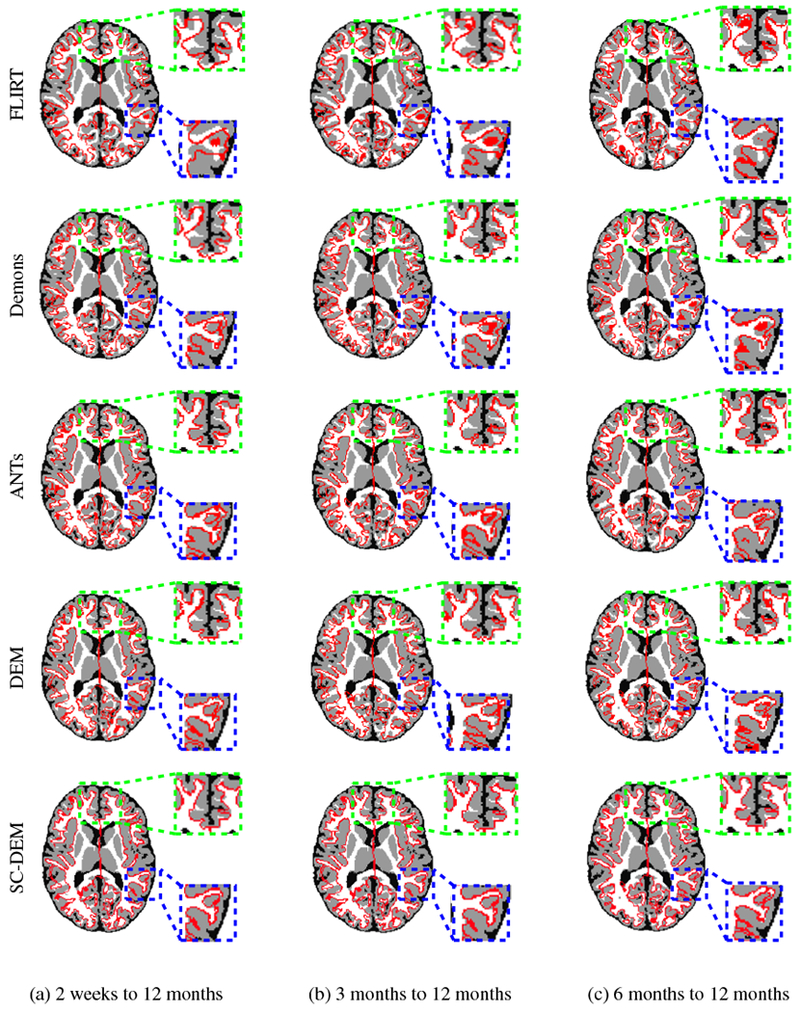
Inner cortical surface of the moving image warped using FLIRT (first row), diffeomorphic Demons (second row), ANTs (third row), DEM (fourth row) and SC-DEM (fifth row) overlaid on the template tissue map used in inter-subject registration.
Fig. 8:
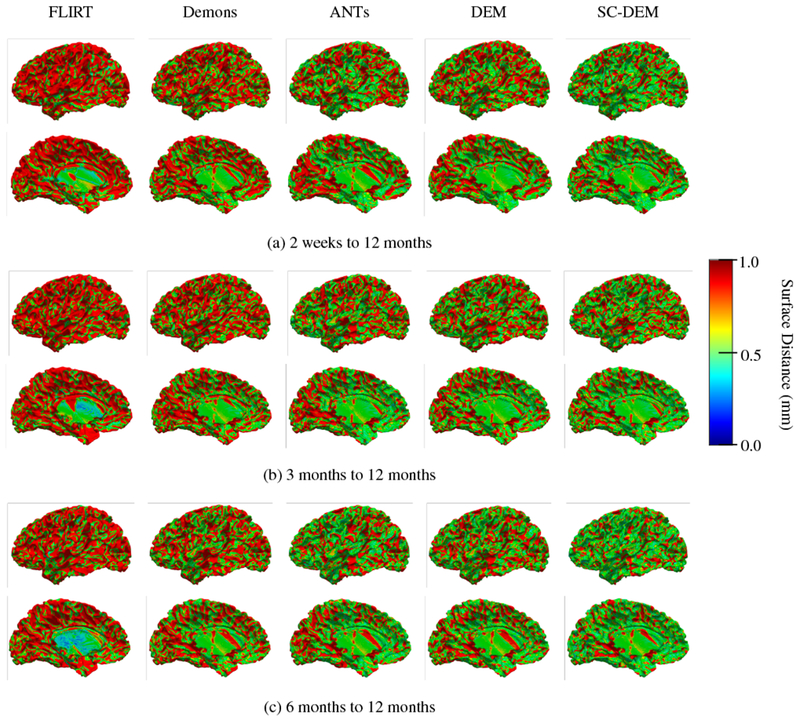
Cortical surface distance between the template cortical surface and the moving cortical surface warped using FLIRT (first column), diffeomorphic Demons (second column), ANTs (third column), DEM (fourth column) and SC-DEM (fifth column) for inter-subject registration.
Fig. 9:
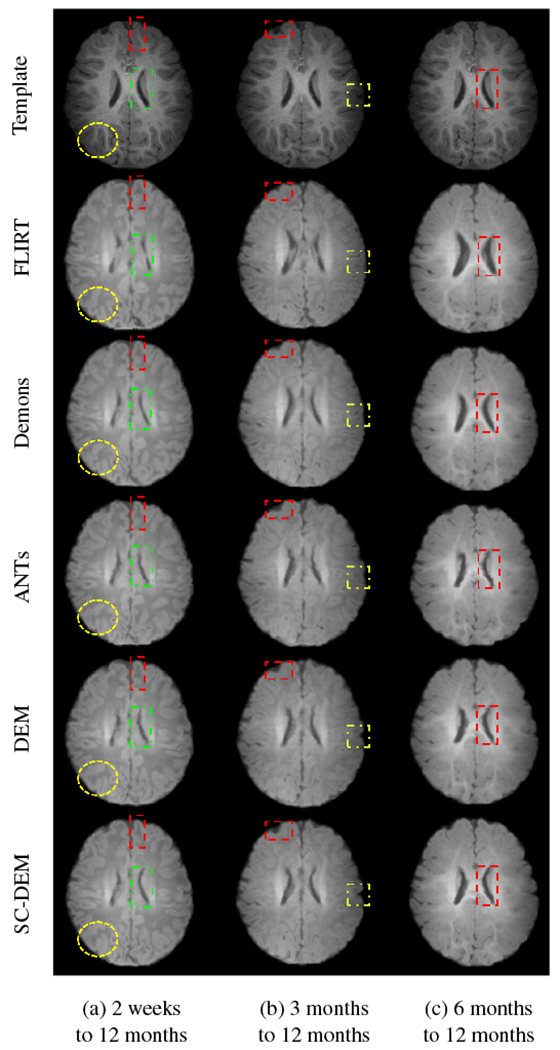
Moving T1-weighted image warped using FLIRT (second row), diffeomorphic Demons (third row), ANTs (fourth row), DEM (fifth row) and SC-DEM (sixth row), in comparison with the template image (first row) used in inter-subject registration.
4.1.2. Quantitative Evaluation
Registration accuracy was evaluated quantitatively using Dice ratio, computed between the warped moving tissue map (V1) and the template tissue map (V2) as
| (9) |
We also computed the modified Hausdorff distance between the cortical surfaces of the warped moving and template images. Let and be the sets of vertices of the warped moving and template cortical surfaces, respectively. Using the Euclidean distance d (s, t) = ‖s − t‖, the modified Hausdorff distance (MHD) is given as
| (10) |
where,
| (11) |
and
| (12) |
The distances and in Eq. (11) and Eq. (12) are defined as and .
Fig. 11 shows the Dice ratio box plots for three tissue types at three time points using five different registration methods. It can be observed that SC-DEM achieves the highest Dice ratio with statistical significance (p < 0.01) for CSF, GM and WM at all time points. These results are summarized in Table 1. The percentages of improvement over FLIRT for registration from 2 weeks, 3 months, and 6 months to 12 months are 32.76%, 31.85% and 30.33% by diffeomorphic Demons, 41.63%, 40.86% and 39.14% by ANTs, 43.52%, 40.99% and 39.16% by DEM and 53.44%, 53.56% and 50.99% by SC-DEM. In addition, we also computed the Dice ratios for 34 cortical ROIs (see Table 2). These ROIs were automatically labeled by first parcellating the cortical surface using FreeSurfer and then, assgining to each voxel in the GM cortical ribbon a label according to the nearest vertex of the cortical surface. The results, shown in Fig. 10, indicate that SC-DEM yields higher Dice ratios for the majority of the cortical ROIs with statistical significance (p < 0.01). We also show the box plots of MHDs computed between the template and warped moving inner and outer cortical surfaces in Fig. 12 for all the registration methods. Table 3 provides the corresponding statistical summary. These results show that SC-DEM achieves the lowest MHD (p < 0.01) for all the three time points.
Fig. 11:
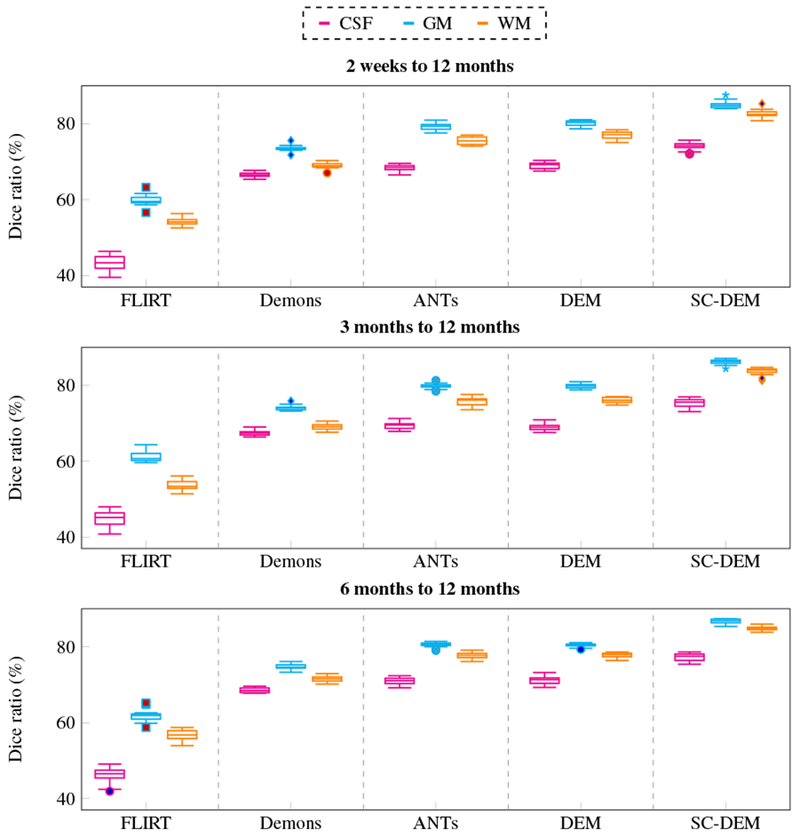
Inter-subject registration results in terms of Dice ratio for different tissue types (CSF, GM, WM).
Table 1:
Statistical summary (mean ± std) of whole-brain Dice ratio (%) for inter-subject registration. Best results are shown in bold and “*” indicates p < 0.01 for paired t-test.
| Method | 2 weeks to 12 months | 3 months to 12 months | 6 months to 12 months |
|---|---|---|---|
| FLIRT | 52.51 ± 1.05* | 53.21 ± 1.03* | 54.93 ± 1.23* |
| Demons | 69.71 ± 0.55* | 70.16 ± 0.54* | 71.59 ± 0.40* |
| ANTs | 74.37 ± 0.73* | 74.95 ± 0.74* | 76.43 ± 0.57* |
| DEM | 75.36 ± 0.69* | 75.02 ± 0.53* | 76.44 ± 0.53* |
| SC-DEM | 80.57 ± 0.88 | 81.71 ± 0.82 | 82.94 ± 0.54 |
Table 2:
List of 34 Cortical ROIs.
| ID | ROI | ID | ROI |
|---|---|---|---|
| 1 | Caudal Middle Frontal | 18 | Rostral Middle Frontal |
| 2 | Entorhinal | 19 | Rostral Anterior Cingulate |
| 3 | Post Central | 20 | Isthmus Cingulate |
| 4 | Pars Triangularis | 21 | Lateral Occipital |
| 5 | Supra Marginal | 22 | Lingual |
| 6 | Isthmus Insula | 23 | Superior Parietal |
| 7 | Banks Superior Temporal | 24 | Pars Opercularis |
| 8 | Lateral Orbito Frontal | 25 | Fusiform |
| 9 | Pars Orbitalis | 26 | Caudal Anterior Frontal |
| 10 | Middle Temporal | 27 | Superior Frontal |
| 11 | Peri Calcarine | 28 | Temporal Pole |
| 12 | Parahippocampal | 29 | Pre Cuneus |
| 13 | Para Central | 30 | Transverse Temporal |
| 14 | Medial Orbital Frontal | 31 | Pre Central |
| 15 | Frontal Pole | 32 | Inferior Parietal |
| 16 | Cuneus | 33 | Posterior Cingulate |
| 17 | Inferior Temporal | 34 | Superior Temporal |
Fig. 10:
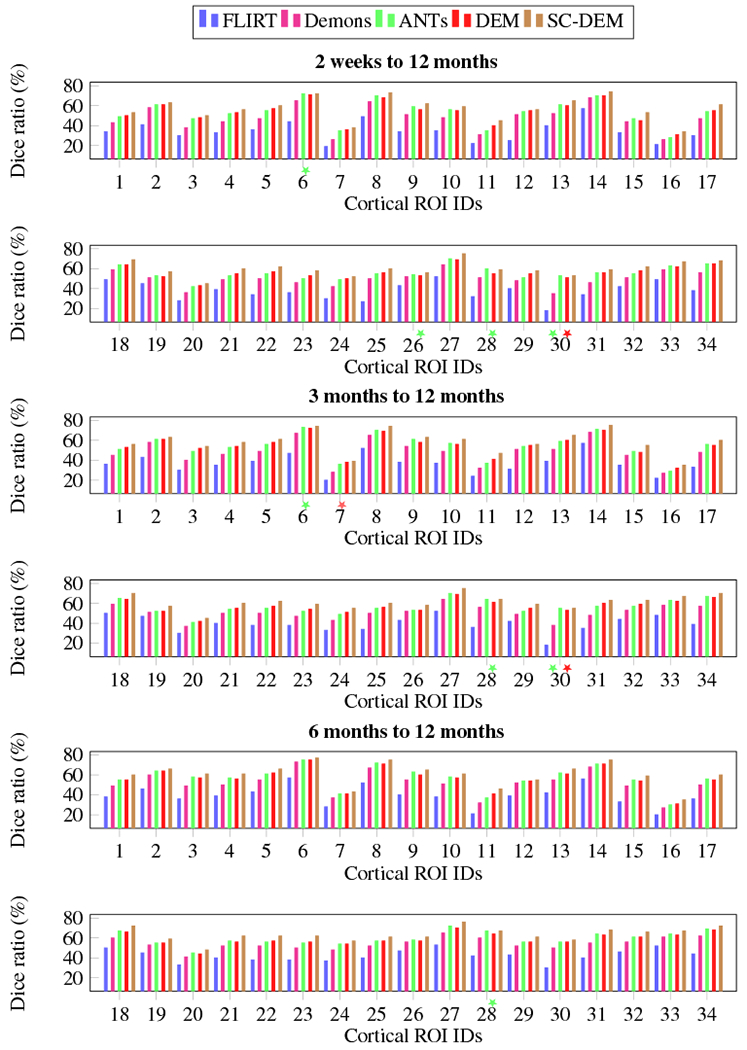
Inter-subject registration results in terms of Dice ratio for cortical ROIs. The colored stars mark differences that are not statistically significant (p > 0.01) with reference to SC-DEM.
Fig. 12:
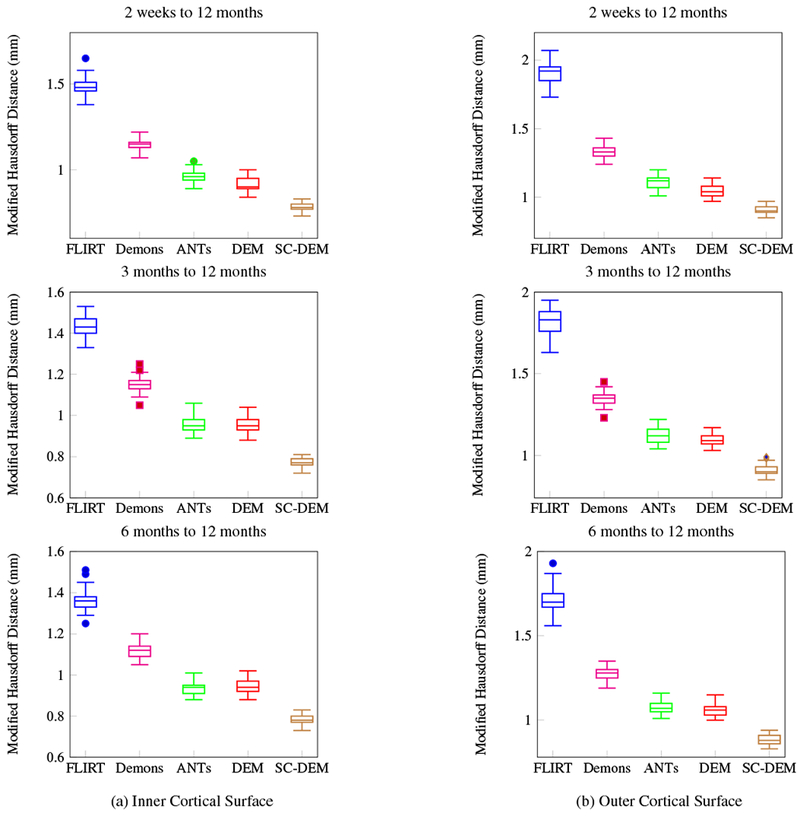
Inter-subject registration results in terms of modified Hausdorff distance for inner and outer cortical surfaces.
Table 3:
Statistical summary (mean ± std) of modified Hausdorff distance (mm) for inter-subject registration. Best results are shown in bold and “*” indicates p < 0.01 for paired t-test.
| Method | 2 weeks to 12 months |
3 months to 12 months |
6 months to 12 months |
|||
|---|---|---|---|---|---|---|
| Inner Cortical Surface | Outer Cortical Surface | Inner Cortical Surface | Outer Cortical Surface | Inner Cortical Surface | Outer Cortical Surface | |
| FLIRT | 1.49 ± 0.05* | 1.91 ± 0.08* | 1.44 ± 0.05* | 1.82 ± 0.08* | 1.37 ± 0.05* | 1.71 ± 0.08* |
| Demons | 1.14 ± 0.03* | 1.33 ± 0.04* | 1.15 ± 0.04* | 1.35 ± 0.04* | 1.12 ± 0.03* | 1.28 ± 0.04* |
| ANTs | 0.96 ± 0.04* | 1.12 ± 0.05* | 0.96 ± 0.04* | 1.13 ± 0.05* | 0.94 ± 0.03* | 1.08 ± 0.04* |
| DEM | 0.92 ± 0.04* | 1.05 ± 0.05* | 0.95 ± 0.03* | 1.10 ± 0.03* | 0.95 ± 0.04* | 1.07 ± 0.04* |
| SC-DEM | 0.79 ± 0.02 | 0.92 ± 0.03 | 0.78 ± 0.02 | 0.91 ± 0.03 | 0.79 ± 0.03 | 0.89 ± 0.03 |
4.2. Intra-Subject Registration
Intra-subject registration was performed by registering the tissue maps of all the subjects at 2 weeks, 3 months, and 6 months to their respective 12-month tissue maps. All the tissue maps were affinely aligned to the 12-month tissue maps using FLIRT. Diffeomorphic Demons, ANTs and DEM were utilized for comparison.
4.2.1. Qualitative Evaluation
Fig. 13 shows that the intra-subject registration results were qualitatively evaluated by visualizing the inner cortical surface of the warped moving image overlaid on the template tissue map. The zoomed-in views show regions where SC-DEM gives clear improvement in structural alignment. Fig. 14(a – c) shows the surface distance (computed using Hausdorff metric) between the warped moving cortical surface at 2 weeks, 3 months, and 6 months and the template cortical surface at 12 months. SC-DEM shows less surface alignment error when compared with other methods. We also present the T1-weighted moving images warped using all the five registration methods in Fig. 15. Due to the low contrast between GM and WM, visualizing improvement in cortical alignment is challenging. However, Fig. 15(a) shows that SC-DEM yields significant improvement in the alignment of the lateral ventricles.
Fig. 13:
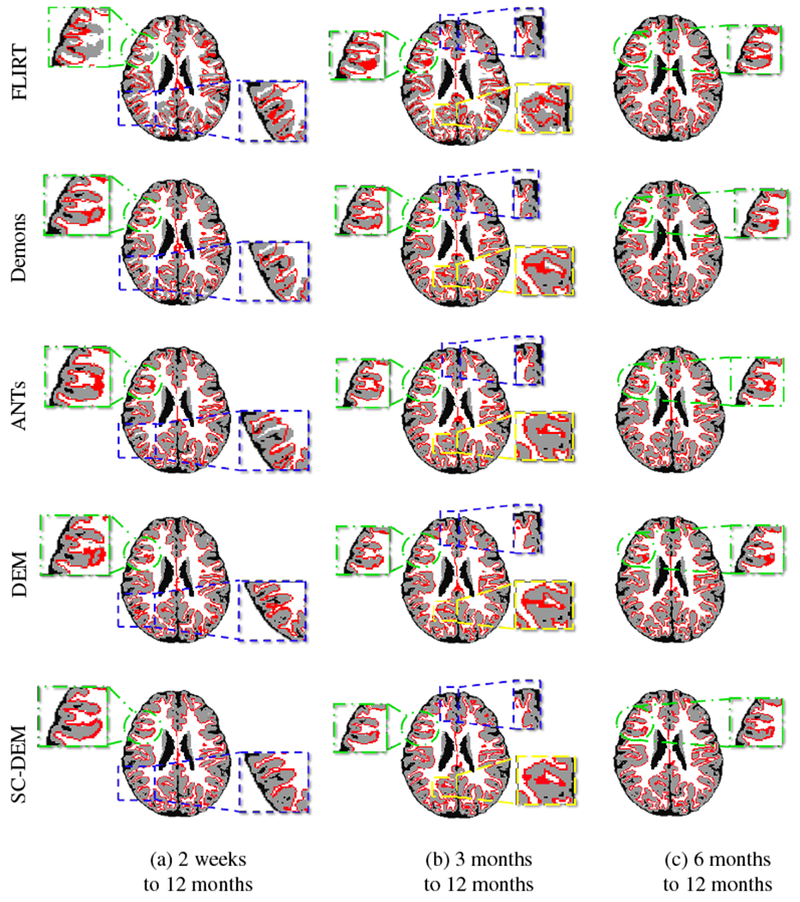
Inner cortical surface of the moving image warped using FLIRT (first row), diffeomorphic Demons (second row), ANTs (third row), DEM (fourth row) and SC-DEM (fifth row) overlaid on the template tissue map for intra-subject registration.
Fig. 14:
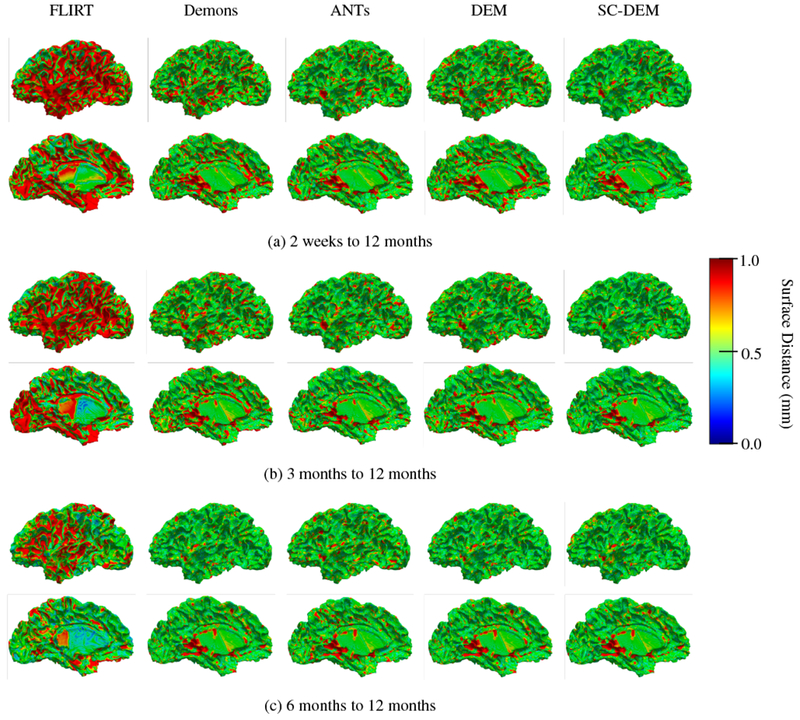
Cortical surface distance between the template cortical surface and the moving cortical surface warped using FLIRT (first column), diffeomorphic Demons (second column), ANTs (third column), DEM (fourth column) and SC-DEM (fifth column) for intra-subject registration.
Fig. 15:
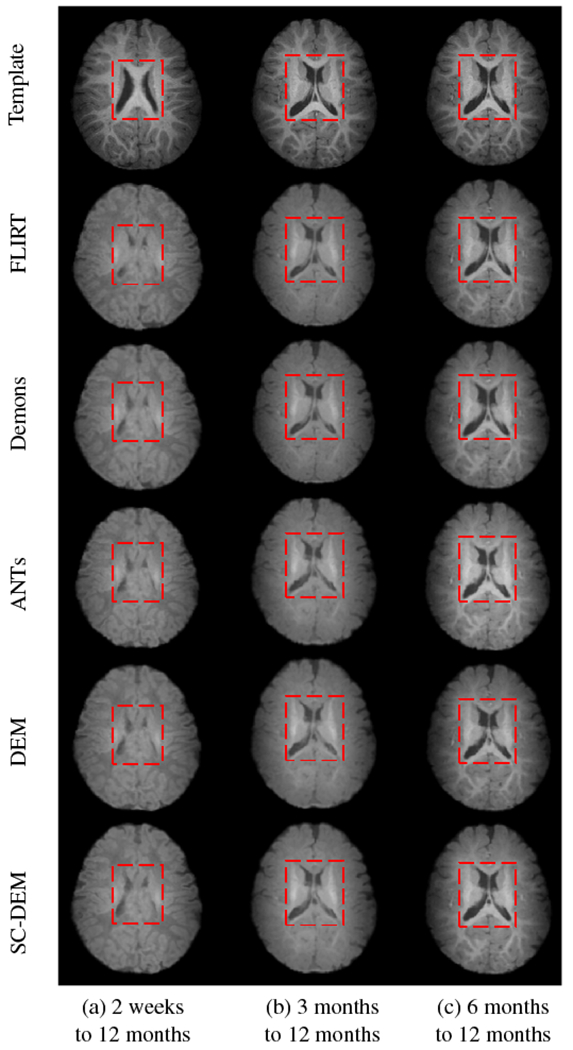
Moving image warped using FLIRT (second row), diffeomorphic Demons (third row), ANTs (fourth row), DEM (fifth row) and SC-DEM (sixth row), compared to the template image (first row) for intra-subject registration.
4.2.2. Quantitative Evaluation
Intra-subject registration result at 2 weeks, 3 months, and 6 months to 12 months were quantitatively evaluated using Dice ratio and modified Hausdorff distance. The box plots of Dice ratio for CSF, GM and WM achieved by all five registration methods at different time points are presented in Fig. 16. As evident from these box plots, SC-DEM achieves the highest Dice ratio for all tissue types. The statistical summary of whole-brain Dice ratio is presented in Table 4. The overall percentages of improvement over FLIRT registration from 2 weeks, 3 months, and 6 months to 12 months are 37.39%, 27.95% and 11.64% by diffeomorphic Demons, 43.45%, 31.34% and 12.26% by ANTs, 41.72%, 30.56% and 13.36% by DEM and 49.43%, 35.42% and 16.20% by SC-DEM. The Dice ratios for the 34 cortical ROIs, shown in Fig. 17, confirm the superiority of SC-DEM. The MHD box plots for inner and outer cortical surfaces are shown in Fig. 18, with a summary in Table 5. The results again demonstrate the superiority of SC-DEM.
Fig. 16:
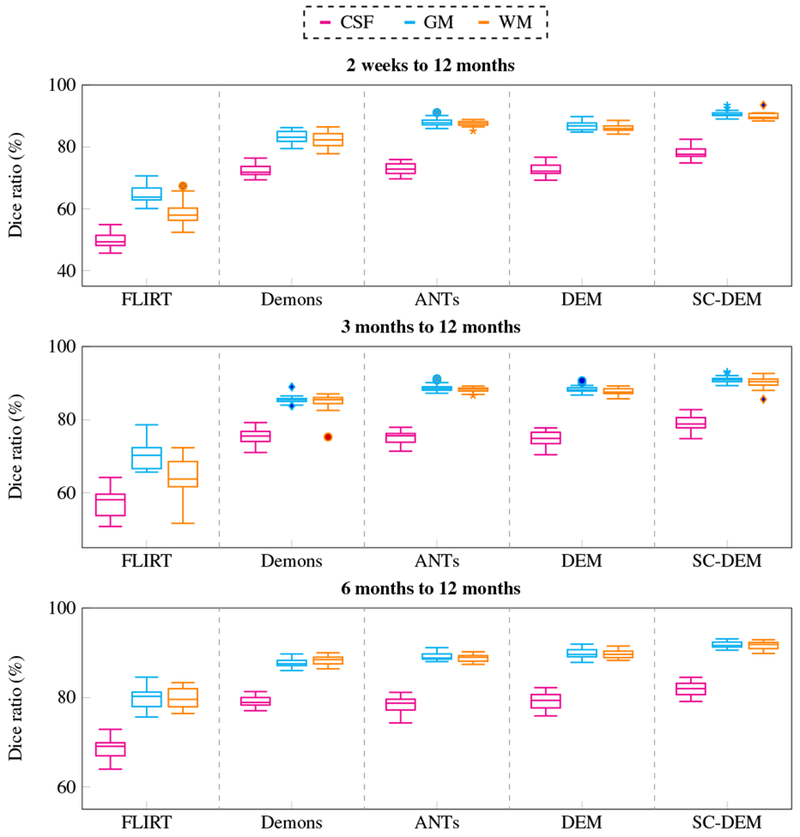
Intra-subject registration results in terms of Dice ratio for different tissue types (CSF, GM, WM).
Table 4:
Statistical summary (mean ± std) of whole-brain Dice ratio (%) for intra-subject registration. Best results are shown in bold and “*” indicates p < 0.01 for paired t-test.
| Method | 2 weeks to 12 months | 3 months to 12 months | 6 months to 12 months |
|---|---|---|---|
| FLIRT | 57.74 ± 2.57* | 63.98 ± 3.85* | 76.12 ± 2.01* |
| Demons | 79.33 ± 1.78* | 81.86 ± 1.62* | 84.98 ± 0.70* |
| ANTs | 82.83 ± 0.99* | 84.03 ± 0.73* | 85.45 ± 0.73* |
| DEM | 81.83 ± 1.15* | 83.53 ± 1.03* | 86.29 ± 0.94* |
| SC-DEM | 86.28 ± 1.14 | 86.64 ± 1.33 | 88.45 ± 0.78 |
Fig. 17:
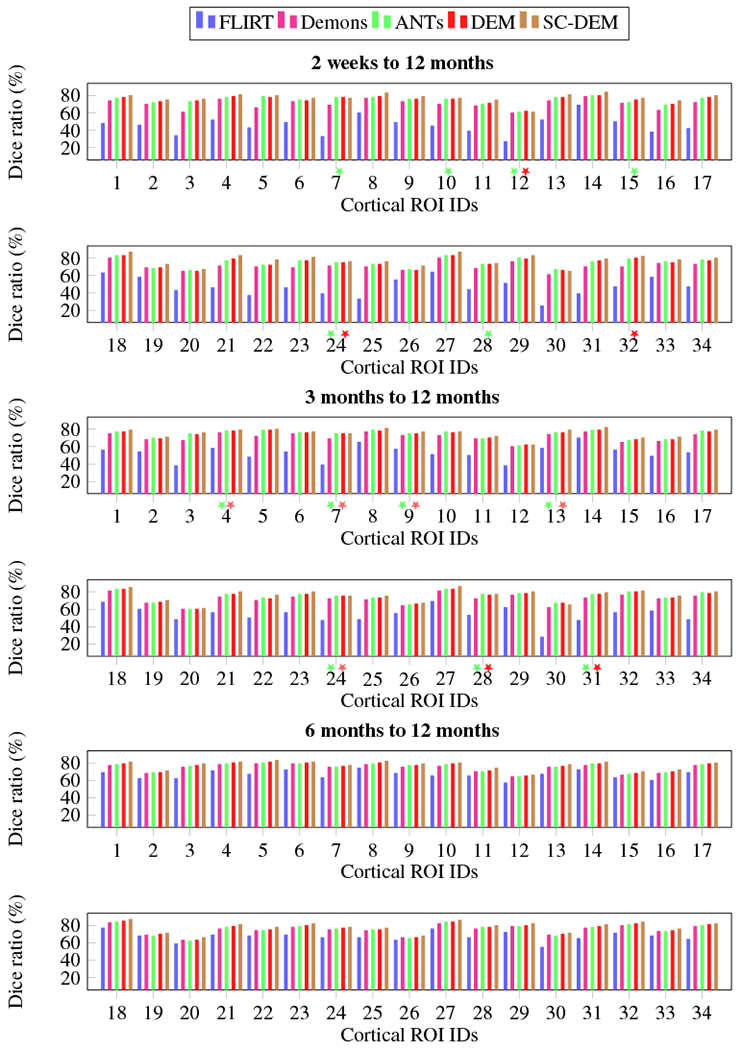
Intra-subject registration results in terms of Dice ratio for cortical ROIs. The colored stars mark differences that are not statistically significant (p > 0.01) with reference to SC-DEM.
Fig. 18:
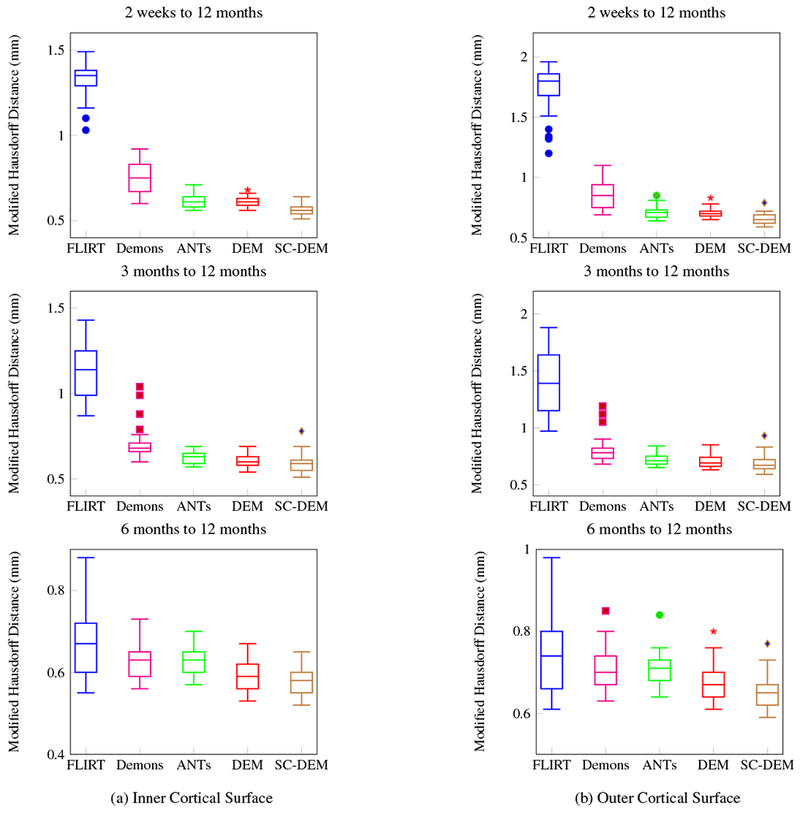
Intra-subject registration results in terms of modified Hausdorff distance for inner and outer cortical surfaces.
Table 5:
Statistical summary (mean ± std) of modified Hausdorff distance (mm) for intra-subject registration. Best results are shown in bold and “*” indicates p < 0.01 for paired t-test.
| Method | 2 weeks to 12 months |
3 months to 12 months |
6 months to 12 months |
|||
|---|---|---|---|---|---|---|
| Inner Cortical Surface | Outer Cortical Surface | Inner Cortical Surface | Outer Cortical Surface | Inner Cortical Surface | Outer Cortical Surface | |
| FLIRT | 1.33 ± 0.10* | 1.75 ± 0.18* | 1.13 ± 0.14* | 1.40 ± 0.26* | 0.67 ± 0.08* | 0.75 ± 0.10* |
| Demons | 0.75 ± 0.09* | 0.86 ± 0.10* | 0.70 ± 0.09* | 0.81 ± 0.11* | 0.63 ± 0.04* | 0.71 ± 0.05* |
| ANTs | 0.62 ± 0.03* | 0.71 ± 0.05* | 0.63 ± 0.03* | 0.72 ± 0.05* | 0.63 ± 0.03* | 0.71 ± 0.04* |
| DEM | 0.61 ± 0.02 | 0.71 ± 0.03* | 0.61 ± 0.04 | 0.71 ± 0.05 | 0.59 ± 0.04 | 0.68 ± 0.04* |
| SC-DEM | 0.56 ± 0.03 | 0.66 ± 0.04 | 0.59 ± 0.05 | 0.69 ± 0.07 | 0.58 ± 0.03 | 0.66 ± 0.04 |
4.3. Computational Time
All experiments were conducted on a machine with 3.8 GHz Intel Core i5 and 32 GB RAM. To register a pair of images, SC-DEM took around 1.5 hours, whereas diffeomorphic Demons, ANTs and DEM took around 3-, 20- and 5-minutes, respectively. Although SC-DEM is computationally more expensive, it significantly improves structural alignment.
4.4. Deformation Field Analysis
We also analyzed the smoothness of the deformation fields. Fig. 19 shows that SC-DEM results in bending energy that is lower than ANTs and DEM. Diffeomorphic Demons gives the lowest bending energy, but performs worst in terms of registration accuracy. The Jacobian maps of the deformation fields for SC-DEM, shown in Fig. 20, indicate that it preserves topology without tearing or shearing artifacts.
Fig. 19:
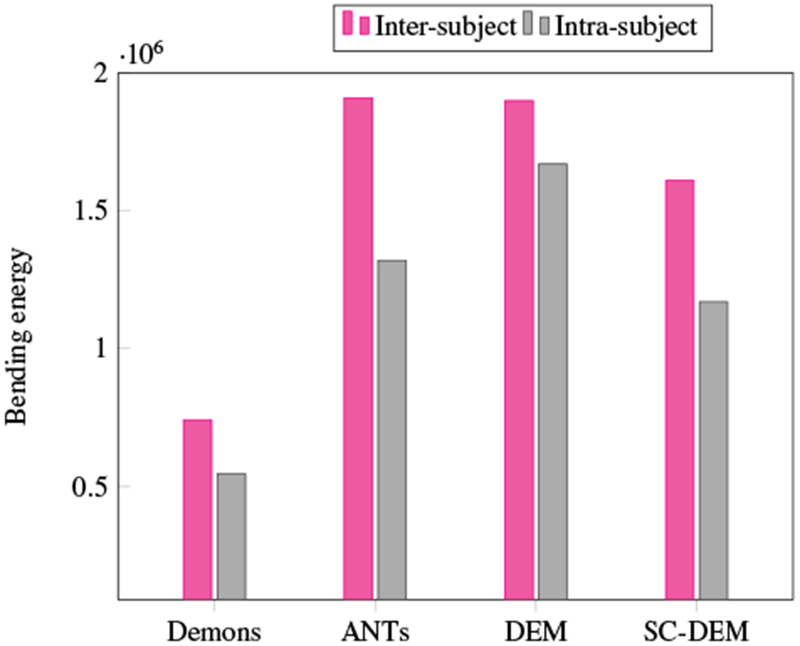
Bending energy of the deformation fields estimated using different registration methods.
Fig. 20:
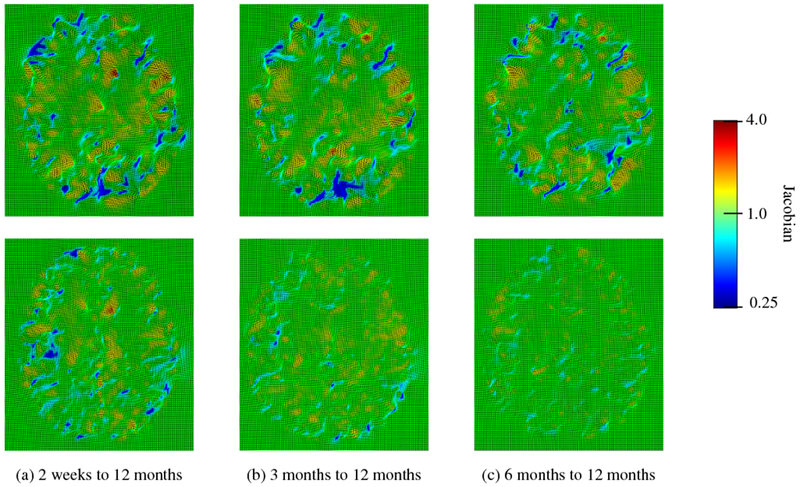
Deformation Jacobian maps of SC-DEM for inter-subject (first row) and intra-subject (second row) registration.
4.5. Parameter Sensitivity
In order to evaluate the sensitivity of the proposed method to the parameters, we changed the parameters setting and performed both inter- and intra-subject registration experiments. More specifically, we doubled the value of volumetric force field parameter β to 2.1 and halved the value of surface force field parameter γ to 1 × 10⁻⁴ in order to balance the two force fields. γ was incremented with Δγ = 1 × 10⁻⁴ and the regularization parameter α was decreased with a step size of Δα = 0.004. The rest of the parameters were kept the same as described in Section 3.3. The results in terms of Dice ratio and modified Hausdorff distance are presented in Fig. 21, where P1 denotes old parameters setting and P2 denotes new setting. The paired t-test indicates that there is no statistically significant difference (p > 0.01) between the Dice ratios (as well as MHDs) of two parameters settings. This validates that our method is insensitive to the change in parameters. We show in Table 6 the range of parameters that can be used to obtain comparable registration performance.
Fig. 21:
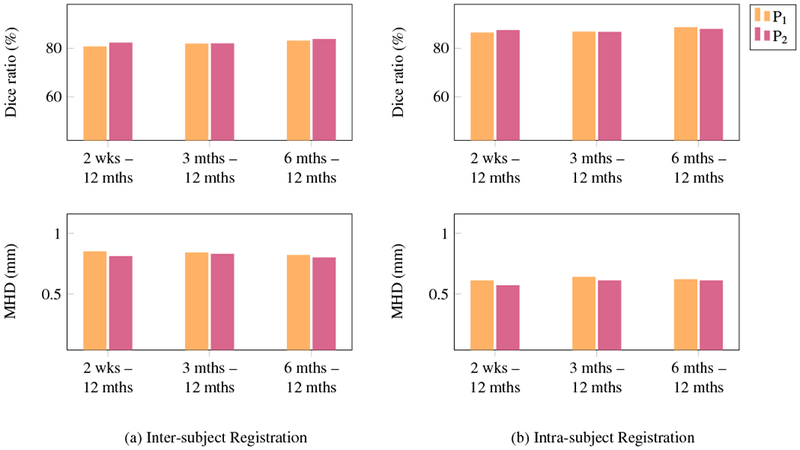
Parameter sensitivity analysis in terms of Dice ratio and modified Hausdorff distance.
Table 6:
Parameters range.
| β | γ | αWM | αGM | αother |
|---|---|---|---|---|
| [0.10, 3.00] | [0.0001, 0.003] | [0.14, 0.18] | [0.16, 0.20] | [0.20, 0.25] |
5. Conclusion
In this paper, we presented an infant brain MRI registration framework for consistently aligning the cortical folding patterns and subcortical structures. First, the cortical surfaces are registered to obtain accurate surface correspondence. Then, the estimated surface correspondence is used to constrain the volumetric registration based on a dynamic elasticity model, resulting in the alignment of both brain volume and cortical folds. Despite limited in the number of subjects, evaluation was conducted rigorously for inter- and intra-subject registration from 2 weeks, 3 months, and 6 months to 12 months, involving over a hundred registration experiments. The results demonstrate that the proposed method yields superior performance in both volumetric and surface registration.
Highlights.
Infant brain image registration is performed using segmented tissue maps instead of intensity images to deal with dynamic appearance and structural changes.
Volumetric registration utilizes pre-established cortical surface correspondences, allowing consistent alignment of both cortical and subcortical structures.
Dynamic elasticity transformation model is incorporated to recover large non-linear deformations.
Extensive inter- and intra-subject registration experiments demonstrate that proposed method achieved remarkably improved registration accuracy.
Acknowledgments
This work was supported in part by NIH grants (AG053867, EB008374, MH117943).
Footnotes
Publisher's Disclaimer: This is a PDF file of an unedited manuscript that has been accepted for publication. As a service to our customers we are providing this early version of the manuscript. The manuscript will undergo copyediting, typesetting, and review of the resulting proof before it is published in its final citable form. Please note that during the production process errors may be discovered which could affect the content, and all legal disclaimers that apply to the journal pertain.
Available at http://brainsuite.org/processing/svreg/
Conflict of Interest
None declared.
References
- Acosta O, Fripp J, Rueda A, Xiao D, Bonner E, Bourgeat P, Salvado O, 2010. 3D shape context surface registration for cortical mapping, in: IEEE International Symposium on Biomedical Imaging: From Nano to Macro (ISBI’10), Rotterdam, Netherlands pp. 1021–1024. doi: 10.1109/ISBI.2010.5490163. [DOI] [Google Scholar]
- Ahmad S, Khan MF, 2017. Dynamic elasticity model for inter-subject non-rigid registration of 3D MRI brain scans. Biomedical Signal Processing and Control 33, 346–357. doi: 10.1016/j.bspc.2016.12.016. [DOI] [Google Scholar]
- Ahmad S, Wu Z, Li G, Wang L, Lin W, Yap PT, Shen D, 2019. Surface-volume consistent construction of longitudinal atlases for the early developing brains, in: Shen D, Liu T (Eds.), Medical Image Computing and Computer Assisted Intervention - MICCAI 2019, Springer. [DOI] [PMC free article] [PubMed] [Google Scholar]
- Avants B, Epstein C, Grossman M, Gee J, 2008. Symmetric diffeomorphic image registration with cross-correlation: Evaluating automated labeling of elderly and neurodegenerative brain. Medical Image Analysis 12, 26–41. doi: 10.1016/j.media.2007.06.004. [DOI] [PMC free article] [PubMed] [Google Scholar]
- Budday S, Nay R, de Rooij R, Steinmann P, Wyrobek T, Ovaert TC, Kuhl E, 2015. Mechanical properties of gray and white matter brain tissue by indentation. Journal of the Mechanical Behavior of Biomedical Materials 46, 318–330. doi: 10.1016/j.jmbbm.2015.02.024. [DOI] [PMC free article] [PubMed] [Google Scholar]
- Chen M, Carass A, Jog A, Lee J, Roy S, Prince JL, 2017. Cross contrast multi-channel image registration using image synthesis for MR brain images. Medical Image Analysis 36, 2–14. doi: 10.1016/j.media.2016.10.005. [DOI] [PMC free article] [PubMed] [Google Scholar]
- Choe M.s., Ortiz-Mantilla S, Makris N, Gregas M, Bacic J, Haehn D, Kennedy D, Pienaar R, Caviness VS Jr, Benasich AA, Grant PE, 2013. Regional infant brain development: An MRI-based morphometric analysis in 3 to 13 month olds. Cerebral Cortex 23, 2100–2117. doi: 10.1093/cercor/bhs197. [DOI] [PMC free article] [PubMed] [Google Scholar]
- Dale AM, Fischl B, Sereno MI, 1999. Cortical surface-based analysis: I. Segmentation and surface reconstruction. NeuroImage 9, 179–194. doi: 10.1006/nimg.1998.0395. [DOI] [PubMed] [Google Scholar]
- Fischl B, Sereno MI, Dale AM, 1999. Cortical surface-based analysis: II: Inflation, flattening, and a surface-based coordinate system. NeuroImage 9, 195–207. doi: 10.1006/nimg.1998.0396. [DOI] [PubMed] [Google Scholar]
- Geng X, Li G, Lu Z, Gao W, Wang L, Shen D, Zhu H, Gilmore JH, 2017. Structural and maturational covariance in early childhood brain development. Cerebral Cortex 27, 1795–1807. doi: 10.1093/cercor/bhw022. [DOI] [PMC free article] [PubMed] [Google Scholar]
- Gholipour A, Kehtarnavaz N, Briggs R, Devous M, Gopinath K, 2007. Brain functional localization: A survey of image registration techniques. IEEE Transactions on Medical Imaging 26, 427–451. doi: 10.1109/TMI.2007.892508. [DOI] [PubMed] [Google Scholar]
- Gilmore JH, Knickmeyer RC, Gao W, 2018. Imaging structural and functional brain development in early childhood. Nature Reviews Neuroscience 19, 123–137. doi: 10.1038/nrn.2018.1. [DOI] [PMC free article] [PubMed] [Google Scholar]
- Hazlett HC, Gu H, Munsell BC, Kim SH, Styner M, Wolff JJ, Elison JT, Swanson MR, Zhu H, Botteron KN, Collins DL, Constantino JN, Dager SR, Estes AM, Evans AC, Fonov VS, Gerig G, Kostopoulos P, McKinstry RC, Pandey J, Paterson S, Pruett JR, Schultz RT, Shaw DW, Zwaigenbaum L, Piven J, for the IBIS Network, 2017. Early brain development in infants at high risk for autism spectrum disorder. Nature 542, 348–351. doi: 10.1038/nature21369. [DOI] [PMC free article] [PubMed] [Google Scholar]
- Hellier P, Barillot C, Corouge I, Gibaud B, Goualher GL, Collins DL, Evans A, Malandain G, Ayache N, Christensen GE, Johnson HJ, 2003. Retrospective evaluation of intersubject brain registration. IEEE Transactions on Medical Imaging 22, 1120–1130. doi: 10.1109/TMI.2003.816961. [DOI] [PubMed] [Google Scholar]
- Jenkinson M, Bannister P, Brady M, Smith S, 2002. Improved optimization for the robust and accurate linear registration and motion correction of brain images. NeuroImage 17, 825–841. doi: 10.1006/nimg.2002.1132. [DOI] [PubMed] [Google Scholar]
- Jenkinson M, Smith S, 2001. A global optimisation method for robust affine registration of brain images. Medical Image Analysis 5, 143–156. doi: 10.1016/S1361-8415(01)00036-6. [DOI] [PubMed] [Google Scholar]
- Joshi AA, Shattuck DW, Leahy RM, 2012. A method for automated cortical surface registration and labeling, in: Dawant BM, Christensen GE, Fitzpatrick JM, Rueckert D (Eds.), Biomedical Image Registration, Springer; Berlin Heidelberg, Berlin, Heidelberg: pp. 180–189. doi: 10.1007/978-3-642-31340-0_19. [DOI] [PMC free article] [PubMed] [Google Scholar]
- Joshi AA, Shattuck DW, Thompson PM, Leahy RM, 2007. Surface-constrained volumetric brain registration using harmonic mappings. IEEE Transactions on Medical Imaging 26, 1657–1669. doi: 10.1109/TMI.2007.901432. [DOI] [PMC free article] [PubMed] [Google Scholar]
- Kim M, Wu G, Wang Q, Lee SW, Shen D, 2015. Improved image registration by sparse patch-based deformation estimation. NeuroImage 105, 257–268. doi: 10.1016/j.neuroimage.2014.10.019. [DOI] [PMC free article] [PubMed] [Google Scholar]
- Knickmeyer RC, Gouttard S, Kang C, Evans D, Wilber K, Smith JK, Hamer RM, Lin W, Gerig G, Gilmore JH, 2008. A structural MRI study of human brain development from birth to 2 years. The Journal of Neuroscience: The Official Journal of the Society for Neuroscience 28,12176–12182. doi: 10.1523/JNEUROSCI.3479-08.2008. [DOI] [PMC free article] [PubMed] [Google Scholar]
- Li G, Lin W, Gilmore JH, Shen D, 2015a. Spatial patterns, longitudinal development, and hemispheric asymmetries of cortical thickness in infants from birth to 2 years of age. Journal of Neuroscience 35, 9150–9162. doi: 10.1523/JNEUROSCI.4107-14.2015. [DOI] [PMC free article] [PubMed] [Google Scholar]
- Li G, Nie J, Wang L, Shi F, Gilmore JH, Lin W, Shen D, 2014a. Measuring the dynamic longitudinal cortex development in infants by reconstruction of temporally consistent cortical surfaces. NeuroImage 90, 266–279. doi: 10.1016/j.neuroimage.2013.12.038. [DOI] [PMC free article] [PubMed] [Google Scholar]
- Li G, Nie J, Wang L, Shi F, Lin W, Gilmore JH, Shen D, 2013. Mapping region-specific longitudinal cortical surface expansion from birth to 2 years of age. Cerebral Cortex 23, 2724–2733. doi: 10.1093/cercor/bhs265. [DOI] [PMC free article] [PubMed] [Google Scholar]
- Li G, Nie J, Wang L, Shi F, Lyall AE, Lin W, Gilmore JH, Shen D, 2014b. Mapping longitudinal hemispheric structural asymmetries of the human cerebral cortex from birth to 2 years of age. Cerebral Cortex 24, 1289–1300. doi: 10.1093/cercor/bhs413. [DOI] [PMC free article] [PubMed] [Google Scholar]
- Li G, Nie J, Wu G, Wang Y, Shen D, 2012. Consistent reconstruction of cortical surfaces from longitudinal brain MR images. Neurolmage 59, 3805–3820. doi: 10.1016/j.neuroimage.2011.11.012. [DOI] [PMC free article] [PubMed] [Google Scholar]
- Li G, Wang L, Shi F, Gilmore JH, Lin W, Shen D, 2015b. Construction of 4D high-definition cortical surface atlases of infants: Methods and applications. Medical Image Analysis 25, 22–36. doi: 10.1016/j.media.2015.04.005. [DOI] [PMC free article] [PubMed] [Google Scholar]
- Li G, Wang L, Shi F, Lyall AE, Lin W, Gilmore JH, Shen D, 2014c. Mapping longitudinal development of local cortical gyrification in infants from birth to 2 years of age. Journal of Neuroscience 34, 4228–4238. doi: 10.1523/JNEUROSCI.3976-13.2014. [DOI] [PMC free article] [PubMed] [Google Scholar]
- Li G, Wang L, Yap PT, Wang F, Wu Z, Meng Y, Dong P,, Kim J, Shi F, Rekik I, Lin W, Shen D, 2018. Computational neuroanatomy of baby brains: A review. Neuroimage doi: 10.1016/j.neuroimage.2018.03.042. [DOI] [PMC free article] [PubMed] [Google Scholar]
- Lyall AE, Shi F, Geng X, Woolson S, Li G, Wang L, Hamer RM, Shen D, Gilmore JH, 2015. Dynamic development of regional cortical thickness and surface area in early childhood. Cerebral Cortex 25, 2204–2212. doi: 10.1093/cercor/bhu027. [DOI] [PMC free article] [PubMed] [Google Scholar]
- Matsuzawa J, Matsui M, Konishi T, Noguchi K, Gur RC, Bilker W, Miyawaki T, 2001. Age-related volumetric changes of brain gray and white matter in healthy infants and children. Cerebral Cortex 11, 335–342. doi: 10.1093/cercor/11.4.335. [DOI] [PubMed] [Google Scholar]
- Meng Y, Li G, Lin W, Gilmore JH, Shen D, 2014. Spatial distribution and longitudinal development of deep cortical sulcal landmarks in infants. Neuroimage 100, 206–218. doi: 10.1016/j.neuroimage.2014.06.004. [DOI] [PMC free article] [PubMed] [Google Scholar]
- Nie J, Li G, Shen D, 2013. Development of cortical anatomical properties from early childhood to early adulthood. Neuroimage 76, 216–224. doi: 10.1016/j.neuroimage.2013.03.021. [DOI] [PMC free article] [PubMed] [Google Scholar]
- Nie J,Li G, Wang L, Gilmore JH, Lin W, Shen D,2012. A computational growth model for measuring dynamic cortical development in the first year of life. Cerebral Cortex 22, 2272–2284. doi: 10.1093/cercor/bhr293. [DOI] [PMC free article] [PubMed] [Google Scholar]
- Nie J, Li G, Wang L, Shi F, Lin W, Gilmore JH, Shen D, 2014. Longitudinal development of cortical thickness, folding, and fiber density networks in the first 2 years of life. Human Brain Mapping 35, 3726–3737. doi: 10.1002/hbm.22432. [DOI] [PMC free article] [PubMed] [Google Scholar]
- Park H, Park JS, Seong JK, Na DL, Lee JM, 2012. Cortical surface registration using spherical thin-plate spline with sulcal lines and mean curvature as features. Journal of Neuroscience Methods 206, 46–53. doi: 10.1016/j.jneumeth.2012.02.010. [DOI] [PubMed] [Google Scholar]
- Paterson SJ, Heim S, Friedman JT, Choudhury N, Benasich AA, 2006. Development of structure and function in the infant brain: Implications for cognition, language and social behaviour. Neuroscience & Biobehavioral Reviews 30, 1087–1105. doi: 10.1016/j.neubiorev.2006.05.001. [DOI] [PMC free article] [PubMed] [Google Scholar]
- Postelnicu G, Zöllei L, Fischl B, 2009. Combined volumetric and surface registration. IEEE Transactions on Medical Imaging 28, 508–522. doi: 10.1109/TMI.2008.2004426. [DOI] [PMC free article] [PubMed] [Google Scholar]
- Shen D, Davatzikos C, 2002. HAMMER: hierarchical attribute matching mechanism for elastic registration. IEEE Transactions on Medical Imaging 21, 1421–1439. doi: 10.1109/TMI.2002.803111. [DOI] [PubMed] [Google Scholar]
- Shi F, Wang L, Dai Y, Gilmore JH, Lin W, Shen D, 2012. LABEL: Pediatric brain extraction using learning-based meta-algorithm. Neuroimage 62, 1975–1986. doi: 10.1016/j.neuroimage.2012.05.042. [DOI] [PMC free article] [PubMed] [Google Scholar]
- Shi J, Wang Y, Ceschin R, An X, Lao Y, Vanderbilt D, Nelson MD, Thompson PM, Panigrahy A, Lepore N, 2013. A multivariate surface-based analysis of the putamen in premature newborns: Regional differences within the ventral striatum. PLOS ONE 8,1–9. doi: 10.1371/journal.pone.0066736. [DOI] [PMC free article] [PubMed] [Google Scholar]
- Sled JG, Zijdenbos AP, Evans AC, 1998. A nonparametric method for automatic correction of intensity nonuniformity in MRI data. IEEE Transactions on Medical Imaging 17, 87–97. doi: 10.1109/42.668698. [DOI] [PubMed] [Google Scholar]
- Tang S, Cong W, Yang J, Fu T, Song H, Ai D, Wang Y, 2018. Local statistical deformation models for deformable image registration. Neurocomputing doi: 10.1016/j.neucom.2018.03.039. [DOI] [Google Scholar]
- Vercauteren T, Pennec X, Perchant A, Ayache N, 2009. Diffeomorphic demons: Efficient non-parametric image registration. NeuroImage 45, S61–S72. doi: 10.1016/j.neuroimage.2008.10.040. [DOI] [PubMed] [Google Scholar]
- Wang L, Gao Y, Shi F, Li G, Gilmore JH, Lin W, Shen D, 2015a. LINKS: Learning-based multi-source IntegratioN frameworK for Segmentation of infant brain images. NeuroImage 108, 160–172. doi: 10.1016/j.neuroimage.2014.12.042. [DOI] [PMC free article] [PubMed] [Google Scholar]
- Wang Q, Kim M, Shi Y, Wu G, Shen D, 2015b. Predict brain MR image registration via sparse learning of appearance and transformation. Medical Image Analysis 20, 61–75. doi: 10.1016/j.media.2014.10.007. [DOI] [PMC free article] [PubMed] [Google Scholar]
- Wei L, Cao X, Wang Z, Gao Y, Hu S, Wang L, Wu G, Shen D, 2017. Learning-based deformable registration for infant MRI by integrating random forest with auto-context model. Medical Physics 44, 6289–6303. doi: 10.1002/mp.12578. [DOI] [PMC free article] [PubMed] [Google Scholar]
- Wu G, Kim M, Wang Q, Munsell BC, Shen D, 2016. Scalable high-performance image registration framework by unsupervised deep feature representations learning. IEEE Transactions on Biomedical Engineering 63, 1505–1516. doi: 10.1109/TBME.2015.2496253. [DOI] [PMC free article] [PubMed] [Google Scholar]
- Wu G, Qi FQ, Shen D, 2006. Learning-based deformable registration of MR brain images. IEEE Transactions on Medical Imaging 25, 1145–1157. doi: 10.1109/TMI.2006.879320. [DOI] [PubMed] [Google Scholar]
- Wu Y, Wu G, Wang L, Munsell Brent C, Wang Q, Lin W, Feng Q, Chen W, Shen D, 2015. Hierarchical and symmetric infant image registration by robust longitudinal-example-guided correspondence detection. Medical Physics 42, 4174–4189. doi: 10.1118/1.4922393. [DOI] [PMC free article] [PubMed] [Google Scholar]
- Xue H, Srinivasan L, Jiang S, Rutherford M, Edwards AD, Rueckert D, Hajnal JV, 2007. Automatic segmentation and reconstruction of the cortex from neonatal MRI. NeuroImage 38, 461–477. doi: 10.1016/j.neuroimage.2007.07.030. [DOI] [PubMed] [Google Scholar]
- Xue Z, Shen D, Davatzikos C, 2006a. Statistical representation of high-dimensional deformation fields with application to statistically constrained 3D warping. Medical Image Analysis 10, 740–751. doi: 10.1016/j.media.2006.06.007. [DOI] [PubMed] [Google Scholar]
- Xue Z, Shen D, Karacali B, Stern J, Rottenberg D, Davatzikos C, 2006b. Simulating deformations of MR brain images for validation of atlas-based segmentation and registration algorithms. NeuroImage 33, 855–866. doi: 10.1016/j.neuroimage.2006.08.007. [DOI] [PMC free article] [PubMed] [Google Scholar]
- Yang X, Kwitt R, Styner M, Niethammer M, 2017. Quicksilver: Fast predictive image registration - A deep learning approach. NeuroImage 158, 378–396. doi: 10.1016/j.neuroimage.2017.07.008. [DOI] [PMC free article] [PubMed] [Google Scholar]
- Yeo BTT, Sabuncu MR, Vercauteren T, Ayache N, Fischl B, Golland P, 2010. Spherical demons: Fast diffeomorphic landmark-free surface registration. IEEE Transactions on Medical Imaging 29, 650–668. doi: 10.1109/TMI.2009.2030797. [DOI] [PMC free article] [PubMed] [Google Scholar]
- Zöllei L, Stevens A, Huber K, Kakunoori S, Fischl B, 2010. Improved tractography alignment using combined volumetric and surface registration. NeuroImage 51, 206–213. doi: 10.1016/j.neuroimage.2010.01.101. [DOI] [PMC free article] [PubMed] [Google Scholar]
- Zou G, Hua J, Muzik O, 2007. Non-rigid surface registration using spherical thin-plate splines, in: Ayache N, Ourselin S, Maeder A (Eds.), Medical Image Computing and Computer-Assisted Intervention - MICCAI 2007, Springer; Berlin Heidelberg, Berlin, Heidelberg: pp. 367–374. doi: 10.1007/978-3-540-75757-3_45. [DOI] [PubMed] [Google Scholar]


