Abstract
Background and Purpose
Comorbid cancer is common in patients with acute ischemic stroke (AIS). As blood mRNA profiles can distinguish AIS mechanisms, we hypothesized that cancer-related AIS would have a distinctive gene expression profile.
Methods
We evaluated 4 groups of 10 subjects prospectively enrolled at three centers from 2009–2018. This included the group-of-interest with active solid tumor cancer and AIS, and three control groups with active cancer only, AIS only, or vascular risk factors only. Subjects in the AIS-only and cancer-only groups were matched to subjects in the cancer-stroke group by age, sex, and cancer type (if applicable). Subjects in the vascular risk factor group were matched to subjects in the cancer-stroke and stroke-only groups by age, sex, and vascular risk factors. Blood was drawn 72–120 hours after stroke. Total RNA was processed using 3’ mRNA-sequencing. ANOVA and Fisher’s least significant difference contrast methods were used to estimate differential gene expression between groups.
Results
In the cancer-stroke group, 50% of strokes were cryptogenic. All groups had differentially expressed genes that could distinguish among them. Comparing the cancer-stroke group to the stroke-only group and after accounting for cancer-only genes, 438 genes were differentially expressed, including upregulation of multiple genes/pathways implicated in autophagy signaling, immunity/inflammation, and gene regulation, including interleukin-1, interferon, relaxin, mTOR signaling, SQSTM1, and CREB1.
Conclusions
This study provides evidence for a distinctive molecular signature in blood mRNA expression profiles of patients with cancer-related AIS. Future studies should evaluate whether blood mRNA can predict detection of occult cancer in patients with AIS.
Clinical Trial Registration Information
URL: https://clinicaltrials.gov. Unique identifier: .
Keywords: cancer and stroke, stroke, gene expression, Gene Expression and Regulation, Ischemic Stroke
Introduction
About one-third of acute ischemic strokes (AIS) have no identifiable cause and are labeled cryptogenic.1 Among patients with cryptogenic AIS, retrospective studies suggest that 5–10% will be diagnosed with cancer within 1–2 years after their stroke.2, 3 Additionally, a large claims-based analysis reported that in the year before cancer diagnosis, AIS risk is increased 59%.4 Therefore, some cryptogenic AIS are probably caused or triggered by occult cancer. This hypothesis is supported by numerous reports of cancer presenting with cryptogenic AIS.5
As earlier detection of cancer might translate into better outcomes, having a non-invasive biomarker that reliably predicts detection of cancer in AIS patients could be useful. Previous studies have demonstrated that differential blood mRNA expression profiles can distinguish AIS subtypes, hemorrhagic versus ischemic stroke, and TIA versus mimics.6 We hypothesized that cancer-related AIS would also have a distinct blood mRNA expression profile.
Methods
Design
This analysis included 40 subjects prospectively enrolled at academic centers in New York, California, and Alberta, Canada between 2009–2018. Subjects were divided into 4 groups of 10, including the group-of-interest, subjects with active solid tumor cancer and AIS. The three control groups were subjects with active cancer only, AIS only, or vascular risk factors only (VRFC). Subjects in the stroke-only group were individually matched to subjects in the cancer-stroke group by age stratum (≥65 years vs. <65 years) and sex; while subjects in the cancer-only group were individually matched to subjects in the cancer-stroke group by age stratum (≥65 years vs. <65 years), sex, and cancer type. Subjects in the VRFC group were individually matched to subjects in the cancer-stroke and stroke-only groups by age stratum (≥65 years vs. <65 years), sex, and several vascular risk factors, including race. In cases when an exact match on all vascular risk factors could not be identified, the most similar available subject was used for matching. Full eligibility/matching criteria are described in the Supplemental Methods (all supplemental materials are available at http://stroke.ahajournals.org). Participating institutions’ review boards approved this study. This study was registered at clinicaltrials.gov (URL: https://clinicaltrials.gov; identifier: ). All subjects or their surrogates provided written informed consent. Study data and materials are available upon reasonable request.
Sample Processing
Blood was collected in PAXgene tubes (Qiagen). Total RNA was isolated per PreAnalytix protocol. In the stroke groups, blood was drawn 72–120 hours from onset. QuantSeq FWD 3’ mRNA (Lexogen) libraries were prepared and globin depleted. Unique molecular identifiers were incorporated to collapse PCR duplicates. Samples were sequenced to an average 7.4 million SE 100bp reads. Data were aligned (STAR 2.5.3c, Hg38, GENCODE 25) and gene-level expression was quantified. Reads were quantile normalized after an offset of 0.0001 and log transformation. Genes with ≤10 reads across all samples were excluded, yielding 12,043 genes for analysis.
Analysis
Subject groups were compared using ANOVA in Partek Genomics Suite (Partek Inc.). To delineate unique and common expression patterns between the cancer-stroke and stroke-only groups, while accounting for the contribution of cancer through the cancer-only group, the gene level expression of each subject group was compared to the VRFC group or to each other. Genes with a false discovery rate-corrected value of p<0.2 (nominal p<0.05) and a fold-change>1.2 were considered significant. This fold-change criterion was used to promote identification of biologically significant gene expression level change. Differentially expressed genes were then overlapped to determine whether the cancer-stroke group had a distinct expression profile. The REML method of variance estimates for unbalanced designs and Fisher’s least significant difference contrast method were used to estimate differential gene expression between subject groups. For data visualization, we performed unsupervised hierarchical clustering and principal component analysis (PCA). Ingenuity Pathway Analysis identified overrepresented pathways (Supplemental Methods for details).
Results
Characteristics
Demographic and vascular risk factors were similar between groups (Table 1). In the cancer-stroke group, underlying cancers were lung (n=3), breast (n=3), prostate (n=2), pancreas (n=1), or ovarian (n=1); adjudicated stroke mechanisms were cryptogenic (n=5) or cardioembolic (n=5).
Table 1.
Subject Characteristics, Stratified by Study Group
| Characteristic* | Cancer-Stroke (N=10) | Stroke-Only (N=10) | Cancer-Only (N=10) | Vascular Risk Factors-Only (N=10) |
|---|---|---|---|---|
| Age, mean (SD), year | 63 (12) | 67 (15) | 59 (18) | 61 (11) |
| Female | 6 (60) | 6 (60) | 6 (60) | 6 (60) |
| Race | ||||
| White | 7 (70) | 10 (100) | 7 (70) | 7 (70) |
| Black | 2 (20) | 0 (0) | 3 (30) | 1 (10) |
| Other | 1 (10) | 0 (0) | 0 (0) | 2 (20) |
| Time from last known well to blood draw, hours (mean ± SD) | 94 (11) | 95 (12) | N/A | N/A |
| Cancer type | ||||
| Lung | 3 (30) | N/A | 3 (30) | N/A |
| Breast | 3 (30) | N/A | 3 (30) | N/A |
| Prostate | 2 (20) | N/A | 3 (30) | N/A |
| Pancreas | 1 (10) | N/A | 0 (0) | N/A |
| Ovarian | 1 (10) | N/A | 1 (10) | N/A |
| Adenocarcinoma | 10 (100) | N/A | 10 (100) | N/A |
| Systemic metastases | 9 (90) | N/A | 10 (100) | N/A |
| Brain metastases | 1 (10) | N/A | 3 (30) | N/A |
| Chemotherapy within 30 days | 7 (70) | N/A | 8 (80) | N/A |
| WBC, mean (SD), count/nL | 7.7 (3.8) | 7.0 (2.6) | 5.9 (1.9) | --† |
| Platelet, mean (SD), count/nL | 197 (48) | 207 (63) | 270 (110) | --† |
| Stroke mechanism‡ | ||||
| Large artery atherosclerosis | 0 (0) | 1 (10) | N/A | N/A |
| Small vessel disease | 0 (0) | 1 (10) | N/A | N/A |
| Cardioembolic | 5 (50) | 2 (20) | N/A | N/A |
| Other | 0 (0) | 1 (1) | N/A | N/A |
| Cryptogenic | 5 (50) | 5 (50) | N/A | N/A |
| NIH Stroke Scale, mean (SD) | 4 (3) | 1 (2) | N/A | N/A |
| Vascular risk factors | ||||
| Diabetes mellitus | 2 (20) | 0 (0) | 2 (20) | 1 (10) |
| Hypertension | 5 (50) | 7 (70) | 4 (40) | 7 (70) |
| Hyperlipidemia | 2 (20) | 6 (60) | 1 (10) | 4 (40) |
| Peripheral artery disease | 0 (0) | 0 (0) | 1 (10) | 0 (0) |
| Atrial fibrillation | 1 (10) | 0 (0) | 1 (10) | 0 (0) |
| Coronary artery disease | 0 (0) | 0 (0) | 1 (10) | 0 (0) |
| Chronic kidney disease | 0 (0) | 0 (0) | 1 (10) | 0 (0) |
| Prior stroke/TIA | 2 (20) | 0 (0) | 1 (10) | 0 (0) |
| Smoking history (any) | 3 (30) | 2 (20) | 4 (40) | 4 (40) |
Abbreviations: SD, standard deviation; N/A, not applicable; WBC, white blood cell
All data are presented as number (%) unless otherwise specified.
Not performed because samples amenable to blood counts calculation were not collected.
According to the Trial of ORG 10172 (TOAST) clasification
Differential Expression Compared to VRFC Group
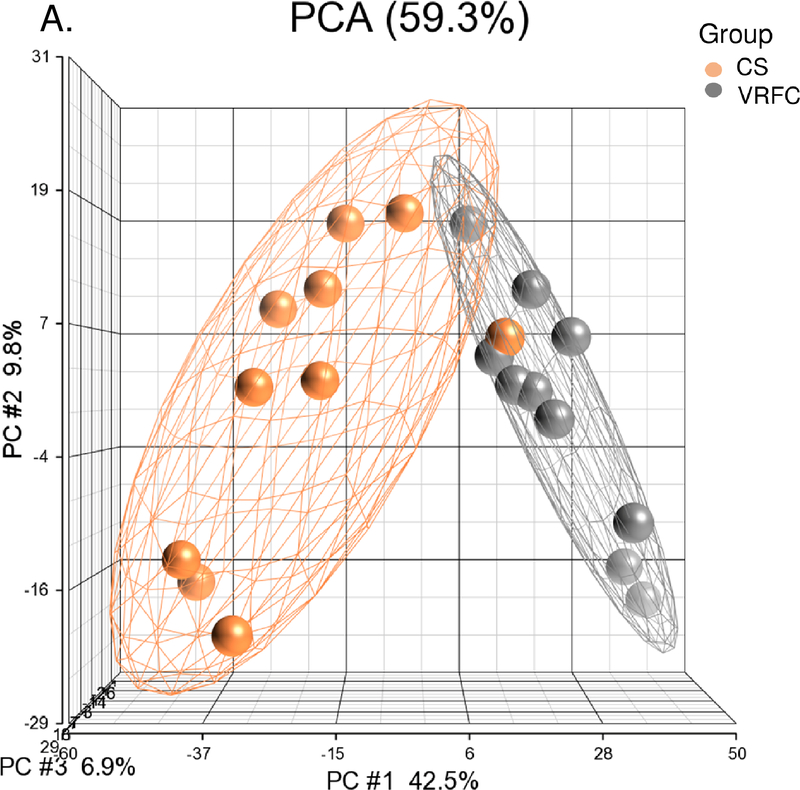
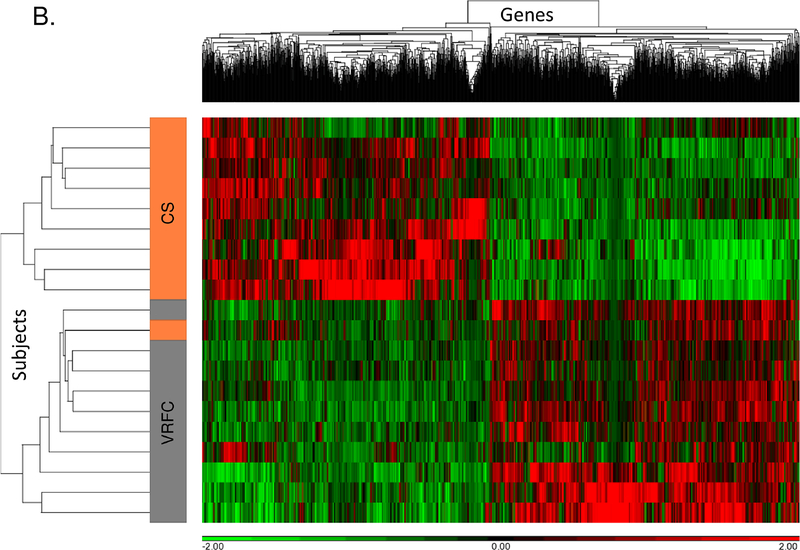
Between the cancer-stroke and VRFC groups, there were 1,797 differential expressed genes (867 upregulated, 930 downregulated) (Supplemental Table I). PCA and unsupervised hierarchical clustering separated most subjects in these groups based on their differentially expressed genes (Figure 1A, 1B). There were 102 pathways overrepresented (Supplemental Table II), including the activation of nine signaling pathways (Supplemental Figure IA).
Figure 1.
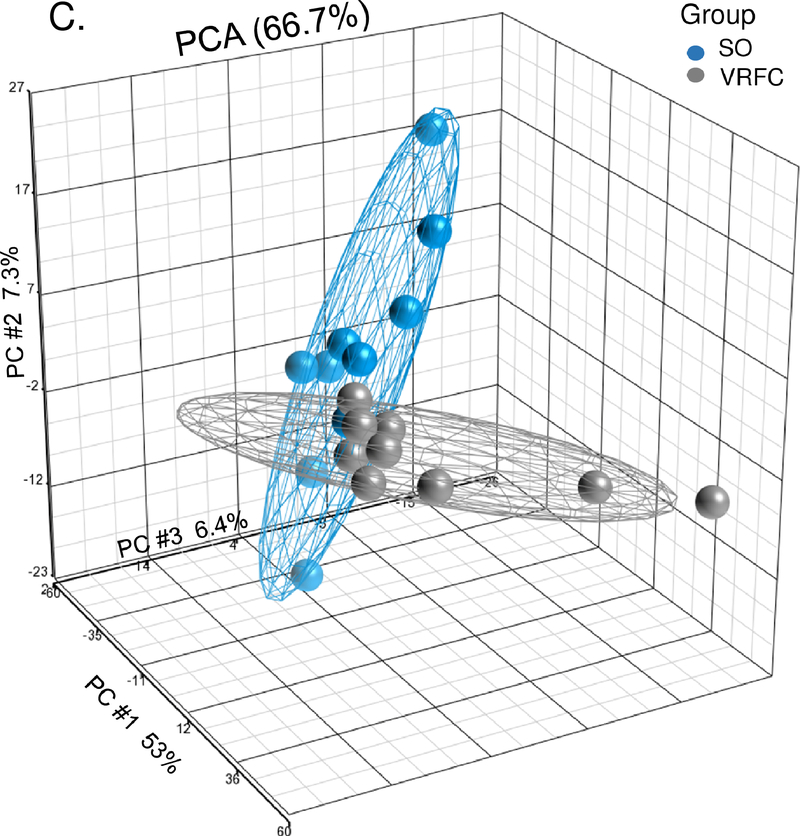
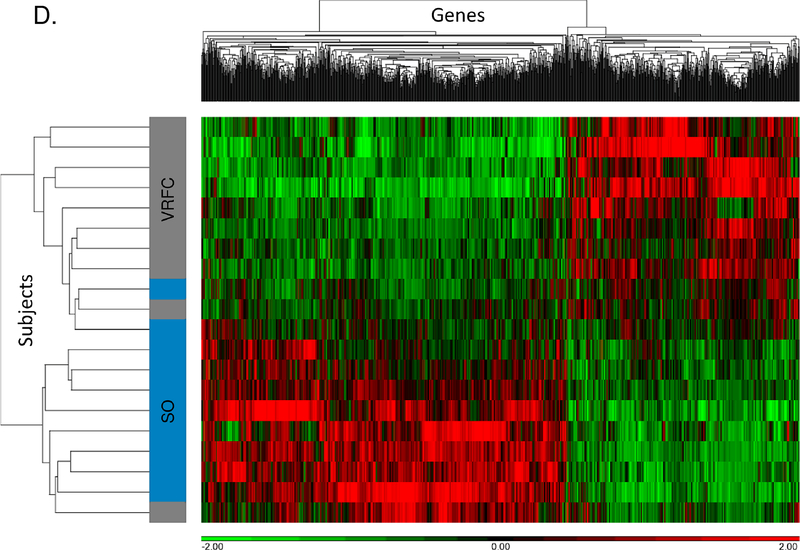
A-B. Principal component analysis and unsupervised hierarchical clustering of 1,797 differentially expressed genes between the cancer-stroke (CS) and vascular risk factor control (VRFC) groups. C-D. Principal component analysis and unsupervised hierarchical clustering of 1,197 differentially expressed genes between the stroke-only (SO) and VRFC groups. Orange denotes CS group, gray denotes VRFC group, and blue denotes SO group. Red represents high expressed genes; green represents low expressed genes.
Between the stroke-only and VRFC groups, there were 1,197 differential expressed genes (732 upregulated, 465 downregulated) (Supplemental Table III). PCA and unsupervised hierarchical clustering separated most subjects in these groups based on their differentially expressed genes (Figure 1C, 1D). There were 76 pathways overrepresented (Supplemental Table IV), including many pathways that we previously identified as regulated following stroke (Supplemental Figure IA).7
Differential gene expression between the cancer-only and VRFC groups is described in the Supplemental Results, Supplemental Tables V and VI, and Supplemental Figure II.
Unique Differential Expression in Cancer-Stroke and Stroke-Only Groups
When overlapping differentially expressed genes from all 4 groups, there were 1,323 uniquely differentially expressed genes in the cancer-stroke group, 687 uniquely differentially expressed genes in the stroke-only group, and 342 differentially expressed genes in common between the cancer-stroke and stroke-only groups (Supplemental Figure IB; Supplemental Tables VII,VIII, IX). Supplemental Figure IC shows the 10 most significantly overrepresented pathways.
Comparison of Cancer-Stroke and Stroke-Only Transcriptomes
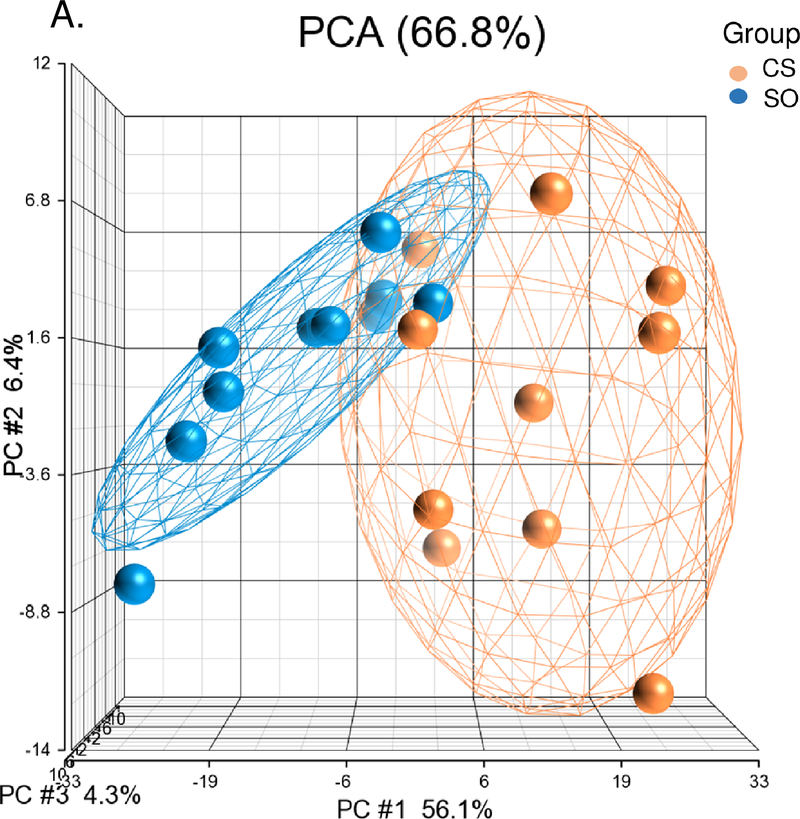
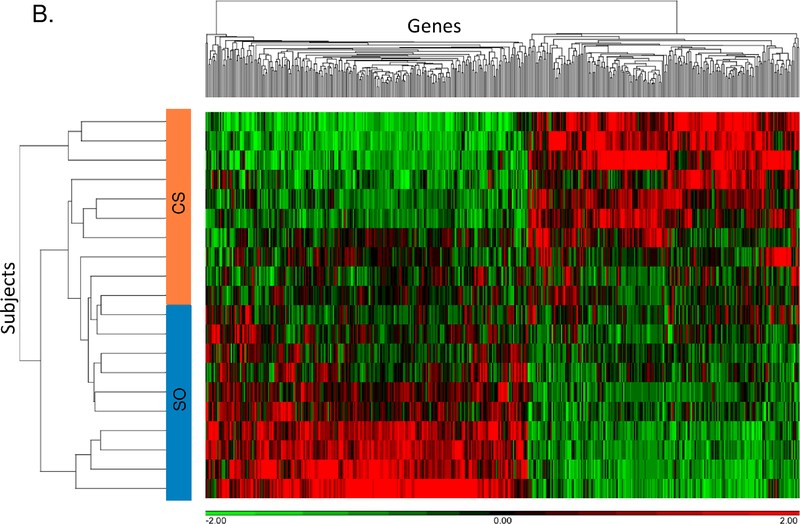
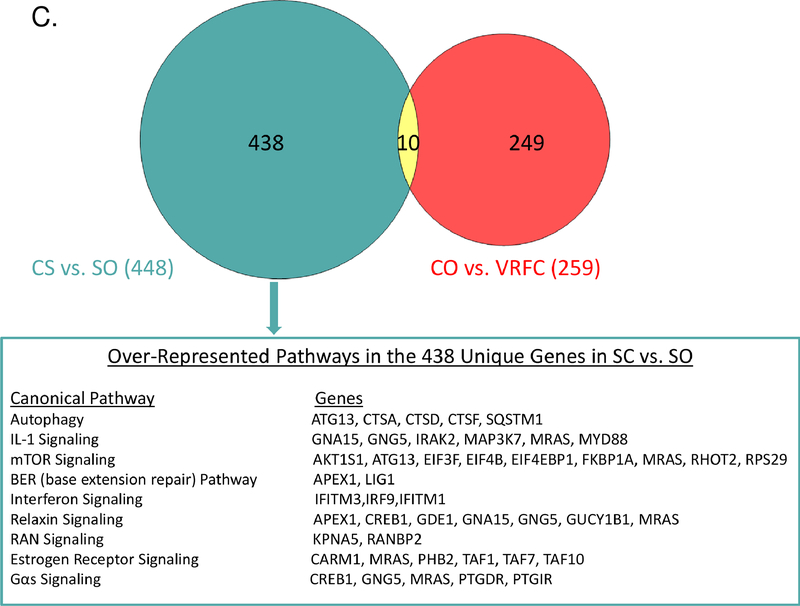
There were 448 differentially expressed genes between the cancer-stroke and stroke-only groups including 205 with higher expression in the cancer-stroke group and 243 with higher expression in the stroke-only group (Supplemental Table X). PCA and unsupervised hierarchical clustering separated cancer-stroke subjects from stroke-only subjects based on their differentially expressed genes (Figures 2A, 2B). Most (n=438) of the 448 differentially expressed genes between the cancer-stroke and stroke-only groups did not overlap with the differentially expressed genes between the cancer-only and VRFC groups. These data along with the uniquely overrepresented pathways are provided in Figure 2C, the Supplemental Results and Supplemental Table XI.
Figure 2.
A-B. Principal component analysis and unsupervised hierarchical clustering of 448 differentially expressed genes between the cancer-stroke (CS) and stroke-only (SO) groups. Orange denotes CS group; blue denotes SO group. Red represents high expressed genes; green represents low expressed genes. C. Overlap between the differentially expressed genes in the CS vs. SO groups and the cancer-only (CO) vs. the vascular risk factor control (VRFC) groups. The table represents the canonical pathways that are significantly overrepresented when comparing CS subjects to SO subjects. Asterisk denotes pathways predicted to be activated in CS vs. SO.
Expression Patterns According to Stroke Mechanism Among Cancer-Stroke Patients
In a post-hoc analysis comparing the mRNA expression patterns between the 5 cancer-stroke patients with adjudicated cardioembolic mechanisms and the 5 cancer-stroke patients with adjudicated cryptogenic mechanisms, there were similar expression profiles with only 15 differentially expressed genes between groups.
Discussion
In this prospective pilot study, we found that cancer patients with AIS have distinctive blood gene expression profiles as compared to stroke-only and cancer-only controls. We identified 448 differentially expressed genes that differentiated between the cancer-stroke and stroke-only patients, as well as hundreds of shared genes/pathways between the two groups, indicating both common and cancer-specific responses to stroke.
Pathways unique to cancer-stroke patients included autophagy, interleukin (IL-1, IL-10, and IL-12) signaling, ATM signaling, base excision repair, helper T-cell (Th1, Th2, Th17) activity, phagosome formation, pattern recognition receptors signaling, TREM1 signaling, and neuroinflammation signaling. These pathways primarily involve inflammation, cancer formation/progression, transcriptional regulation, cortical circuit plasticity, and the hypoxia response. For instance, ATM is a key regulator of signaling cascades that respond to DNA strand breaks and thereby functions as a “caretaker”, suppressing tumorigenesis in specific T-cell lineages.8 The BER pathway, a target for cancer treatment, was also overrepresented in the cancer-stroke group. Immune responses, including helper T-cell activity, play important roles in tumorigenesis by enabling immune escape of malignantly transformed cells.9 Additionally, tumors often develop at sites of chronic inflammation, and inflammation can promote tumor progression and increase thrombotic risk.10 Therefore, modulation of interleukin, helper T-cell, and TREM1 pathways are consistent with this. Additionally, major transcriptional regulators were differentially expressed between the cancer-stroke and stroke-only groups, including CREB1 and SQSTM1. CREB1, a CREB transcription factor which was down-regulated in the cancer-stroke group versus the stroke-only group, controls cortical circuit plasticity and functional recovery after stroke; and increased levels of CREB expression enhances stroke recovery, while blocking CREB signaling hinders recovery.11 SQSTM1 (p62), which was upregulated in the cancer-stroke group versus the stroke-only groups, is a critical regulator of the hypoxia response, NF-kB and TNF signaling.12
While limited by a small and heterogenous sample size with a large false positive rate, this study suggests that RNA gene signatures in blood obtained 72–120 hours after AIS onset can discern AIS associated with cancer. As 5–10% of patients with cryptogenic AIS are diagnosed with cancer soon after their stroke,2, 3 these data indicate that RNA expression profiling might be a useful noninvasive tool to screen these patients for cancer. However, before entering clinical use, external validation in a larger cohort is required. Future studies should assess how RNA gene profiling can delineate pathophysiological mechanisms among cancer-stroke patients.
Supplementary Material
Acknowledgements/Disclosures
HK serves as co-PI for the NIH-funded ARCADIA trial which receives in-kind study drug from BMS-Pfizer and in-kind study assays from Roche Diagnostics, the Deputy Editor for JAMA Neurology, a steering committee member for Medtronic’s Stroke AF trial, an endpoint adjudication committee member for a trial of empagliflozin for Boehringer-Ingelheim, and has served on an advisory board for Roivant Sciences related to Factor XI inhibition. ST has received grants and personal fees from Sanofi, Astellas, Janssen, Bayer, AbbVie, Amgen, Clovis, and Endocyte; and grants from BMS, Lily, Novartis, Merck, Millennium, and AstraZeneca. AS has received personal fees from AstraZeneca, Medtronic, Lily Oncology, Takeda, Guardant Health, and Genentech. CI has served on the scientific advisory board for Broadview Ventures. LD has received personal fees for serving on scientific advisory boards for Sapience Therapeutics, Tocagen, and Roche. ME has received royalties from UpToDate for a chapter on cryptogenic stroke and serves as co-PI for the NIH-funded ARCADIA trial which receives in-kind study drug from BMS-Pfizer and support for lab assays from Roche Diagnostics. GJ, FS, and BS hold a patent on gene expression signatures for predicting stroke and its causes; FS also has received NIH grants regarding stroke.
Funding
NIH grants K23NS091395, R01NS097000, R01NS106950.
References
- 1.Hart RG, Catanese L, Perera KS, Ntaios G, Connolly SJ. Embolic stroke of undetermined source: A systematic review and clinical update. Stroke. 2017;48:867–872 [DOI] [PubMed] [Google Scholar]
- 2.Gon Y, Sakaguchi M, Takasugi J, Kawano T, Kanki H, Watanabe A, et al. Plasma d-dimer levels and ischaemic lesions in multiple vascular regions can predict occult cancer in patients with cryptogenic stroke. Eur J Neurol. 2017;24:503–508 [DOI] [PubMed] [Google Scholar]
- 3.Cocho D, Gendre J, Boltes A, Espinosa J, Ricciardi AC, Pons J, et al. Predictors of occult cancer in acute ischemic stroke patients. J Stroke Cerebrovasc Dis. 2015;24:1324–1328 [DOI] [PubMed] [Google Scholar]
- 4.Navi BB, Reiner AS, Kamel H, Iadecola C, Okin PM, Tagawa ST, et al. Arterial thromboembolic events preceding the diagnosis of cancer in older persons. Blood. 2019;133:781–789 [DOI] [PMC free article] [PubMed] [Google Scholar]
- 5.Taccone FS, Jeangette SM, Blecic SA. First-ever stroke as initial presentation of systemic cancer. J Stroke Cerebrovasc Dis. 2008;17:169–174 [DOI] [PubMed] [Google Scholar]
- 6.Sharp FR, Jickling GC. Whole genome expression of cellular response to stroke. Stroke. 2013;44:S23–25 [DOI] [PMC free article] [PubMed] [Google Scholar]
- 7.Stamova B, Ander BP, Jickling G, Hamade F, Durocher M, Zhan X, et al. The intracerebral hemorrhage blood transcriptome in humans differs from the ischemic stroke and vascular risk factor control blood transcriptomes. J Cereb Blood Flow Metab. 2018:271678X18769513 [DOI] [PMC free article] [PubMed] [Google Scholar]
- 8.Broustas CG, Lieberman HB. DNA damage response genes and the development of cancer metastasis. Radiat Res. 2014;181:111–130 [DOI] [PMC free article] [PubMed] [Google Scholar]
- 9.Schreiber RD, Old LJ, Smyth MJ. Cancer immunoediting: Integrating immunity’s roles in cancer suppression and promotion. Science. 2011;331:1565–1570 [DOI] [PubMed] [Google Scholar]
- 10.Todoric J, Antonucci L, Karin M. Targeting inflammation in cancer prevention and therapy. Cancer Prev Res. 2016;9:895–905 [DOI] [PMC free article] [PubMed] [Google Scholar]
- 11.Caracciolo L, Marosi M, Mazzitelli J, Latifi S, Sano Y, Galvan L, et al. Creb controls cortical circuit plasticity and functional recovery after stroke. Nat Commun. 2018;9:2250. [DOI] [PMC free article] [PubMed] [Google Scholar]
- 12.Rantanen K, Pursiheimo JP, Hogel H, Miikkulainen P, Sundstrom J, Jaakkola PM. P62/sqstm1 regulates cellular oxygen sensing by attenuating phd3 activity through aggregate sequestration and enhanced degradation. J Cell Sci. 2013;126:1144–1154 [DOI] [PubMed] [Google Scholar]
Associated Data
This section collects any data citations, data availability statements, or supplementary materials included in this article.


