

Abstract
Background
Few reports have addressed the mechanism by which microRNA miR‐10b‐5p regulates post–myocardial infarction (post‐MI) cardiomyocyte apoptosis under hypoxic conditions.
Methods and Results
C57BL/6 mice underwent surgical ligation of the left anterior descending artery to create an MI or ischemia/reperfusion animal model. The expression of miR‐10b‐5p, PTEN (phosphatase and tensin homolog), and HIF‐1α (hypoxia‐inducible factor 1α) was detected in infarct border zone tissues at various time points. After precordial injections of the negative control or miR‐10b‐5p, overexpression lentiviruses were made in the areas surrounding the MI sites at 1 week, and myocardial infarct size, cardiac function, and cardiomyocyte apoptosis were examined. A miR‐10b‐5p mimic was transfected into primary mouse cardiomyocytes to analyze its effects on cardiomyocyte apoptosis and PTEN expression. Meanwhile, PTEN as a target of miR‐10b‐5p was verified via luciferase reporter gene assays. Cotransfection of miR‐10b‐5 and PTEN verified the relationship between miR‐10b‐5 and PTEN. Under hypoxic stress, the expression of HIF‐1α and miR‐10b‐5p was examined. The results showed that miR‐10b‐5p expression was markedly reduced in the infarct border zone. Overexpression of miR‐10b‐5p in the murine model of MI significantly reduced MI size, improved cardiac function, and inhibited apoptosis. Overexpression of miR‐10b‐5p in vitro antagonized hypoxia‐induced cardiomyocyte apoptosis and specifically inhibited the expression of the apoptosis‐related gene PTEN, but overexpression of PTEN weakened these effects. We also found that hypoxia‐induced accumulation of HIF‐1α resulted in decreased expression of miR‐10b‐5p. Interfering with the activation of the HIF‐1α signaling pathway promoted Pri‐miR‐10b and miR‐10b‐5p expression and inhibited PTEN expression.
Conclusions
MicroRNA miR‐10b‐5p antagonizes hypoxia‐induced cardiomyocyte apoptosis, indicating that miR‐10b‐5p may serve as a potential future clinical target for the treatment of MI.
Keywords: acute myocardial infarction, apoptosis, hypoxia‐inducible factor 1α, microRNA miR‐10b‐5p, phosphatase and tensin homolog
Subject Categories: Basic Science Research, Animal Models of Human Disease, Ischemia, Myocardial Biology
Clinical Perspective
What Is New?
Myocardial infarction–induced hypoxia causes a decrease of microRNA miR‐10b‐5p and is an important mechanism of cardiomyocyte apoptosis.
Overexpression of miR‐10b‐5p in the murine model of myocardial infarction significantly reduced the myocardial infarct size, improved cardiac function, and inhibited cardiomyocyte apoptosis.
A novel mechanism of action involving the HIF‐1α (hypoxia‐inducible factor 1α)/miR‐10b‐5p/PTEN (phosphatase and tensin homolog) axis is proposed in hypoxia‐induced cardiomyocyte apoptosis following myocardial infarction.
What Are the Clinical Implications?
MicroRNA miR‐10b‐5p may serve as a potential future clinical target for the treatment of myocardial infarction.
Upregulating the level of miR‐10b‐5p could reduce infarct size and improve cardiac function after myocardial infarction.
Under hypoxia exposure, inhibited activation of HIF‐1α promoted miR‐10b‐5p and inhibited PTEN and could be beneficial for reversing cardiomyocyte apoptosis.
Introduction
Acute myocardial infarction (AMI) refers to cardiomyocyte apoptosis and necrosis caused by myocardial ischemia and subsequent myocardial hypoxia, which ultimately leads to impaired cardiac function. AMI is the leading cause of death in patients with cardiovascular disease.1, 2 Therefore, exploration of the mechanisms by which post–myocardial infarction (post‐MI) hypoxia regulates cardiomyocyte apoptosis may provide an important molecular basis for deeper understanding, prevention, and treatment of MI.
MicroRNAs refer to noncoding RNAs ≈21 to 23 nucleotides in length. MicroRNAs regulate gene expression at the transcriptional level through binding to their target genes, thus affecting the functions of organisms.3, 4 MicroRNAs are key epigenetic regulatory molecules, and their roles in the development and progression of MI appear increasingly prominent. It is particularly intriguing to investigate the regulatory mechanisms of hypoxia‐related microRNAs in MI. During the pathological process of MI, a large number of microRNAs show significant changes. Furthermore, many abnormally altered microRNAs can be used as biomarkers of MI.5 To date, most MI‐related studies have focused on the pathogenic role of microRNAs in MI. Few studies to date regard the protective effects of microRNAs. Previous studies have found that microRNA miR‐10b‐5p levels are significantly reduced under hypoxic conditions.6 Of note, miR‐10b‐5p affects angiogenesis and participates in the pathological process of atherosclerosis.7, 8 In addition, serum miR‐10b‐5p levels are elevated in patients with hypertrophic cardiomyopathy.9 MicroRNA miR‐10b‐5p possesses a selective inhibitory activity similar to that of NADPH (nicotinamide adenine dinucleotide phosphate) oxidase, which inhibits isoproterenol‐induced myocardial fibrosis.10 The miR‐10b‐5p microRNA is abnormally altered after hypoxia. However, its role and its regulatory mechanism in MI remain to be elucidated.
Hypoxia enhances the expression of the major cell‐signaling molecule HIF‐1α (hypoxia‐inducible factor 1α).11, 12 HIF‐1α regulates the expression levels of a series of genes during hypoxia and plays a bidirectional role in regulating cellular functions. The mechanisms by which HIF‐1α regulates its downstream signaling pathways have been explored previously. However, studies focusing on the effects of HIF‐1α on miR‐10b‐5p are few and far between. Such an effect was investigated in the present study. MicroRNAs exert their biological functions through targeted regulation of their related genes. PTEN (phosphatase and tensin homolog) is a potential target gene of miR‐10b‐5p.13 PTEN negatively regulates the activation of the PI3K (phosphatidylinositide 3‐kinase)/Akt signaling pathway,14 resulting in apoptosis of cardiomyocytes.15 Consequently, the present study investigated whether miR‐10b‐5p participates in hypoxia‐regulated cardiomyocyte apoptosis through regulation of its target gene PTEN.
We found in our experiments that AMI or ischemia/reperfusion (I/R) led to a decrease in the expression of miR‐10b‐5p. In contrast, overexpression of miR‐10b‐5p inhibited hypoxia‐induced cardiomyocyte apoptosis and reduced myocardial infarct size, thereby improving cardiac function. The miR‐10b‐5p acted directly on its target gene PTEN, whereas the expression of miR‐10b‐5p was regulated by the HIF‐1α signaling pathway. Therefore, hypoxia enhanced HIF‐1α expression and inhibited miR‐10b‐5p expression in cardiomyocytes, which led to an increase in PTEN expression and eventually resulted in massive cardiomyocyte apoptosis and impaired cardiac function after MI. Antagonizing this process protected cardiomyocytes and improved cardiac function after MI. In this study, we performed relevant investigations to determine the mechanisms underlying the regulation of HIF‐1α/miR‐10b‐5p/PTEN under hypoxic conditions.
Materials and Methods
The authors declare that all supporting data are available within the article and its online supplementary file.
Reagents and Antibodies
The miR‐10b‐5p mimic and other oligos were synthesized by Ribo‐bio, and the microRNAs were collected using a microRNA extraction kit (Tiangen). OPTI‐minimal essential medium (MEM), M199 medium, FBS, TRIzol, an enhanced chemiluminescent (ECL) kit, a bicinchoninic acid protein assay kit, TaqMan quantitative reverse transcription agents, TaqMan Universal PCR Master Mix, TaqMan microRNA assay (miR‐10b‐5p and Pri‐miR‐10b) and Lipofectamine 2000 were purchased from Thermo Fisher Scientific. Trypsin, type II collagenase, and Evans blue were obtained from Sigma‐Aldrich. TTC (2,3,5‐triphenyltetrazolium chloride) and the In Situ Cell Death Detection Kit were obtained from Roche. HIF‐1α activator and inhibitor were obtained from R&D Systems. The primary antibodies used included HIF‐1α, PTEN, phosphorylation AKT, total AKT, GFP (green fluorescent protein), vimentin, α‐actinin and GAPDH (Cell Signaling), and horseradish peroxidase–, Alexa 555–, or Alexa 488–conjugated antibodies (Cell Signaling) were used as secondary antibodies. Optimal cutting temperature compound was obtained from Agar Scientific. The miR‐10b‐5p overexpression (miR‐10b‐5p), negative control (NC), PTEN overexpression (PTENΔ; ORF region of PTEN without 3′ untranslated region [UTR]) and constitutive active Akt lentivirus were constructed by GeneChem.
Animal Experiments
All animal experiments were conducted according to the Guide for the Care and Use of Laboratory Animals and approved by the animal care and use committee of Shanghai Jiao Tong University (China), which conform to the guidelines from Directive 2010/63/EU of the European Parliament on the protection of animals used for scientific purposes. The AMI animal model was produced by ligating the left anterior descending (LAD) artery in C57BL/6 mice, which were male mice aged 6 to 8 weeks (n=16). Mice were housed in the laboratory animal facility and maintained at 25±1°C, with 65±5% humidity, on a 12‐hour light/dark cycle for 1 week for acclimatization before experiments. The LAD ligation was performed using the following steps: (1) mice were anesthetized with pentobarbital (20 mg/kg intraperitoneal injection); (2) the heart was exposed through a left thoracotomy in the fourth intercostal space; (3) the LAD artery was ligated with 8–0 sutures; (4) mice undergoing sham operation underwent an identical procedure with the exception of LAD occlusion (n=16). Cardiac function was assessed by 2‐dimensional echocardiography using a Vevo 2100 instrument (FujiFilm Visual Sonics) equipped with an MS‐400 imaging transducer at baseline (before surgery) and after MI (1, 3 and 5 days after surgery). M‐mode tracings were used to measure anterior and posterior wall thicknesses at end diastole and end systole. Left ventricular internal diameter was measured in either diastole or systole. An independent observer blinded to the procedures undergone by the mice performed the echocardiography and data analysis. To analyze the area of MI, the whole heart was collected from the mice, which were anesthetized by isoflurane inhalation and pentobarbital sodium (30 mg/kg weight) intraperitoneal injection for euthanasia.
The myocardial I/R animal model was produced by ligating the LAD artery for 45 minutes followed by reperfusion in C57BL/6 male mice aged 6 to 8 weeks (n=5).
TTC and Evans Blue Staining
After harvesting the hearts (11 NC, 11 miR‐10b‐5p), the ventricles were sliced into 5 sections from the apex to the valvular level with a razor blade, with a thickness of 1 to 2 mm. The slices were incubated in 1% TTC at 37°C for 15 minutes, followed by overnight immersion in 4% formalin to identify noninfarcted and infarcted areas. The infarcted area was defined as the TTC unstained area (white). We measured the infarcted area using Image‐Pro Plus software (v6.0; Media Cybernetics).
Area at risk was determined by Evans Blue and TTC staining, performed as described previously.16 We measured the area at risk using Image‐Pro Plus software (v6.0).
Immunohistochemistry and Immunofluorescence
Hearts (each group had 5 mice) were harvested and fixed in 4% paraformaldehyde overnight and embedded with optimal cutting temperature compound. All tissues were cut into 6‐μm‐thick cryosections and stained with hematoxylin and eosin and Masson's trichrome stain for histological examination.
The following antibodies were used for colocalization immunohistochemistry analysis: anti‐GFP (1:50) or anti‐PTEN (1:50) colabeled with anti–α‐actinin (1:50) or vimentin (1:50). After incubation with Alexa 555– or Alexa 488–conjugated secondary antibodies (1:1000), all sections were observed with a laser confocal microscope (Zeiss LSM 710 system).
Apoptosis of cardiac cells was detected with a TUNEL (terminal deoxynucleotidyl transferase dUTP nick‐end labeling) assay using the In Situ Cell Death Detection Kit (Roche), following the manufacturer's protocol. The sections were photographed with a laser confocal microscope (Zeiss LSM 710 system), and the number of apoptotic cells were counted using ZEN 2.3 software (Zeiss). The apoptosis ratio was calculated by the ratio of the number of cells with positive TUNEL staining to the number of all cells in 5 different representative microscopic fields, and the data are presented as mean±SD.
The expression of PTEN in cardiac tissues was measured by immunohistochemistry with rabbit polyclonal antibody against PTEN (1:1000). Then, the sections were incubated with horseradish peroxidase–conjugated secondary antibodies (1:100), followed by incubation with 3,3′‐diaminobenzidine and counterstaining with hematoxylin. All sections were photographed with a microscope (Olympus Microsystems), and the positive expression density was analyzed with Image‐Pro Plus software (v6.0).
Cell Culture and Oligo Transfection
The primary cardiomyocytes were cultured and isolated from cardiac tissues 1 to 3 days of neonatal age using the enzymatic digestion method. On the day of euthanasia, the neonatal mice were given inhalation anesthesia with ether. The ventricular tissues were incubated overnight with lysis buffer, which contained 0.0625% trypsin and 0.05% type II collagenase in M199 culture medium at 4°C, and digestion was terminated with culture medium (M199 with 20% FBS). The cardiomyocytes were cultured with M199 medium with 20% FBS at 37°C and 5% CO2.
Transient transfection of cardiomyocytes with miR‐10b‐5p mimics, NC microRNA, PTEN‐specific small interfering RNA (siRNA) or NC siRNA (100 nM/105 cells) was performed using Lipofectamine 2000 reagent.
Overexpression of MiR‐10b‐5p in Murine Hearts
During LAD ligation, miR‐10b‐5p overexpression and NC lentivirus were injected into the precordial tissue of murine hearts. In detail, miR‐10b‐5p overexpression and NC lentivirus were injected at 4 different points around the infarction area, with 1×10⁶ transducing units of lentivirus for each point.
MicroRNA Extraction and Quantitative Reverse Transcription Polymerase Chain Reaction Analysis
The total microRNAs were extracted with a microRNA extraction kit according to the manufacturer's protocol. TaqMan microRNA reverse transcription reagents and the TaqMan MicroRNA Assay were used for reverse transcription. The reverse transcription was performed as follows: 30 minutes at 16°C, 30 minutes at 42°C, 5 minutes at 85°C, and hold at 4°C. To investigate the expression levels of miR‐10b‐5p or Pri‐miR‐10b, the TaqMan Universal PCR Master Mix and TaqMan MicroRNA Assays were used. The protocol of real‐time polymerase chain reaction was performed with the following steps: initial hold for 10 minutes at 95°C, 40 cycles of denaturation for 15 seconds at 95°C, and annealing/extension for 60 seconds at 60°C. The expression of U6 as an internal reference microRNA was used to normalize the concentrations of miR‐10b‐5p and Pri‐miR‐10b.
Western Blot Analysis
The total protein was lysed by protein lysis buffer containing proteinase inhibitor, and 20 μg of protein was loaded on 10% SDS‐PAGE for separation and subsequent electrophoretic transfer to polyvinylidene fluoride membranes. Proteins on the membranes were incubated with anti‐PTEN (1:1000), anti–HIF‐1α (1:1000), or GAPDH (1:2000) overnight. The membranes were then incubated with a second antibody (1:5000) for 1 hour and exposed with the ECL kit. The protein density was quantified with ImageJ software (US National Institutes of Health).
Rescue Assay
To verify the effect of PTEN overexpression on miR‐10b‐5p overexpression in vivo, the PTENΔ and miR‐10b‐5p overexpression lentivirus followed a ratio of 1:1 injected into the precordial tissue of murine hearts during LAD ligation to measure infarction size after 7 days.
To further verify the effect of PTEN overexpression on miR‐10b‐5p overexpression in vitro, the PTENΔ overexpression lentivirus and miR‐10b‐5p mimics followed 100 nM/105 cells transfected into cardiomyocytes. After treatment with hypoxia, the apoptosis of cardiomyocytes was calculated with TUNEL.
Statistical Analysis
Data are presented as mean±SEM. Repeated‐measures ANOVA by Dunnett multiple comparisons test was used to investigate changes in mean scores over ≥3 time points. One‐way ANOVA followed by Dunnett multiple comparisons test was used to compare >2 groups. Two‐way ANOVA followed by Bonferroni post test was used to compare groups with >1 factor to test an interaction between factors. The Student t test was chosen to compare 2 groups with normally distributed values. For TUNEL, staining analyses were performed using a nonparametric Kruskal–Wallis test. P<0.05 was considered statistically significant. Statistical analyses were presented with GraphPad Prism 6.0 (Graph Pad Prism Software) and SPSS 14.0 for Windows (IBM Corp).
Results
Expression Levels of miR‐10b‐5p Were Reduced in Infarct Border Zone Tissues After MI and I/R
After the murine model of MI and I/R was established, the expression level of miR‐10b‐5p in the myocardial tissues of the infarct border zone was determined at various time points using TaqMan probes. The results showed that miR‐10b‐5p expression levels in the myocardial tissue were significantly reduced in the MI or I/R group compared with the sham group. Following MI, miR‐10b‐5p expression exhibited a U‐shaped change over time. The most significant decreases were observed at 2 days after MI surgery (relative expression level of miR‐10b‐5p: 25.78±0.49 versus 306.17±27.43 in the sham group, P=0.003; Figure 1A) and after I/R surgery (95.80±23.92 versus 387.20±34.82 in the sham group, P=0.001; Figure 1B).
Figure 1.
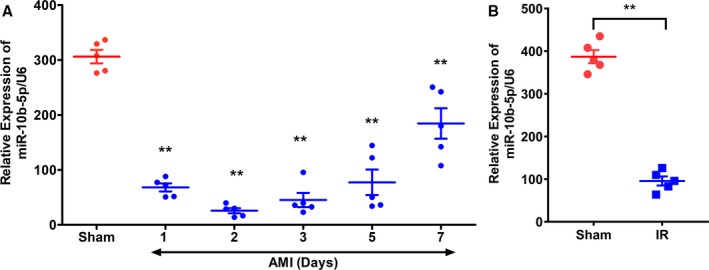
Expression levels of miR‐10b‐5p in myocardial tissues after myocardial infarction (MI). A, C57BL/6 mice were subjected to left anterior descending artery ligation. At days 1, 2, 3, and 5 after the procedure, expression levels of miR‐10b‐5p in the infarct border zone were determined. B, C57BL/6 mice were subjected to ischemia/reperfusion (I/R) operation. At day 2 after the procedure, expression levels of miR‐10b‐5p in the infarct border zone were determined. The relative expression levels of miR‐10b‐5p were calculated using U6 as an internal control (n=5 per group, results are expressed as mean±SD; compared with the sham group by repeated‐measures ANOVA followed by the Dunnett multiple comparisons test, **P<0.01). AMI indicates acute myocardial infarction.
Overexpression of miR‐10b‐5p Reduces Myocardial Infarct Size and Improves Post‐MI Cardiac Function in Mice
In light of the significant decrease in miR‐10b‐5p expression after MI, we next investigated the effects of miR‐10b‐5p on the myocardial infarct size and cardiac function in mice with MI. A lentivirus overexpressing miR‐10b‐5p and an NC lentivirus were constructed. The miR‐10b‐5p–overexpressing virus was injected into the areas surrounding the MI site immediately after the establishment of MI. The NC virus was administered in the control (NC group). One week later, the murine hearts were collected. Based on the miR‐10b‐5p overexpression lentivirus coexpressing GFP, the efficiency of miR‐10b‐5p expression on cardiomyocytes was detected with concentration of GFP expression. The colocalization immunohistochemistry result exhibited strong GFP expression in cardiomyocytes (Figure 2A). According to the same area at risk (left ventricle; Figure S1), TTC staining was performed to examine the differences in myocardial infarct size. The myocardial infarct size was markedly reduced in mice that received a myocardial injection with the miR‐10b‐5p–overexpressing virus (23.04±8.58%) in comparison to the NC group (33.33±8.32%, P=0.022; Figure 2B and 2C). In addition, echocardiography was performed 1 week after the viral injection to examine the effects of miR‐10b‐5p on post‐MI cardiac function. The results showed that post‐MI cardiac function was significantly improved in mice injected with the miR‐10b‐5p–overexpressing virus in comparison to the NC group (ejection fraction values were 35.95±10.84% and 59.14±9.25% in the NC and miR‐10b‐5p groups, respectively; P=0.001; Figure 2D and 2E).
Figure 2.
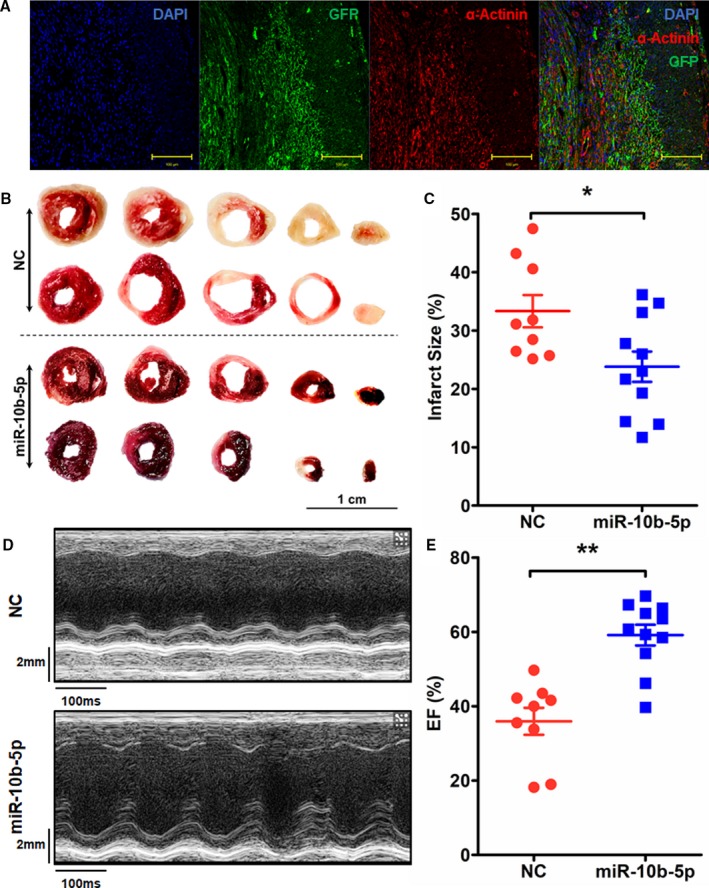
Effect of miR‐10b‐5p overexpressed lentivirus injected into myocardial tissue on myocardial infarct size and cardiac function in mice. A, Colocalization of miR‐10b‐5p overexpression lentivirus expressed GFP (green fluorescent protein) and α‐actinin. B and C, Examination of myocardial infarct size in mice with myocardial infarction (MI) by TTC (2,3,5‐triphenyltetrazolium chloride) staining. Red indicates nonnecrotic myocardium; white indicates necrotic myocardium. *P<0.05 vs negative control (NC) by 1‐way ANOVA. D and E, Echocardiographic examination of changes in ejection fraction (EF) values in mice with MI (D and E). **P<0.01 vs NC by 1‐way ANOVA. Two deaths occurred in the NC group during the experiment (NC group: n=9; miR‐10b‐5p group: n=11).
MicroRNA miR‐10b‐5p Exhibits an Antiapoptotic Effect In Vivo and In Vitro
To determine the relationship between miR‐10b‐5p and apoptosis, lentivirus overexpressing miR‐10b‐5p was injected into the areas surrounding the MI site immediately after the establishment of MI. NC virus was used as a control. On the fifth day after establishment of the MI model, Masson's trichrome staining and TUNEL assays were performed to examine apoptosis in infarcted myocardial tissues. Compared with the NC group, administration of miR‐10b‐5p decreased he myocardial infarct size and significantly reduced the number of apoptotic cells in the infarcted area (miR‐10b‐5p group: 5.5±2.25%; NC group: 12±3.31%; P=0.001; Figure 3A and 3B). In vitro, a miR‐10b‐5p mimic and NC were transfected into primary murine cardiomyocytes. After exposure to hypoxia for 6 hours, cardiomyocyte apoptosis was examined using the TUNEL method. The results showed that the number of apoptotic cardiomyocytes was significantly increased after hypoxia (hypoxic NC group: 54.5±10.36%; nonhypoxic NC group: 4.66±1.39%; P=0.001). Compared with the NC group, transfection of cardiomyocytes with a miR‐10b‐5p mimic markedly reduced the number of apoptotic cardiomyocytes (nonhypoxic miR‐10b‐5p group: 3.50±1.36%; nonhypoxic NC group: 4.66±1.39% [P=0.014]; hypoxic miR‐10b‐5p group: 12.57±4.56%; hypoxic NC group: 54.5±10.36% [P=0.001]; Figure 3C and 3D).
Figure 3.
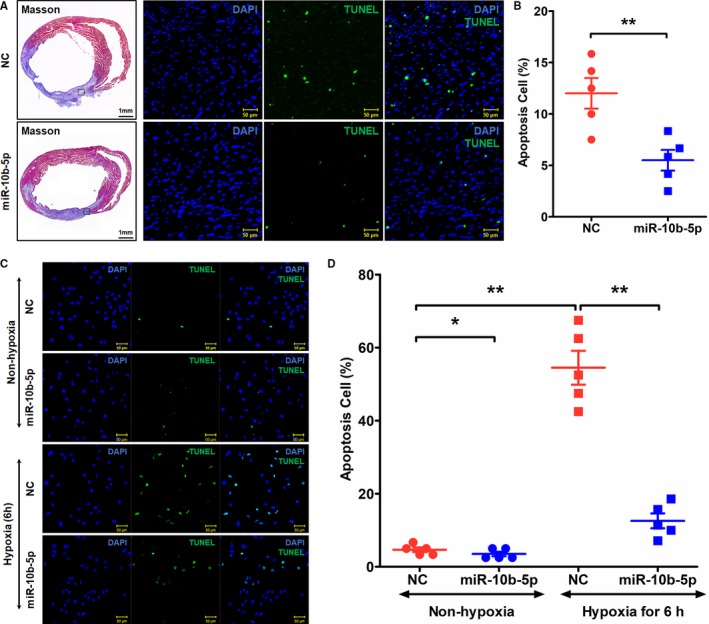
Effects of miR‐10b‐5p on cardiomyocyte apoptosis after hypoxia. A and B, Examination of apoptosis in myocardial tissues on day 5 after myocardial infarction by TUNEL (terminal deoxynucleotidyl transferase dUTP nick‐end labeling) staining. Blue (DAPI [4′,6‐diamidino‐2‐phenylindole]) indicates nuclei, and green (TUNEL) indicates apoptotic cells. Five fields were selected from the infarcted area to calculate the number of apoptotic cells (n=5). **P<0.01. C and D, Examination of posthypoxic cardiomyocyte apoptosis by TUNEL staining. Magnification: ×20. *P<0.05 vs negative control (NC) by Kruskal–Wallis test, **P<0.01 vs NC by Kruskal–Wallis test.
PTEN Is a Target Gene of miR‐10b‐5p
To examine the tissue expression of PTEN after MI, serially sectioned tissues were subjected to hematoxylin and eosin staining and immunohistochemical analysis. The results showed that PTEN expression was significantly reduced in the group injected with the miR‐10b‐5p–overexpressing lentivirus (0.0496±0.0126) compared with the NC group (0.112±0.022, P=0.002; Figure 4A and 4B). In addition, a miR‐10b‐5p mimic and NC were introduced into primary murine cardiomyocytes to analyze the changes in PTEN expression. The results showed that transfection of cardiomyocytes with the miR‐10b‐5p mimic significantly decreased the expression level of PTEN (NC group: 1.0±0.20; the miR‐10b‐5p group: 0.51±0.15; P=0.023; Figure 4C and 4D). In addition, luciferase reporter gene assays were performed to determine whether PTEN binds directly to miR‐10b‐5p. The 3′‐UTR‐PTEN(wild type) and 3′‐UTR‐PTEN(mutation type) vectors were constructed (see Figure 4 for related vector sequences). The results showed that luciferase activity was significantly decreased in the 3′‐UTR‐PTEN(wild type) miR‐10b‐5p group compared with the 3′‐UTR‐PTEN(wild type) NC group. Binding of miR‐10b‐5p to the 3′‐UTR of the wild‐type PTEN gene markedly reduced luciferase activity. In contrast, luciferase activity was not significantly altered after the binding of miR‐10b‐5p to the 3′‐UTR of a mutant PTEN gene (Figure 4E and 4F).
Figure 4.
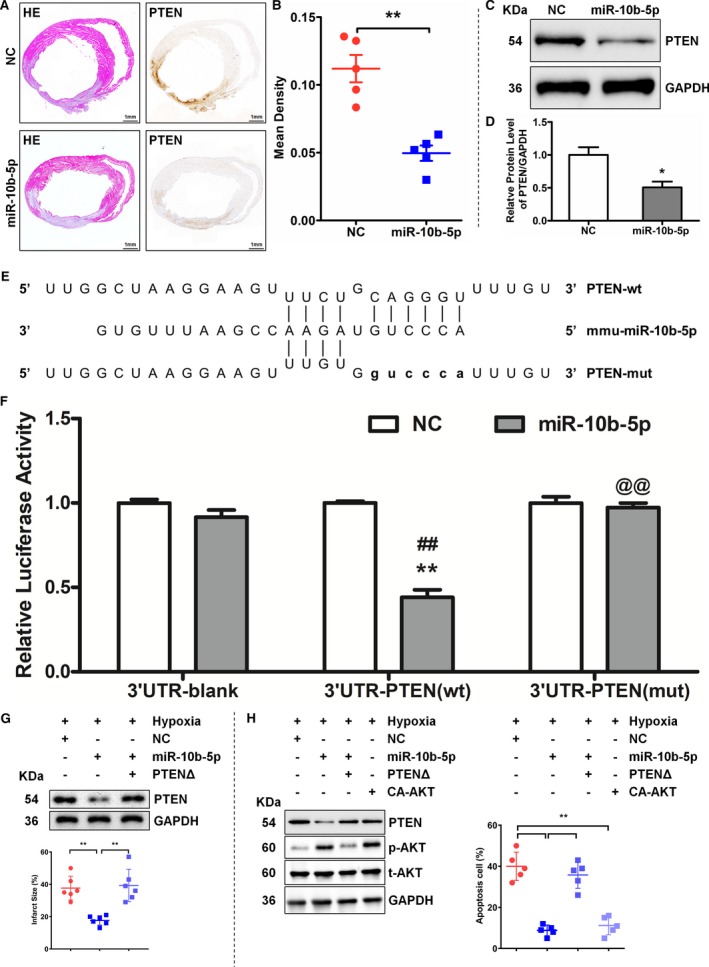
MicroRNA miR‐10b‐5p inhibits PTEN (phosphatase and tensin homolog) expression and targets the 3′ untranslated region (UTR) of PTEN. A and B, Examination of the expression level of PTEN on day 5 after myocardial infarction by hematoxylin and eosin (HE) staining and immunohistochemistry. A, Results of HE staining (left) and immunohistochemical analysis (right). B, Comparison with the negative control (NC) group (n=5), **P<0.01 vs NC by Student t test. C and D, Examination of PTEN expression after the introduction of miR‐10b‐5p into primary murine cardiomyocytes. Compared with the NC group (n=3), *P<0.05 vs NC by Student t test. E and F, Examination of the binding of miR‐10b‐5p to the 3′UTR region of PTEN by luciferase reporter assay. Two‐way ANOVA followed by Bonferroni post test was used to determine significance. The 3′‐UTR‐PTEN(wild‐type [wt]) miR‐10b‐5p group vs the 3′‐UTR‐PTEN(wt) NC group, **P<0.01; the 3′‐UTR‐PTEN(wt) miR‐10b‐5p group vs the 3′‐UTR‐Blank miR‐10b‐5p group, ## P<0.01; the 3′‐UTR‐PTEN(mutation type [mut]) miR‐10b‐5p group vs the 3′‐UTR‐PTEN(wt) miR‐10b‐5p group, @@ P<0.01. G, The western blot detected the efficiency of transfection, and the infarction size was measured. Compared with the NC group (n=5), **P<0.01 vs NC by Student t test. H, The western blot detected the efficiency of transfection, and the ratio of apoptosis cells was measured with TUNEL (terminal deoxynucleotidyl transferase dUTP nick‐end labeling). Five fields were selected from the infarcted area to calculate the number of apoptotic cells (n=5). **P<0.01. CA‐AKT indicates constitutive active Akt; PTENΔ, ORF region of PTEN without 3′‐UTR; UTR, untranslated region.
To further examine the relationship between miR‐10b‐5p and PTEN, miR‐10b‐5p and PTEN without a 3′‐UTR region (PTENΔ) were cotransfected into an MI region. The results showed that miR‐10b‐5p overexpression downregulated PTEN expression but did not affect PTENΔ cotransfected, and PTENΔ overexpression attenuated the effect of miR‐10b‐5p on reducing MI size in vivo (Figure 4G). Under the condition of hypoxia, miR‐10b‐5p was coexpressed with PTEN? or constitutive active Akt overexpression in cardiomyocyte. Compared with NC, miR‐10b‐5p downregulated PTEN expression but induced AKT activation, PTENΔ overexpression weakened miR‐10b‐5p–inhibited PTEN expression and AKT activation, and constitutive active Akt upregulated AKT phosphorylation (Figure 4H). The results of TUNEL showed that miR‐10b‐5p or constitutive active Akt overexpression inhibited hypoxia‐induced apoptosis, in contrast to PTENΔ and miR‐10b‐5p over‐expression together (Figure 4H).
PTEN Regulates Cardiomyocyte Apoptosis by Acting as a Target Gene of miR‐10b‐5p
Because PTEN is a target gene of miR‐10b‐5p, a murine model of MI was subsequently used for further analysis. Hematoxylin and eosin staining, Masson's trichrome staining, and immunohistochemical analysis were performed to examine post‐MI changes in PTEN expression. The results of the immunohistochemical analysis showed that the expression level of PTEN was drastically elevated in tissues derived from mice with MI in comparison to those from the sham group, and PTEN expression was higher in cardiomyocytes than cardiac fibroblasts. In addition, western blot analysis was performed to analyze PTEN expression. Compared with the sham group, the expression of PTEN was increased following MI. Moreover, the expression of PTEN increased gradually over time, and the most significant change in PTEN expression was observed 5 days after MI 2.04±0.22 versus 1.0±0.20 relative expression in the sham group, P=0.003; Figure 5A–5E). In the present study, PTEN siRNA was transfected into in vitro cultured murine cardiomyocytes. The cardiomyocytes were exposed to a simulated hypoxic environment in vitro, and the apoptosis levels in the cardiomyocytes were examined using TUNEL assays. The results showed that the number of apoptotic cardiomyocytes was significantly reduced in the group transfected with PTEN siRNA (12.86±3.64%) compared with the NC group (41.71±7.31%, P=0.002; Figure 5F–5I).
Figure 5.
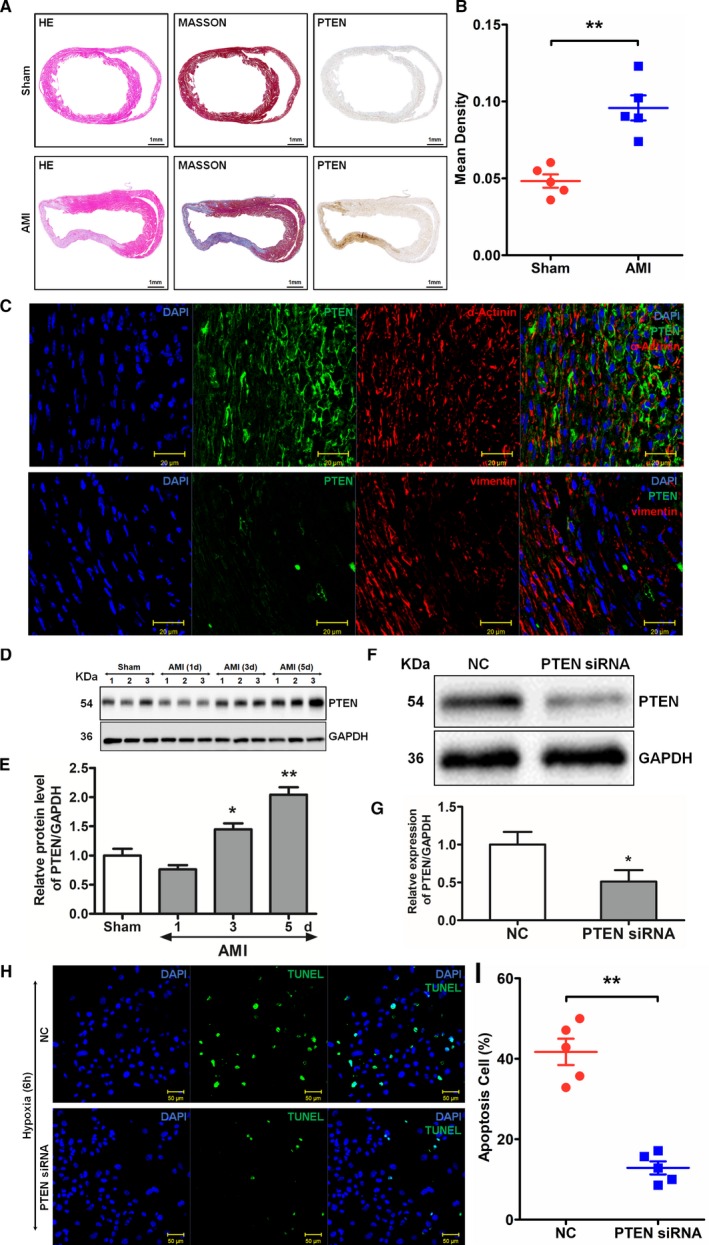
Expression of PTEN (phosphatase and tensin homolog) after myocardial infarction (MI) and its effects on cardiomyocyte apoptosis. A, Results of hematoxylin and eosin (HE) staining (left), Masson's trichrome staining (middle), and immunohistochemical staining (right). B, PTEN levels compared between groups. **P<0.01 vs sham by Student t test. C, Colocalization of PTEN and α‐actinin or vimentin was detected by immunohistochemical staining. D and E, Western blot analysis of post‐MI PTEN expression. Compared with the sham group, *P<0.05, **P<0.01 by repeated‐measures ANOVA followed by the Dunnett multiple comparisons test. F through I, Examination of the effects of PTEN on the apoptosis of cardiomyocytes by TUNEL (terminal deoxynucleotidyl transferase dUTP nick‐end labeling) assay. Primary murine cardiomyocytes were transfected with PTEN small interfering RNA (siRNA) and then exposed to hypoxia. At 6 hours after exposure to hypoxia, the level of apoptosis of the cardiomyocytes was examined. Blue (DAPI [4′,6‐diamidino‐2‐phenylindole]) indicates nuclei; green (TUNEL) indicates apoptotic cells (results are expressed as mean±SD, n=5, **P<0.01, vs negative control (NC) Kruskal–Wallis test). AMI indicates acute myocardial infarction.
HIF‐1α Regulates the Expression of miR‐10b‐5p and PTEN
Previous studies have shown that HIF‐1α is altered after MI and exerts significant effects. To examine the expression level of HIF‐1α after MI and cardiomyocyte hypoxia, western blot analysis was performed. HIF‐1α expression showed upward trends after both MI and cardiomyocyte hypoxia. Moreover, HIF‐1α expression gradually increased over time (Figure 6A and 6C). To explore the correlation between miR‐10b‐5p and HIF‐1α, a correlation analysis was performed on their expression trends. Expression of miR‐10b‐5p and HIF‐1α showed opposite trends (Figure 6B and 6D). To further explore the relationship between miR‐10b‐5p and HIF‐1α, cardiomyocytes were stimulated with an HIF‐1α inhibitor and an agonist under hypoxic and nonhypoxic conditions, and the expression levels of Pri‐miR‐10b and miR‐10b‐5p in the cardiomyocytes were analyzed. The results showed that Pri‐miR‐10b and miR‐10b‐5p expression was decreased under hypoxic conditions compared with the nonhypoxic control group. Under hypoxic conditions, the expression levels of Pri‐miR‐10b and miR‐10b‐5p were elevated in cardiomyocytes treated with an HIF‐1α inhibitor compared with the corresponding control group. Under nonhypoxic conditions, Pri‐miR‐10b and miR‐10b‐5p expression was reduced in cardiomyocytes stimulated with an HIF‐1α agonist compared with the control group. In addition, the effects of HIF‐1α on PTEN expression were examined under the same test conditions. The expression of PTEN was increased under hypoxic conditions compared with the nonhypoxic control group. Under hypoxic conditions, the expression level of PTEN was reduced in the cardiomyocytes stimulated with an HIF‐1α inhibitor compared with the corresponding control group. Under nonhypoxic conditions, PTEN expression was increased in cardiomyocytes stimulated with an HIF‐1α agonist compared with the corresponding control group (Figure 6E–6G).
Figure 6.
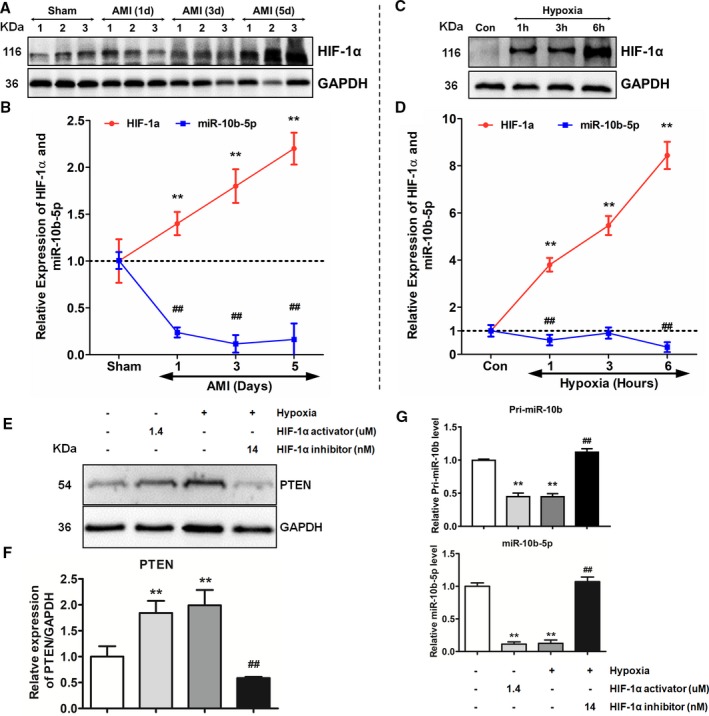
Effects of HIF‐1α (hypoxia‐inducible factor 1α) on the expression of miR‐10b‐5p and PTEN (phosphatase and tensin homolog). A and C, Western blot analysis of the expression of HIF‐1α. B and D, Expression‐level trends of miR‐10b‐5p and HIF‐1α. The red curve represents the expression‐level trend of HIF‐1α; the blue curve represents the expression level trend of miR‐10b‐5p. B, Comparison to the sham group (n=3) by repeated‐measures ANOVA followed by the Dunnett multiple comparisons test, **P<0.01, ## P<0.01. D, Comparison to the control (Con) group (n=3) by repeated‐measures ANOVA followed by the Dunnett multiple comparisons test, **P<0.01, ## P<0.01. E and F, Effects of HIF‐1α on PTEN expression. G, Effects of HIF‐1α on Pri‐miR‐10b and miR‐10b‐5p expression (2‐way ANOVA followed by the Dunnett multiple comparison procedure and then the Bonferroni post test was used to determine significance, n=3; comparison to the nonhypoxic control group, **P<0.01; HIF‐1α inhibited treatment compared with control group, ## P<0.01). AMI indicates acute myocardial infarction.
Discussion
This study demonstrated that HIF‐1α regulates the expression of miR‐10b‐5p and PTEN after MI. Following MI or I/R, the expression level of miR‐10b‐5p was decreased. Overexpression of miR‐10b‐5p in vivo and in vitro reduced hypoxia‐induced cardiomyocyte apoptosis, thereby protecting the myocardium. The protective effect of miR‐10b‐5p on post‐MI myocardial tissue is an important discovery. The HIF‐1α levels showed a significant increase after MI. The dramatic increase in HIF‐1α inhibited the expression of miR‐10b‐5p. PTEN was identified not only as a target gene of miR‐10b‐5p but also as downstream gene of miR‐10b‐5p to regulate hypoxia‐induced apoptosis of cardiomyocyte. HIF‐1α regulated the expression of PTEN, thereby affecting posthypoxic cardiomyocyte apoptosis. This study reveals a new mechanism of myocardial protection after MI and provides new therapeutic strategies and targets for the treatment of MI.
AMI is accompanied by a variety of pathological characteristics, such as cardiomyocyte apoptosis and myocardial remodeling. Cardiomyocyte apoptosis is the main cause of myocardial injury following MI.17 A series of pathological factors can induce cardiomyocyte apoptosis, including hypoxia, calcium overload, and acidosis. Among these pathological factors, hypoxia is an important factor that causes cardiomyocyte apoptosis.18, 19 A variety of genes are abnormally expressed during hypoxia with different regulation models, such as some hypoxia‐related microRNAs. In this study, as MI progressed and the duration of myocardial hypoxia increased, miR‐10b‐5p levels were significantly reduced. However, the majority of previous studies have focused on the utilization of microRNAs as circulating biomarkers to identify microRNAs with expression levels that increased after MI. Few studies have focused on the corresponding functions of microRNAs that exhibit decreased expression after MI. In this study, miR‐10b‐5p was overexpressed in vivo and in vitro. We found that miR‐10b‐5p overexpression reduced myocardial infarct size and improved cardiac function. Moreover, miR‐10b‐5p was injected into mice immediately after the induction of MI, and this showed a strong protective effect on the myocardium after MI. In addition, administration of artificially synthesized oligonucleotide inhibitors or microRNA analogues in vivo allowed regulation of the expression of microRNAs,20, 21, 22 indicating that microRNAs have good therapeutic prospects. This microRNA, miR‐10b‐5p, might participate in the pathological process of MI as a potential protective microRNA to be therapy for MI in the future. This study proposes new ideas and intervention measures for the treatment of MI and provides a robust theoretical basis for future clinical applications.
A previous study shows that HIF‐1α is a transcription factor with expression that changes, and it plays a significant role during hypoxia.23 HIF‐1α regulates the expression of a series of genes related to glycolysis, glucose metabolism, mitochondrial function, cell survival, apoptosis, and antioxidative stress.24, 25 Specifically, low and high doses of HIF‐1α have different effects on posthypoxic cardiomyocyte apoptosis.26, 27 Previous studies have shown that HIF‐1a enhances tolerance to hypoxia and protects the myocardium.24, 28 As the dose of HIF‐1α increases, HIF‐1α–mediated regulation of cell function may lead to worse outcomes.27 During MI, blood vessels are occluded and large tissue areas lose their blood supply. As a result, high levels of hypoxia occur, and the HIF‐1α levels increase dramatically—phenomena that were confirmed in the present study. At a same time, severe hypoxia also leads to miR‐10b‐5p persistently decreasing. Consequently, a negative relationship existed between HIF‐1α and miR‐10b‐5p and was clarified by activating or inhibiting activation of HIF‐1α, which caused down‐ or upregulated expression of pri‐miR‐10b or miR‐10b‐5p. MiR‐10b‐5p was targeting PTEN to downregulate its expression, but PTEN has been reported to affect cardiomyocyte apoptosis.29, 30 Our study also verified that MI induces PTEN expression in cardiomyocytes at the infarct area, which leads to myocyte apoptosis. Under the condition of MI, reduction of miR‐10b‐5p expression levels caused an increase in miR‐10b‐5p–mediated regulation of the target gene PTEN and a subsequent decrease in AKT activation. These results potentially indicate that under sharp hypoxic conditions of MI, HIF‐1α regulates PTEN expression through the regulation of an intermediary, which is miR‐10b‐5p. These results collectively reveal a novel mechanism underlying hypoxia‐induced cardiomyocyte apoptosis following MI. During the process of MI, sharp hypoxia‐induced increases in HIF‐1α expression lead to reduced miR‐10b‐5p expression, which subsequently affects PTEN expression. As a result, irreversible apoptosis of cardiomyocytes occurs and ultimately leads to a loss of cardiac function (Figure 7).
Figure 7.
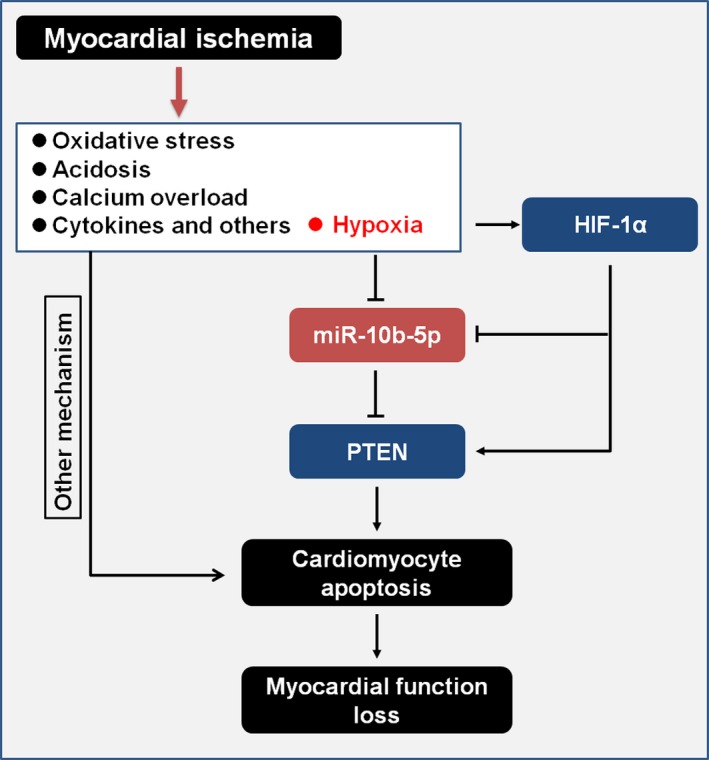
Overall network of HIF‐1α/miR‐10b‐5p/PTEN–mediated regulation of cardiomyocyte apoptosis following myocardial infarction. HIF‐1α indicates hypoxia‐inducible factor 1α; PTEN, phosphatase and tensin homolog.
In this study, we also found that the protein level of PTEN was not increased at 1 day of MI, even though HIF‐1α rapidly increased and miR‐10b‐5p decreased at that time point. A previous study showed that hypoxia induced HIF‐1α expression, and HIF‐1α as a transcription factor promoted expression of miR‐21 to target and inhibit PTEN.31 Consequently, HIF‐1α may regulate PTEN expression via different types of microRNA expression. This unusual phenomenon also illustrated that microRNA participation in posttranslational regulation was an complex process.
Many previous studies have shown that PTEN inhibits the expression of HIF‐1α.31, 32, 33 However, few studies have focused on the regulation of PTEN expression by HIF‐1α. The present study discovered a novel mode of regulation, namely, HIF‐1α regulates the expression of miR‐10b‐5p and PTEN. This novel regulatory mechanism is illustrated in Figure 6. PTEN was identified as a target gene of miR‐10b‐5p, and HIF‐1α was shown to regulate PTEN expression. All results described indicate that the modes of regulation under hypoxic conditions are far more complex than previously anticipated. The relationships among miR‐10b‐5p, HIF‐1α, and PTEN are also complex, and the underlying mechanism identified appears to be novel. HIF‐1α regulates the expression of miR‐10b‐5p, thereby enhancing the expression level of the target gene PTEN. Increased PTEN expression has a regulatory effect on the apoptosis of cardiomyocytes.
Conclusions
This study demonstrated that miR‐10b‐5p reduces hypoxia‐induced cardiomyocyte apoptosis after MI. In addition, this study revealed a novel mechanism of action of the HIF‐1α/miR‐10b‐5p/PTEN axis in hypoxia‐induced cardiomyocyte apoptosis following MI.
Author Contributions
Study conception and design: Cao and K. Yang; acquisition and analysis of data: Wu, Y. F. Chen, Y. Y. Chen, W. B. Yang, Han, and Lu; drafting a significant portion of the article or figures: Cao, K. Yang, and Wu.
Sources of Funding
This work was supported by grants from the National Natural Science Foundation of China (81770384, 81570226, 81760734).
Disclosures
None.
Supporting information
Figure S1. The ischemic area of negative control and miR‐10b‐5p myocardial infarct size.
Acknowledgments
We would like to thank Ying Huang and her associates in the core facility unit (School of Medicine, Shanghai Jiao Tong University) for their professional support in imaging capture and processing.
(J Am Heart Assoc. 2019;8:e011948 DOI: 10.1161/JAHA.119.011948.)
Contributor Information
Ke Yang, Email: ykk_ykkk@126.com.
Jiumei Cao, Email: cjm11261@rjh.com.cn.
References
- 1. Anderson JL, Morrow DA. Acute myocardial infarction. N Engl J Med. 2017;376:2053–2064. [DOI] [PubMed] [Google Scholar]
- 2. Guo Y, Luo F, Liu Q, Xu D. Regulatory non‐coding RNAs in acute myocardial infarction. J Cell Mol Med. 2017;21:1013–1023. [DOI] [PMC free article] [PubMed] [Google Scholar]
- 3. van Rooij E, Marshall WS, Olson EN. Toward microRNA‐based therapeutics for heart disease: the sense in antisense. Circ Res. 2008;103:919–928. [DOI] [PMC free article] [PubMed] [Google Scholar]
- 4. Schroen B, Heymans S. MicroRNAs and beyond: the heart reveals its treasures. Hypertension. 2009;54:1189–1194. [DOI] [PubMed] [Google Scholar]
- 5. Wang GK, Zhu JQ, Zhang JT, Li Q, Li Y, He J, Qin YW, Jing Q. Circulating microRNA: a novel potential biomarker for early diagnosis of acute myocardial infarction in humans. Eur Heart J. 2010;31:659–666. [DOI] [PubMed] [Google Scholar]
- 6. Agrawal R, Pandey P, Jha P, Dwivedi V, Sarkar C, Kulshreshtha R. Hypoxic signature of microRNAs in glioblastoma: insights from small RNA deep sequencing. BMC Genomics. 2014;15:686. [DOI] [PMC free article] [PubMed] [Google Scholar]
- 7. Wang X, Ling CC, Li L, Qin Y, Qi J, Liu X, You B, Shi Y, Zhang J, Jiang Q, Xu H, Sun C, You Y, Chai R, Liu D. MicroRNA‐10a/10b represses a novel target gene mib1 to regulate angiogenesis. Cardiovasc Res. 2016;110:140–150. [DOI] [PubMed] [Google Scholar]
- 8. Wang D, Wang W, Lin W, Yang W, Zhang P, Chen M, Ding D, Liu C, Zheng J, Ling W. Apoptotic cell induction of miR‐10b in macrophages contributes to advanced atherosclerosis progression in ApoE‐/‐ mice. Cardiovasc Res. 2018;114:1794–1805. [DOI] [PubMed] [Google Scholar]
- 9. Fang L, Ellims AH, Moore XL, White DA, Taylor AJ, Chin‐Dusting J, Dart AM. Circulating microRNAs as biomarkers for diffuse myocardial fibrosis in patients with hypertrophic cardiomyopathy. J Transl Med. 2015;13:314. [DOI] [PMC free article] [PubMed] [Google Scholar]
- 10. Yang Q, Cui J, Wang P, Du X, Wang W, Zhang T, Chen Y. Changes in interconnected pathways implicating microRNAs are associated with the activity of apocynin in attenuating myocardial fibrogenesis. Eur J Pharmacol. 2016;784:22–32. [DOI] [PubMed] [Google Scholar]
- 11. Guillemin K, Krasnow MA. The hypoxic response: huffing and HIFing. Cell. 1997;89:9–12. [DOI] [PubMed] [Google Scholar]
- 12. Lee JW, Bae SH, Jeong JW, Kim SH, Kim KW. Hypoxia‐inducible factor (HIF‐1)alpha: its protein stability and biological functions. Exp Mol Med. 2004;36:1–12. [DOI] [PubMed] [Google Scholar]
- 13. Bahena‐Ocampo I, Espinosa M, Ceballos‐Cancino G, Lizarraga F, Campos‐Arroyo D, Schwarz A, Garcia‐Lopez P, Maldonado V, Melendez‐Zajgla J. miR‐10b expression in breast cancer stem cells supports self‐renewal through negative PTEN regulation and sustained AKT activation. EMBO Rep. 2016;17:1081. [DOI] [PMC free article] [PubMed] [Google Scholar]
- 14. Tu Y, Wan L, Fan Y, Wang K, Bu L, Huang T, Cheng Z, Shen B. Ischemic postconditioning‐mediated miRNA‐21 protects against cardiac ischemia/reperfusion injury via PTEN/Akt pathway. PLoS One. 2013;8:e75872. [DOI] [PMC free article] [PubMed] [Google Scholar]
- 15. Schwartzbauer G, Robbins J. The tumor suppressor gene PTEN can regulate cardiac hypertrophy and survival. J Biol Chem. 2001;276:35786–35793. [DOI] [PubMed] [Google Scholar]
- 16. Erlich JH, Boyle EM, Labriola J, Kovacich JC, Santucci RA, Fearns C, Morgan EN, Yun W, Luther T, Kojikawa O, Martin TR, Pohlman TH, Verrier ED, Mackman N. Inhibition of the tissue factor‐thrombin pathway limits infarct size after myocardial ischemia‐reperfusion injury by reducing inflammation. Am J Pathol. 2000;157:1849–1862. [DOI] [PMC free article] [PubMed] [Google Scholar]
- 17. Orogo AM, Gustafsson AB. Cell death in the myocardium: my heart won't go on. IUBMB Life. 2013;65:651–656. [DOI] [PMC free article] [PubMed] [Google Scholar]
- 18. Yaoita H, Ogawa K, Maehara K, Maruyama Y. Apoptosis in relevant clinical situations: contribution of apoptosis in myocardial infarction. Cardiovasc Res. 2000;45:630–641. [DOI] [PubMed] [Google Scholar]
- 19. Rodriguez M, Lucchesi BR, Schaper J. Apoptosis in myocardial infarction. Ann Med. 2002;34:470–479. [DOI] [PubMed] [Google Scholar]
- 20. Wahid F, Khan T, Kim YY. MicroRNA and diseases: therapeutic potential as new generation of drugs. Biochimie. 2014;104:12–26. [DOI] [PubMed] [Google Scholar]
- 21. Zhu K, Liu D, Lai H, Li J, Wang C. Developing miRNA therapeutics for cardiac repair in ischemic heart disease. J Thorac Dis. 2016;8:E918–E927. [DOI] [PMC free article] [PubMed] [Google Scholar]
- 22. Lucas T, Bonauer A, Dimmeler S. RNA therapeutics in cardiovascular disease. Circ Res. 2018;123:205–220. [DOI] [PubMed] [Google Scholar]
- 23. Mazure NM, Brahimi‐Horn MC, Berta MA, Benizri E, Bilton RL, Dayan F, Ginouves A, Berra E, Pouyssegur J. HIF‐1: master and commander of the hypoxic world. A pharmacological approach to its regulation by siRNAs. Biochem Pharmacol. 2004;68:971–980. [DOI] [PubMed] [Google Scholar]
- 24. Loor G, Schumacker PT. Role of hypoxia‐inducible factor in cell survival during myocardial ischemia‐reperfusion. Cell Death Differ. 2008;15:686–690. [DOI] [PubMed] [Google Scholar]
- 25. Minet E, Michel G, Remacle J, Michiels C. Role of HIF‐1 as a transcription factor involved in embryonic development, cancer progression and apoptosis (review). Int J Mol Med. 2000;5:253–259. [DOI] [PubMed] [Google Scholar]
- 26. Piret JP, Mottet D, Raes M, Michiels C. Is HIF‐1alpha a pro‐ or an anti‐apoptotic protein? Biochem Pharmacol. 2002;64:889–892. [DOI] [PubMed] [Google Scholar]
- 27. Acker T, Acker H. Cellular oxygen sensing need in CNS function: physiological and pathological implications. J Exp Biol. 2004;207:3171–3188. [DOI] [PubMed] [Google Scholar]
- 28. Ong SG, Hausenloy DJ. Hypoxia‐inducible factor as a therapeutic target for cardioprotection. Pharmacol Ther. 2012;136:69–81. [DOI] [PubMed] [Google Scholar]
- 29. Zhang Z, Li H, Chen S, Li Y, Cui Z, Ma J. Knockdown of microRNA‐122 protects H9c2 cardiomyocytes from hypoxia‐induced apoptosis and promotes autophagy. Med Sci Monit. 2017;23:4284–4290. [DOI] [PMC free article] [PubMed] [Google Scholar] [Retracted]
- 30. Wang X, Li C, Dai Q. Down‐regulation of microRNA‐26b rescued hypoxia‐induced apoptosis in cultured neonatal rat cardiac myocytes by regulating PTEN. Int J Clin Exp Med. 2015;8:4073–4079. [PMC free article] [PubMed] [Google Scholar]
- 31. Liu Y, Nie H, Zhang K, Ma D, Yang G, Zheng Z, Liu K, Yu B, Zhai C, Yang S. A feedback regulatory loop between HIF‐1alpha and miR‐21 in response to hypoxia in cardiomyocytes. FEBS Lett. 2014;588:3137–3146. [DOI] [PubMed] [Google Scholar]
- 32. Zundel W, Schindler C, Haas‐Kogan D, Koong A, Kaper F, Chen E, Gottschalk AR, Ryan HE, Johnson RS, Jefferson AB, Stokoe D, Giaccia AJ. Loss of PTEN facilitates HIF‐1‐mediated gene expression. Genes Dev. 2000;14:391–396. [PMC free article] [PubMed] [Google Scholar]
- 33. Chen F, Zhuang M, Zhong C, Peng J, Wang X, Li J, Chen Z, Huang Y. Baicalein reverses hypoxia‐induced 5‐FU resistance in gastric cancer AGS cells through suppression of glycolysis and the PTEN/Akt/HIF‐1alpha signaling pathway. Oncol Rep. 2015;33:457–463. [DOI] [PubMed] [Google Scholar]
Associated Data
This section collects any data citations, data availability statements, or supplementary materials included in this article.
Supplementary Materials
Figure S1. The ischemic area of negative control and miR‐10b‐5p myocardial infarct size.