Abstract
Multicellular organisms have co-evolved with complex consortia of viruses, bacteria, fungi and parasites, collectively referred to as the microbiota. In mammals, changes in the composition of the microbiota can influence a wide range of physiologic processes (including development, metabolism, and immune cell function) and are associated with susceptibility to multiple diseases. Alterations in the microbiota can also modulate host behaviors such as social activity, stress, and anxiety-related responses that are linked to diverse neuropsychiatric disorders. However, the mechanisms through which the microbiota influence neuronal activity and host behavior remain poorly defined. Here we demonstrate that manipulation of the microbiota in either antibiotic-treated or germ-free adult mice results in significant deficits in fear extinction learning. Single nucleus RNA-sequencing of the medial prefrontal cortex of the brain revealed significant alterations in gene expression in multiple cell types including excitatory neurons and glial cells. Transcranial two-photon imaging following deliberate manipulation of the microbiota demonstrated that extinction learning deficits were associated with defective learning-related remodeling of postsynaptic dendritic spines and reduced activity in cue-encoding neurons in the medial prefrontal cortex. In addition to effects of manipulating the microbiota on behavior in adult mice, selective re-establishment of the microbiota revealed a limited neonatal developmental window in which microbiota-derived signals can restore normal extinction learning in adulthood. Lastly, unbiased metabolomic analysis identified four metabolites that were significantly downregulated in germ-free mice and were previous reported to be related to human and mouse models of neuropsychiatric disorders, suggesting that microbiota-derived compounds may directly affect brain function and behavior. Together, these data indicate that fear extinction learning requires microbiota-derived signals during both early postnatal neurodevelopment and in adult mice, with implications for our understanding of how diet, infection, and lifestyle influence brain health and subsequent susceptibility to neuropsychiatric disorders.
Pavlovian fear conditioning is an evolutionarily conserved associative learning process that is critical for the survival of an organism and its ability to respond appropriately to neutral stimuli that reliably predict dangerous or aversive outcomes1. In the classical fear conditioning paradigm, extinction learning occurs when repeated cue presentations are no longer paired with an unconditioned stimulus (such as a foot shock) and the organism learns to modify its behavior accordingly. Deficits in extinction learning after an environmental threat has passed have been implicated in multiple neuropsychiatric disorders, including post-traumatic stress disorder and other anxiety disorders2. Clinical and epidemiological studies have reported correlations between changes in the microbiota and other neuropsychiatric disorders3–5. Animal studies indicate that the absence or modification of the intestinal microbiota affects neurogenesis6, cortical myelination7, blood-brain barrier function8, and microglia maturation9, as well as social behavior, stress-related responses and fear learning10,11,12. However, there are conflicting reports on how the microbiota influence behavior11–14 and the mechanisms through which the microbiota regulate associative learning and its neurobiological substrates remain unclear.
Extinction learning deficits following manipulation of the microbiota
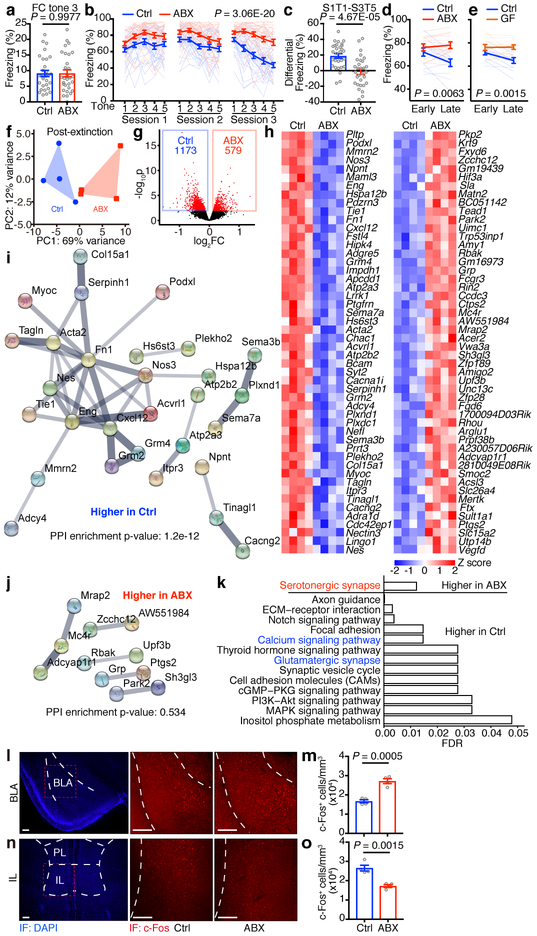
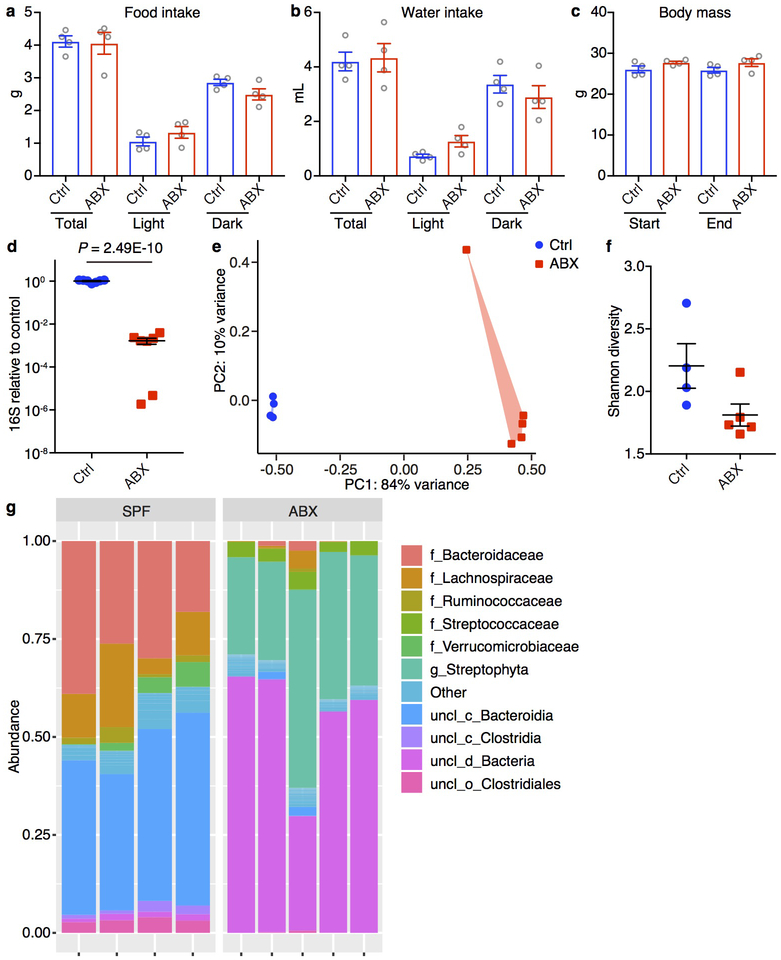
To test whether the microbiota influence fear conditioning and extinction, we first antibiotic-treated adult mice (termed ABX mice)15 and employed a classical cued fear conditioning and extinction learning paradigm16. ABX mice and Ctrl mice showed comparable food/water intake and weight gain (Extended Data Fig. 1a–c). The bacterial burden was 600-fold lower in ABX mice compared to control mice (Extended Data Fig. 1d), and 16S rDNA sequencing revealed a shift in bacterial community structure due to the antibiotic treatment (Extended Data Fig. 1e–g). Following fear conditioning, ABX mice displayed equivalent freezing behavior to control mice, indicating that the acquisition of fear conditioning was normal (Fig. 1a). Extinction learning reduced conditioned freezing in control mice16. In contrast, extinction learning and conditioned freezing were significantly impaired in ABX mice (Fig. 1b, c). To further examine the influence of the microbiota on extinction learning, we performed a similar cued fear conditioning and extinction learning assay in adult germ-free (GF) mice. To maintain the microbe-free status of the GF mice, we used a modified single-session fear extinction protocol17. Again, both ABX and GF mice exhibited impaired extinction learning (Fig. 1d, e). These data demonstrate that signals derived from the microbiota are indispensable for optimal extinction of conditioned fear responses.
Figure 1. ABX and GF mice are less prone to fear extinction.
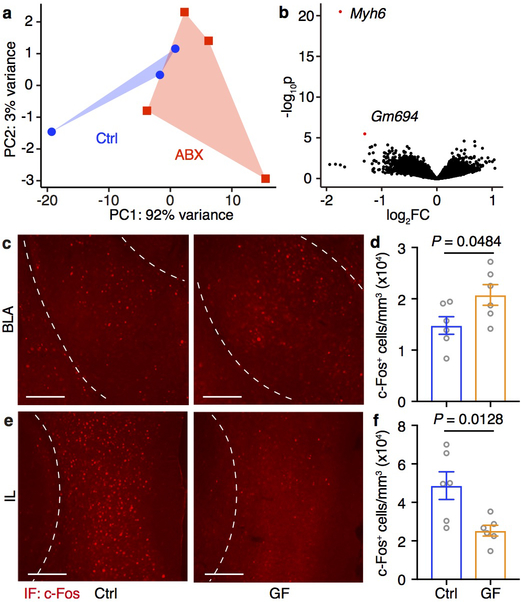
a-c, Acquisition of fear conditioning (FC) (a), fear extinction over the course of 3 days/sessions (b) and after three days (c) in Ctrl and ABX mice. S, session. T, tone. d,e, Fear extinction of Ctrl versus ABX (d) or Ctrl versus GF (e) mice in the single-session 30-tone fear extinction assay. Data in (a-c) are pooled from two independent experiments, n = 30/group. Data in (d,e) are pooled from two independent experiments. n = 12/group. Data are mean ± SEM. Unpaired two-sided t tests were used in (a,c). The area under the curve (AUC) was calculated for each mouse within each group in (b,d,e), followed by unpaired two-sided t test between groups. f, Principle component analysis (PCA) of mouse mPFC transcriptome post fear extinction. n = 4/group. PERMANOVA: F = 5.00, Df = 1, P = 0.027. g, Volcano plot of differential expression of ABX versus Ctrl groups in (f). Red dots: differentially expressed genes (DESeq2 Wald test, FDR < 0.1). FC, fold change. h, Heatmaps showing the top 50 most significantly downregulated or upregulated genes in (g). Lowly-expressed genes with mean normalized counts in the bottom 20th percentile were excluded. i,j, STRING network visualization of the genes in (h). Edges represent protein-protein associations. Disconnected nodes were excluded. k, Significantly enriched KEGG pathways based on all differentially expressed genes in (g). l-o, Immunofluorescence staining (l,n) and the density of c-Fos+ neurons (m,o) in the BLA (l,m) or IL (n,o) of Ctrl and ABX mice after fear extinction session 3. Data are representative of two independent experiments. n = 4/group. Data are mean ± SEM. Unpaired two-sided t tests were used. BLA, basolateral amygdala; PL, prelimbic; IL, infralimbic. Scale bar, 200 μm.
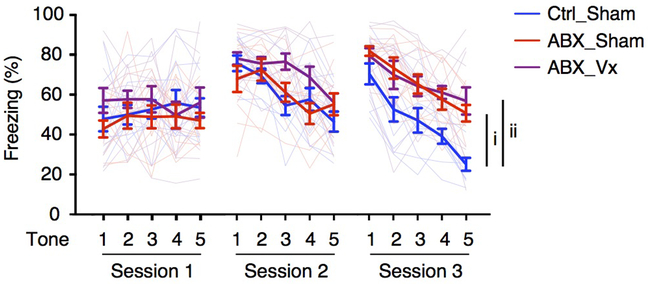
The vagus nerve is one mechanism through which neuronal communication between the intestine and the brain is established18,19. We sought to test whether the vagus nerve is involved in extinction learning deficits following deliberate manipulation of the microbiota by employing surgical vagotomy in adult animals. Notably, vagotomized ABX mice exhibited similar deficits in extinction learning as Sham ABX mice, suggesting that the extinction learning deficits in ABX mice is vagus nerve-independent (Extended Data Fig. 2).
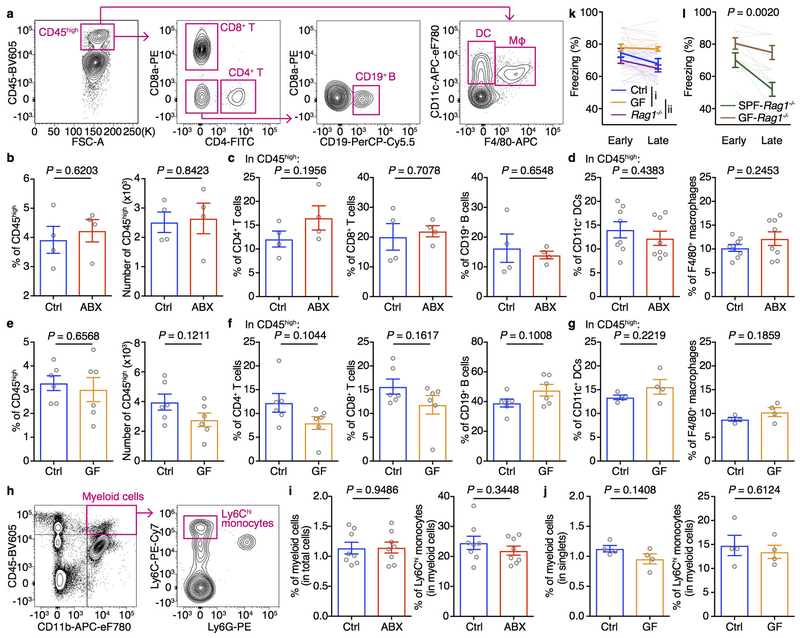
Given that microbiota-derived signals can regulate the immune system and that immune cells can influence brain function and behavior20–22, we tested whether extinction learning deficits were associated with alterations in immune responses in the brain. Compared to control mice, ABX and GF mice exhibited no differences in the percentages and numbers of CD45high leukocytes in the brain (Extended Data Fig. 3a, b, e), and no differences in the percentages of CD4+ T cells, CD8+ T cells, CD19+ B cells, CD11c+ dendritic cells (DCs), F4/80+ macrophages and Ly6Chi monocytes (Extended Data Fig. 3c–d, f–j). Moreover, Rag1−/− mice, which lack adaptive immune cells, exhibited normal extinction learning (Extended Data Fig. 3k), while GF-Rag1−/− mice exhibited deficits in extinction learning (Extended Data Fig. 3l), indicating that the adaptive immune system is not required for extinction learning deficits in ABX and GF mice.
Given that deficits in extinction learning appear to occur independently of changes in the immune system, we sought to examine their neuroanatomical basis. We performed genome-wide transcriptional profiling of the medial prefrontal cortex (mPFC), an area of the brain known to play a critical role in extinction learning23, from adult ABX and control mice. The mPFC tissue dissected in the absence of fear conditioning and extinction exhibited comparable transcriptomes (Extended Data Fig. 4a, b). However, significant differences in the transcriptome of ABX and control mPFCs were revealed after extinction learning (Fig. 1f, g). Search tool for recurring instances of neighboring genes (STRING) analysis depicted networks of interactions of the differentially expressed genes (DEGs) between ABX and control samples (Fig. 1h–j); Kyoto encyclopedia of genes and genomes (KEGG) and gene ontology (GO) enrichment analyses revealed pathways that are associated with neuronal activity, synapse function, central nervous system maturation and the regulation of synaptic plasticity and postsynaptic dendritic spine development (Fig. 1k, Supplementary Table 1).
To test whether alterations in gene expression associated with these neuronal processes were associated with changes in neuronal activity, we examined neuronal activity in fear learning circuits by analyzing c-Fos expression24 in the basolateral amygdala (BLA), which is critical for encoding and storing conditioned fear memory25, and in the infralimbic region (IL) of mPFC, which facilitates extinction learning23. Compared to control mice, ABX and GF mice exhibited a higher density of c-Fos+ neurons in the BLA (Fig. 1l, m, Extended Data Fig. 4c, d) and lower density of c-Fos+ neurons in the IL (Fig. 1n, o, Extended Data Fig. 4e, f), which is consistent with their deficits in extinction learning.
Altered excitatory neurons and microglia in the mPFC following alterations in microbiota
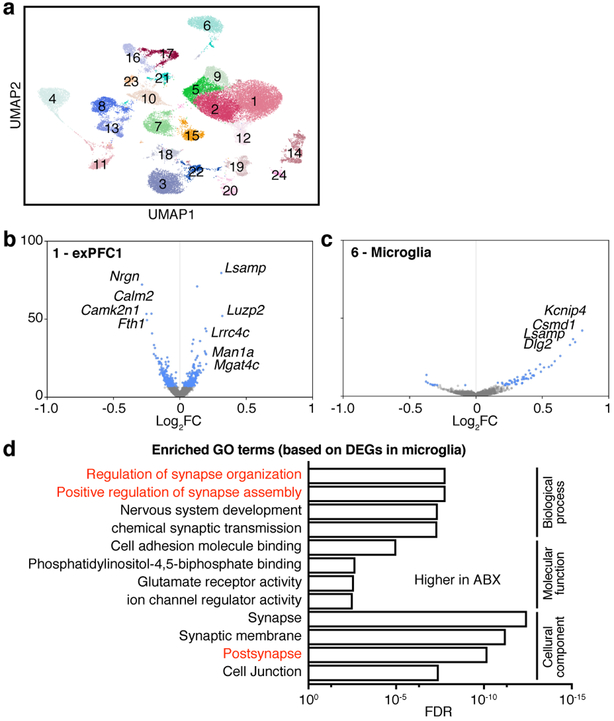
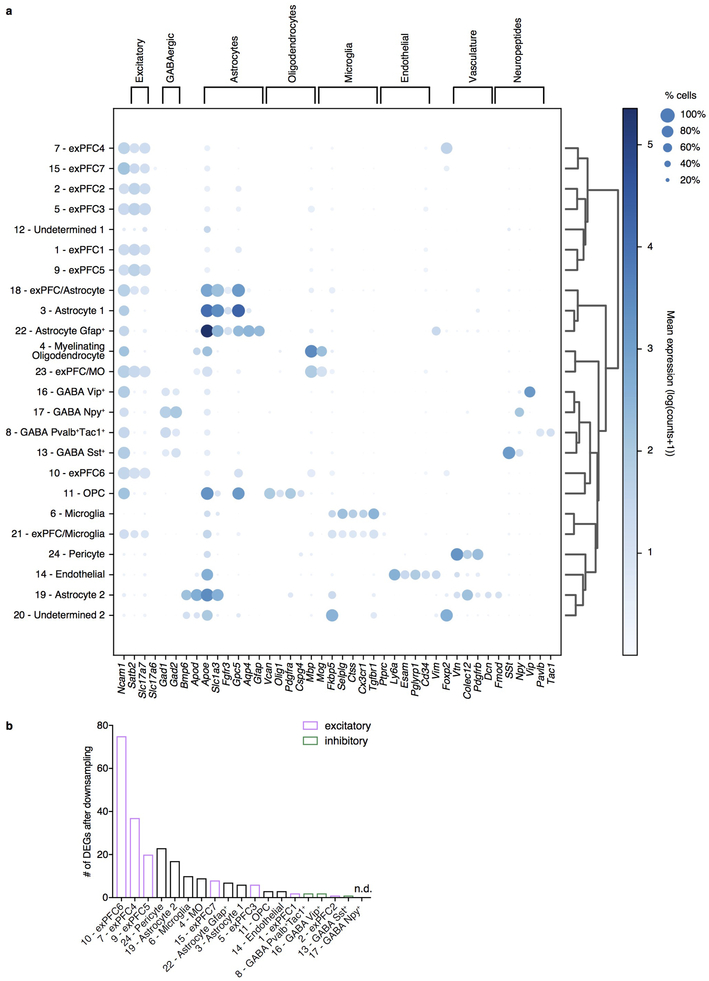
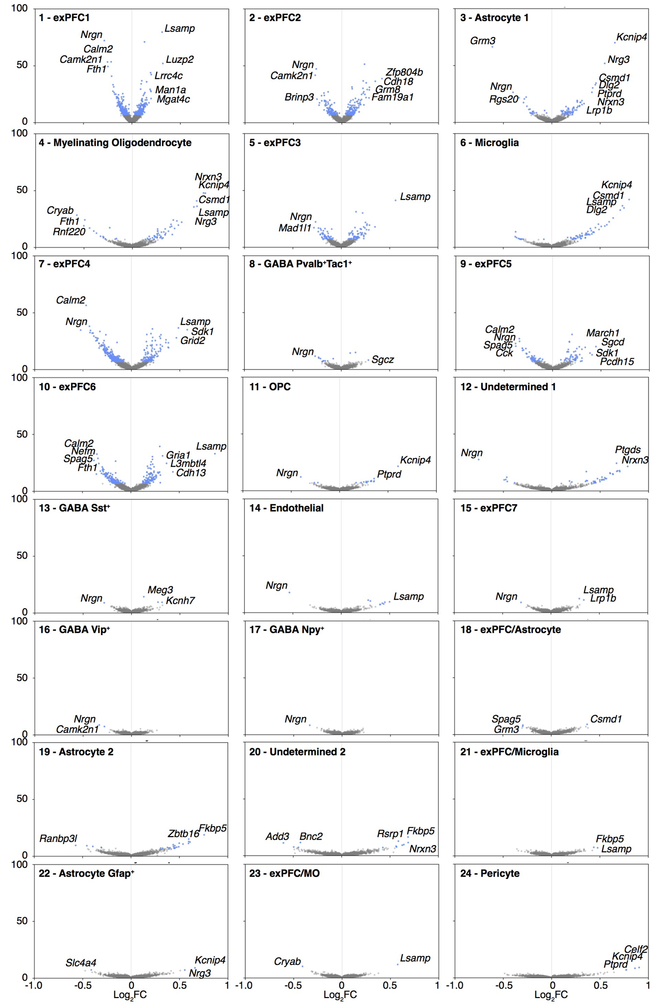
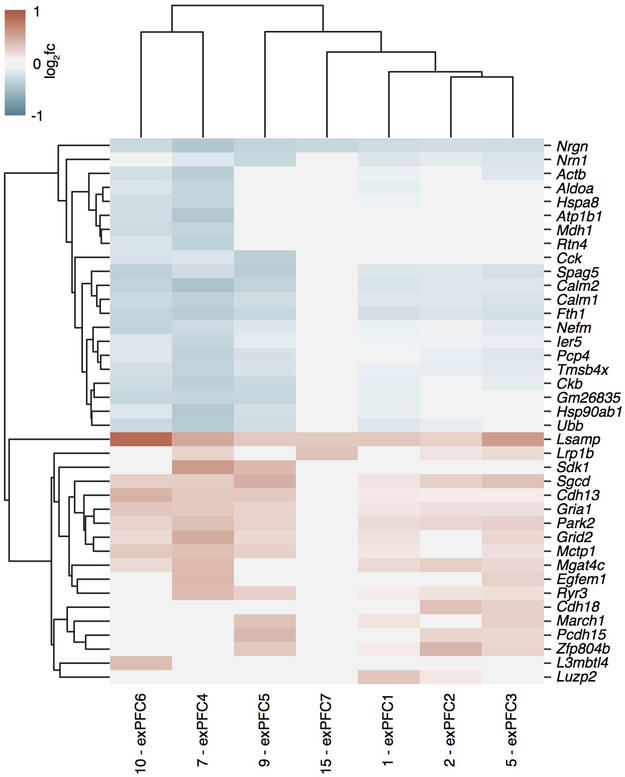
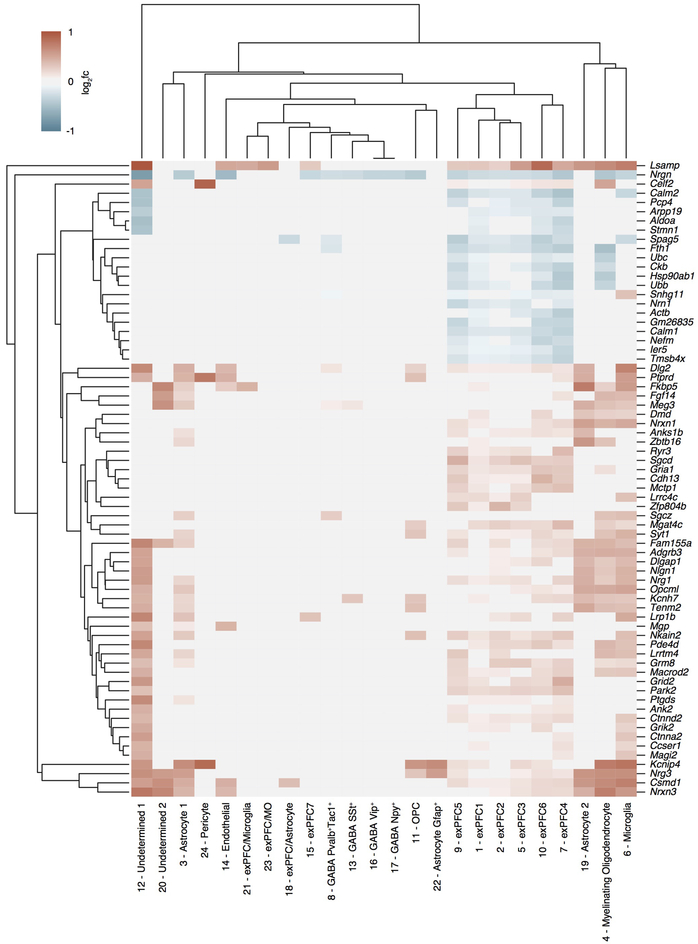
To define the cell subsets in the mPFC that contribute to the effect of the microbiota on extinction learning, we performed single nucleus RNA-seq (snRNA-seq) of mPFC samples dissected from ABX and control mice after extinction learning, and identified 24 cell clusters (Fig. 2a, Extended Data Fig. 5a). Changes in the microbiota were associated with significant changes in gene expression in multiple clusters (Extended Data Fig. 6). Among the neuronal clusters, excitatory neurons (Fig. 2b, Extended Data Fig. 6) were more affected than inhibitory neurons including Pvalb+Tac1+, Sst+, Vip+ or Npy+ subset (Extended Data Fig. 6; Extended Data Fig. 5b, for comparable statistical power we calculated the number of DEGs after downsampling each cluster to 500 nuclei). Astrocytes, myelinating oligodendrocytes and microglia were also affected (Extended Data Fig. 6). DEGs shared across excitatory neuronal subsets (Extended Data Fig. 7) and across multiple cell types (Extended Data Fig. 8) were linked to synapse-related pathways and calcium signaling pathways (Supplementary Table 2, 3), which is consistent with our bulk RNA-seq data (Fig. 1k) and supports a model in which gene expression is altered in brain-resident cells, including specific cell populations such as excitatory neurons and microglia, following manipulation of the microbiota.
Figure 2. Excitatory neurons and microglia are affected in ABX mice.
a, Single nucleus profiles colored by cell type (see Extended Data Fig. 5 for annotations). n = 2/group. b,c, Differentially expressed genes (blue dots: z-test calculated on coefficients of mixed linear model, Bonferroni-corrected P<10−7) of ABX versus Ctrl in excitatory neuron subset 1 (exPFC1) (b) or microglia (c). d, GO terms significantly enriched among the differentially expressed genes in microglial cluster in (c).
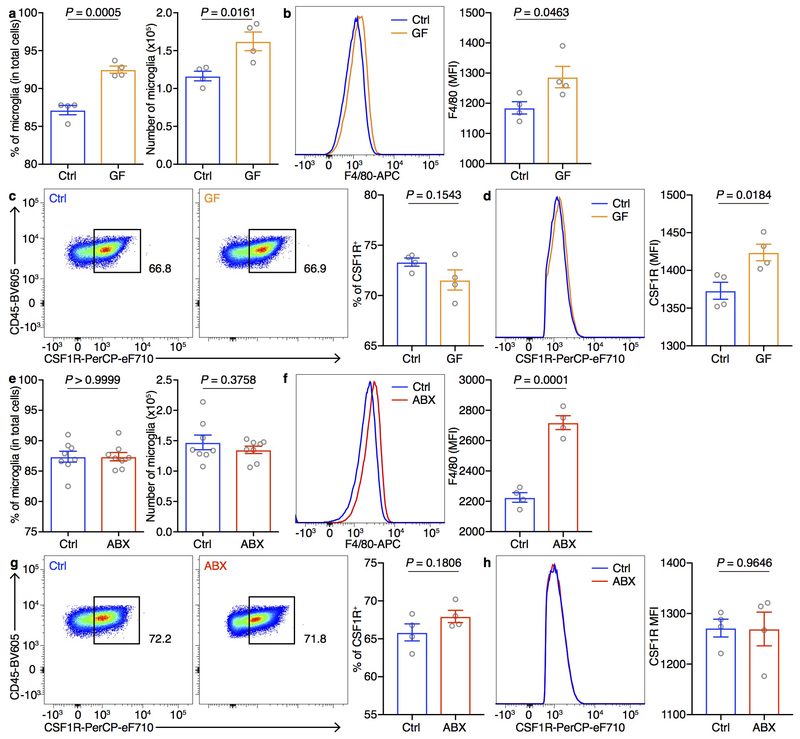
Given that microglia are important for maintaining neuronal function and brain health by dynamically regulating synaptic pruning and surveying their local microenvironment and have been reported to be affected by the microbiota9,26, we further investigated the DEGs of microglia (Fig. 2c). The microglial DEGs were enriched in the pathways related to synapse organization and synapse assembly (Fig. 2d, Supplementary Table 4), suggesting that deliberate manipulation of the microbiota may alter microglia-mediated synaptic pruning. In addition, consistent with the literature9, we found elevated percentages and numbers of microglia in GF mice, with elevated expression of CSF1R and F4/80 (Extended Data Fig. 9a–d). The percentages and numbers of microglia in ABX mice were not changed, with no changes in CSF1R expression, but F4/80 expression was elevated (Extended Data Fig. 9e–h). CSF1R and F4/80 are strongly developmentally regulated, with decreasing levels during maturation27. Together, these data suggest that the microglia in GF and ABX mice exhibit an immature state reminiscent of developing juvenile microglia, which may in turn contribute to deficits in extinction learning by disrupting dendritic spine remodeling.
Alterations in the microbiota are associated with defective extinction learning-related spine remodeling
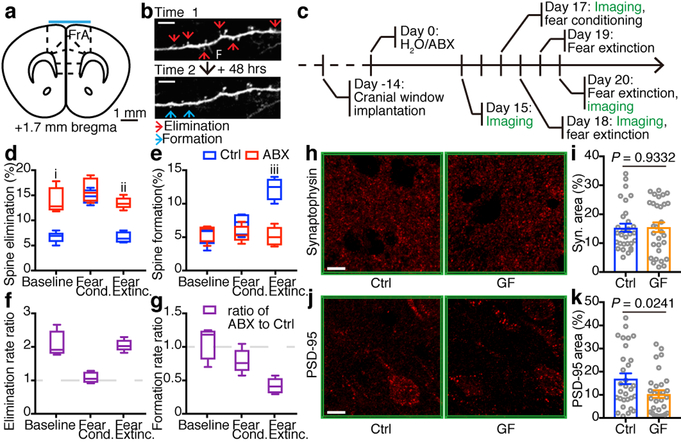
Next, we employed two-photon laser scanning microscopy to directly quantify the remodeling of postsynaptic dendritic spines in the mPFC (Fig. 3a) during cued fear conditioning and extinction learning in transgenic Thy1/YFP reporter mice following manipulation of the microbiota in adulthood. Postsynaptic dendritic spines are membranous protrusions on neuronal dendrites that form primarily excitatory synapses with presynaptic axonal inputs and are dynamically remodeled during learning and development28–31. Previous work showed that fear conditioning and extinction learning are correlated with opposing effects on the formation and elimination of dendritic spines in the mPFC32. We acquired images of the same dendritic spines during a baseline period and before and after fear conditioning and extinction learning (Fig. 3b, c). Compared to control mice, baseline spine elimination rates were significantly elevated in ABX mice (Fig. 3d, f), while baseline formation rates were unaffected (Fig. 3e, g). Consistent with the previous report32, cued fear conditioning and extinction learning had opposing effects on spine remodeling in control mice. Fear conditioning increased spine elimination rates in control mice (Fig. 3d), such that there was no significant difference in spine elimination or formation rates in the 24 hours after conditioning in ABX mice compared to control mice (Fig. 3d–g). In contrast, extinction learning-related spine remodeling was significantly altered in ABX mice. Extinction learning increased spine formation rates in control mice but not in ABX mice (Fig. 3e, g), and spine elimination rates remained persistently elevated in ABX mice relative to control mice (Fig. 3d, f).
Figure 3. Defective extinction learning-related dendritic spine formation in ABX mice.
a, Diagrammatic representation of a coronal section of mPFC showing the imaging site (cyan bar). FrA, frontal association cortex. b, Example images of neuronal dendritic branch segments at two consecutive imaging time points. Red arrows, spine elimination. Blue arrows, spine formation. Scale bar, 5 μm. F, filopodia. c, Timeline of transcranial two-photon spine imaging. d,e, Percentage of spine elimination (d) and formation (e) at baseline, during fear conditioning and during fear extinction, respectively. f,g, Ratio of ABX to Ctrl on spine elimination rate (f) and spine formation rate (g). Data in (d-g) are pooled from three independent experiments, n = 5/group. Center line, median; box, 25th and 75th percentiles; whiskers, mean to max. Unpaired two-sided t tests were used in (d,e). P values: i, 0.0010. ii, 4.38E-05. Iii, 0.0002. h-k, Immunofluorescence staining and the area of synaptophysin (h,i) or PSD-95 (i,k) in the mPFC of Ctrl and GF mice. Data are pooled from two independent experiments. n = 6/group. Each symbol represents one region of interest (ROI). 5 ROIs per mouse. Data are mean ± SEM. Unpaired two-sided t tests were used. Scale bar, 10 μm.
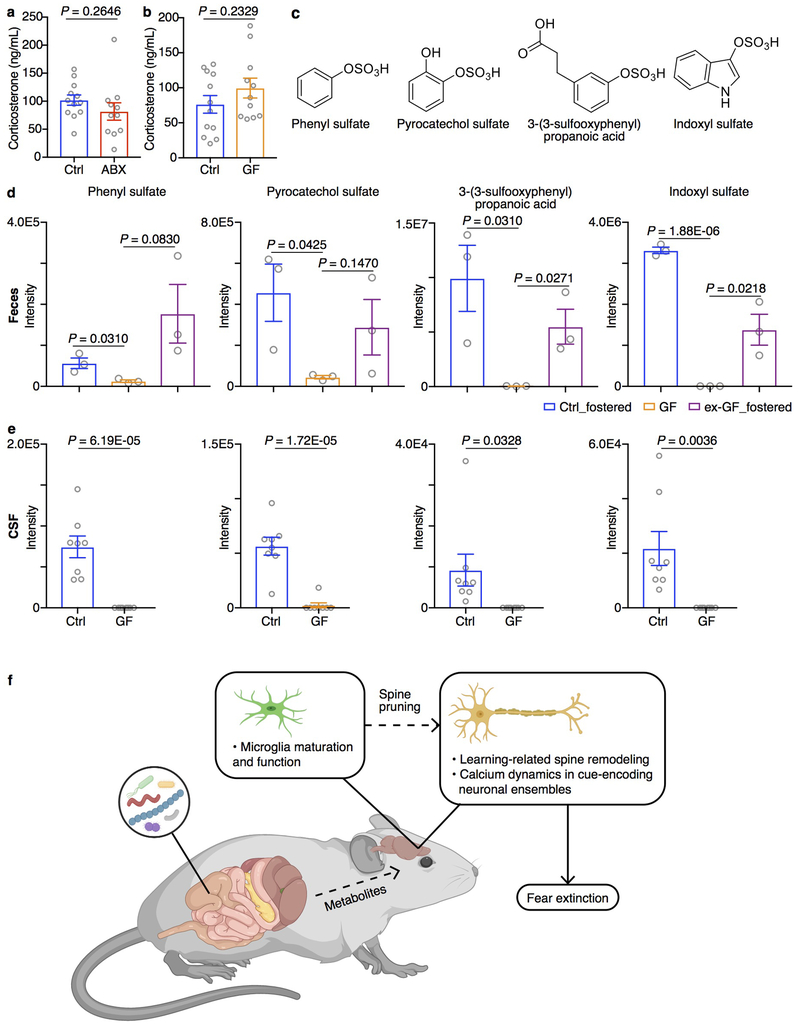
Consistent with elevated spine elimination in ABX mice, we observed comparable expression of the pre-synaptic marker synaptophysin but lower expression of the post-synaptic marker PSD-95 in the mPFC of GF mice compared to control mice (Fig. 3h–k). In addition, the expression of Dlg4 in excitatory neuron subset 1 (exPFC1) was downregulated in ABX samples compared to control samples. Together, these data indicate that alterations in the composition of the microbiota are associated with deficits in learning-induced spine plasticity. Notably, plasma corticosterone levels were comparable in control, ABX and GF mice (Extended Data Fig. 10a, b)33, indicating that HPA axis function may not be altered and is not a major driver in microbiota-mediated changes in spine remodeling and fear extinction learning.
Defective tone-encoding neuronal ensembles in ABX mice
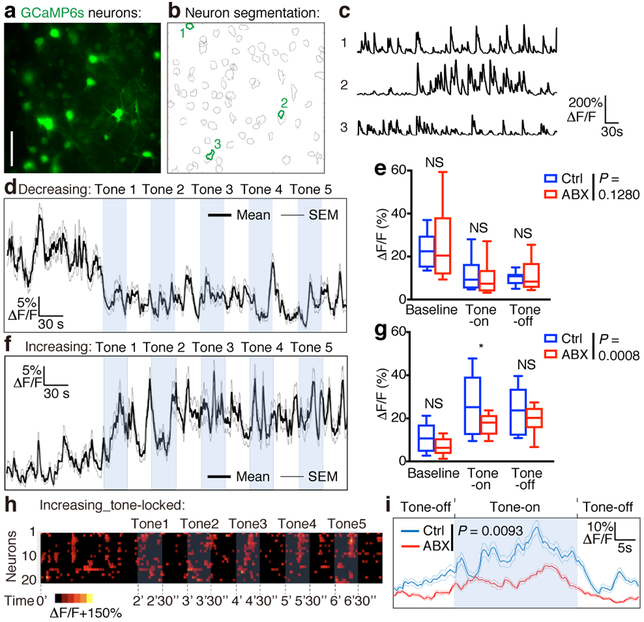
To investigate whether signals derived from the microbiota regulate learning-related neuronal activity in the mPFC, we used two-photon imaging and a genetically encoded calcium sensor (AAV5/hSyn/GCaMP6s) to quantify neuronal activity during extinction learning in control and ABX mice (Fig. 4a–c). We identified mPFC neurons that encoded the conditioned stimulus, and discovered two differentially responding functional cell types. In both control and ABX mice, one neuronal population (representing 13.5% of all cells) exhibited equivalently reduced activity during tone presentations (Fig. 4d, e). In contrast, a second population (representing 14.9% of all cells) displayed increased activity during tone presentations (Fig. 4f). Neuronal activity during tone presentations was modestly but significantly reduced in the latter cell population in ABX mice compared to control mice (Fig. 4g), consistent with their deficits in spine formation and behavior. Notably, 26.8% of these neurons also encoded the precise timing of the tones, exhibiting tone-locked activity that increased and decreased in response to the onset and offset of each tone, respectively (Fig. 4h). Again, tone-locked activity in these multicellular tone-sensitive ensembles was significantly reduced in ABX mice compared to control mice (Fig. 4i). In conjunction with the RNA-seq and dendritic spine remodeling analyses, these data indicate that dysbiosis of the gut microbiota disrupts learning-related spine formation and interferes with the emergence of multicellular tone-encoding ensembles.
Figure 4. Defective ensemble calcium dynamics in the mPFC of ABX mice.
a, Example false-color image (mean projection over time) of GCaMP6s-expressing neurons in mPFC. Scale bar, 50 μm. b, Segmentation of the neurons in (a). c, Neuronal activity (ΔF/F) extracted from the 3 example neurons outlined in (b). d-g, Population activity trace (mean ΔF/F ± SEM) for neurons exhibiting decreased (d) or increased (f) activity during tone presentations in fear extinction session 3. Mean activity (ΔF/F) during each task epoch (baseline, tone-on, tone-off) (e) for the neuronal population depicted in (d) presents a significant decrease in activity (repeated measures ANOVA: main effect of time: F(10,1600) = 3.138, P = 0.007) but no significant difference between groups (group-by-time interaction: F(10,1600) = 2.736, P = 0.1280). NS, not significant (baseline, 0.285; tone-on, 0.595; tone-off, 0.578). Mean activity (ΔF/F) during each task epoch (g) for the neuronal population depicted in (f) presents a significant increase in activity (repeated measures ANOVA: main effect of time: F(10,1770) = 4.945, P < 0.0001) and a significant group-by-time interaction (F(10,1770) = 3.806, P = 0.0008). *, 0.013, significant group difference in post-hoc contrast. NS, not significant (baseline, 0.128; tone-off, 0.601). Center line, median; box, 25th and 75th percentiles; whiskers, mean to max in (e,g). h, Raster plot of neuronal activity for cells that encoded the timing of tones by increasing and decreasing activity in response to tone onset and offset, respectively. Each row indicates one neuron. i, Population activity trace (mean ΔF/F ± SEM) for neurons depicted in (h), timelocked to tone onset and averaged across tones. Repeated measures ANOVA: main effect of time: F(179,8234) = 7.033, P < 0.0001; group by time interaction: F(179,8234) = 2.749, P = 0.0093. Data in (d-i) are based on 1,204 total cells pooled from three independent experiments, from n = 7 Ctrl mice and n = 8 ABX mice.
A diverse microbiota is required to restore extinction learning
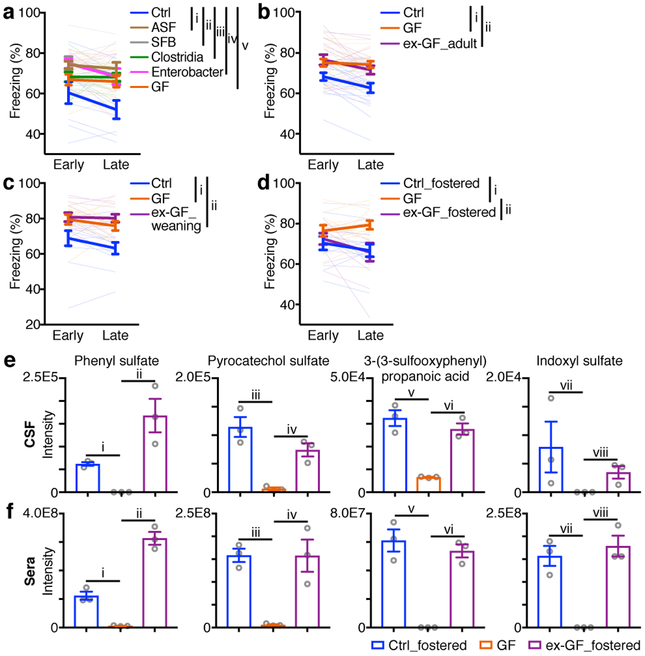
To test whether the extinction learning deficits caused by altered microbiota can be rescued by colonization with defined individual microbes or consortia of microbes, we performed fear conditioning and extinction learning in gnotobiotic mice colonized with bacteria that are known to influence other physiologic processes. Notably, following colonization with segmented filamentous bacterium (SFB)34, Clostridia spp.35, Enterobacter spp.36, or altered Schaedler flora (ASF)37, these gnotobiotic mice still exhibited impaired extinction learning compared to control mice (Fig. 5a), suggesting that a more diverse microbiota is required for normal extinction learning and fear extinction behavior.
Figure 5. Extinction learning deficits in GF mice are associated with alterations in microbiota-derived metabolites.
d, Fear extinction of Ctrl, GF and gnotobiotic mice colonized by SFB, Clostridia, Enterobacter or ASF bacterium(-a) (a), Ctrl, GF and ex-GF_adult mice (b), Ctrl, GF and ex-GF_weaning mice (c), or Ctrl, GF and ex-GF_fostered mice (d) in the single-session 30-tone fear extinction assay. Data in (a,b,d) are pooled from three independent experiments, and data in (c) are pooled from two independent experiments. (a) n = 9, 13, 9, 12, 7 and 9 for Ctrl, GF, SFB, Clostridia, Enterobacter and ASF, respectively. (b) n = 18/group. (c) n = 12/group. (d) n = 10, 11 and 12 for Ctrl_fostered, GF, and GF_fostered, respectively. Data are mean ± SEM. The AUC was calculated for each mouse within each group followed by one-way ANOVA with Tukey’s multiple comparisons test. (a) F (5, 53) = 7.046, P = 4.10E-05. Adjusted P values: i, 6.34E-05. ii, 0.0002. iii, 0.0042. iv, 0.0010. v, 0.0189. (b) F (2, 51) = 11.92, P = 5.66E-05. Adjusted P values: i, 0.0002. ii, 0.0005. (c) F (2, 33) = 12.64, P = 8.40E-05. Adjusted P values: i, 0.0016. ii, 0.0001. (d) F (2, 30) = 5.131, P = 0.0121. Adjusted P values: i, 0.0228. ii, 0.0273. e,f, Relative abundances of four compounds in cerebrospinal fluid (CSF) (e) and serum (f) samples from Ctrl_fostered, GF and GF_fostered mice. n = 3/group. Unpaired two-sided t tests were used. (e) i, 9.54E-05. ii, 0.0102. iii, 0.0036. iv, 0.0044. v, 0.0018. vi, 0.0011. vii, 0.1493. viii, 0.0331. (f) i, 0.0017. ii, 0.0002. iii, 0.0005. iv, 0.0128. v, 0.0014. vi, 0.0003. vii, 0.0020. viii, 0.0014.
To investigate whether the extinction learning deficits caused by altered microbiota are reversible, we re-colonized previously germ-free (ex-GF) mice with a complete microbiota from healthy control mice at various developmental time points. Both ex-GF mice colonized when they were adults and ex-GF mice colonized at weaning age still displayed impaired fear extinction compared to control mice (Fig. 5b, c), indicating that extinction learning deficits were not reversible in GF mice after weaning. However, when ex-GF mice were colonized immediately following birth via fostering to microbiota-replete specific pathogen-free surrogate mothers (ex-GF_fostered mice), they exhibited a restoration of normal fear extinction behavior comparable to control_fostered mice (Fig. 5d), indicating that extinction learning and learning-related plasticity require microbiota-derived signals during a critical developmental period prior to weaning. Lack of the microbiota in the neonatal period, no matter whether microbially-colonized or not after weaning, renders deficits in fear extinction learning in adulthood. While ex-GF_fostered mice restored fear extinction, we found no significant shift in the transcriptome of the mPFC of the ex-GF_fostered mice or control_fostered mice, compared to GF mice after the single-session fear extinction (data not shown). This could reflect the shorter extinction model employed in GF mice that may induce smaller transcriptional changes than the 3-day/session fear extinction model employed in ABX mice. Alternatively, the lack of transcriptional changes in the GF fostering studies could indicate other processes such as post-translational or epigenomic modifications.
Altered metabolites in the brain are associated with fear extinction
Next, we sought to examine whether changes in neuronal development and fear extinction learning were associated with alterations in microbiota-derived metabolites. We employed untargeted comparative metabolomics of cerebrospinal fluid (CSF), serum and fecal samples from adult GF mice, control_fostered mice and ex-GF_fostered mice using high-resolution liquid chromatography-mass spectrometry (LC-MS). Using the xcms platform38 for comparative analysis of the MS data sets, we identified four metabolites – phenyl sulfate, pyrocatechol sulfate, 3-(3-sulfooxyphenyl)propanoic acid (all phenolic compounds) and indoxyl sulfate (Extended Data Fig. 10c) – that were significantly decreased in CSF, serum and fecal samples of GF mice compared to control_fostered mice, and were recovered in ex-GF_fostered mice (Fig. 5e, f, Extended Data Fig. 10d). Downregulation of the same four metabolites was also detected in comparisons of GF vs. control CSF samples (Extended Data Fig. 10e), as well as in comparisons of ABX versus control samples (data not shown). Notably, 3-(3-hydroxyphenyl)-3-hydroxypropanoic acid (HPHPA, a derivative of 3-(3-sulfooxyphenyl)propanoic acid) and indoxyl sulfate have been associated with human neuropsychiatric disorders such as impaired executive function, schizophrenia and autism39–41. Other microbiota-derived phenolic compounds such as 4-ethylphenylsulfate were reported to influence autism-related mouse behaviors42, suggesting these microbiota-derived compounds may play conserved roles in the development and function of neurons in multiple contexts.
Discussion
This study informs a model whereby alterations in exposure to the microbiota in neonatal and adult mice can have profound and long-lasting effects on neuronal function and learning-related plasticity that subsequently regulate fear extinction behavior (Extended Data Fig. 10f). From bulk RNA-seq and snRNA-seq data, the deficits in extinction learning correlate with malfunctions of the mPFC, notably in excitatory neurons. Transcranial two-photon live imaging confirmed the changes in neurons in the ABX mice, specifically, reduced extinction learning-associated spine formation and altered learning-related neuronal activity. Given that the vagus nerve does not contribute to the extinction learning deficits in ABX mice in this setting, the microbiota may affect the central nervous system through circulating microbiota-derived metabolites, directly influencing excitatory neurons in the mPFC, leading to deficits in extinction learning. In addition, microbiota-derived metabolites may also influence other cell subsets in the mPFC, such as microglia, and indirectly affect the excitatory neurons and behavior. In accordance with this and consistent with other studies9, we found that the microglia in GF and ABX mice exhibited an immature state reminiscent of developing juvenile microglia, which may contribute to elevated spine pruning and reduced extinction learning-associated spine formation. In this context, future studies are necessary to determine the molecular basis for how alterations in microbiota-derived metabolites affect cellular activities in the mPFC.
In summary, our findings offer one compelling explanation for the profound deficits in fear extinction learning in ABX and GF mice, and suggest alterations in microbiota-derived metabolites contribute to altered neuronal activity and behavior. Coupled with the growing literature on the influence of the microbiota, diet and lifestyle on chronic inflammatory diseases, metabolic health and cancer, the effects of beneficial microbes on brain health and behavior highlight the need to better define the co-evolved relationship between the microbiota, the nervous system and mammalian behaviors.
Methods
No statistical methods were used to predetermine sample size. The experiments were not randomized and investigators were not blinded to allocation during experiments and outcome assessment, except for dendritic spine imaging data analysis, in which the raters blinded to experimental conditions.
Mice
C57BL/6J (Jax 664), Rag1−/− (Jax 2216), Thy1-YFP-H (Jax 3782) and BALB/c (Jax 651) mice were purchased from The Jackson Laboratory and bred in-house. Male mice were used at 7–16 weeks of age. In individual experiments, all animals were age-matched. All mice were maintained under specific pathogen-free (SPF) conditions on a 12-hour light/dark cycle, and provided food and water ad libitum. Germ-free C57BL/6 mice and gnotobiotic mice were maintained at Weill Cornell Medical College, New York. All mouse experiments were approved by, and performed in accordance with, the Institutional Animal Care and Use Committee guidelines at Weill Cornell Medicine.
Antibiotic treatment
Mice were provided autoclaved drinking water supplemented with a cocktail of broad-spectrum antibiotics as previously described15: ampicillin (0.5 mg/mL, Santa Cruz), gentamicin (0.5 mg/mL, Gemini Bio-Products), metronidazole (0.5 mg/mL Sigma), neomycin (0.5 mg/mL, Sigma), vancomycin (0.25 mg/mL, Chem-Impex International), and saccharin (4 mg/mL, Sweet’N Low, Cumberland Packing Corp.). Sweet’N Low was added to make the antibiotic cocktail more palatable. Antibiotic treatment was started 2 weeks prior to the experiments and continued for the duration of the experiments. Following ABX treatment mice exhibited no significant differences in weight gain, food or water intake (measured by Promethion metabolic cages) and perception of pain43.
Fear conditioning and extinction assays
Fear conditioning and extinction assays were performed as previously described16,17. For fear conditioning, mice were placed in shock-chambers (Coulbourn Instruments), which were scented with 0.1% peppermint in 70% EtOH. After 2 mins of habituation, mice were fear conditioned with 3 tone-shock pairings consisting of a 30 second (5 kHz, 70 dB) tone (CS) that co-terminated with a 1 second (0.7 mA) foot shock (US). Intertrial intervals (ITIs) between each tone-shock pairing were 30 seconds. After the final tone-shock pairing, mice remained in the conditioning chambers for 1 min before being returned to their home cages.
For the classical 3-day/session fear extinction, 24 hours after fear conditioning, mice were placed in extinction chambers (different shape from the conditioning chambers), which were scented with 0.1% lemon in 70% EtOH. After 2 mins of habituation, mice were exposed to 5 presentations of the tone (CS) in the absence of the shock (US). Each tone lasted for 30 seconds with an ITI of 30 seconds. After the final tone presentation, mice remained in the extinction chambers for 1 min before being returned to their home cages. Fear extinction sessions were repeated daily for three days.
For single-session 30-tone fear extinction, 20 mins after fear conditioning, mice were placed in extinction chambers. After 2 mins of habituation, mice were exposed to 30 presentations of the tone (CS) in the absence of the shock (US). Each tone lasted for 30 seconds with an ITI of 30 seconds. Extinction trials were binned into early and late sessions, with the early session representing the average of trials 1–15, and late trials representing the average of trials 16–30.
Experiments were controlled by Graphic State software (Coulbourn instruments). Mice were video recorded for subsequent analysis.
Fear behavior
Mouse freezing behavior was scored automatically using previously validated MATLAB code for automated phenotyping of mouse behavior44. Percent time spent freezing [Freezing (%)] was calculated by dividing the amount of time spent freezing during the 30-second tone presentations by the duration of the tone.
Immunofluorescence staining
Brain sections were prepared and stained for c-Fos, synaptophysin or PSD-95 expression as previously described45. All steps were carried out at room temperature unless otherwise specified. 90 minutes after fear extinction session 3, mice were anesthetized by intraperitoneal injection of Euthasol and perfused with PBS followed by 4% paraformaldehyde. Brains were harvested, fixed in 4% paraformaldehyde overnight, and dehydrated in 30% sucrose at 4 °C. Coronal sections (40 μm) were cut by using sliding microtome frozen by powdered dry ice. 6 sets of serial sections were collected in Eppendorf tubes each containing 2 mL cryoprotectant (30% glycerol and 30% ethylene glycol in 0.1 M sodium phosphate, pH 7.4) and stored at −20 °C. Free-floating serial sections (take one every third) were washed in TBS, incubated for 30 min in blocking buffer (4% normal horse serum, 1% BSA and 0.2% Triton X-100 in TBS) and incubated overnight at 4 °C with rabbit anti-c-Fos primary antibody (sc-52, Santa Cruz), or mouse anti-synaptophysin (SAB4200544, Sigma-Aldrich) or PSD-95 (7E3–1B8, Sigma-Aldrich) diluted 1:1,000 in the blocking buffer. Sections were then washed in TBS and incubated for 2 hours with Alexa Fluor 555-labelled donkey anti-rabbit or anti-mouse antibody (Invitrogen) diluted 1:500 in TBS with 0.2% Triton X-100. Sections were again washed, mounted on chromalum/gelatin-coated slides and air-dried for 2 hours in dark. Slides were cover-slipped by water-soluble glycerol-based mounting medium containing DAPI and sealed with nail polish.
Estimation of cell densities of c-Fos+ neurons in BLA and IL was performed with StereoInvestigator 9.0 (MicroBrightField). Briefly, serial sections (every third section, 120 μm) were numbered by rostra-caudal order, and contours of BLA and IL were traced by referring to the Allen Brain Atlas (Allen Institute). All cells across all sections per animal were counted. Individual cell density was calculated for each mouse by dividing the total sampled cell numbers by the total volume of the region.
For synaptophysin and PSD-95 images, confocal microscopy was performed with a Zeiss LSM 880 Laser Scanning Confocal Microscope using 63X oil immersion lens. Images were acquired with 2X digital zoom. Image stacks were 5 μm in thickness with z-step size of 0.5 μm, and were analyzed using the ImageJ software (http://rsbweb.nih.gov/ij/).
Intracranial window implantation
Mice were anesthetized by isoflurane (induction, 5%; maintenance, 1%−2%) and administered dexamethasone (1 mg/kg, i.p.) to reduce brain swelling and metacam (2 mg/kg, i.p.) as a prophylactic analgesic. Scalp fur was trimmed, and the skull surface was exposed with a midline scalp incision. Bupivicaine (0.05 mL, 5 mg/ml) was administered topically as a second prophylactic analgesic. A circular titanium head plate was positioned over the region to be imaged (1.7 mm anterior to the bregma suture and centered over the midline) using dental cement (Metabond). A high-speed dental drill (Model EXL-M40, Osada Inc) and 0.5 mm burr were used to open a small (~4 mm) craniotomy. A 3 mm round coverslip (Warner Instruments) was lowered through the craniotomy to rest on top of the brain using a digital micromanipulator. The window was then fixed to the skull using veterinary adhesives (first Vetbond, then Metabond).
Viral injection
AAV5/hSyn/GCaMP6s was obtained from the UPenn Vector Core. Viral injection surgeries were performed with mice (8–10 weeks of age) under isoflurane anesthesia (induction, 5%; maintenance, 1%−2%) with regular monitoring for stable respiratory rate and absent tail pinch response. The scalp was shaved, and mice were fixed in a stereotactic frame (Kopf Instruments) with non-rupturing ear bars. A heating pad was used to prevent hypothermia. A midline incision was made to expose the skull and bupivacaine was applied onto the skull for local anesthesia. Virus injections (1000 nL) were delivered with a 10 μL Hamilton syringe and 33-gauge beveled needle, injected at 100 nL/min using an injection pump (World Precision Instruments). Injection coordinates relative to Bregma were: 1.7 mm anterior, 0.4 mm lateral, and 1.3 mm ventral. Following injection, the injection needle was held at the injection site for 2 mins then slowly withdrawn. The skin was then closed by Vetbond (3M Company) and the mice recovered on a heating pad before being returned to their home cages.
Transcranial two-photon imaging
Dendritic spine imaging was conducted as previously described46. Briefly, image stacks of dendritic segments were acquired using a two-photon laser scanning microscope (Olympus RS) equipped with a scanning galvanometer and a Spectra-Physics Mai Tai DeepSee laser tuned to 920 nm, and a 25X, long working distance water-immersion microscope objective (NA = 1.05, Olympus). Fluorescence was detected through gallium arsenide phosphide (GaAsP) photomultiplier tubes (PMTs) using the Fluoview acquisition software (Olympus), and images were collected in the green channel using an F30FGR bandpass filter (Semrock). All imaging experiments began by obtaining a low-magnification z stack (no digital zoom) to aid in relocating the same sites repeatedly over time, in conjunction with vascular landmarks and the contours of the prism. For spine imaging experiments, we acquired z stacks (512 × 512 pixels, 2-μs pixel dwell time, 0.75–1 μm step size) with 3X digital zoom through up to 250 μm of tissue in z. Spine imaging experiments occurred under KX anesthesia (ketamine 100 mg/mL and xylazine 10 mg/mL, at dosages of 0.1 mL/10 g body weight). For calcium imaging experiments, we acquired time-lapse images (512 × 512 pixels, 3 frames per second, ~1,450 frames,) spanning an area of mPFC measuring approximately 508 μm by 508 μm. All calcium imaging experiments occurred in awake mice. For repeated imaging over intervals of days, the procedure above was repeated, and the region to be imaged was identified by referring to vascular landmarks and the contours of the cranial window.
Spine imaging analysis
Spine remodeling dynamics were quantified as previously described46. Image stacks were analyzed using the ImageJ software (http://rsbweb.nih.gov/ij/). Raters blinded to experimental condition compared pairs of images of the same dendritic segment and identified stable spines (present in image 1 and 2), eliminated spines (present in image 1 but not in image 2) and formed spines (present in image 2 but not in image 1), each quantified as a percent of the total number of spines identified in the initial image. Filopodia were defined as dendritic protrusions with a length exceeding three times their maximum width and were excluded from spine remodeling analyses.
Calcium imaging analysis
Preprocessing. We used standard, validated procedures for preprocessing and analyzing calcium imaging time series data. X-Y motion artifacts were corrected using the ImageJ plugin “Image Stabilizer” created by Kang Li and Steven Kang from Carnegie Mellon University, available for download online (https://www.cs.cmu.edu/~kangli/code/Image_Stabilizer.html). Image time series were segmented into individual cells using custom MATLAB scripts based on an established sorting algorithm combining independent components analysis and image segmentation based on threshold intensity, variance, and skewness in the x-y motion corrected data set47–49. Image segmentation results were manually inspected for quality control. Fluorescence signal time series (ΔF/F: change in fluorescence divided by baseline fluorescence) were calculated for each individual neuronal segment: a 40-s sliding window was used to calculate the baseline fluorescence for each cell, accounting for both differences in GCaMP expression and de-trending for slow time-scale changes in fluorescence48. Analysis. First, we tested for cells exhibiting tone-sensitive activity, using repeated measures ANOVA to identify cells with a statistically significant increase (Fig. 4f) or decrease (Fig. 4d) in activity during tone presentations, compared to their activity during a two-minute pre-tone baseline period. To estimate statistical significance while accounting for autocorrelation in calcium transient time series and correcting for multiple comparisons, we repeated this analysis 10,000 times for each cell after shuffling the timing of the baseline period and the timing of the tone onsets and selected a P value threshold to limit the false discovery rate to less than 5%. Next, to test for group (ABX vs. Ctrl) effects on activity in each of these cell populations (Figs. 4e, g), we used a 2-factor (time, group) repeated measures ANOVA and post-hoc linear contrasts to test for between-group differences in activity during each task epoch (baseline, tone on, tone off). Finally, to test for cells that also encoded the precise timing of the tones, exhibiting tone-locked activity that increased or decreased in response to the onset of each tone, we used a procedure analogous to the one described above, using repeated measures ANOVA to test for changes in activity in the tone on vs. tone off epochs; estimating statistical significance in shuffled data as above; and testing for group effects on activity using a 2-factor (time, group) repeated measures ANOVA (Figs. 4h, i).
RNA sequencing
Mouse mPFC was dissected by referring to the Allen Brain Atlas. Coordinates relative to bregma are: 1.3 to 2.8 mm anterior, −1 to 1 mm lateral, and 0 to 1 mm ventral. RNA was extracted using Trizol (Invitrogen) and chloroform and further purified using the RNAeasy mini spin columns (Qiagen). RNA-seq libraries were prepared and sequenced by the Epigenomics Core at Weill Cornell Medicine on an Illumina HiSeq 2500, producing 50 bp single-end reads. Sequenced reads were demultiplexed using CASAVA v1.8.2 and adapters trimmed using FLEXBAR v2.450.
RNA-seq analysis
Sequenced reads were aligned to the mouse genome GRCm38/mm10 using STAR v2.3.051. Reads counts at the gene level were calculated using Rsubread52. Normalization for library size and differential expression analysis were performed using DESeq253 v1.18. Only genes with at least 10 raw reads in each sample were tested for differential expression. Nonparametric multivariate analysis of variance (PERMANOVA)54 was used to test whether antibiotics treatment accounted for a significant portion of the variance in gene expression post fear extinction. Specifically, expression of the 500 genes with the highest variance (after applying the variance stabilization transformation of DESeq253) was analyzed using the adonis function of the vegan R package (https://CRAN.R-project.org/package=vegan) using the Euclidean metric and 20,000 permutations. Differentially expressed genes were used for Gene Ontology (GO) enrichment analysis (http://www.pantherdb.org/)55, Kyoto Encyclopedia of Genes and Genomes (KEGG) analysis (https://www.genome.jp/kegg)56 and Search Tool for Recurring Instances of Neighbouring Genes (STRING) analysis (https://string-db.org/)57.
Brain-resident immune cell isolation and flow cytometry
Brain-resident immune cells were isolated using Percoll gradients58. Mice were anesthetized and perfused with ice-cold HBSS. Brains were harvested, homogenized, resuspended with 30% Percoll, and layered on top of 70% Percoll. After centrifugation (500 x g, 30 min), immune cells gathered in the 30%−70% interphase.
For flow cytometric analyses, cells were washed, incubated with purified anti-mouse CD16/CD32 (clone 93, Biolegend) to block the Fc receptors, and then stained with anti-CD45 (clone 30-F11, Biolegend), anti-CD4 (clone RM4–5, eBioscience), anti-CD8a (clone 53–6.7, BD Biosciences), anti-CD19 (clone 1D3, eBioscience), anti-CD11b (clone M1/70, eBioscience), anti-CD11c (clone N418, eBioscience), anti-F4/80 (clone BM8, eBioscience), anti-Ly6G (clone 1A8-Ly6g, eBioscience), anti-Ly6C (clone HK1.4, eBioscience) and anti-CSF1R (clone AFS98, eBioscience). Data were collected on a LSRFortessa cytometer (BD Biosciences) and analyzed with FlowJo software (Tree Star Inc.). Dead cells were excluded from analyses based on LIVE/DEAD™ Fixable Aqua dead cell staining (Invitrogen). Non-singlet events were excluded from analyses based on the side scatter height (SSC-H) versus side scatter width (SSC-W), and then the forward scatter height (FSC-H) versus forward scatter width (FSC-W) characteristics.
Microbial colonization
For ex-GF mice colonized when they were adults (ex-GF_adult), dirty bedding from SPF mice were added into GF cages of 8 weeks old GF mice two weeks before the fear conditioning and extinction assay. For ex-GF mice colonized when they were weaned (ex-GF_weaning), 3 weeks old GF mice were co-housed with 3 weeks old SPF mice until 8 weeks old and subjected to the fear conditioning and extinction assay.
Fostering of pups
C57BL/6 GF and Ctrl SPF new born pups were fostered by BALB/c mothers until weaning.
16S qPCR
DNA was isolated from fecal samples of Ctrl and ABX mice using the DNeasy PowerSoil kit (Qiagen). Equal amounts of purified fecal DNA (4ng per reaction) were added to qPCR reactions with universal 16S primers using SYBR green chemistry (UniF340: 5’-ACTCCTACGGGAGGCAGCAGT-3’; UniR514: 5’-ATTACCGCGGCTGCTGGC-3’). 16S DNA levels in each sample were normalized to the average of the Ctrl mice group.
16S amplicon sequencing and analysis
16S rRNA gene sequencing methods were adapted from the methods developed for the NIH-Human Microbiome Project (https://hmpdacc.org/). Briefly, bacterial genomic DNA was extracted using MO BIO PowerSoil DNA Isolation Kit (MO BIO Laboratories). The 16S rDNA V4 region was amplified by PCR and sequenced in the MiSeq platform (Illumina) using the 2×250 bp paired-end protocol. Raw reads were processed and clustered into operational taxonomic units (OTUs) using USEARCH version 1159. Specifically, reads were demultiplexed and read pairs merged, with a maximum of 5 mismatching bases in the overlap region, as well as a minimum sequence agreement of 80%. PhiX contaminant sequences were removed, and merged sequences were filtered according to FASTQ quality scores using a maximum expected error number of 0.1. Filtered sequences were clustered into OTUs at a 97% identity threshold using the USEARCH cluster_otus command with default settings. Merged reads (unfiltered) were mapped to the OTU representative sequences, generating an OTU table. Taxonomic classification of OTU representative sequences was performed with the USEARCH SINTAX command with a confidence score of 0.8, using version 16 of the RDP 16S training set60. Diversity estimation and PCoA ordination were performed using the phyloseq R package61 after subsampling the OTU table to even depth.
Single nucleus RNA-seq
Nuclei were extracted from four frozen mPFC samples (two from ABX mice, two from Ctrl mice) with a glass dounce tissue grinder set (Millipore Sigma #D8938) and Nuclei EZ Prep (Millipore Sigma #NUC101–1kt). Each sample was dounced with pestles A and B (24x each) in 2 mL of EZ prep buffer, washed with 5 mL EZ prep, and resuspended in 1 mL resuspension buffer (1x PBS, 0.1% BSA, 25U/mL recombinant RNase inhibitor, Takara 2313B). Single nucleus suspensions were strained through a 35 μm cell strainer (Corning 352235), visually inspected under a microscope, and loaded onto 3’ library chips as per the manufacturer’s protocol for the Chromium Single Cell 3’ Library & Gel Bead kit (v3) (10X Genomics 1000092). For each sample, an input of 11,000 nuclei was added to each channel. Libraries were sequenced at a mean depth of 21,714 reads per nucleus on a HiSeqX.
Single nucleus RNA-seq data processing
Demultiplexed FASTQ files were generated using Cell Ranger v2.0. Reads were aligned to the mm10 mouse transcriptome containing pre-mRNA annotations, similarly to previously described62, to generate raw gene expression matrices (nuclei by genes). Expression matrices across all four samples were merged and loaded into Scanpy (version 1.4.0)63. Genes found in less than 3 nuclei were filtered out. Nuclei were filtered out using the following criteria: less than 600 genes (likely empty droplets), more than 5,000 genes (likely doublets), >2% of reads mapping to mitochondrial genes, >0.1% of reads mapping to caspase genes to remove apoptotic cells. The resulting filtered matrix consisted of 38,649 nuclei and 22,451 genes. The filtered gene expression matrix was normalized within each nucleus, resulting in a filtered, nuclei-normalized matrix X, then log-normalized by calculating ln(X+1). Before selecting variable genes, we masked genes that either contain highly repetitive regions in intronic regions that result in inflated read counts (PISD, Mylip, Gm17660) or highly expressed lncRNAs that affect within-nuclei normalization (Gm28928, Malat1). We selected 1,535 highly variable genes using the highly_variable_genes module in scanpy (min_mean=0.1, max_mean=3, min_disp=0.8) for clustering analysis.
snRNA-seq data clustering
We first regressed out the number of UMIs and the number of genes. Each gene was then scaled to unit variance. We then conducted dimensionality reduction via principal component analysis (PCA) using the ARPACK SVD solver in scanpy, computed the k-nearest neighbor (k-NN) graph with PCs 1 to 40 and k=30 nearest neighbors. Clusters were determined with unsupervised clustering using the Louvain algorithm64,65 and resulted in 24 clusters. Differential expression analysis was conducted to find the top 100 genes enriched in each cluster with the rank_genes_groups module in scanpy using logistic regression66. We annotated clusters post hoc based on known marker genes67,68 among the top 100 enriched genes. For visualization, we embedded the profiles with UMAP (uniform manifold approximation and projection69).
Cell-type specific differential expression analysis
To find differentially expressed genes (DEGs) between ABX vs. Ctrl mice for each cluster, we used statsmodels in python to implement a mixed linear model for each cluster c. Specifically, we used the regression Yi,c ~ T + N + (1|B), where Yi,c is the ln(X+1) expression vector for gene i across all nuclei in cluster c, T is a binary variable reflecting membership of the nucleus in either ABX or Ctrl sample, N is the number of genes detected in each nucleus, and B is a categorical variable denoting the 10x channel used for each sample to control for batch effects. We used a Bonferroni-corrected p-value of 10−7 as the cutoff for significance. For plotting, we used DEGs that had a minimum log2(fold change) of 0.31 (absolute fold change of 1.24) in either direction, and independently found to be significant in at least two clusters. To rank clusters based on the number of DEGs (Extended Data Fig. 5b), we first randomly sampled 500 nuclei with replacement from each cluster to maintain comparable statistical power across clusters and re-ran the mixed linear model as described; all other plots and analyses, including GO enrichment, were based on the full list of DEGs obtained without downsampling.
Vagotomy
The following subdiaphragmatic vagotomies and pyloromyotomy procedure were modified from the procedures as previously described70. Mice were anesthetized via an IP injection of a Ketamine (144mg/kg)/Xylazine (13mg/kg) cocktail. A midline incision was made and the stomach was retracted inferiorly to expose the distal esophagus and the gastroesophageal junction. The anterior (left) and posterior (right) branches of the vagus nerve were identified running alongside the esophagus and severed distal to the hepatic branches. The stomach was then placed back into the anatomical position and a pyloromyotomy was performed using a bent 23 gauge needle. The superficial muscular layers were incised in a longitudinal fashion and closed transversely with 4–0 vicryl sutures. The peritoneum was then closed with a running 4–0 vicryl suture and the skin approximated with staples. Animals were allowed to recover from anesthesia under a heat lamp and returned to the colony room once awake and ambulating. For non-vagotomized mice, the vagus nerve was gently exposed without further manipulation. Animals were monitored for 7 days. The completeness of subdiaphragmatic vagotomy was verified by examining fluorescent label of the dorsal motor vagal nucleus (DMV) on brainstem sections one week after intraperitoneal injection of FluoroGold. No presence of fluorescent label in DMV neurons was accepted as a marker of complete vagotomy.
Mass spectrometry
High resolution LC−MS analysis was performed on a Dionex 3000 UPLC coupled with a Thermo Q-exactive high-resolution mass spectrometer equipped with a HESI ion source. Metabolites were separated using a water−acetonitrile gradient on a Agilent Zorbax Eclipse XDB-C18 column (150 mm × 2.1 mm, particle size 1.8 μm) maintained at 40 °C; solvent A: 0.1% formic acid in water; solvent B: 0.1% formic acid in acetonitrile. The A/B gradient started at 1% B for 1 min after injection and increased linearly to 100% B at 15 min, using a flow rate of 0.5 mL/min. Mass spectrometer parameters: spray voltage 2.9 kV, capillary temperature 320 °C, prober heater temperature 300 °C; sheath, auxiliary, and spare gas 70, 2, and 0 mL/min, respectively; S-lens RF level 55, resolution 140,000 at m/z 200, AGC target 1 × 10⁶. The instrument was calibrated weekly with positive and negative ion calibration solutions (Thermo-Fisher). Each sample was analyzed in negative and positive modes using a m/z range of 100 to 1500.
Feature detection, characterization and compound synthesis
LC−MS RAW files from triplicate fecal, serum and CSF samples from adult ex-GF fostered, Ctrl_fostered and GF mice were converted to mzXML (profile mode) using MSConvert (ProteoWizard), followed by analysis using a customized XCMS R-script based on the centWave XCMS algorithm to extract features38. Resulting tables of all detected features were used to compute ex-GF fostered mice vs. GF mice and Ctrl_fostered mice vs. GF mice peak area ratios. To select differential features, we applied a filter retaining entries with peak area ratios larger than 2 (down in GF mice) or smaller than 0.5 (up in GF mice). We manually curated the resulting list to remove false positive entries, i.e., features that upon manual inspection of raw data were not differential. For the features that were verified to be differential, we examined elution profiles, isotope patterns, and MS1 spectra to find molecular ions and remove adducts, fragments, and isotope peaks.
The structures of the four differential compounds were confirmed by coinjection with synthesized or commercial samples. Phenyl sulfate and indoxyl sulfate were purchased from TCI America and Sigma-Aldrich, respectively. Pyrocatechol sulfate and 3-(3-sulfooxyphenyl)propanoic acid were prepared following a previously published procedure71. To a stirred solution of catechol (Sigma-Aldrich, 0.55 g, 5 mmol) or 3-(4-hydroxyphenyl)propionic acid (Sigma-Aldrich, 0.88 g 5 mmol) in dry pyridine (2.5 mL), sulfur trioxide pyridine complex (0.88 g, 6 mmol) was added at room temperature. The resulting mixtures were heated in an oil bath at 45 °C and stirred for 2 hours. The reactions were then allowed to cool to ambient temperature and transferred separately to flasks each containing 25 mL of 1N KOH cooled in an ice bath. To each of the aqueous mixtures was added 100 mL of 2-propanol and the two reactions were left at 4 °C for 16 hours. At this point, the products were filtered off as white precipitates. The crude products were taken up in 50 mL (3:1 ethanol:water) and heated to reflux, hot filtered, and placed in the fridge for recrystallization. This last step was then repeated. Totals of 210 and 270 mg of pyrocatechol sulfate and 3-(3-sulfooxyphenyl)propanoic acid were obtained, corresponding to yields of ~20%.
Statistical analysis
Statistical tests were performed with Prism (GraphPad). Unless specifically indicated otherwise, Student’s t tests were used to compare end-point means of different groups. Error bars depict the SEM.
Data availability
RNA-seq data, 16S rRNA-seq data and single nucleus RNA-seq data are available at Gene Expression Omnibus and BioProject under accession number GSE134808, PRJNA556230 and GSE135326, respectively. All datasets generated and/or analysed during the current study are presented in this published article, the accompanying Source Data or Supplementary Information, or are available from the corresponding author upon reasonable request.
Code availability
The algorithm used for automated scoring of freezing behavior is available at https://www.seas.upenn.edu/~molneuro/autotyping.html. The algorithm used for motion artifact correction in 2P calcium imaging data is available at http://www.cs.cmu.edu/~kangli/code/Image_Stabilizer.html. All other analysis code is available from the corresponding author upon reasonable request.
Extended Data
Extended Data Figure 1. Antibiotic treatment results in bacterial community restructuring.
a-c, Food intake (a), water intake (b) and weight gain (c) of the mice measured by the Promethion Metabolic Cage System. Antibiotic treatment was started 2 weeks prior to the experiment and continued for the duration of the experiment. For food (a) and water intake (b), the mice were acclimated to the system for the first 4 days followed by 1 day of data collection. Body mass (c) of the mice were measured at the beginning of (Start) and the end (End) of the 5-day experiment. n = 4/group. Data are mean ± SEM. Total, full day. Light/Dark, 12-hour light/dark cycle. d, 16S rDNA gene copies as quantified by real-time RT-PCR from stool pellets collected from Ctrl or ABX mice. Data are pooled from two independent experiments. n = 7/group. Data are mean ± SEM. Unpaired two-sided t tests were used. e-g, Principal coordinates analysis (PCoA) (e), alpha-diversity Shannon index (f) and taxonomic classification (g) of 16S rDNA in stool pellets collected from Ctrl or ABX mice. Ctrl n = 4, ABX n = 5. For PCoA plot PERMANOVA: F = 33.579, Df = 1, P = 0.00804. For phylogenetic classification ‘f_’, ‘g_’, ‘uncl_c_’, ‘uncl_d_’ and ‘uncl_o_’ stand for ‘family_’, ‘genus_’, ‘unclassified_class_’, ‘unclassified_domain_’ and ‘unclassified_order_’, respectively. ‘uncl_d_Bacteria’ matches exactly to mitochondria or chloroplasts, most likely from the food. Data are mean ± SEM in f.
Extended Data Figure 2. Antibiotic-treated mice retain deficits in extinction learning after vagotomy.
Fear extinction in Ctrl_Sham, ABX_Sham and ABX_Vx mice over the course of 3 days/sessions. Ctrl_Sham n = 10, ABX_Sham n = 10, ABX_Vx n = 12. Data are mean ± SEM. The AUC was calculated for each mouse within each group, followed by unpaired two-sided t test between groups. P values are as follows: i = 2.57E-07, ii = 9.21E-08. Vx, vagotomized.
Extended Data Figure 3. Comparable percentages and numbers of CD45high leukocytes in the brain of Control and ABX/GF mice.
a, Gating strategy of T cells, B cells, dendritic cells (DCs) and macrophages (Mφ) in the brain. b, Population frequencies and numbers of brain-resident CD45high leukocytes in Ctrl and ABX mice. c-d, Population frequencies of CD4+ T cells, CD8+ T cells, CD19+ B cells (c), CD11c+ DCs and F4/80+ macrophages (d) gated on brain-resident CD45high leukocytes in Ctrl and ABX mice. e, Population frequencies and numbers of brain-resident CD45high leukocytes in Ctrl and GF mice. f-g, Population frequencies of CD4+ T cells, CD8+ T cells, CD19+ B cells (f), CD11c+ DCs and F4/80+ macrophages (g) gated on brain-resident CD45high leukocytes in Ctrl and GF mice. h, Gating strategy of total myeloid cells and Ly6Chi monocytes in the brain. i,j, Population frequencies of total myeloid cells and Ly6Chi monocytes gated on brain-resident CD45high leukocytes in Ctrl and ABX (i) or GF (j) mice. Data in b, c, g and j are representative of three independent experiments. n = 4/group. Data in d and i are pooled from two independent experiments. n = 8/group. Data in e and f are pooled from two independent experiments. n = 6/group. Data are mean ± SEM. Unpaired two-sided t tests were used. P values are indicated on the figure. k, Fear extinction of Ctrl, GF and Rag1−/− mice in the single-session 30-tone fear extinction assay. Data are pooled from two independent experiments. Ctrl n = 18, GF n = 16, Rag1−/− n = 18. Data are mean ± SEM. The AUC was calculated for each mouse within each group followed by one-way ANOVA with Tukey’s multiple comparisons test. F (2, 49) = 8.558. P = 0.0006. Adjusted P values are as follows: i = 0.0343, ii = 0.0004. l, Fear extinction of SPF-Rag1−/− and GF-Rag1−/− mice in the single-session 30-tone fear extinction assay. n = 7/group. Data are mean ± SEM. The AUC was calculated for each mouse within each group followed by unpaired two-sided t test between groups. P value is indicated on the figure.
Extended Data Figure 4. Comparable transcriptomes of mPFCs dissected from Control and ABX mice in the absence of fear conditioning and extinction.
a, Principle component analysis (PCA) of genome-wide transcriptional profiles of mouse mPFC in the absence of fear conditioning and extinction. Ctrl n = 3, ABX n = 4. PERMANOVA test was used: F = 2.52, Df = 1, P = 0.17. b, Volcano plot of differential expression between Ctrl (negative log2(fold change (FC))) and ABX (positive log2(FC)) groups. Differentially expressed genes (defined as False Discovery Rate (FDR) < 0.1, DESeq2 Wald test) are shown in red. c-f, Immunofluorescence staining of c-Fos (red) (c,e) and the density of c-Fos+ neurons (d,f) in the BLA (c,d) or IL (e,f) of Ctrl and GF mice 90 min after classical fear extinction session 3. Data are pooled from two independent experiments. n = 6/group. Data are mean ± SEM. Unpaired two-sided t tests were used. P values are indicated on the figure. BLA, basolateral amygdala; PL, prelimbic; IL, infralimbic. Scale bar, 200 μm.
Extended Data Figure 5. Gene expression patterns of individual cell subsets in mPFC.
a, Proportion of expressing cells (dot size) and mean normalized expression of representative marker genes (columns) associated with the cell clusters of Fig. 2a (rows). Clusters are labeled with post facto annotation based on known marker genes. Ambiguous clusters expressing multiple canonical markers across cell types are annotated with both, e.g. exPFC/Astrocyte, and is likely due to doublets. b, Number of significantly differentially expressed genes (z-test calculated on coefficients of mixed linear model, Bonferroni-corrected P<10−7) by cluster after downsampling, ranked by highest to lowest (clusters of doublets and undetermined annotations not included). exPFC = glutamatergic excitatory neurons from the PFC, GABA = GABAergic interneurons, OPC = oligodendrocyte progenitor cells, MO = myelinating oligodendrocyte.
Extended Data Figure 6. Differential gene expression between Control and ABX groups in individual clusters of mPFC.
Differential expression of ABX versus Ctrl (log2(fold change), x axis) in each cluster in Fig. 2a and the associated significance (-log10(P-value), y axis; linear regression, Methods). Blue: genes significantly differentially expressed (z-test calculated on coefficients of mixed linear model, Bonferroni-corrected P<10−7). exPFC = glutamatergic excitatory neurons from the PFC, GABA = GABAergic interneurons, OPC = oligodendrocyte progenitor cells, MO = myelinating oligodendrocyte.
Extended Data Figure 7. Differentially expressed genes of ABX vs. Control mPFC samples shared by all excitatory neuronal subsets.
Mean fold change in expression in excitatory neurons (columns) in Fig. 2a of genes (rows) that were significantly differentially expressed (z-test calculated on coefficients of mixed linear model, Bonferroni-corrected P<10−7) in at least 2 of these clusters, and with absolute(log2fc) >= 0.31 in at least one cluster.
Extended Data Figure 8. Differentially expressed genes of ABX versus Control mPFC samples shared by multiple cell types.
Mean fold change in expression across all cell clusters (columns) in Fig. 2a of genes (rows) that were significantly differentially expressed (z-test calculated on coefficients of mixed linear model, Bonferroni-corrected P<10−7) in at least 4 clusters, and with absolute(log2fc) >= 0.31 in at least one cluster.
Extended Data Figure 9. Microglia in GF and ABX mice exhibit a developmentally immature phenotype.
a, Population frequencies and numbers of microglia in Ctrl and GF mice. b, Representative flow cytometry histogram and mean fluorescence intensity (MFI) of F4/80 staining on microglia from Ctrl and GF mice. c, Representative flow cytometry plots and population frequencies of CSF1R+ microglia in Ctrl and GF mice. d, Representative flow cytometry histogram and MFI of CSF1R expression gated on CSF1R+ microglia from Ctrl and GF mice. Data in a-d are representative of three independent experiments. n = 4/group. e, Population frequencies and numbers of microglia in Ctrl and ABX mice. f, Representative flow cytometry histogram and MFI of F4/80 staining on microglia from Ctrl and ABX mice. g, Representative flow cytometry plots and population frequencies of CSF1R+ microglia in Ctrl and ABX mice. h, Representative flow cytometry histogram and MFI of CSF1R expression gated on CSF1R+ microglia from Ctrl and ABX mice. Data in e are pooled from two independent experiments. n = 8/group. Data in f-h are representative of two independent experiments. n = 4/group. Data are mean ± SEM. Unpaired two-sided t tests were used. P values are indicated on the figure.
Extended Data Figure 10. Downregulation of the metabolites in GF mice.
a, ELISA quantification of plasma corticosterone in Ctrl and ABX mice. Data are pooled from three independent experiments. Ctrl n=12. ABX n = 11. b, ELISA quantification of plasma corticosterone in Ctrl and GF mice. Data are pooled from three independent experiments. Ctrl n = 12. GF n = 11. Data are mean ± SEM. c, Structures of phenyl sulfate, pyrocatechol sulfate, 3-(3-sulfooxyphenyl)propanoic acid and indoxyl sulfate. d, Relative abundances of phenyl sulfate, pyrocatechol sulfate, 3-(3-sulfooxyphenyl)propanoic acid and indoxyl sulfate in fecal samples from Ctrl_fostered, GF and ex-GF_fostered mice as determined by LC-MS. n = 3/group. e, Relative abundances of phenyl sulfate, pyrocatechol sulfate, 3-(3-sulfooxyphenyl)propanoic acid and indoxyl sulfate in cerebrospinal fluid (CSF) samples from Ctrl and GF mice as determined by LC-MS. Data are representative of two independent experiments n = 8/group. Data are mean ± SEM. Unpaired two-sided t tests were used. P values are indicated on the figure. f, A schematic representation of the microbiota-gut-brain axis in fear extinction learning. Our data inform a model whereby alterations in the microbiota and their metabolites influence neuronal function and learning-related plasticity, which may be due to altered microglia-mediated synaptic pruning, and subsequently regulate fear extinction behavior.
Supplementary Material
Acknowledgements
We thank the members of the Artis lab and the Liston lab for discussion and critical reading of the manuscript, and thank G. Eraslan, S. Simmons, and C. Smillie for helpful discussions on the snRNA-seq analyses. We also thank the Metabolic Phenotyping Center of Weill Cornell Medicine for technical advice and support. The summary cartoon (Extended Data Fig. 10f) was created with BioRender.com. This work was supported by the Jill Roberts Institute (to G.G.P.), JSPS Overseas Research Fellowships (to S.M.), the National Institute of General Medical Sciences (1R35GM118182–01, to K.J.T.), the National Institute of Allergy and Infectious Diseases (1P01AI102852–01A1, to K.J.T. and S.S.C.), the National Institutes of Health (NS052819, to F.S.L), the Rita Allen Foundation, the One Mind Institute, the Klingenstein-Simons Foundations, the Brain and Behavior Research Foundation, and the National Institutes of Mental Health (R01 MH109685, R01 MH118451) (all to C.L.), the National Institutes of Health (AI074878, AI095466, AI095608 and AI102942), the Burroughs Wellcome Fund, the Crohn’s and Colitis Foundation and the Rosanne H. Silbermann Foundation (all to D.A.). F.C.S. is a Faculty Scholar of the Howard Hughes Medical Institute. This work was supported by the Klarman Cell Observatory at the Broad Institute. A.R. is a Howard Hughes Medical Institute Investigator.
Footnotes
Competing interests
A.R. is an SAB member of ThermoFisher Scientific and Syros Pharmaceuticals and a co-founder and equity holder of Celsius Therapeutics. D.A. has contributed to scientific advisory boards at MedImmune, Pfizer, FARE, and the KRF. The other authors declare no competing interests.
References
- 1.Maren S Neurobiology of Pavlovian fear conditioning. Annu Rev Neurosci 24, 897–931, doi: 10.1146/annurev.neuro.24.1.897 (2001). [DOI] [PubMed] [Google Scholar]
- 2.VanElzakker MB, Dahlgren MK, Davis FC, Dubois S & Shin LM From Pavlov to PTSD: the extinction of conditioned fear in rodents, humans, and anxiety disorders. Neurobiol Learn Mem 113, 3–18, doi: 10.1016/j.nlm.2013.11.014 (2014). [DOI] [PMC free article] [PubMed] [Google Scholar]
- 3.Mielcarz DW & Kasper LH The gut microbiome in multiple sclerosis. Curr Treat Options Neurol 17, 344, doi: 10.1007/s11940-015-0344-7 (2015). [DOI] [PubMed] [Google Scholar]
- 4.Krajmalnik-Brown R, Lozupone C, Kang DW & Adams JB Gut bacteria in children with autism spectrum disorders: challenges and promise of studying how a complex community influences a complex disease. Microb Ecol Health Dis 26, 26914, doi: 10.3402/mehd.v26.26914 (2015). [DOI] [PMC free article] [PubMed] [Google Scholar]
- 5.Zheng P et al. Gut microbiome remodeling induces depressive-like behaviors through a pathway mediated by the host’s metabolism. Mol Psychiatry 21, 786–796, doi: 10.1038/mp.2016.44 (2016). [DOI] [PubMed] [Google Scholar]
- 6.Mohle L et al. Ly6C(hi) Monocytes Provide a Link between Antibiotic-Induced Changes in Gut Microbiota and Adult Hippocampal Neurogenesis. Cell Rep 15, 1945–1956, doi: 10.1016/j.celrep.2016.04.074 (2016). [DOI] [PubMed] [Google Scholar]
- 7.Hoban AE et al. Regulation of prefrontal cortex myelination by the microbiota. Transl Psychiatry 6, e774, doi: 10.1038/tp.2016.42 (2016). [DOI] [PMC free article] [PubMed] [Google Scholar]
- 8.Braniste V et al. The gut microbiota influences blood-brain barrier permeability in mice. Sci Transl Med 6, 263ra158, doi: 10.1126/scitranslmed.3009759 (2014). [DOI] [PMC free article] [PubMed] [Google Scholar]
- 9.Erny D et al. Host microbiota constantly control maturation and function of microglia in the CNS. Nat Neurosci 18, 965–977, doi: 10.1038/nn.4030 (2015). [DOI] [PMC free article] [PubMed] [Google Scholar]
- 10.Vuong HE, Yano JM, Fung TC & Hsiao EY The Microbiome and Host Behavior. Annu Rev Neurosci 40, 21–49, doi: 10.1146/annurev-neuro-072116-031347 (2017). [DOI] [PMC free article] [PubMed] [Google Scholar]
- 11.Hoban AE et al. The microbiome regulates amygdala-dependent fear recall. Mol Psychiatry, doi: 10.1038/mp.2017.100 (2017). [DOI] [PMC free article] [PubMed] [Google Scholar]
- 12.Lu J et al. Microbiota influence the development of the brain and behaviors in C57BL/6J mice. PLoS One 13, e0201829, doi: 10.1371/journal.pone.0201829 (2018). [DOI] [PMC free article] [PubMed] [Google Scholar]
- 13.Arentsen T, Raith H, Qian Y, Forssberg H & Diaz Heijtz R Host microbiota modulates development of social preference in mice. Microb Ecol Health Dis 26, 29719, doi: 10.3402/mehd.v26.29719 (2015). [DOI] [PMC free article] [PubMed] [Google Scholar]
- 14.Desbonnet L, Clarke G, Shanahan F, Dinan TG & Cryan JF Microbiota is essential for social development in the mouse. Mol Psychiatry 19, 146–148, doi: 10.1038/mp.2013.65 (2014). [DOI] [PMC free article] [PubMed] [Google Scholar]
- 15.Hepworth MR et al. Immune tolerance. Group 3 innate lymphoid cells mediate intestinal selection of commensal bacteria-specific CD4(+) T cells. Science 348, 1031–1035, doi: 10.1126/science.aaa4812 (2015). [DOI] [PMC free article] [PubMed] [Google Scholar]
- 16.Pattwell SS et al. Altered fear learning across development in both mouse and human. Proc Natl Acad Sci U S A 109, 16318–16323, doi: 10.1073/pnas.1206834109 (2012). [DOI] [PMC free article] [PubMed] [Google Scholar]
- 17.Soliman F et al. A genetic variant BDNF polymorphism alters extinction learning in both mouse and human. Science 327, 863–866, doi: 10.1126/science.1181886 (2010). [DOI] [PMC free article] [PubMed] [Google Scholar]
- 18.Bravo JA et al. Ingestion of Lactobacillus strain regulates emotional behavior and central GABA receptor expression in a mouse via the vagus nerve. Proc Natl Acad Sci U S A 108, 16050–16055, doi: 10.1073/pnas.1102999108 (2011). [DOI] [PMC free article] [PubMed] [Google Scholar]
- 19.Sgritta M et al. Mechanisms Underlying Microbial-Mediated Changes in Social Behavior in Mouse Models of Autism Spectrum Disorder. Neuron 101, 246–259 e246, doi: 10.1016/j.neuron.2018.11.018 (2019). [DOI] [PMC free article] [PubMed] [Google Scholar]
- 20.Kipnis J, Cohen H, Cardon M, Ziv Y & Schwartz M T cell deficiency leads to cognitive dysfunction: implications for therapeutic vaccination for schizophrenia and other psychiatric conditions. Proc Natl Acad Sci U S A 101, 8180–8185, doi: 10.1073/pnas.0402268101 (2004). [DOI] [PMC free article] [PubMed] [Google Scholar]
- 21.Miyajima M et al. Metabolic shift induced by systemic activation of T cells in PD-1-deficient mice perturbs brain monoamines and emotional behavior. Nat Immunol 18, 1342–1352, doi: 10.1038/ni.3867 (2017). [DOI] [PubMed] [Google Scholar]
- 22.Filiano AJ et al. Unexpected role of interferon-gamma in regulating neuronal connectivity and social behaviour. Nature 535, 425–429, doi: 10.1038/nature18626 (2016). [DOI] [PMC free article] [PubMed] [Google Scholar]
- 23.Tovote P, Fadok JP & Luthi A Neuronal circuits for fear and anxiety. Nat Rev Neurosci 16, 317–331, doi: 10.1038/nrn3945 (2015). [DOI] [PubMed] [Google Scholar]
- 24.Dragunow M & Faull R The use of c-fos as a metabolic marker in neuronal pathway tracing. J Neurosci Methods 29, 261–265 (1989). [DOI] [PubMed] [Google Scholar]
- 25.Gale GD et al. Role of the basolateral amygdala in the storage of fear memories across the adult lifetime of rats. J Neurosci 24, 3810–3815, doi: 10.1523/JNEUROSCI.4100-03.2004 (2004). [DOI] [PMC free article] [PubMed] [Google Scholar]
- 26.Thion MS et al. Microbiome Influences Prenatal and Adult Microglia in a Sex-Specific Manner. Cell 172, 500–516 e516, doi: 10.1016/j.cell.2017.11.042 (2018). [DOI] [PMC free article] [PubMed] [Google Scholar]
- 27.Kierdorf K et al. Microglia emerge from erythromyeloid precursors via Pu.1- and Irf8-dependent pathways. Nat Neurosci 16, 273–280, doi: 10.1038/nn.3318 (2013). [DOI] [PubMed] [Google Scholar]
- 28.Yuste R & Bonhoeffer T Morphological changes in dendritic spines associated with long-term synaptic plasticity. Annu Rev Neurosci 24, 1071–1089, doi: 10.1146/annurev.neuro.24.1.1071 (2001). [DOI] [PubMed] [Google Scholar]
- 29.Yuste R & Denk W Dendritic spines as basic functional units of neuronal integration. Nature 375, 682–684, doi: 10.1038/375682a0 (1995). [DOI] [PubMed] [Google Scholar]
- 30.Trachtenberg JT et al. Long-term in vivo imaging of experience-dependent synaptic plasticity in adult cortex. Nature 420, 788–794, doi: 10.1038/nature01273 (2002). [DOI] [PubMed] [Google Scholar]
- 31.Matsuzaki M, Honkura N, Ellis-Davies GC & Kasai H Structural basis of long-term potentiation in single dendritic spines. Nature 429, 761–766, doi: 10.1038/nature02617 (2004). [DOI] [PMC free article] [PubMed] [Google Scholar]
- 32.Lai CS, Franke TF & Gan WB Opposite effects of fear conditioning and extinction on dendritic spine remodelling. Nature 483, 87–91, doi: 10.1038/nature10792 (2012). [DOI] [PubMed] [Google Scholar]
- 33.Sudo N et al. Postnatal microbial colonization programs the hypothalamic-pituitary-adrenal system for stress response in mice. J Physiol 558, 263–275, doi: 10.1113/jphysiol.2004.063388 (2004). [DOI] [PMC free article] [PubMed] [Google Scholar]
- 34.Ivanov II et al. Induction of intestinal Th17 cells by segmented filamentous bacteria. Cell 139, 485–498, doi: 10.1016/j.cell.2009.09.033 (2009). [DOI] [PMC free article] [PubMed] [Google Scholar]
- 35.Atarashi K et al. Induction of colonic regulatory T cells by indigenous Clostridium species. Science 331, 337–341, doi: 10.1126/science.1198469 (2011). [DOI] [PMC free article] [PubMed] [Google Scholar]
- 36.Garrett WS et al. Enterobacteriaceae act in concert with the gut microbiota to induce spontaneous and maternally transmitted colitis. Cell Host Microbe 8, 292–300, doi: 10.1016/j.chom.2010.08.004 (2010). [DOI] [PMC free article] [PubMed] [Google Scholar]
- 37.Schaedler RW & Dubos RJ The fecal flora of various strains of mice. Its bearing on their susceptibility to endotoxin. J Exp Med 115, 1149–1160 (1962). [DOI] [PMC free article] [PubMed] [Google Scholar]
- 38.Tautenhahn R, Patti GJ, Rinehart D & Siuzdak G XCMS Online: a web-based platform to process untargeted metabolomic data. Anal Chem 84, 5035–5039, doi: 10.1021/ac300698c (2012). [DOI] [PMC free article] [PubMed] [Google Scholar]
- 39.Shaw W Increased urinary excretion of a 3-(3-hydroxyphenyl)-3-hydroxypropionic acid (HPHPA), an abnormal phenylalanine metabolite of Clostridia spp. in the gastrointestinal tract, in urine samples from patients with autism and schizophrenia. Nutr Neurosci 13, 135–143, doi: 10.1179/147683010X12611460763968 (2010). [DOI] [PubMed] [Google Scholar]
- 40.Kesli R, Gokcen C, Bulug U & Terzi Y Investigation of the relation between anaerobic bacteria genus clostridium and late-onset autism etiology in children. J Immunoassay Immunochem 35, 101–109, doi: 10.1080/15321819.2013.792834 (2014). [DOI] [PubMed] [Google Scholar]
- 41.Yeh YC et al. Indoxyl sulfate, not p-cresyl sulfate, is associated with cognitive impairment in early-stage chronic kidney disease. Neurotoxicology 53, 148–152, doi: 10.1016/j.neuro.2016.01.006 (2016). [DOI] [PubMed] [Google Scholar]
- 42.Hsiao EY et al. Microbiota modulate behavioral and physiological abnormalities associated with neurodevelopmental disorders. Cell 155, 1451–1463, doi: 10.1016/j.cell.2013.11.024 (2013). [DOI] [PMC free article] [PubMed] [Google Scholar]
- 43.Kang M et al. The effect of gut microbiome on tolerance to morphine mediated antinociception in mice. Sci Rep 7, 42658, doi: 10.1038/srep42658 (2017). [DOI] [PMC free article] [PubMed] [Google Scholar]
- 44.Patel TP et al. An open-source toolbox for automated phenotyping of mice in behavioral tasks. Front Behav Neurosci 8, 349, doi: 10.3389/fnbeh.2014.00349 (2014). [DOI] [PMC free article] [PubMed] [Google Scholar]
- 45.Dincheva I et al. FAAH genetic variation enhances fronto-amygdala function in mouse and human. Nat Commun 6, 6395, doi: 10.1038/ncomms7395 (2015). [DOI] [PMC free article] [PubMed] [Google Scholar]
- 46.Liston C et al. Circadian glucocorticoid oscillations promote learning-dependent synapse formation and maintenance. Nat Neurosci 16, 698–705, doi: 10.1038/nn.3387 (2013). [DOI] [PMC free article] [PubMed] [Google Scholar]
- 47.Mukamel EA, Nimmerjahn A & Schnitzer MJ Automated analysis of cellular signals from large-scale calcium imaging data. Neuron 63, 747–760, doi: 10.1016/j.neuron.2009.08.009 (2009). [DOI] [PMC free article] [PubMed] [Google Scholar]
- 48.Dombeck DA, Khabbaz AN, Collman F, Adelman TL & Tank DW Imaging large-scale neural activity with cellular resolution in awake, mobile mice. Neuron 56, 43–57, doi: 10.1016/j.neuron.2007.08.003 (2007). [DOI] [PMC free article] [PubMed] [Google Scholar]
- 49.Rajasethupathy P et al. Projections from neocortex mediate top-down control of memory retrieval. Nature 526, 653–659, doi: 10.1038/nature15389 (2015). [DOI] [PMC free article] [PubMed] [Google Scholar]
- 50.Dodt M, Roehr JT, Ahmed R & Dieterich C FLEXBAR-Flexible Barcode and Adapter Processing for Next-Generation Sequencing Platforms. Biology (Basel) 1, 895–905, doi: 10.3390/biology1030895 (2012). [DOI] [PMC free article] [PubMed] [Google Scholar]
- 51.Dobin A et al. STAR: ultrafast universal RNA-seq aligner. Bioinformatics 29, 15–21, doi: 10.1093/bioinformatics/bts635 (2013). [DOI] [PMC free article] [PubMed] [Google Scholar]
- 52.Liao Y, Smyth GK & Shi W The Subread aligner: fast, accurate and scalable read mapping by seed-and-vote. Nucleic Acids Res 41, e108, doi: 10.1093/nar/gkt214 (2013). [DOI] [PMC free article] [PubMed] [Google Scholar]
- 53.Love MI, Huber W & Anders S Moderated estimation of fold change and dispersion for RNA-seq data with DESeq2. Genome Biol 15, doi:ARTN 550 10.1186/s13059-014-0550-8 (2014). [DOI] [PMC free article] [PubMed] [Google Scholar]
- 54.Anderson MJ A new method for non-parametric multivariate analysis of variance. Austral Ecol 26, 32–46, doi: 10.1111/j.1442-9993.2001.01070.pp.x (2001). [DOI] [Google Scholar]
- 55.Mi H, Muruganujan A, Casagrande JT & Thomas PD Large-scale gene function analysis with the PANTHER classification system. Nat Protoc 8, 1551–1566, doi: 10.1038/nprot.2013.092 (2013). [DOI] [PMC free article] [PubMed] [Google Scholar]
- 56.Kanehisa M & Goto S KEGG: kyoto encyclopedia of genes and genomes. Nucleic Acids Res 28, 27–30, doi: 10.1093/nar/28.1.27 (2000). [DOI] [PMC free article] [PubMed] [Google Scholar]
- 57.Snel B, Lehmann G, Bork P & Huynen MA STRING: a web-server to retrieve and display the repeatedly occurring neighbourhood of a gene. Nucleic Acids Res 28, 3442–3444, doi: 10.1093/nar/28.18.3442 (2000). [DOI] [PMC free article] [PubMed] [Google Scholar]
- 58.Pino PA & Cardona AE Isolation of brain and spinal cord mononuclear cells using percoll gradients. J Vis Exp, doi: 10.3791/2348 (2011). [DOI] [PMC free article] [PubMed] [Google Scholar]
- 59.Edgar RC Search and clustering orders of magnitude faster than BLAST. Bioinformatics 26, 2460–2461, doi: 10.1093/bioinformatics/btq461 (2010). [DOI] [PubMed] [Google Scholar]
- 60.Cole JR et al. Ribosomal Database Project: data and tools for high throughput rRNA analysis. Nucleic Acids Res 42, D633–642, doi: 10.1093/nar/gkt1244 (2014). [DOI] [PMC free article] [PubMed] [Google Scholar]
- 61.McMurdie PJ & Holmes S phyloseq: an R package for reproducible interactive analysis and graphics of microbiome census data. PLoS One 8, e61217, doi: 10.1371/journal.pone.0061217 (2013). [DOI] [PMC free article] [PubMed] [Google Scholar]
- 62.Bakken TE et al. Single-nucleus and single-cell transcriptomes compared in matched cortical cell types. PLoS One 13, e0209648, doi: 10.1371/journal.pone.0209648 (2018). [DOI] [PMC free article] [PubMed] [Google Scholar]
- 63.Wolf FA, Angerer P & Theis FJ SCANPY: large-scale single-cell gene expression data analysis. Genome Biol 19, 15, doi: 10.1186/s13059-017-1382-0 (2018). [DOI] [PMC free article] [PubMed] [Google Scholar]
- 64.Blondel VD, Guillaume J-L, Lambiotte R & Lefebvre E Fast unfolding of communities in large networks. Journal of statistical mechanics: theory and experiment 2008, P10008 (2008). [Google Scholar]
- 65.Traag V Louvain. GitHub doi 10 (2017). [Google Scholar]
- 66.Ntranos V, Yi L, Melsted P & Pachter L Identification of transcriptional signatures for cell types from single-cell RNA-Seq. bioRxiv, 258566 (2018). [Google Scholar]
- 67.Zhang Y et al. An RNA-sequencing transcriptome and splicing database of glia, neurons, and vascular cells of the cerebral cortex. J Neurosci 34, 11929–11947, doi: 10.1523/JNEUROSCI.1860-14.2014 (2014). [DOI] [PMC free article] [PubMed] [Google Scholar]
- 68.Habib N et al. Massively parallel single-nucleus RNA-seq with DroNc-seq. Nat Methods 14, 955–958, doi: 10.1038/nmeth.4407 (2017). [DOI] [PMC free article] [PubMed] [Google Scholar]
- 69.McInnes L, Healy J & Melville J Umap: Uniform manifold approximation and projection for dimension reduction. arXiv preprint arXiv:1802.03426 (2018). [Google Scholar]
- 70.Dezfuli G et al. Subdiaphragmatic Vagotomy With Pyloroplasty Ameliorates the Obesity Caused by Genetic Deletion of the Melanocortin 4 Receptor in the Mouse. Front Neurosci 12, 104, doi: 10.3389/fnins.2018.00104 (2018). [DOI] [PMC free article] [PubMed] [Google Scholar]
- 71.Edwards DR, Lohman DC & Wolfenden R Catalytic proficiency: the extreme case of S-O cleaving sulfatases. J Am Chem Soc 134, 525–531, doi: 10.1021/ja208827q (2012). [DOI] [PubMed] [Google Scholar]
Associated Data
This section collects any data citations, data availability statements, or supplementary materials included in this article.
Supplementary Materials
Data Availability Statement
RNA-seq data, 16S rRNA-seq data and single nucleus RNA-seq data are available at Gene Expression Omnibus and BioProject under accession number GSE134808, PRJNA556230 and GSE135326, respectively. All datasets generated and/or analysed during the current study are presented in this published article, the accompanying Source Data or Supplementary Information, or are available from the corresponding author upon reasonable request.


