Abstract
Protein ubiquitination is a multi-functional post-translational modification affecting all cellular processes. Its versatility arises from architecturally complex polyubiquitin chains, in which individual ubiquitin moieties may be ubiquitinated on one or multiple residues, and/or modified by phosphorylation and acetylation1–3. Individual ubiquitin modifications generating the ubiquitin code have been mapped through advances in mass spectrometry, but the architecture of polyubiquitin signals has remained largely inaccessible.
We here introduce Ub-clipping as a methodology to understand polyubiquitin signals and architectures. Ub-clipping utilises an engineered viral protease, Lbpro*, that removes ubiquitin incompletely from substrates, such that the signature C-terminal GlyGly dipeptide remains attached to the modified residue, simplifying direct assessment of protein ubiquitination on substrates and within polyubiquitin. Lbpro*-generated monoubiquitin retains GlyGly-modified residues, enabling quantitation of multiply GlyGly-modified branch-point ubiquitin. Strikingly, a large amount (10-20%) of ubiquitin in polymers appears to exist as branched chains. Moreover, Ub-clipping enables assessment of coexisting ubiquitin modifications. Analysis of depolarised mitochondria reveals that PINK1/Parkin-mediated mitophagy predominantly exploits mono- and short chain polyubiquitin, in which phosphorylated ubiquitin moieties are not further modified. Ub-clipping hence gives unprecedented insight into the combinatorial complexity and architecture of the ubiquitin code.
The last decade has seen spectacular advances in the analysis of ubiquitin modifications, mostly due to mass spectrometry (MS)-based techniques4. Digestion of a ubiquitinated protein with trypsin generates peptides that feature a 114 Da GlyGly modification on residues where ubiquitin had been attached, and which is easily detectable by MS4. Antibodies detecting GlyGly-modified Lys residues enrich these peptides, enabling the mapping of tens of thousands of ubiquitination sites5,6. Moreover, labelled ubiquitin-derived GlyGly-modified peptides facilitate absolute quantitation (AQUA) techniques to quantify polyubiquitin linkage composition7–9, ubiquitin phosphorylation and acetylation10–13.
A disadvantage of tryptic digestion is the loss of architectural information for polyubiquitin chains. Limited trypsinolysis14,15, ubiquitin chain restriction analysis16 and an antibody recognising co-existing Lys11/Lys48 linkages present in branched chains17 can provide some insights into chain architecture18. However, such approaches require experimental optimisation, specialist expertise, or are limited to particular chain combinations. As a result, the combinatorial context of co-existing ubiquitin modifications (e.g. double or triple ubiquitinated ubiquitin species, or phosphorylation in particular chain contexts) has remained largely inaccessible.
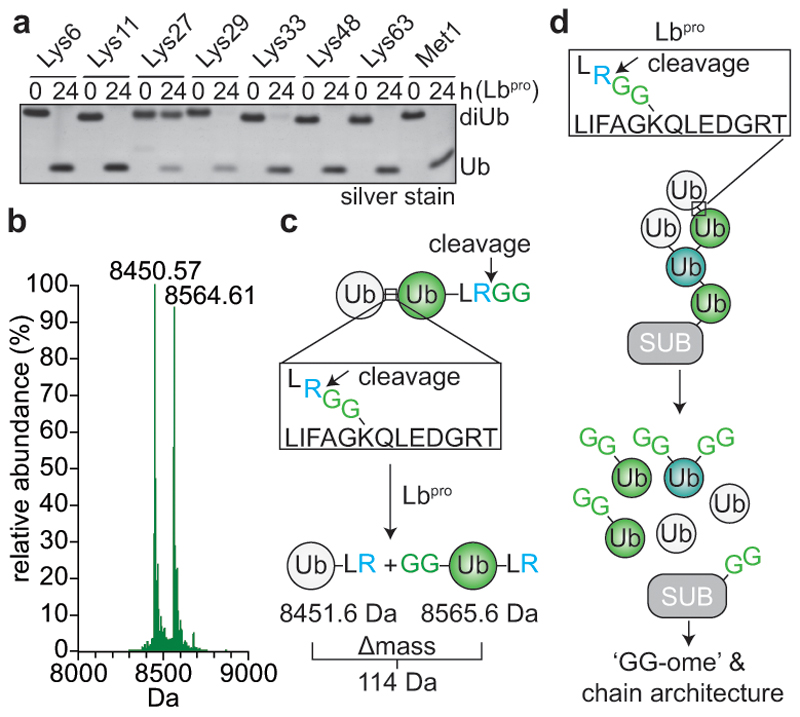
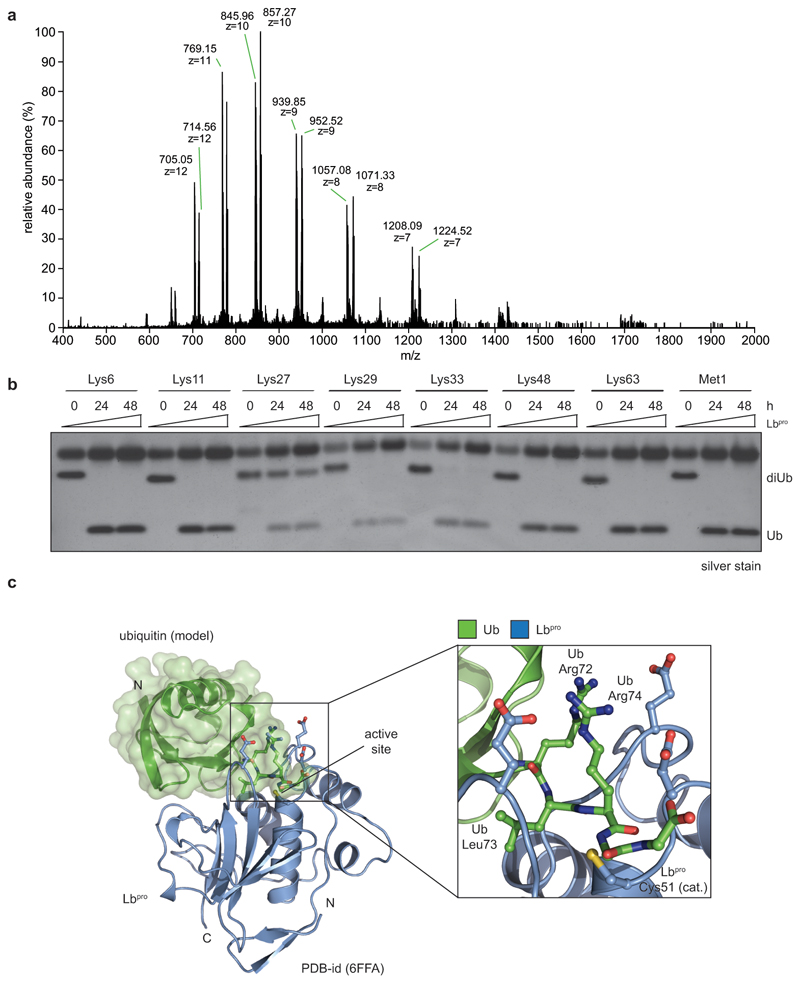
We recently demonstrated that the leader protease (Lbpro) of foot-and-mouth disease virus (FMDV) hydrolyses the ubiquitin-like modifier ISG15 at the peptide bond between Arg155 and the C-terminal Gly156-Gly157 motif, generating GlyGly-modified proteins and incapacitating ISG1519. At higher enzyme concentrations Lbpro targets all types of diubiquitin (Fig. 1a), cleaving each ubiquitin moiety after Arg74 (Fig. 1b, Extended Data Fig. 1a), thus generating two products: A truncated ubiquitin spanning residues 1-74 (8450.6 Da) originating from the distal moiety, and a GlyGly-modified ubiquitin 1-74 (8564.6 Da) (Fig. 1c). Prolonged incubation does not lead to further proteolysis (Extended Data Fig. 1b).
Figure 1. Lbpro cleaves ubiquitin and generates GlyGly-modified proteins.
a, Lbpro was incubated with differently-linked diubiquitin (diUb) for 24 h. Reactions were subjected to SDS-PAGE and visualised by silver staining. A representative example from experiments performed in triplicate is shown. For gel source data, see Supplementary Figure 1. b, Lbpro-treated Lys48-diUb was analysed by electrospray ionization mass spectrometry. Deconvoluted raw spectra are shown (also see Extended Data Fig. 1a). 8450.57 Da peak: distal ubiquitin without the C-terminal Gly75-Gly76 sequence. 8564.61 Da peak (Δmass of 114.04 Da): proximal ubiquitin with apparent wild-type mass; loss of the cleaved C-terminal GlyGly sequence is balanced by GlyGly attachment to Lys48. A representative example of experiments performed in technical triplicate is shown. c, Schematic of Lbpro cleavage sites. Lbpro cleaves diubiquitin twice, after Arg74 of each ubiquitin moiety. d, Lbpro generates a GlyGly-modified proteome, also enabling insights into ubiquitin chain architecture.
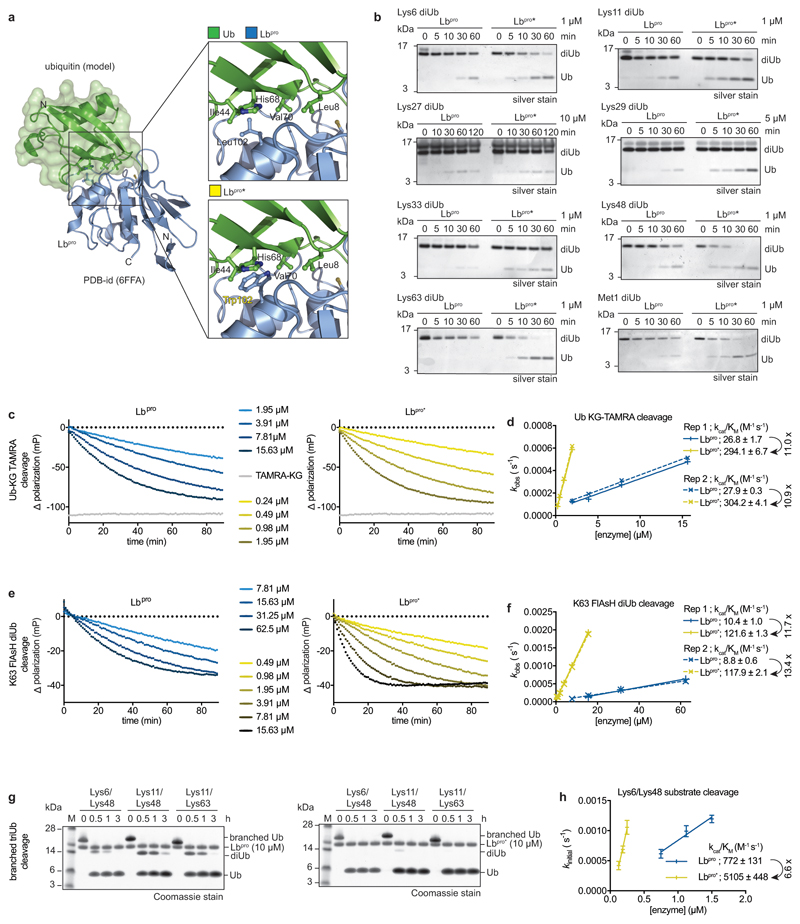
Modelling of ubiquitin onto ISG15 from our recent Lbpro ~ISG15 complex structure19 (Extended Data Fig. 1c) rationalises the ubiquitin cleavage site20 and enables enzyme engineering. An Lbpro point mutant, L102W, had improved capability to target all types of diubiquitin, showed improved catalytic efficiency, and excelled at cleaving branched triubiquitin (Extended Data Fig. 2). We refer to either variant as Lbpro, but note that Lbpro* will be a preferred enzyme for studying ubiquitination.
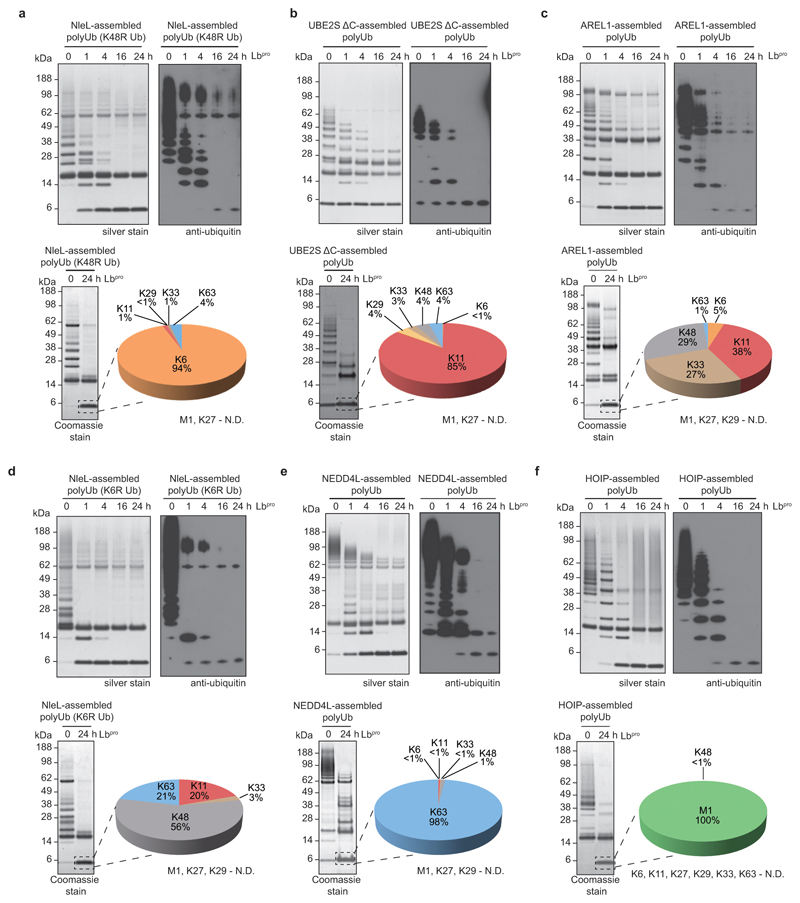
Lbpro converts ubiquitinated proteins into GlyGly-modified proteins (Fig. 1d). This unusual ‘clippase’ activity collapses complex polyubiquitin samples to GlyGly-modified monoubiquitin species that can be further analysed, e.g. by AQUA methods. In vitro analysis of various E3 ligase systems by SDS-PAGE purification and AQUA MS revealed expected linkage compositions, with reduced background from non-ubiquitin peptides (Extended Data Fig. 3).
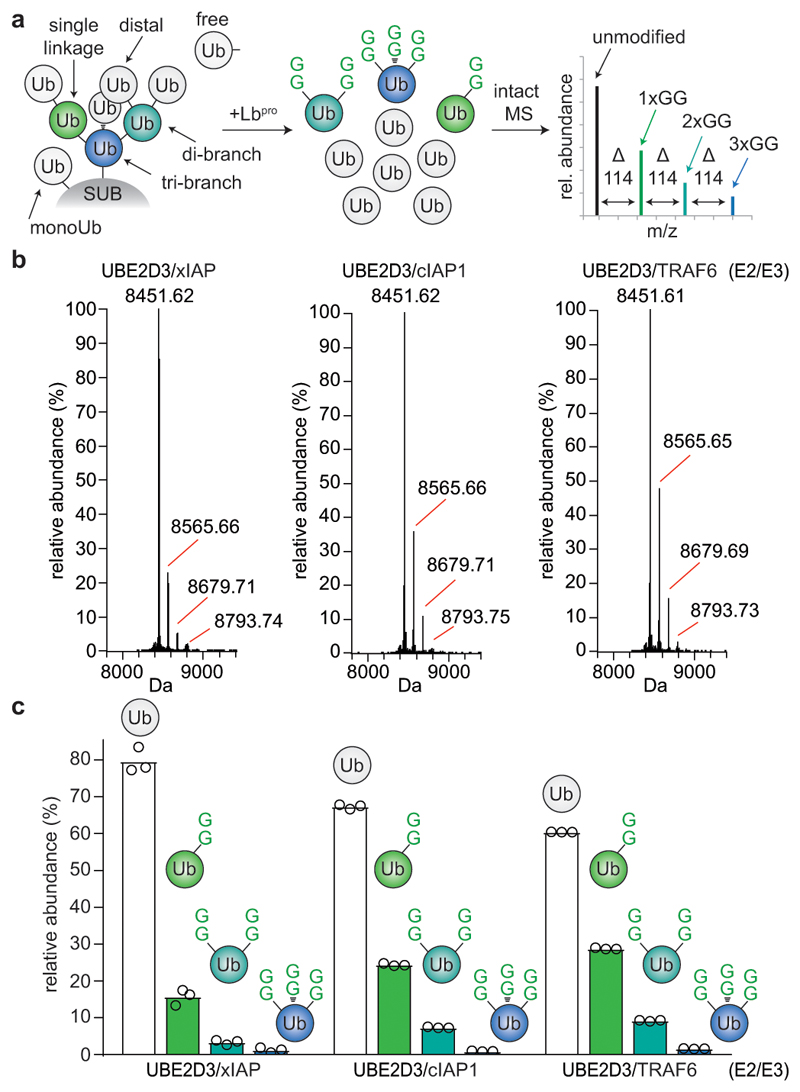
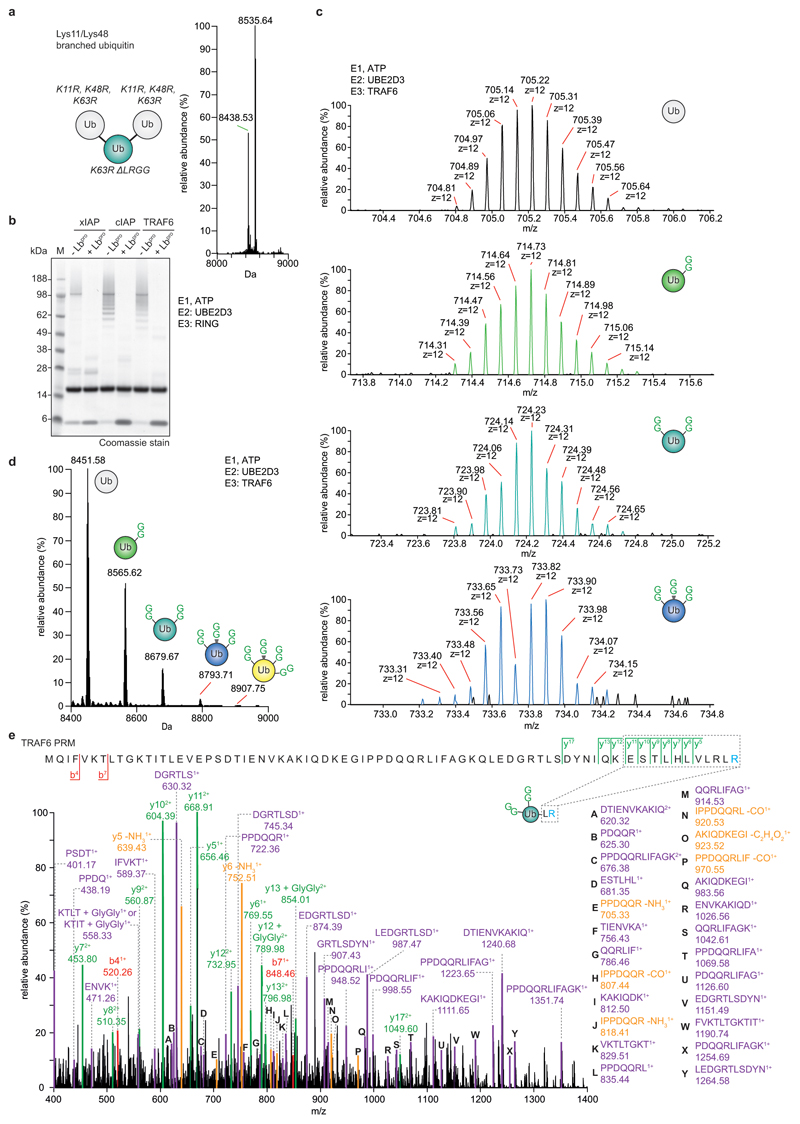
Importantly, the intact mass of the generated monoubiquitin yields fascinating additional insights into chain architecture (Fig. 2a). In RING-ligase reactions performed with the E2 enzyme UBE2D3, ~10% of ubiquitin had been modified with two, three or even four GlyGly groups (Fig. 2b, c, Extended Data Fig. 4). Branched ubiquitin species were not a result of incomplete cleavage (i.e. GlyGly-modified ubiquitin with an intact C-terminus) since the most abundant transition ions of an isolated di-GlyGly-modified ubiquitin species comprised a ‘clipped’ C-terminus (Extended Data Fig. 4e). UBE2D family enzymes are promiscuous with respect to their target Lys21. Ub-clipping reveals that the promiscuity of the UBE2D3 can generate highly branched, tree-like polyubiquitin architectures.
Figure 2. Dissecting branched ubiquitin chains with Ub-clipping.
a, Schematic of the Ub-clipping intact mass spectrometry (MS) workflow. Unmodified (white), single- (green), double- (cyan), and triple- (blue) GlyGly-modified ubiquitin species are distinguishable by intact mass. b, c Intact MS analysis of Lbpro-treated in vitro ubiquitin chain assembly reactions. Lbpro-treated E2/E3 ligase assembly reactions were analysed by direct injection intact MS and spectra deconvoluted. See Extended Data Fig. 3 for additional ligase assays, and Extended Data Fig. 4 for raw data. The mean value is shown from independent experiments performed in triplicate. b, Deconvoluted spectra. c, Quantitation of the relative abundance of each ubiquitin species.
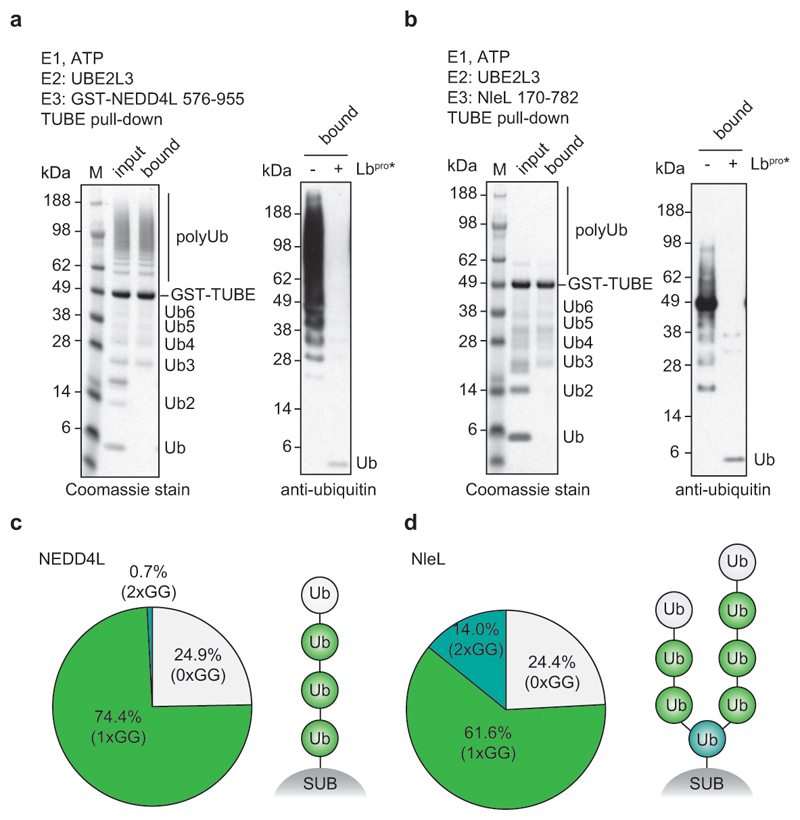
One complication from these studies is that unassembled monoubiquitin in the reaction artificially increases the apparent amount of unmodified ubiquitin, skewing results on chain composition. Tandem ubiquitin-binding entity (TUBE) pulldowns22 prior to Lbpro treatment remove free monoubiquitin which then enables estimation of average chain length (Extended Data Fig. 5).
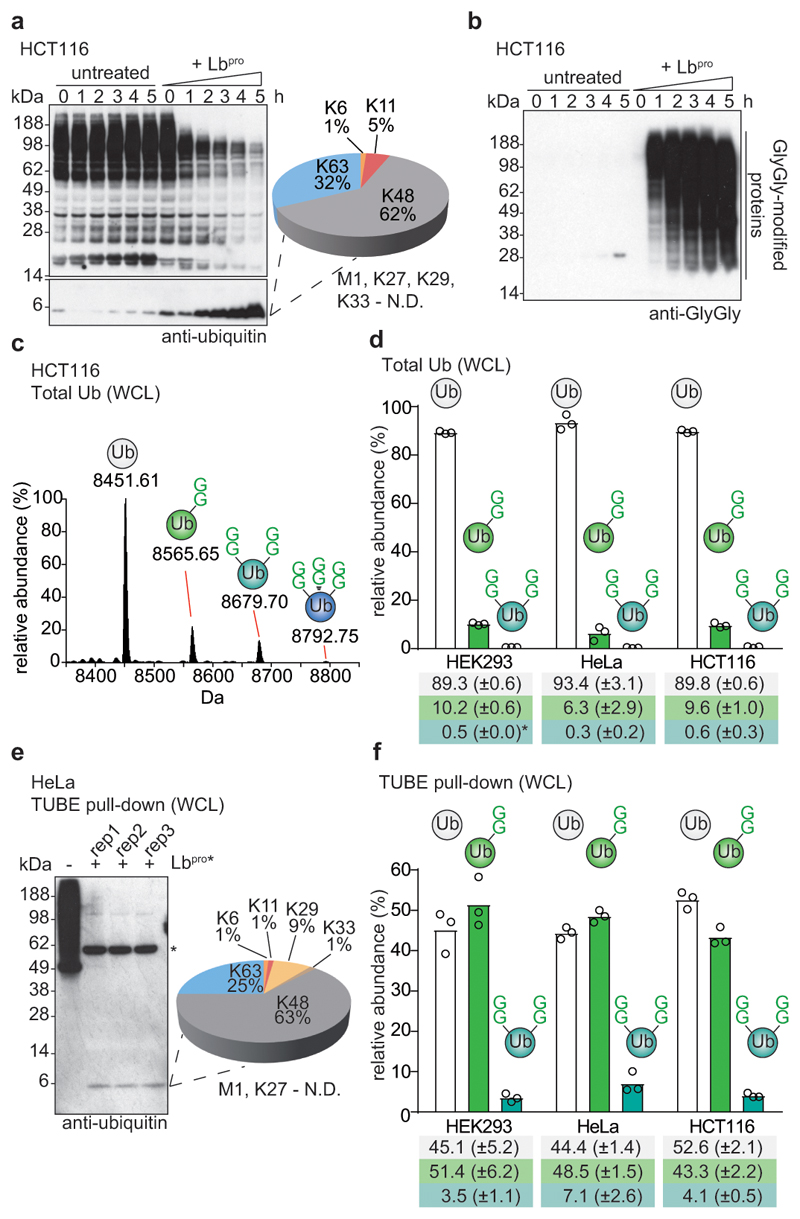
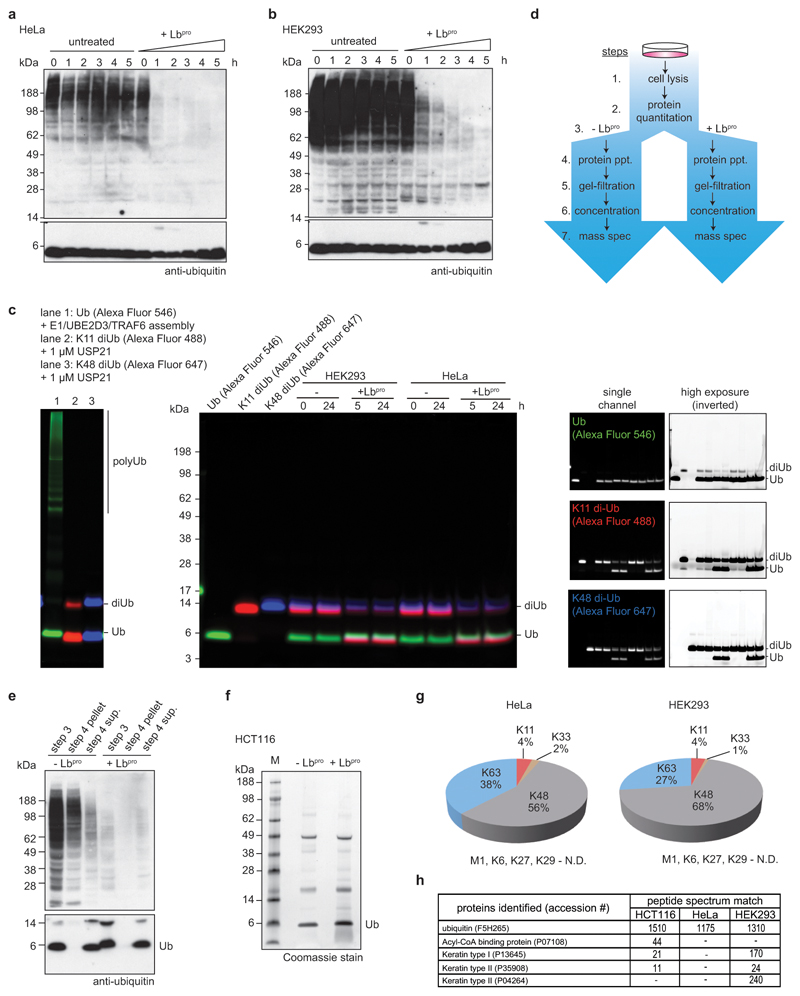
The advantages and robustness of Lbpro-mediated Ub-clipping became even more striking when applied to complex mixtures such as cell lysates, opening new possibilities for ubiquitome analysis. Lbpro was active in conditions containing 1 M urea, which inhibits assembly and cleavage of polyubiquitinated proteins by endogenous ligases and deubiquitinases (Fig. 3a, Extended Data Fig. 6a-c). Thus, Lbpro treatment of cell lysates collapses high molecular weight ubiquitin conjugates, generating a monoubiquitin species (Fig. 3a, Extended Data Fig. 6a, b). In-gel trypsin digestion and AQUA MS of the single 8 kDa monoubiquitin product revealed the global linkage composition of the entire cell lysate (Fig. 3a), with identical results as compared to whole cell lysate tryptic digests6,23.
Figure 3. Ub-clipping in cells.
a, HCT116 whole cell lysates were left untreated, or were treated with 10 μM Lbpro at the indicated times, resolved on SDS-PAGE, and analysed by anti-ubiquitin Western blotting. The monoubiquitin band was analysed by AQUA MS. A representative example of experiments performed in biological triplicate is shown. Also see Extended Data Fig. 6. N.D., not detected. b, HCT116 lysates as in a blotted with an anti-GlyGly antibody5. Experiments were performed in duplicate. c, Intact MS analysis of HCT116 Lbpro-treated ubiquitin (see Extended Data Fig. 6d-f and Methods). Select spectra were averaged and deconvoluted, with masses corresponding to unmodified (white), and single (green), double (cyan), and triple (blue) GlyGly-modified ubiquitin. These experiments were performed independently three times with similar results. d, Quantitation of differentially modified ubiquitin species from three cell lines (see Extended Data Fig. 7a, 8c, d, Methods). Values correspond to the mean of independent experiments performed in biological triplicate. *, value of 0.50 (±0.04). Error values represent s.d. from the mean. e, Left, TUBE pull-downs from HeLa cells, before and after treatment with Lbpro, as in a. *, cross-reactive protein. Right, ubiquitin linkage composition by AQUA MS from TUBE-enriched polyubiquitin, performed in biological triplicate with AQUA analysis performed in technical duplicate. N.D., not detected. f, Intact MS on ubiquitin species pre-purified with TUBEs from the indicated cell lines (see e and Extended Data Fig. 8a-b), quantified as in d. Values correspond to the mean of independent experiments performed in biological triplicate. Error values represent s.d. from the mean. Gel source data for panels a, b and e are shown in Supplementary Figure 1.
Lbpro treatment of cell lysates generates GlyGly-modified proteins, which can be visualised by the anti-GlyGly antibody5,6,24,19 (Fig. 3b). Previously modified proteins that appear as high-molecular weight smears are collapsed to more discrete bands close to their original size (Fig. 3b). This may prove useful for global ubiquitination site analysis and for directed ubiquitination studies of specific proteins.
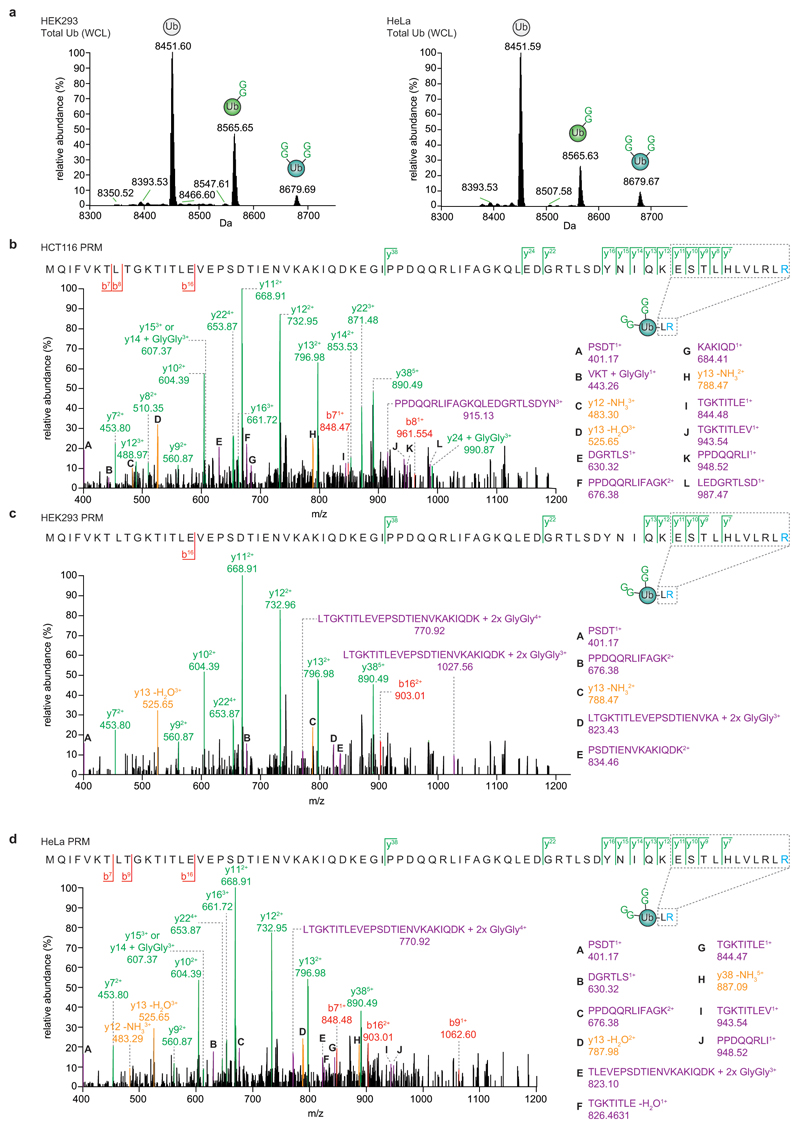
We purified the monoubiquitin band to study ubiquitin chain branching in cells (Extended Data Fig. 6d-f). Samples showed ubiquitin linkage compositions as previously reported23,25 (Extended Data Fig. 6g) and minimal background (Extended Data Fig. 6h). Next, intact MS analysis was used to derive relative amounts of differently modified ubiquitin species. Globally, most ubiquitin was unmodified; the pool originates from free ubiquitin, monoubiquitinated proteins, and terminal ubiquitin moieties in chains25. Also, as reported previously25, roughly 10% of ubiquitin was mono-GlyGly-modified (Fig. 3c, d). Interestingly, low levels of di-GlyGly and even tri-GlyGly modified ubiquitin were also detected (Fig. 3c, d, Extended Data Fig. 7a). We confirmed the removal of the GlyGly C-terminus from branched ubiquitin species by fragmentation (Extended Data Fig. 7b-d).
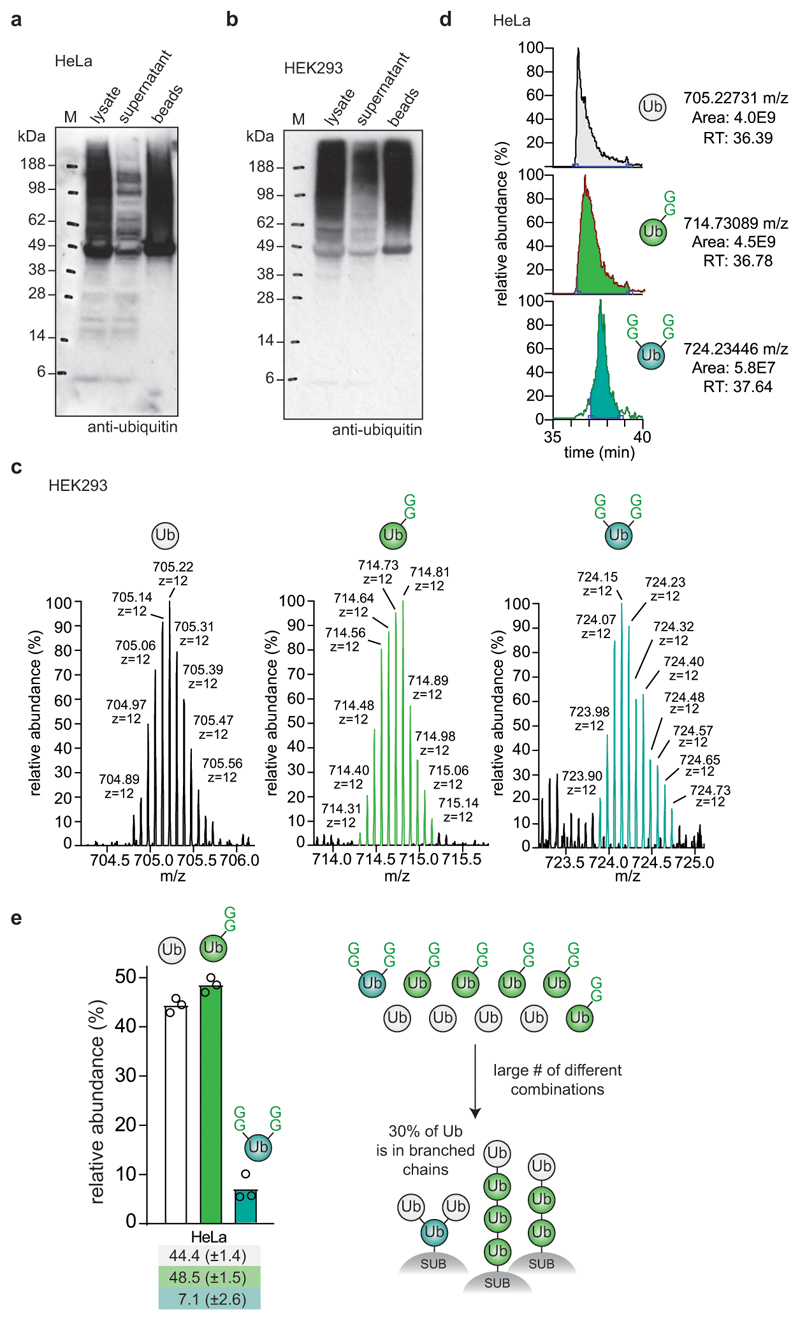
In whole cell lysates, the levels of branch-point ubiquitin accounted for ~0.5% of all ubiquitin, in three cell lines analysed (Fig. 3d). Next, the amount of branching in polyubiquitin was assessed with TUBE pulldowns. TUBE-enriched polyubiquitin showed a similar overall linkage composition as compared to whole cell lysates (Fig. 3e, compare Extended Data Fig. 6g). Intact MS analysis and quantitation by peak integration (Extended Data Fig. 8, also see Methods) revealed that ~4-7% of all ubiquitin in TUBE pulldowns was modified with two GlyGly modifications (Fig. 3f). This suggests that a significant fraction (~10-20%) of ubiquitin in polymers exist in the context of a branched chain, consistent with data from limited trypsinolysis18 (Extended Data Fig. 8e, see further discussion therein).
It is becoming increasingly clear that cells employ special context-dependent ubiquitin signals for particular tasks; a prime example for this is PINK1/Parkin-driven mitophagy, the organised destruction of mitochondria via autophagy26,27. In this process, PINK1 generates Ser65-phosphorylated ubiquitin (phospho-ubiquitin) leading to activation of the E3-ligase Parkin that further ubiquitinates damaged mitochondria to initiate mitophagy26,27. While substrates and linkage composition of Parkin-directed ubiquitination events have been studied in great detail10,28–31, less is known about the architecture of the mitophagy signal.
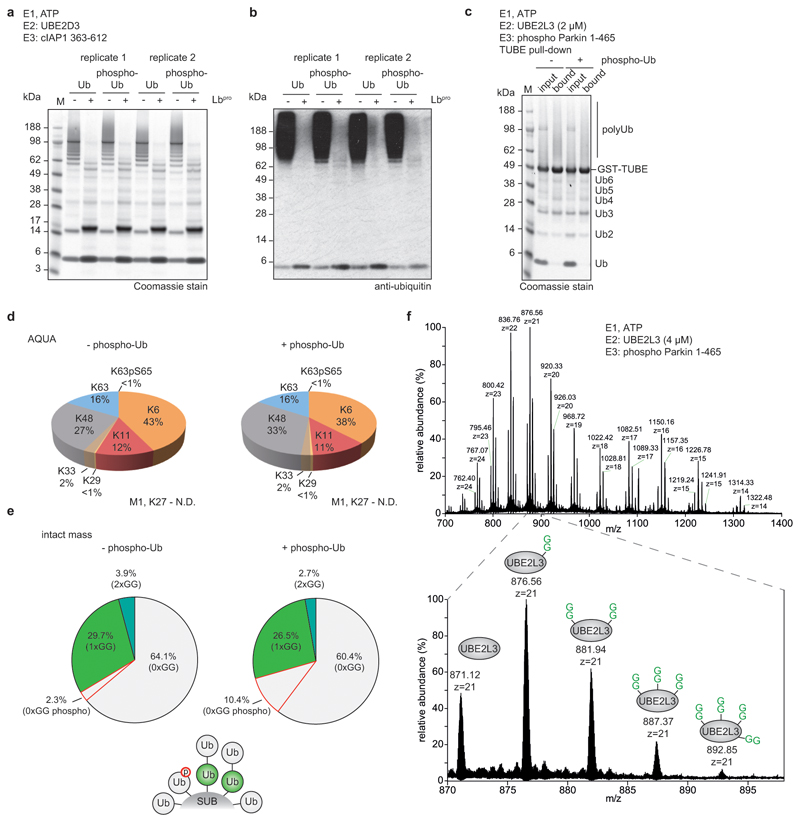
We used Ub-clipping to study mitophagy. Lbpro was able to hydrolyse phospho-ubiquitin chains (Extended Data Fig. 9a, b) and TUBE-based in vitro analysis of activated Parkin yielded expected polyubiquitin linkage composition with Lys6 (38-43%), Lys11 (11-12%), Lys48 (27-33%) and Lys63-linkages (16%)10,30. Interestingly, intact mass analysis showed that Parkin produces predominantly short chains (ratio between GlyGly-modified and unmodified ubiquitin ~1:2) that also included branched ubiquitin species (Extended Data Fig. 9c-e). Ub-clipping also revealed multiple GlyGly modifications on the E2 enzyme UBE2L3 (Extended Data Fig. 9f), highlighting the utility in characterizing substrate ubiquitination.
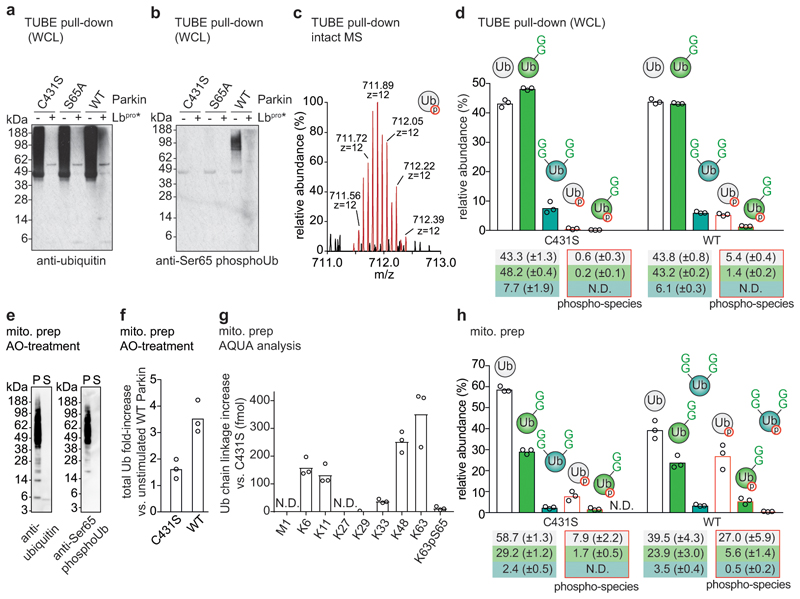
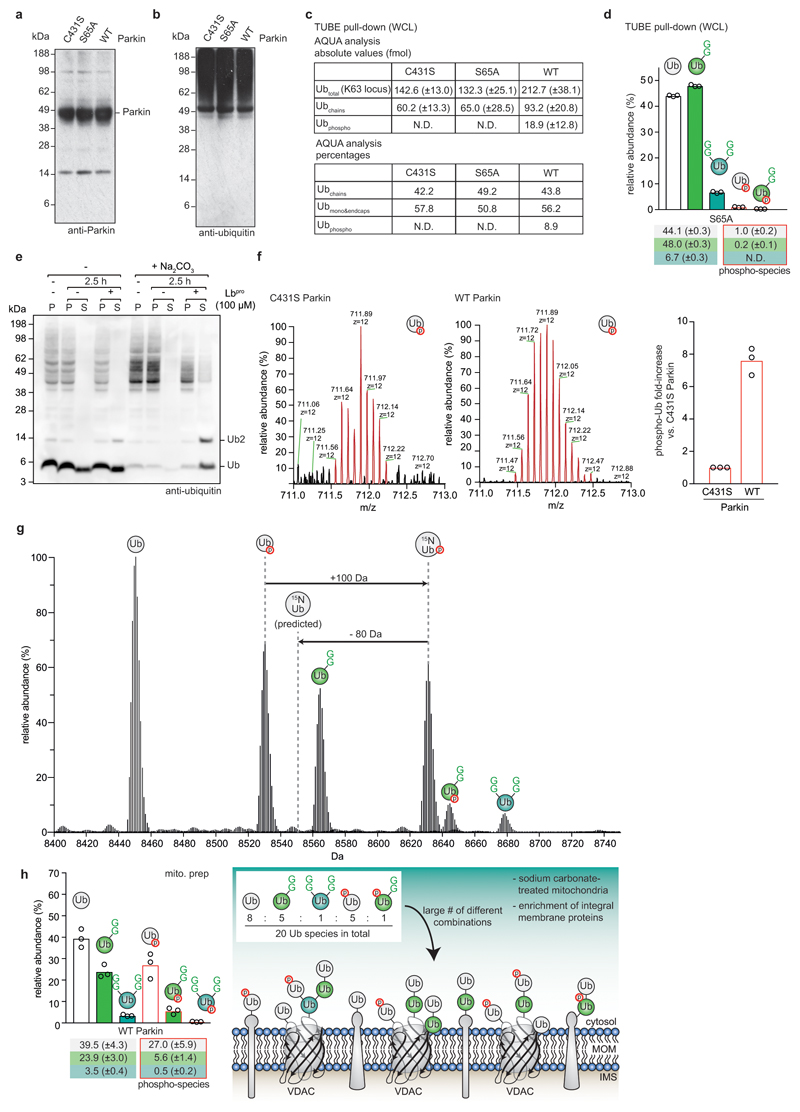
In cells, mitochondrial depolarisation triggers Parkin activity26,27. This can be controlled using Parkin-lacking HeLa cell lines that express wild-type (WT) Parkin, or dysfunctional Parkin mutants (C431S or S65A, respectively)10,29. Detailed proteomic studies have characterised this experimental system10,29,32. TUBE pulldowns and Ub-clipping of enriched polyubiquitin (Fig. 4a, b, Extended Data Fig. 10a, b) reproduced expected global ubiquitome changes and appearance of phospho-ubiquitin in response to depolarising agents (Extended Data Fig. 10c). Intact ubiquitin analysis revealed isotopic distribution corresponding to unmodified phospho-ubiquitin (Fig. 4c). Expression of WT Parkin did not lead to global changes in architecture composition in the whole cell lysate, except that phospho-ubiquitin was detected at ~7% of total ubiquitin, in a species that was primarily not GlyGly-modified (i.e. mono or endcap ubiquitin) (Fig. 4d, Extended Data Fig. 10d).
Figure 4. Exploring mitophagy with Ub-clipping.
a, TUBE-purified polyubiquitin before and after Lbpro treatment, from CCCP-stimulated HeLa cells lines expressing the indicated Parkin proteins (see Extended Data Fig. 10a). b, Samples from a probed with anti-Ser65 phospho-ubiquitin antibody (see Extended Data Fig. 10b). Western blots were performed on one of three independent experiments. c, Intact ubiquitin MS reveals isotopic distribution of phospho-ubiquitin (theoretical nominal mass (z = +12): 711.89117 m/z, observed mass: 711.89763 m/z). One scan is shown from analysis performed in triplicate. d, Quantitation by spectra deconvolution of individual ubiquitin species from a (see Extended Data Fig. 10c, d). A phospho-2xGG species was not detected (N.D.). Values correspond to the mean of independent experiments performed in biological triplicate. Error values represent s.d. from the mean. e, Ubiquitin and phospho-ubiquitin in sodium carbonate-enriched mitochondrial integral membrane proteins (see Methods), from purified mitochondria of OA-treated WT Parkin-expressing HeLa cell lines (see a). S, Supernatant; P, pellet. Western blots were performed on one of three experiments. f, g, h, Fold-enrichment (f), AQUA MS analysis (g), and intact MS (h, quantified as in d) of ubiquitin on purified depolarised mitochondria from Parkin-expressing HeLa cell lines (e.g. e). Values correspond to the mean of independent experiments performed in biological triplicate. In h, high levels of unmodified ubiquitin and non-ubiquitinated phospho-ubiquitin suggest predominantly mono- and short-chain modifications on mitochondrial membrane proteins. Error values represent s.d. from the mean. Gel source data for panels a, b and e are shown in Supplementary Figure 1.
These results were corroborated in mitochondrial preparations. Sodium carbonate-treatment of mitochondrial fractions that enrich (phospho-)ubiquitinated integral membrane proteins33 alleviated requirement of TUBE pulldown as it depleted free ubiquitin from samples (Fig. 4e, Extended Data Fig. 10e). Under these conditions, mitochondrial depolarisation and Parkin activity led to expected increase in amount and change of linkage composition of ubiquitin on mitochondria (Fig. 4f, g)10. Intact mass analysis recovered a high level of phospho-ubiquitin (~10% with Parkin C431S, and ~33% with WT Parkin), the vast majority of which (8% and 27%, respectively) was not further modified (Fig. 4h, Extended Data Fig. 10f, g). In both cell lines, ~30% of ubiquitin was single-GlyGly-modified (Fig. 4h).
These and recent data on ubiquitination site occupancy during mitophagy32, allow modelling of the Parkin-assembled ubiquitin coat on mitochondria (Extended Data Fig. 10h). First, a large relative amount of non-ubiquitinated ubiquitin indicates predominantly monoubiquitination and short chains. Secondly, the levels of monoubiquitin and single-GlyGly-modified ubiquitin are similar in C431S and WT cells indicating the overall ubiquitin chain length is not significantly altered upon expression of active Parkin, under conditions of chemical mitochondrial depolarisation. Thirdly, most phospho-ubiquitin exists at the tip of chains, which is consistent with previous findings that Parkin attaches only unphosphorylated ubiquitin11, and that PINK1 prefers to phosphorylate distal ubiquitin moieties34. Together with the observed overall increase of mitochondrial ubiquitin, this indicates that PINK1 and Parkin generate a carpet of short phospho-ubiquitin chains to trigger mitophagy (Extended Data Fig. 10h).
The ability of Lbpro to turn the ubiquitome into a GlyGly-modified proteome eases access to ubiquitination sites and chain linkage analysis by reducing background from cellular samples and by enabling new applications for well-established tools, including TUBE pulldowns and anti-GlyGly antibodies. More importantly, Ub-clipping provides unprecedented and unbiased insights into ubiquitin chain architecture, which has remained by-and-large inaccessible. Intact mass analysis of the Lbpro-generated monoubiquitin species reveals and quantifies relative amounts of, for example, branch-point ubiquitin, and can access co-modified ubiquitin, such as the chain context of a phosphorylated ubiquitin. This will eventually help to model polyubiquitin architecture, the ‘grammar’ of the ubiquitin code, in greater detail, and unveil the regulatory potential of the vast number of independent polyubiquitin signals.
Online Methods
Protein expression and purification
Lbpro (construct: 29-195 aa) and Lbpro* (L102W) were expressed and purified according to 35. Ubiquitin E1, E2 and E3 enzymes, and PINK1 were purified as described previously 11,36–41.
Diubiquitin cleavage assays
Cleavage assays were performed according to 42 by incubating 1.25 μM of each diubiquitin (Lys6, Lys11, Lys27, Lys29, Lys33, Lys48, Lys63, Met1) with 10 μM Lbpro in reaction buffer (50 mM Tris pH 8.0, 50 mM NaCl, 2 mM DTT). Reactions were incubated at 37 °C and quenched by adding LDS sample buffer. Samples were resolved on NuPAGE 4-12% Bis-Tris gels (Invitrogen) run in MES buffer, and silver stained.
Kinetic cleavage measurements: Fluorescence polarization assays
Fluorescent substrate (0.1 μM of ubiquitin-KG-TAMRA or Lys63-diUb-FlAsH) was incubated with the indicated concentrations of enzyme in reaction buffer (50 mM Tris pH 8.0, 10 mM DTT, 0.05 mg/mL BSA). Measurements were performed with a PheraStar plate reader (BMG Labtech) using either the FlAsH optic module (λex = 485 nm, λem = 520 nm) or the TAMRA optic module (λex = 540 nm, λem = 590 nm). The reaction was carried out in a total volume of 20 μL at 25 °C in a black, round-bottom, nonbinding surface 384-well plate (Greiner) and probed every min for a time-course of 90 min. Raw data were background corrected using a polarization time course from an uncleaved substrate. All experiments were performed as technical triplicate and data were analyzed in Microsoft Excel and GraphPad Prism. Non-linear curve fitting to extract a one-phase exponential decay constant was carried out without a constraint of the plateau position. Rate constants observed in two independent experiments were plotted against enzyme concentration, where the slope of a linear fit yielded the catalytic efficiencies corresponding to the reported kcat/KM ratio.
Kinetic cleavage measurements: Gel-based assays
Lys6/Lys48 branched triubiquitin substrate (10 μM) was incubated with varying enzyme concentrations (1.5, 1.125, 0.75 μM Lbpro or 0.25, 0.188, 0.125 μM Lbpro*) in reaction buffer (50 mM Tris pH 8.0, 10 mM DTT). Samples were removed and quenched in DTT-containing LDS sample buffer every 2 min over a 10 min time course and resolved on NuPAGE 4-12% Bis-Tris gels (Invitrogen). Gels were Coomassie stained (Instant Blue, Expedeon) and band intensities quantified with ImageJ. Monoubiquitin band intensities were normalized to the substrate intensity and data from the linear portion of each time course were used to determine initial rates. The slope of a linear fit of initial rates observed in three independent experiments against enzyme concentration yielded catalytic efficiencies corresponding to the reported kcat/KM ratio.
MS analysis of ubiquitin cleavage
Assays were performed similarly to diubiquitin cleavage assays but with a diubiquitin concentration of 10 μM. Reactions were incubated at 37 °C for 24 h and quenched with 50% acetonitrile (v/v), 0.1% formic acid (v/v). Ubiquitin was diluted to 1 pmol/μL in quenching solution prior to intact MS analysis. Samples were injected at a flow rate of 5 μL/min and ionized using a heated electrospray ionization (HESI-II) source before being analysed with a Q Exactive Orbitrap mass analyser (Thermo Fisher Scientific). Ionization, data collection, and deconvolution of spectra were performed identically to 11.
Ubiquitin chain assembly reactions
Assays were performed by mixing 25-50 μM ubiquitin, 100 nM mouse E1, 2.5-10 μM E2, 2.5-10 μM E3, 10 mM ATP in 40 mM Tris pH 7.4, 10 mM MgCl2, 0.6 mM DTT. In the AREL1 assembly reaction the buffer was supplemented with 10% (v/v) glycerol, 100 mM NaCl, and Tris pH 8.5 (instead of pH 7.4). Assembly reactions were incubated at 37 °C for 1 h, with the exception of UBE2S ΔC and AREL1 in which the reaction times were 16 h and 4 h, respectively. Ubiquitin and phospho-ubiquitin chains were assembled using UBE2D3/cIAP1 assembly machinery according to 11. Ser65-phosphorylated human Parkin (pParkin) was purified as in41. For Parkin assembly reactions, pParkin (4 μM) was incubated for 2 h at 37 °C in the presence of human E1 (0.2 μM), UBE2L3 (2-4 μM as indicated), ubiquitin (15 μM) and where indicated Ser65-phosphorylated ubiquitin (1.5 μM) in reaction buffer (50 mM Tris, pH 8.5, 200 mM NaCl, 10 mM MgCl2, 10 mM ATP, 10 mM DTT). Staurosporine (10 μM) and Nb696 (0.8 μM) were added to inhibit kinase activity43. The assembly reactions were terminated through the addition of 2 mU of apyrase (Sigma-Aldrich) for 1 h at 37 °C.
Lbpro treatment of in vitro assembly reactions
Ubiquitin chain assembly reactions were incubated with 10 μM Lbpro in 50 mM Tris pH 8.0, 10 mM DTT. The reactions were incubated at 37 °C and stopped by mixing with LDS sample buffer at indicated time points. The protein samples were resolved on NuPAGE 4-12% Bis-Tris gels and visualised by anti-ubiquitin Western blots (cat. no. 07-375, Millipore), silver staining (cat. no. 161-0481, Bio-Rad), or Coomassie staining using Instant Blue Coomassie SafeStain (Expedeon).
Western blot analysis
Protein from ubiquitin assembly reactions or whole cell lysates was transferred to nitrocellulose membrane. For additional visualisation of monoubiquitin (e.g. Fig. 3a), the lower portion of the gel (below 14 kDa) was transferred instead to a PVDF membrane. Samples from Fig. 4e and Extended Data Fig. 10e were transferred to PVDF membrane. Western blots were incubated at 4 °C in a 1:1000 primary antibody dilution overnight in PBS-T + 5% (w/v) BSA and 1:5000 secondary antibody dilution overnight in PBS-T + 5% milk prior to being visualised by chemiluminescence. Primary antibodies used include anti-ubiquitin (cat. no. 07-375, Millipore), anti-pSer65 phospho-ubiquitin (cat. no. ABS1513-I, Millipore), anti-Parkin (cat. no. ab77924, Abcam) and anti-GlyGly (cat. no. 30-1000, Lucerna Inc.). The primary anti-ubiquitin antibody (cat. no. NB300-130, Novus Biologicals) was used for Western blots in Figure 4e and Extended Data Fig.10e. Secondary horseradish peroxidase-linked antibodies included anti-mouse and anti-rabbit (cat. no. NXA931V and NA934V, GE Healthcare).
AQUA MS
Following Lbpro cleavage and separation by SDS-PAGE, the molecular weight range surrounding monoubiquitin (5-10 kDa) was excised from the gel and diced into 1 mm3 cubes with a scalpel. Quantitative ubiquitin linkage analysis using AQUA was performed according to 11. For in vitro Parkin assembly reactions, AQUA analysis was performed on TUBE-purified chains. These samples were separated 2 cm into the gel before the lane was processed and analysed by AQUA MS.
Intact MS on ubiquitin from assembly reactions and quantitation by protein deconvolution
Lbpro-treated assembly reactions were diluted to 1 μM ubiquitin with quenching solution (50% acetonitrile (v/v), 0.1% formic acid (v/v)). Samples were ionized using a Heated Electrospray Ionization source (HESI-II, Thermo Fisher Scientific) at a flow rate of 5 μL/min. Ionization settings were performed according to 11. Data were collected on a Q Exactive at a resolution of 140,000 over a period of 1 min. Spectra were averaged and subsequently deconvoluted using the Xtract node of Thermo Xcalibur Qual Browser version 2.2 (Thermo Fisher Scientific). The intensities of un- (8451.65 Da), single- (8565.69 Da), double- (8679.73 Da), triple- (8793.78 Da), and quadruple-modified (8907.82 Da) ubiquitin were exported from Xcalibur into Microsoft Excel for further analysis. For quantitation of phospho-ubiquitin containing samples by spectra deconvolution, the intensities of unmodified phospho-ubiquitin (8531.61 Da), single-GlyGly-modified phospho-ubiquitin (8645.66 Da), and double-GlyGly-modified phospho-ubiquitin (8759.70 Da) were also exported and analysed.
Tissue culture
HeLa, HCT116, HEK293 were obtained from ATCC and exhibited expected cell morphology. Doxycycline-inducible HeLa Flp-In T-REx cells expressing Parkin proteins were a kind gift from Alban Ordureau and Wade Harper (Harvard)10. All cell lines were routinely checked for mycoplasma contamination using the MycoAlert™ detection kit (Lonza). Cells were cultured in Dulbecco’s Modified Eagle’s Medium (DMEM) plus GlutaMAX™ (Gibco) supplemented with 10% (v/v) fetal calf serum and PenStrep (100 U/mL Penicillin and Streptomycin). Cell lines were grown to 90% confluency prior to lysate preparation. Cells were washed in PBS, harvested, and immediately frozen in liquid nitrogen.
Protein extraction
Cell pellets were lysed in extraction buffer (50 mM Tris pH 8.0, 50 mM NaCl, 10 mM chloroacetamide, 5 mM EDTA, 1 mM PMSF, 0.1% (v/v) NP-40, 25 mM sucrose, 5% (v/v) glycerol, 4 M urea). To supplement lysis and shear DNA, lysates were sonicated using a microtip. Sonication settings were the following: amplification 10%, 10 sec on, 10 sec off, total sonication time 1 min. The lysate was incubated on ice for 1 min and sonication repeated. The lysate was pelleted at 21,000 x g, after which the supernatant was removed and total protein quantified with Bradford reagent (Bio-Rad Laboratories) using Bovine γ-globulin as a standard.
Generation of fluorescently labelled ubiquitin and diubiquitin
For maleimide labelling, ubiquitin containing an S20C mutation or diubiquitin containing an S20C mutation in the distal moiety were used. Lys11-linked diubiquitin was assembled overnight using UBE2S ΔC38, ubiquitin (K11R, S20C, K63R) as the distal and ubiquitin (K63R, ΔLRGG) as the proximal moiety and purified by size-exclusion chromatography (HiLoad 16/60 Superdex 75, GE Healthcare). Lys48-linked diubiquitin was assembled for 90 min using Cdc3444, ubiquitin (K6R, S20C, K48R) as the distal and ubiquitin (ΔLRGG) as the proximal moiety and purified using cation-exchange chromatography (MonoS, GE Healthcare) followed by size-exclusion chromatography as above.
Prior to labelling, S20C-containing ubiquitin and diubiquitin variants were first incubated in 2 mM β-mercaptoethanol-containing buffer for 45 min at 25°C and then buffer exchanged into 50 mM Tris, pH 7.4 using PD Spintrap G-25 (GE Healthcare). Variants were incubated with a ~6-fold excess of Alexa Fluor maleimide dye (ThermoFisher Scientific; ubiquitin with Alexa Fluor 546 C5 Maleimide, Lys11-linked diubiquitin with Alexa Fluor 488 C5 Maleimide and Lys48-linked diubiquitin with Alexa Fluor 647 C2 Maleimide) at 25°C overnight in the dark. After the labelling step, ubiquitin variants were separated from unreacted dye using illustra NAP-10 columns (GE Healthcare) according to the manufacturer.
Purification of total ubiquitin
All steps were performed at 4 °C unless denoted otherwise. For purification of total ubiquitin, a single confluent 15 cm dish of cells was used per replicate. The cell pellet was resuspended in 300 μL of extraction buffer and processed as described above. In order to standardise cleavage of ubiquitin chains by Lbpro the final concentration of total protein was adjusted to 5 mg/mL using lysis buffer without urea; this typically reduced the final concentration of urea to ~1 M, a concentration in which Lbpro retains activity. Cell lysates were incubated with 100 μM Lbpro for 5 h at 37 °C. After incubation, samples were dialysed in ice-cold ultra-pure water overnight. Following dialysis, precipitated proteins were removed by centrifugation at 21,000 x g. The remaining, ubiquitin-containing fraction was subjected to gel filtration on a Superdex 75 3.2/300 gel filtration column using an ÄKTAmicro System (GE Healthcare). Fractions containing ubiquitin were identified by Western blotting, concentrated and used for mass spectrometry.
To test for retention of ubiquitin ligase or deubiquitinase activity following dilution of the lysates in lysis buffer without urea, lysates were incubated with fluorescently labelled monoubiquitin (Alexa Fluor 546), Lys11-linked di-ubiquitin (Alexa Fluor 488) and Lys63-linked di-ubiquitin (Alexa Fluor 647), whereby the respective fluorophores are chemically attached to S20C ubiquitin. Lysates (0.75 μg total protein per sample) were incubated with 90 ng of each fluorescent ubiquitin at 37 °C for the indicated times, with or without Lbpro, then run on a NuPAGE 4-12% Bis-Tris gels. Fluorescence emission for each fluorophore was measured using a Chemidoc MP (Bio-Rad) using the instrument’s optimal exposure settings. Another exposure was taken at approximately three times the optimal exposure time to detect any lowly abundant forms. To test that the fluorescently modified ubiquitin species were still competent for assembly, 5 μM Alexa Fluor 546-labelled monoubiquitin was assembled using 0.1 μM human E1, 0.5 μM UBE2D3 and 0.5 μM TRAF6. Cleavage of each labelled diubiquitin was confirmed by treating 5 μM diubiquitin with 1 μM USP21 for 1 h at 37 °C.
TUBE pull-down assays
A confluent 10 cm dish was used in each replicate experiment or in the instance of in vitro chain assemblies, 30 μL of the assembly reaction. For doxycycline-inducible Parkin-expressing cell lines, cells were pre-treated with 0.1 μg/mL doxycycline for 16 h, followed by a 1h treatment with 10 μM CCCP. All steps were performed at 4 °C unless stated otherwise. Frozen cell pellets were resuspended in 300 μL of TUBE lysis buffer (20 mM Na2HPO4, 20 mM NaH2PO4, 1 % (v/v) NP-40, 2 mM EDTA 1 mM DTT, 10 mM chloroacetamide, cOmplete EDTA-free Protease Inhibitor Cocktail (Roche) and PhosSTOP (Roche)) supplemented with 100 μg of GST 4x ubiquilin 1 TUBE22 (15 μg for assembly reactions). Samples were incubated on ice for 20 min prior to centrifugation at 21,000 x g. The cleared lysate was incubated with 25 μL of pre-washed Glutathione Sepharose 4B resin (GE Healthcare). Samples were incubated on a rotating wheel for 2 h. Glutathione beads were washed three times with 500 μL of PBS + 0.1% (v/v) Tween20 and a final wash with PBS. Enriched ubiquitin chains were incubated with 4 column volumes of 100 μM Lbpro* for 16 h at 37 °C. After Lbpro cleavage, the supernatant containing ubiquitin species was removed for MS sample preparation.
Mitochondria isolation and enrichment of ubiquitinated proteins
For mitochondrial enrichment experiments, doxycycline-inducible Parkin-expressing cell lines were used10. Prior to harvest, cells were pre-treated for 16 h with 0.5 μM doxycycline, followed by a 2 h treatment with 0.5 μM doxycycline, and 10 μM Oligomycin / 4 μM Antimycin (OA). Mitochondria were isolated as previously described45, with minor modifications. OA-treated cells were resuspended in 20 mM HEPES (pH 7.6), 220 mM mannitol, 70 mM sucrose, 1 mM EDTA, supplemented with 1x cOmplete protease inhibitor (Roche) and 1x PhosStop (Roche). Following homogenisation with a dounce homogeniser, samples were pelleted for 5 min at 1,000 x g, 4 °C. The post-nuclear supernatant was centrifuged for 10 min at 10,000 x g, 4 °C, to pellet the mitochondrial fraction. Further purification of ubiquitinated integral mitochondrial membrane proteins was achieved by sodium carbonate treatment33,46. For this, mitochondrial pellets were resuspended in 100 mM sodium carbonate, incubated at 4 °C for 30 min with occasional vortexing, and then centrifuged for 30 min at 21,000 x g at 4 °C. The pellets were resuspended in 50 mM Tris pH 7.4 and centrifuged for 30 min at 21,000 x g at 4 °C to remove residual sodium carbonate.
Lbpro treatment of mitochondrial ubiquitin
Sodium carbonate-treated mitochondria were resuspended in 50 mM NaCl, 50 mM Tris (pH 8.0), 10 mM DTT containing 20 μM Lbpro and incubated overnight at 37 °C. Where indicated, 10 pmol of 15N-phospho-ubiquitin was spiked in to the sample to detect contaminating phosphatase activity. Membranes were pelleted at 21,000 x g for 30 min at 4 °C. The supernatant containing cleaved ubiquitin was further purified by perchloric acid extraction (see section below).
MS sample preparation of TUBE-purified ubiquitin
After purification and Lbpro cleavage, ubiquitin species were further purified by perchloric acid precipitation. Following cleavage, perchloric acid was slowly added to a final concentration of 0.5% (v/v). After incubation for 10 min on ice, the samples were centrifuged at 21,000 x g in a pre-cooled microcentrifuge. This step retained all GlyGly-modified ubiquitin and GlyGly-modified phospho-ubiquitin in the soluble fraction (data not shown). Unwanted precipitated proteins were pelleted at 21,000 x g for 10 min at 4 °C. The supernatant was removed, placed in a pre-soaked Slide-A-Lyzer MINI 3.5 K MWCO (cat. no. 69550) and dialyzed in 50 mM Tris pH 7.4 for 4 h, and subsequently ultra-pure water for 16h. Samples were then lyophilised and stored at -80 °C.
LC-MS of intact ubiquitin from cells
Ubiquitin was resuspended in 15 μL of reconstitution buffer (5% (v/v) acetonitrile, 0.1% (v/v) formic acid). Insoluble material was removed by centrifugation. The supernatant was transferred to a glass vial and placed in the auto-sampler. Using a Dionex Ultimate 3000 HPLC system (Thermo Fisher Scientific), 10 μL of the sample was loaded onto a C4 PepMap300 precolumn trap (Thermo Fisher Scientific) at a flow rate of 30 μL/min. Trapped proteins were eluted using an acetonitrile gradient (5-40%) over 45 min. Immediately prior to ionization, proteins were separated using an EASY-Spray C4 reverse-phase column (Thermo Fisher Scientific). Proteins were analysed on a Q Exactive mass spectrometer (Thermo Fisher Scientific). MS analysis was performed using the following settings: resolution, 140,000; AGC target, 3E6; maximum injection time, 200 ms; and scan range, 150-2,000 m/z.
LC-MS quantitation by peak integration
Raw files generated from LC-MS runs were analysed in Thermo Xcalibur Qual Browser version 2.2 (Thermo Fisher Scientific). The charge state of ubiquitin species with the highest intensity, corresponding to z= +12 and the nominal mass, i.e. the most naturally abundant 13C isotope, within this charge state were used for quantification. The masses used for quantitation are the following 705.22731 (unmodified), 714.73089 (1xGG), and 724.23446 (2xGG). The total ion current of each mass was integrated using a mass tolerance of 10 or 15 p.p.m.. Additional Qual Browser settings included the following: Gaussian smoothing enabled (15 points) and a mass precision of five decimal places.
PRM assays of branched ubiquitin
Branched ubiquitin molecules (i.e. ubiquitin with the addition of two GlyGly motifs and minus the C-terminal GlyGly amino acids) were isolated and fragmented in a Q Exactive mass spectrometer (Thermo Fisher Scientific). Ubiquitin with a mass-to-charge ratio of 724.24 was isolated in the quadrupole using an isolation window of 2 m/z and fragmented using the following settings: resolution, 17,500; AGC target, 1E5; maximum injection time, 120 ms; normalized collision energy, 28. Fragment ions were inspected manually using Thermo Xcalibur Qual Browser version 2.2, and assigned using Expert System 47.
Shotgun proteomics
Discovery proteomics assays were performed according to 48. In short, a Top10 analysis was performed on peptides generated from the purified monoubiquitin band, and precursor masses were screened using the following settings: mass range, 200-2000 m/z; resolution, 70,000, AGC target, 1E6; maximum ion trap time, 250 milliseconds; scan-type, positive. Data-dependent settings include the following: resolution, 17,500, AGC target, 5E4; maximum ion trap time, 80 milliseconds; isolation window, 2.0 m/z; collision energy, 28.0; data type, centroid; exclusion of unassigned charge states and masses with a charge state of 1. Dynamic exclusion enabled, 30 s. Raw files were searched and spectra assigned using SEQUEST against a human genome database (UniProt) in Proteome Discoverer (Thermo Scientific) with a false-discovery rate of 1%.
Extended Data
Extended Data Figure 1. Characterisation of Lbpro ubiquitin cleavage.
a, Representative raw spectrum of Lbpro-treated Lys48-linked diubiquitin (diUb) analysed by electrospray ionization MS. Two species arise due to internal cleavage of ubiquitin after Arg74. One scan is shown from analysis performed in triplicate. b, After 24 h of Lbprotreatment, diubiquitin was further supplemented with fresh Lbpro and incubated for an additional 24 h. There are no changes in ubiquitin band intensities, suggesting that Lbpro products are stable. Lys27 diubiquitin in this panel and in Fig. 1a was generated chemically from synthetically produced ubiquitin and was refolded; this generates a variable fraction of substrate that cannot be hydrolysed by DUBs, leading to apparent lower activity due to incomplete hydrolysis. Diubiquitin cleavage assays were performed in duplicate. c, Model of ubiquitin cleavage by Lbpro. Ubiquitin (green) was modelled based on the crystal structure of Lbpro (blue) bound to the C-terminal domain of ISG15 (PDB-id 6FFA, 19). A close-up view shows the C-terminus of ubiquitin placed across the active site, enabling cleavage between Arg74 and Gly75.
Extended Data Figure 2. Engineered Lbpro has enhanced activity against ubiquitin.
a, Left, structural model of ubiquitin-bound Lbpro as in Extended Data Fig. 1c with ubiquitin under a green surface. Top right, close-up view of the ubiquitin Ile44 patch (Leu8, Ile44, His68, Val70) and its predicted interactions with Lbpro. Differences in the equivalent surface in ISG15 explain its higher affinity 19. Bottom right, modeling of an improved hydrophobic contact between Lbpro and ubiquitin. The corresponding L102W Lbpro mutant is denoted as Lbpro*. b, Diubiquitin cleavage assays, as in Fig. 1a. The cleavage of each diubiquitin (diUb) linkage type was compared for Lbproand Lbpro*. Assays were performed in duplicate. c, Example ubiquitin-KG-TAMRA cleavage assays comparing Lbpro (left) and Lbpro*(right), the difference in polarization relative to a substrate-only negative control is shown. The average trace of assays performed in technical triplicate is shown. TAMRA-KG represents a cleaved product positive control. d, Catalytic efficiencies derived from two independent sets of ubiquitin-KG-TAMRA cleavage measurements as in c. Slope and errors values derived from linear regression are reported for each replicate individually. Fold improvement of Lbpro* over Lbpro in catalytic efficiency towards this substrate is indicated. e, Example diubiquitin K63-FlAsH cleavage assays as in c. f, Catalytic efficiencies derived from two independent sets of diubiquitin K63-FlAsH cleavage measurements as in e. Slope and errors values derived from linear regression are reported for each replicate individually. Fold improvement of Lbpro* over Lbpro in catalytic efficiency towards this substrate is indicated. The REP1 [Lbpro] = 7.81μM data point has been excluded, as reliable exponential decay parameters could not be fitted for this point. g, Branched ubiquitin cleavage assays. Three different branched ubiquitin chains (Lys6/Lys48; Lys11/Lys48; Lys11/Lys63, described in 49) were used in Lbproand Lbpro* cleavage assays. Assays were performed in triplicate. h, Catalytic efficiencies derived from gel-based analysis of three independent Lys6/Lys48 branched triubiquitin cleavage assays performed at three different enzyme concentrations. Fold improvement of Lbpro* over Lbpro in catalytic efficiency towards this substrate is indicated. Centred values correspond to the mean of independent experiments performed in triplicate. Error values represent s.d. from the mean. Slope and errors values derived from linear regression based on the mean values are reported. For gel source data, see Supplementary Fig. 1.
Extended Data Figure 3. Lbpro cleavage of ubiquitin chains from in vitro assembly reactions.
To test the activity of Lbpro on different chain topologies, ubiquitin chain assembly systems that produce a variety of chain types in vitro were analysed using Ub-clipping. Cleavage of polyubiquitin by Lbpro was followed by SDS-PAGE with silver staining and anti-ubiquitin Western blotting (top), and the produced monoubiquitin band was excised from a Coomassie stained gel and analysed by trypsin digest and AQUA MS (bottom). Gel-based assays were performed in duplicate and AQUA MS was performed in technical duplicate. N.D., not detected. a, The bacterial HECT-like E3 ligase NleL was used with UBE2L3 and ubiquitin K48R to produce Lys6-linked chains39. b, The E2 enzyme UBE2S lacking the C-terminal Lys-rich sequence (UBE2S ΔC) assembles predominantly Lys11 linkages38. c, The HECT E3 ligase AREL1 with UBE2L3 assembles Lys11-, Lys33- and Lys48-linked polyubiquitin37. d, Reaction with NleL/UBE2L3 as in a but using a ubiquitin K6R mutant39. e, The HECT E3 ligase NEDD4L assembles Lys63-linked polyubiquitin50. Also see Extended Data Fig. 5a. f, The RBR E3 ligase HOIP assembles Met1-linked polyubiquitin51.
Extended Data Figure 4. Characterisation of branched ubiquitin chains with Ub-clipping.
a, Quantitative intact mass analysis for a branched triubiquitin, in which one ubiquitin moiety is modified on both Lys11 and Lys48 (ref. 49). Lbpro cleavage generates the expected ratio of 1:2 for double-GlyGly and unmodified ubiquitin species. Intact MS analysis was performed in triplicate. b, In vitro assembly reactions from Fig. 2b and 2c. Experiments were performed in triplicate. c, Isotopic distribution of unmodified and different GlyGly-modified ubiquitin species from a Lbpro-treated TRAF6 assembly reaction with UBE2D3 (see b and Fig. 2b). Select spectra are shown from experiments performed in triplicate. d, Intact MS analysis of in vitro TRAF6 assembly reactions from b. Samples were separated by liquid chromatography (LC) prior to MS analysis and spectra deconvolution. LC-MS allowed for the detection of a ubiquitin species with four GlyGly modifications. These experiments were performed three independent times with similar results. e, LC-MS parallel reaction monitoring (PRM) analysis of double-GlyGly-modified ubiquitin as produced by TRAF6 in b, to confirm complete clipping of the C-terminal GlyGly by Lbpro. Green, y ions; red, b ions; purple, internal ions; yellow, neutral loss ions. Experiments were performed in triplicate.
Extended Data Figure 5. TUBE-purified ubiquitin from in vitro assembly reactions.
a, NEDD4L-assembled polyubiquitin chains (see Extended Data Fig. 3e) were purified by GST-TUBE pull-downs (left) and treated with Lbpro(right). TUBE pull-down enriches chains and removes mono- and short polyubiquitin from the reaction (left, bound), and Lbprocleaves TUBE-bound ubiquitin as monitored by anti-ubiquitin Western blots. Experiments were performed in triplicate. b, As in a, using NleL for an E3 ligase known to make branched polyubiquitin39. Coomassie-stained assays were performed in triplicate and Western blots in duplicate. c, Intact MS analysis of samples from a shows relative amounts of each identified ubiquitin species. A ratio of 3:1 for GlyGly-modified vs. unmodified ubiquitin from the NEDD4L-assembled polyubiquitin smear suggests that the average chain length in the reaction is four ubiquitin molecules. d, Samples from b were analysed as in c. A significant fraction of branched ubiquitin suggests that a large percentage of all chains in the reaction are branched. Relative quantities of roughly 2:5:1 for unmodified vs. GlyGly-modified vs. double-GlyGly modified ubiquitin lead to potential ubiquitinated species including the one depicted schematically. The caveat with this model is that chains in the reaction account for a range of lengths. Assays from c and d were performed in duplicate.
Extended Data Figure 6. Characterisation of Ub-clipping in cells.
a, b Whole cell lysates of (a) HeLa or (b) HEK293 cells were treated with Lbproand analysed by anti-ubiquitin Western blots (compare Fig. 3a). Experiments were performed in triplicate. c, Assessment of endogenous ubiquitin ligase or deubiquitinase activity during Lbpro treatment. HEK293 and HeLa lysates were incubated with fluorescently labelled monoubiquitin, Lys11-linked diubiquitin, and Lys48-linked diubiquitin for the indicated time points. Despite being competent for ligation and susceptible to DUB cleavage (left panel), after 24 h incubation there was no visible DUB or ligase activity, even at high exposures (right panels). This experiment was performed in triplicate. d, Workflow of Lbpro ubiquitin purifications from whole cell lysates. e, Recovery of monoubiquitin after precipitation (dialysis in water) as shown in workflow from d. Western blots were performed on one of three experiments. f, Representative purification of ubiquitin from HCT116 cells. Samples were analysed by intact MS enabled by lack of background protein. These experiments were performed three independent times with similar results. g, Ubiquitin purified from HeLa and HEK293 cells in this manner (see c-e) was analysed by AQUA MS. A representative example of experiments performed in triplicate is shown. Relative amounts of ubiquitin chain linkages are very similar to whole-cell lysate tryptic digests23. N.D., not detected. h, Lbpro-generated monoubiquitin bands purified as in e were excised and analysed using a shotgun proteomics approach to identify contaminant proteins. Experiments were performed in triplicate.
Extended Data Figure 7. Intact mass spectrometry and PRM analysis of Lbpro-treated whole cell lysates.
a, Deconvolution of intact MS spectra for ubiquitin from HEK293 (left) and HeLa (right) cells, as in Fig. 3c. b-d, Parallel reaction monitoring (PRM) assay of branched ubiquitin isolated from HCT116 (b), HEK293 (c), and HeLa (d) cells. The mass corresponding to a +12 charge state of branched species (2xGG) was isolated and fragmented. Products ions are assigned to the amino acid sequence of ubiquitin, and coloured as in Extended Data Fig. 4e. This control shows that the double-GlyGly-modified ubiquitin originates from a branched species and not from single-GlyGly-modified ubiquitin with an intact C-terminus. All experiments were performed three times independently with similar results.
Extended Data Figure 8. Characterisation of TUBE pull-downs from cells.
a, b Efficiency of polyubiquitin depletion by TUBE pull-down from (a) HeLa and (b) HEK293 cells. Prior to the addition of the glutathione affinity resin, an input sample was taken (lysate). Samples of the supernatant after incubation with the affinity resin and of the beads after washing with PBS were analysed by ubiquitin Western blotting. Experiments in a and b were performed in triplicate. c, Intact MS analysis of TUBE-purified ubiquitin species. The isotopic distribution of the charge state z = +12 is shown. Distinct GlyGly-modified samples are easily distinguishable by mass. d, Peak integration of each ubiquitin species’ nominal mass (unmodified, 1xGG, 2xGG) from LC-MS analysis. Distinct GlyGly-modified samples are also distinguishable by chromatographic behaviour. Experiments in c and d were performed in triplicate. Results are consistent with previous data using limited trypsinolysis18; we consistently identified ~2-3% more branched ubiquitin, possibly due to differences in ubiquitin enrichment strategies or owing to partial digestion of ubiquitin by trypsin. e, Data from HeLa cells (Fig. 3f), when applied to a finite pool of 10 ubiquitin moieties, correspond roughly to a collection of 4 x unmodified ubiquitin (white), 5 x GlyGly modified ubiquitin (green) and 1 x double-GlyGly modified, branch-point ubiquitin. With these ratios multiple distinct species can be assembled, some of which are depicted. It is clear that a single branch-point ubiquitin in this case requires 3 of the 10 ubiquitin molecules (i.e. 30%) to be in a branched chain. This number can be higher if the branched chain also incorporates mono-GlyGly-modified species. For expanded systems (with e.g. double the number of ubiquitins, and 2 x double-GlyGly-modified ubiquitin) this number can also be lower when e.g. multiple branched species exist in the same polymer (in which case a chain can be built from 5 out of 20 ubiquitin molecules, i.e. 25% of ubiquitin is in branched architectures). More definitive assessments of individual architectures would be possible once individual lengths of chains, e.g. tetra-ubiquitin, could be analysed with this method. Centred values correspond to the mean of independent experiments performed in triplicate. Error values represent s.d. from the mean.
Extended Data Figure 9. Cleavage efficiency of phospho-polyubiquitin chains and MS analysis of Parkin assembly reactions.
a, In vitro assemblies of polyubiquitin from ubiquitin and Ser65 phospho-ubiquitin using cIAP1 and UBE2D3 as previously described11, and their cleavage by Lbpro. Cleavage efficiency was visualised by Coomassie staining. Experiments were independently performed in duplicate with similar results. b, Samples from a visualised by anti-ubiquitin Western blotting. Experiments were independently performed in duplicate with similar results. c, Polyubiquitin assembled by Ser65-phosphorylated human Parkin (pParkin) with UBE2L3 was purified by GST-TUBE pull-downs. Assembly reactions were performed in the absence (-) and presence (+) of 10% total phospho-ubiquitin. Experiments were performed in triplicate. d, TUBE-purified Parkin reactions from c were analysed by AQUA MS to determine chain linkage composition. A representative example of experiments performed in triplicate is shown. e, Lbpro-treated Parkin assembly reactions were analysed by intact MS and spectra deconvolution. A small phospho-ubiquitin contamination is present due to residual PINK1 kinase in the assembly reactions. In these assays, Parkin predominantly assembles monoubiquitin and short chains. Intact MS analysis was performed in duplicate. f, In order to detect a non-ubiquitin substrate with multiple GlyGly modifications by intact mass spectrometry, in vitro assemblies were performed as per e in the absence of phospho-Ub, and with a higher UBE2L3 concentration to facilitate the analysis of UBE2L3. Lbpro-treated assemblies were analysed by LC-MS, revealing up to four GlyGly modifications on a single UBE2L3 molecule. Inset: the distribution of GlyGly-modified UBE2L3 in the +21 charge state. The experiment was performed in triplicate.
Extended Data Figure 10. Characterisation of Parkin over-expression cells.
a, Experiments were performed with doxycycline-inducible HeLa Flp-In T-REx cells expressing Parkin proteins (a kind gift from Alban Ordureau and Wade Harper, Harvard). Cells were treated with 0.1 μg/mL doxycycline for 16 h and Parkin expression monitored by anti-Parkin Western blots. Western blots were performed on one of three independent experiments. b, TUBE enrichment of polyubiquitin from a after CCCP treatment. Also see Fig. 4a. Western blots were performed on one of three independent experiments. c, Top, AQUA analysis for total ubiquitin, ubiquitin chains, and phospho-ubiquitin using TUBE pull-downs from CCCP-treated Parkin over-expression cell lines (see a-b, Fig. 4a). TUBE-purified ubiquitin chains were treated with Lbpro*, separated by SDS-PAGE, and the monoubiquitin band excised and subjected to AQUA MS analysis. Bottom, the percentages calculated from the top panel. Values correspond to the mean of independent experiments performed in triplicate. Error values represent s.d. from the mean. d, Quantitation of ubiquitin species from the Parkin S65A cell line, as in Fig. 4d. N.D., not detected. Centred values correspond to the mean of independent experiments performed in triplicate. Error values represent s.d. from the mean. e, Sodium carbonate (Na2CO3) treatment of mitochondria and Lbpro cleavage assays. Addition of Na2CO3 releases peripheral mitochondria membrane proteins and unconjugated free monoubiquitin. Untreated and Na2CO3-treated mitochondria were digested with Lbpro for 2.5 h at 37°C. After incubation for 2.5 h, the supernatant (S) and pellet (P) were analysed by anti-ubiquitin Western blots. Without Na2CO3, incubation at 37°C releases ubiquitin from mitochondria into the supernatant, presumably due to residual DUB activity. Western blots were performed on one of three experiments. f, Left and middle, identification of non-ubiquitinated phospho-ubiquitin by intact MS analysis from Lbpro-treated samples in e. The isotopic distribution of the charge state z = +12 is shown for Parkin WT and Parkin C431S cell lines. Right, the fold-increase in phospho-ubiquitin comparing Parkin C431S and WT cell lines, as measured by spectra deconvolution. A significant amount (10% of total) phospho-ubiquitin can be detected with this method in cells expressing inactive Parkin. Centred values correspond to the mean of independent experiments performed in triplicate. g, To exclude the possibility of contaminating phosphatase activity during incubation with Lbpro, sodium carbonate-extracted mitochondrial samples were treated as in Fig. 4h and spiked with 15N-labelled phospho-ubiquitin, and formation of 15N-labelled unphosphorylated ubiquitin was monitored. As indicated, no detectable formation of a 15N-labelled unphosphorylated ubiquitin species was observed after overnight incubation with Lbpro. Experiments were performed in biological triplicate. h, As in Extended Data Fig. 8e, the data from Fig. 4h is applied to a pool of 20 ubiquitin molecules, in which eight are unmodified, five are GlyGly-modified, one is double-GlyGly modified, and six are phosphorylated. This simplified system would allow for a distribution of chains as depicted schematically, and would indicate that chains on mitochondria are short and phosphorylated on the tips of the chain. Recent site occupancy mapping, performed in the same cell system32, revealed abundant ubiquitination sites in particular on VDAC proteins, allowing us to model the ubiquitin coat during mitophagy, as depicted. Centred values correspond to the mean of independent experiments performed in triplicate. Error values represent s.d. from the mean.
Supplementary Material
Acknowledgments
We thank Mark Skehel, Sarah Maslen (MRC LMB), Andrew Webb (WEHI), Wade Harper and Alban Ordureau (Harvard) for reagents, help and discussion on mass spectrometry, and members of the DK lab for reagents and discussions. This work was supported by the Medical Research Council [U105192732], the European Research Council [724804], the Lister Institute for Preventive Medicine (DK), and P 24038 and P 28183 grants from the Austrian Science Fund (TS). JU is funded by a Gates Cambridge Scholarship.
Footnotes
Data Availability Statement
All data have been deposited to the Mass Spectrometry Interactive Virtual Environment (MassIVE) (ftp://MSV000083662@massive.ucsd.edu). Source data for all gels have been included in Supplementary Figure 1. Data to regenerate any graph and described reagents can be obtained upon reasonable request from the corresponding author. Plasmids for Lbpro and Lbpro L102W are available from Addgene.
Author contribution
K.N.S. conceived and designed the study, performed most experiments, interpreted results, and wrote the manuscript. J.L.U. performed mitochondrial experiments, and helped annotate fragmentation patterns of branched ubiquitin, and performed control experiments. A.F.K. helped perform the quantitation of ubiquitin species from whole cell lysates. C.G. contributed to kinetic characterization of Lbpro*. T.E.T.M. provided critical reagents. J.N.P. contributed to characterization of Lbpro and Lbpro*, and provided structural and ubiquitin biology expertise. T.S. provided Lbpro, protocols, and acquired funding. D.K. conceived and designed the study, interpreted results, wrote the manuscript, and acquired funding.
Conflict of Interest Statement
The authors declare no competing interests.
References
- 1.Komander D, Rape M. The ubiquitin code. Annu Rev Biochem. 2012;81:203–229. doi: 10.1146/annurev-biochem-060310-170328. [DOI] [PubMed] [Google Scholar]
- 2.Swatek KN, Komander D. Ubiquitin modifications. Cell Res. 2016;26:399–422. doi: 10.1038/cr.2016.39. [DOI] [PMC free article] [PubMed] [Google Scholar]
- 3.Yau R, Rape M. The increasing complexity of the ubiquitin code. Nature Cell Biology. 2016;18:579–586. doi: 10.1038/ncb3358. [DOI] [PubMed] [Google Scholar]
- 4.Ordureau A, Münch C, Harper JW. Quantifying ubiquitin signaling. Mol Cell. 2015;58:660–676. doi: 10.1016/j.molcel.2015.02.020. [DOI] [PMC free article] [PubMed] [Google Scholar]
- 5.Kim W, et al. Systematic and quantitative assessment of the ubiquitin-modified proteome. Mol Cell. 2011;44:325–340. doi: 10.1016/j.molcel.2011.08.025. [DOI] [PMC free article] [PubMed] [Google Scholar]
- 6.Wagner SA, et al. A proteome-wide, quantitative survey of in vivo ubiquitylation sites reveals widespread regulatory roles. Mol Cell Proteomics. 2011;10 doi: 10.1074/mcp.M111.013284. M111.013284. [DOI] [PMC free article] [PubMed] [Google Scholar]
- 7.Peng J, et al. A proteomics approach to understanding protein ubiquitination. Nat Biotechnol. 2003;21:921–926. doi: 10.1038/nbt849. [DOI] [PubMed] [Google Scholar]
- 8.Kirkpatrick DS, et al. Quantitative analysis of in vitro ubiquitinated cyclin B1 reveals complex chain topology. Nature Cell Biology. 2006;8:700–710. doi: 10.1038/ncb1436. [DOI] [PubMed] [Google Scholar]
- 9.Phu L, et al. Improved quantitative mass spectrometry methods for characterizing complex ubiquitin signals. Mol Cell Proteomics. 2010 doi: 10.1074/mcp.M110.003756. [DOI] [PMC free article] [PubMed] [Google Scholar]
- 10.Ordureau A, et al. Quantitative Proteomics Reveal a Feedforward Mechanism for Mitochondrial PARKIN Translocation and Ubiquitin Chain Synthesis. Mol Cell. 2014;56:360–375. doi: 10.1016/j.molcel.2014.09.007. [DOI] [PMC free article] [PubMed] [Google Scholar]
- 11.Wauer T, et al. Ubiquitin Ser65 phosphorylation affects ubiquitin structure, chain assembly and hydrolysis. EMBO J. 2015;34:307–325. doi: 10.15252/embj.201489847. [DOI] [PMC free article] [PubMed] [Google Scholar]
- 12.Ohtake F, et al. Ubiquitin acetylation inhibits polyubiquitin chain elongation. EMBO Rep. 2015;16:192–201. doi: 10.15252/embr.201439152. [DOI] [PMC free article] [PubMed] [Google Scholar]
- 13.Swaney DL, Rodríguez-Mias RA, Villén J. Phosphorylation of ubiquitin at Ser65 affects its polymerization, targets, and proteome-wide turnover. EMBO Rep. 2015;16:1131–1144. doi: 10.15252/embr.201540298. [DOI] [PMC free article] [PubMed] [Google Scholar]
- 14.Xu P, Peng J. Characterization of polyubiquitin chain structure by middle-down mass spectrometry. Anal Chem. 2008;80:3438–3444. doi: 10.1021/ac800016w. [DOI] [PMC free article] [PubMed] [Google Scholar]
- 15.Valkevich EM, Sanchez NA, Ge Y, Strieter ER. Middle-down mass spectrometry enables characterization of branched ubiquitin chains. Biochemistry. 2014;53:4979–4989. doi: 10.1021/bi5006305. [DOI] [PMC free article] [PubMed] [Google Scholar]
- 16.Hospenthal MK, Mevissen TET, Komander D. Deubiquitinase-based analysis of ubiquitin chain architecture using Ubiquitin Chain Restriction (UbiCRest) Nat Protoc. 2015;10:349–361. doi: 10.1038/nprot.2015.018. [DOI] [PMC free article] [PubMed] [Google Scholar]
- 17.Yau RG, et al. Assembly and Function of Heterotypic Ubiquitin Chains in Cell-Cycle and Protein Quality Control. Cell. 2017;171:918–933.e20. doi: 10.1016/j.cell.2017.09.040. [DOI] [PMC free article] [PubMed] [Google Scholar]
- 18.Crowe SO, Rana ASJB, Deol KK, Ge Y, Strieter ER. Ubiquitin Chain Enrichment Middle-Down Mass Spectrometry Enables Characterization of Branched Ubiquitin Chains in Cellulo. Anal Chem. 2017;89:4428–4434. doi: 10.1021/acs.analchem.6b03675. [DOI] [PMC free article] [PubMed] [Google Scholar]
- 19.Swatek KN, et al. Irreversible inactivation of ISG15 by a viral leader protease enables alternative infection detection strategies. Proceedings of the National Academy of Sciences. 2018;115:2371–2376. doi: 10.1073/pnas.1710617115. [DOI] [PMC free article] [PubMed] [Google Scholar]
- 20.Steinberger J, Skern T. The leader proteinase of foot-and-mouth disease virus: structure-function relationships in a proteolytic virulence factor. Biol Chem. 2014;395:1179–1185. doi: 10.1515/hsz-2014-0156. [DOI] [PMC free article] [PubMed] [Google Scholar]
- 21.David Y, Ziv T, Admon A, Navon A. The E2 Ubiquitin-conjugating Enzymes Direct Polyubiquitination to Preferred Lysines. J Biol Chem. 2010;285:8595–8604. doi: 10.1074/jbc.M109.089003. [DOI] [PMC free article] [PubMed] [Google Scholar]
- 22.Hjerpe R, et al. Efficient protection and isolation of ubiquitylated proteins using tandem ubiquitin-binding entities. EMBO Rep. 2009;10:1250–1258. doi: 10.1038/embor.2009.192. [DOI] [PMC free article] [PubMed] [Google Scholar]
- 23.Dammer EB, et al. Polyubiquitin linkage profiles in three models of proteolytic stress suggest the etiology of Alzheimer disease. J Biol Chem. 2011;286:10457–10465. doi: 10.1074/jbc.M110.149633. [DOI] [PMC free article] [PubMed] [Google Scholar]
- 24.Elia AEH, et al. Quantitative Proteomic Atlas of Ubiquitination and Acetylation in the DNA Damage Response. Mol Cell. 2015;59:867–881. doi: 10.1016/j.molcel.2015.05.006. [DOI] [PMC free article] [PubMed] [Google Scholar]
- 25.Kaiser SE, et al. Protein standard absolute quantification (PSAQ) method for the measurement of cellular ubiquitin pools. Nat Methods. 2011;8:691–696. doi: 10.1038/nmeth.1649. [DOI] [PMC free article] [PubMed] [Google Scholar]
- 26.Harper JW, Ordureau A, Heo J-M. Building and decoding ubiquitin chains for mitophagy. Nat Rev Mol Cell Biol. 2018;19:93–108. doi: 10.1038/nrm.2017.129. [DOI] [PubMed] [Google Scholar]
- 27.Pickles S, Vigié P, Youle RJ. Mitophagy and Quality Control Mechanisms in Mitochondrial Maintenance. Curr Biol. 2018;28:R170–R185. doi: 10.1016/j.cub.2018.01.004. [DOI] [PMC free article] [PubMed] [Google Scholar]
- 28.Sarraf SA, et al. Landscape of the PARKIN-dependent ubiquitylome in response to mitochondrial depolarization. Nature. 2013;496:372–376. doi: 10.1038/nature12043. [DOI] [PMC free article] [PubMed] [Google Scholar]
- 29.Ordureau A, et al. Defining roles of PARKIN and ubiquitin phosphorylation by PINK1 in mitochondrial quality control using a ubiquitin replacement strategy. Proceedings of the National Academy of Sciences. 2015;112:6637–6642. doi: 10.1073/pnas.1506593112. [DOI] [PMC free article] [PubMed] [Google Scholar]
- 30.Durcan TM, et al. USP8 regulates mitophagy by removing K6-linked ubiquitin conjugates from parkin. EMBO J. 2014;33:2473–2491. doi: 10.15252/embj.201489729. [DOI] [PMC free article] [PubMed] [Google Scholar]
- 31.Cunningham CN, et al. USP30 and parkin homeostatically regulate atypical ubiquitin chains on mitochondria. Nature Cell Biology. 2015;17:160–169. doi: 10.1038/ncb3097. [DOI] [PubMed] [Google Scholar]
- 32.Ordureau A, et al. Dynamics of PARKIN-Dependent Mitochondrial Ubiquitylation in Induced Neurons and Model Systems Revealed by Digital Snapshot Proteomics. Mol Cell. 2018;70:211–227.e8. doi: 10.1016/j.molcel.2018.03.012. [DOI] [PMC free article] [PubMed] [Google Scholar]
- 33.Fujiki Y, Hubbard AL, Fowler S, Lazarow PB. Isolation of intracellular membranes by means of sodium carbonate treatment: application to endoplasmic reticulum. J Cell Biol. 1982;93:97–102. doi: 10.1083/jcb.93.1.97. [DOI] [PMC free article] [PubMed] [Google Scholar]
- 34.Gersch M, et al. Mechanism and regulation of the Lys6-selective deubiquitinase USP30. Nat Struct Mol Biol. 2017;510:370–930. doi: 10.1038/nsmb.3475. [DOI] [PMC free article] [PubMed] [Google Scholar]
- 35.Guarné A, et al. Structure of the foot-and-mouth disease virus leader protease: a papain-like fold adapted for self-processing and eIF4G recognition. EMBO J. 1998;17:7469–7479. doi: 10.1093/emboj/17.24.7469. [DOI] [PMC free article] [PubMed] [Google Scholar]
- 36.Wauer T, Simicek M, Schubert AF, Komander D. Mechanism of phospho-ubiquitin-induced PARKIN activation. Nature. 2015;524:370–374. doi: 10.1038/nature14879. [DOI] [PMC free article] [PubMed] [Google Scholar]
- 37.Michel MA, et al. Assembly and specific recognition of k29- and k33-linked polyubiquitin. Mol Cell. 2015;58:95–109. doi: 10.1016/j.molcel.2015.01.042. [DOI] [PMC free article] [PubMed] [Google Scholar]
- 38.Bremm A, Freund SMV, Komander D. Lys11-linked ubiquitin chains adopt compact conformations and are preferentially hydrolyzed by the deubiquitinase Cezanne. Nat Struct Mol Biol. 2010;17:939–947. doi: 10.1038/nsmb.1873. [DOI] [PMC free article] [PubMed] [Google Scholar]
- 39.Hospenthal MK, Freund SMV, Komander D. Assembly, analysis and architecture of atypical ubiquitin chains. Nat Struct Mol Biol. 2013;20:555–565. doi: 10.1038/nsmb.2547. [DOI] [PMC free article] [PubMed] [Google Scholar]
- 40.Keusekotten K, et al. OTULIN antagonizes LUBAC signaling by specifically hydrolyzing Met1-linked polyubiquitin. Cell. 2013;153:1312–1326. doi: 10.1016/j.cell.2013.05.014. [DOI] [PMC free article] [PubMed] [Google Scholar]
- 41.Gladkova C, Maslen SL, Skehel JM, Komander D. Mechanism of parkin activation by PINK1. Nature. 2018;559:410–414. doi: 10.1038/s41586-018-0224-x. [DOI] [PMC free article] [PubMed] [Google Scholar]
- 42.Mevissen TET, et al. OTU Deubiquitinases Reveal Mechanisms of Linkage Specificity and Enable Ubiquitin Chain Restriction Analysis. Cell. 2013;154:169–184. doi: 10.1016/j.cell.2013.05.046. [DOI] [PMC free article] [PubMed] [Google Scholar]
- 43.Schubert AF, et al. Structure of PINK1 in complex with its substrate ubiquitin. Nature. 2017;552:51–56. doi: 10.1038/nature24645. [DOI] [PMC free article] [PubMed] [Google Scholar]
- 44.Komander D, et al. The structure of the CYLD USP domain explains its specificity for Lys63-linked polyubiquitin and reveals a B box module. Mol Cell. 2008;29:451–464. doi: 10.1016/j.molcel.2007.12.018. [DOI] [PubMed] [Google Scholar]
- 45.Lazarou M, McKenzie M, Ohtake A, Thorburn DR, Ryan MT. Analysis of the assembly profiles for mitochondrial- and nuclear-DNA-encoded subunits into complex I. Mol Cell Biol. 2007;27:4228–4237. doi: 10.1128/MCB.00074-07. [DOI] [PMC free article] [PubMed] [Google Scholar]
- 46.Fujiki Y, Fowler S, Shio H, Hubbard AL, Lazarow PB. Polypeptide and phospholipid composition of the membrane of rat liver peroxisomes: comparison with endoplasmic reticulum and mitochondrial membranes. J Cell Biol. 1982;93:103–110. doi: 10.1083/jcb.93.1.103. [DOI] [PMC free article] [PubMed] [Google Scholar]
- 47.Neuhauser N, Michalski A, Cox J, Mann M. Expert system for computer-assisted annotation of MS/MS spectra. Mol Cell Proteomics. 2012;11:1500–1509. doi: 10.1074/mcp.M112.020271. [DOI] [PMC free article] [PubMed] [Google Scholar]
- 48.Michel MA, Swatek KN, Hospenthal MK, Komander D. Ubiquitin Linkage-Specific Affimers Reveal Insights into K6-Linked Ubiquitin Signaling. Mol Cell. 2017;68:233–246.e5. doi: 10.1016/j.molcel.2017.08.020. [DOI] [PMC free article] [PubMed] [Google Scholar]
- 49.Mevissen TET, et al. Molecular basis of Lys11-polyubiquitin specificity in the deubiquitinase Cezanne. Nature. 2016;538:402–405. doi: 10.1038/nature19836. [DOI] [PMC free article] [PubMed] [Google Scholar]
- 50.Maspero E, et al. Structure of a ubiquitin-loaded HECT ligase reveals the molecular basis for catalytic priming. Nat Struct Mol Biol. 2013;20:696–701. doi: 10.1038/nsmb.2566. [DOI] [PubMed] [Google Scholar]
- 51.Kirisako T, et al. A ubiquitin ligase complex assembles linear polyubiquitin chains. EMBO J. 2006;25:4877–4887. doi: 10.1038/sj.emboj.7601360. [DOI] [PMC free article] [PubMed] [Google Scholar]
Associated Data
This section collects any data citations, data availability statements, or supplementary materials included in this article.


