Abstract
Here an adaptive real-time 3D single particle tracking method proposed which is capable of capturing these heterogeneous dynamics. Using a real-time measurement of a rapidly diffusing particle’s positional variance, the 3D Precision Adaptive Real-time Tracking (3D-PART) microscope adjusts active-feedback parameters to trade tracking speed for precision on demand. This technique is demonstrated first on immobilized fluorescent nanoparticles, with a greater than two-fold increase in the lateral localization precision (~25 to ~11 nm at 1 msec sampling) as well as a smaller increase in the axial localization precision (~ 68 nm to ~ 45 nm). 3D-PART also shows a marked increase in the precision when tracking freely diffusing particles, with lateral precision increasing from ~100 nm to ~ 70 nm for particles diffusing at 4 μm2/s, although with a sacrifice in the axial precision (~250 nm to ~350 nm). This adaptive microscope is then applied to monitoring the viral first contacts of virus-like particles to the surface of live cells, allowing direct and continuous measurement of the viral particle at initial contact with the cell surface.
Keywords: real-time single particle tracking, adaptive methods, virus tracking, three-dimensional microscopy
Graphical Abstract:
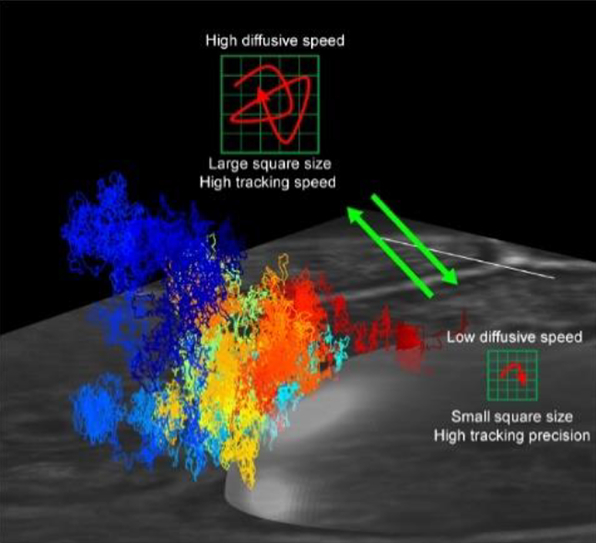
An adaptive real-time 3D single particle tracking method is designed and implemented for capturing the heterogeneous dynamics of single particles with high spatiotemporal resolution. The tracking precision is adaptively adjusted with the diffusive speed of particle in real time. This adaptive microscope then is applied to monitoring viral landing events at the cell membrane, allowing direct and continuous measurement of the viral particle at first contact with the cell surface.
1. Introduction
Dynamic processes in biological systems cover vast spatiotemporal scales in three-dimensions, making observation with traditional live cell imaging methods challenging. The challenge arises from the isotropic nature of 3D imaging, wherein each voxel is sampled for an even amount of time. As a result, the temporal resolution with which a process can be sampled is dictated by the volumetric imaging rate, and as a consequence, the size of the volume required to image the process. For example, if a process is evaluated with a confocal microscope with 512×512×16 voxels, with a pixel dwell time of 1 μs, the process will only be sampled every 4 seconds. However, many processes of interest, even if moving rapidly, only occupy one voxel at any given instant, meaning that if only that voxel were sampled (effectively a 1×1×1 volume), the temporal precision would be limited only by the photon collection rate. In this situation, sub-millisecond temporal resolution is achievable even at the single-molecule level. A method which can do just this and overcome the isotropic imaging barrier to capture the dynamics of fast 3D processes is real-time 3D single particle tracking (RT-3D-SPT).[1] RT-3D-SPT is an increasingly useful tool to monitor biological processes which span large axial (depth) ranges or exhibit dynamics on timescales faster than the exposure time of cameras used in live cell imaging. By using optical feedback, a single probe can be locked relative to the center of the objective focal volume, enabling continuous observation of dynamic processes, with sensitivity down to the single-molecule level.[2] RT-3D-SPT has been used to capture photon statistics of freely diffusing quantum dots,[1f] the landing of nanoscale particles on the cell surface[1j] and even monitor hybridization kinetics of short DNA strands in solution.[2c] An under-examined drawback of RT-3D-SPT, which precludes its expansion to relevant biological measurements, is the intrinsic tradeoff between the speed of the process that can be captured and the localization precision. In RT-3D-SPT methods, feedback is applied using a piezoelectric stage or galvanic mirror and some form of feedback control (most commonly PID). Responding to the fast motions of quickly diffusing objects requires (1) a larger observation volume and (2) more aggressive feedback response. The more aggressive response leads to overshoot of the particle’s position by the feedback loop, which behaves as a damped oscillator. Large feedback parameters enable tracking of high-speed processes but lead to a decrease in localization precision due to overshoot and integral windup. Reduction in the feedback parameters can improve the localization precision, but at the expense of tracking speed and robustness. This has been observed in previous work, where the feedback parameters which optimized high-speed tracking were not the same as those that optimized localization precision.[1i] In effect the diffusivity of the tracked particle must be accounted for in advance and suitable feedback control parameters set before the experiment starts. This conflict limits the application of RT-3D-SPT in systems to which it should be very well suited. As an example, consider the binding of extracellular particles (such as viruses) to the cell surface.[3] Since the extracellular motion of particles is fast and long range in three dimensions, observation of viral particles prior to binding with camera or confocal based tracking methods is difficult if not impossible. While RT-3D-SPT would be the obvious choice for observing the transition between extracellular diffusion and binding to the cell surface, the requirement that the feedback parameters be optimized a priori to a certain diffusion coefficient means that a choice has to be made between being able to follow the fast diffusion before the binding event and being able to follow the diffusion after the event with high precision. To address this conflict, we have developed an adaptive real-time 3D single particle tracking microscope which adapts its tracking behavior to the real-time diffusive behavior of the target-locked probe. This enables the microscope to adapt to transitions in the diffusive state in real-time without adjusting the parameters in advance.
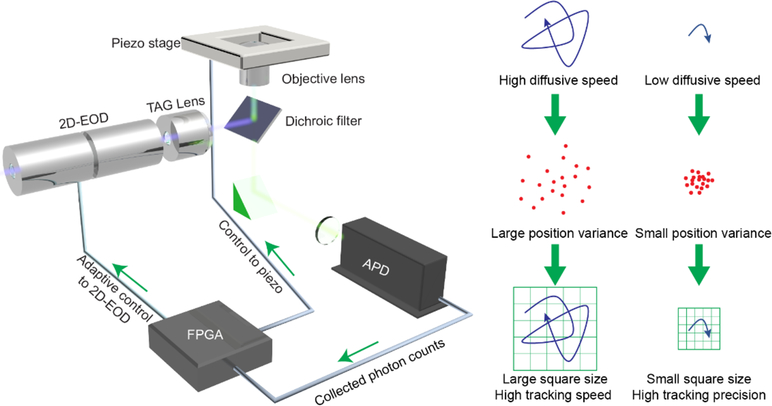
This adaptive microscope, called 3D Precision Adaptive Real-time Tracking (3D-PART), is based on the recently developed 3D-DyPLoT.[1i, 4] 3D-DyPLoT uses a rapidly scanning laser spot over a small area (1 μm × 1 μm × 2 μm, XYZ) around the focal volume to estimate the diffusing particle’s motion in real-time. Deflection of the laser spot in the XY plane is achieved via a 2D electro-optic deflector (2D-EOD) while axial deflection is achieved using a tunable acoustic gradient (TAG) lens.[5] Arriving photons are used to calculate the particle’s position using an optimized position estimation algorithm which calculates the real-time position and variance of the particle.[6] Since the size of the XY grid is controlled by the magnitude of the voltage applied to the 2D-EOD, it can be used as a responsive element for adapting to different diffusive conditions on fast timescales. The principle of this adaptive behavior can be seen in Figure 1. When the diffusive behavior is fast, the variance in the particle’s position relative the center of the scan range is large, meaning that each spot scanned by the laser is critical in maintaining a lock on the particle’s position. However, when the diffusive behavior is slow, the particle spends the majority of its time near the center of the scan range, with most of the laser spots not sampling the particle’s position. Since the variance of the particle’s position is calculated within the feedback loop, it can be used to adjust the scan size accordingly. In this adaptive microscope, the scan range is coupled to the diffusion coefficient through the real-time variance of the particle’s position relative to the center of the focal volume. In this way, the precision is tuned to the particle’s diffusive speed, trading speed for precision on demand. Changing the scan range for 3D-DyPLoT has the added benefit that the shrinking scan increases the dwell time of the laser on the particle, leading to an increase in the collected number of photons and a further increase in precision in all three spatial dimensions.
Figure 1.
Schematic of PART. At high diffusive speeds, the variance of the particle’s position within the tracking volume is large. At these high diffusive speeds, the scan size is made large to ensure tracking robustness (top panel). At slow diffusive speeds, the particle’s positional variance is small. The scan size is then decreased in size to effectively increase the tracking precision (bottom panel).
Choosing the scanning square size relative to that of the diffusive behavior is a matter of scaling the square such that a high percentage of the particle’s diffusive motions remain within the square during the response time of the tracking system. This can be achieved by a simple treatment of diffusive Brownian motion. First, we assume that the particle’s motion is diffusive in nature, defined by a diffusion coefficient D. Second, we assume that the long-time position of the particle is tracked by the piezoelectric stage, such that we only need to be concerned with the particle’s position relative to the center of the scan range. The timescale over which the piezo stage can apply control is related to its intrinsic frequency response, which is limited to 1 kHz or about 1 ms at best. Over that time period, the variance of the particle’s position relative to the center of the scan range can be defined as:
| (1) |
Here τ is the piezo stage response time (typically ~ 1 msec) and D is the diffusion coefficient. The scanning square size is set to 6 times the square root of the variance:
| (2) |
Where scan size (SS) is defined as the distance from the center of the scan to the edge (the size of the scan on one side is then 2xSS). This value of 6σ was determined semi-empirically. Assuming that the particle position is normally distributed within the volume, a square size of 3σ would in theory contain 99.7% of the possible particle locations. However, this assumes that the particle is centered within the scan area. To account for the fact that a freely diffusing particle is generally not centered at any given time, an extra 3σ is added. Experimentally, it was found that 6σ was the scaling relationship that yielded similar tracking capability (in terms of trajectory duration) between DyPLoT and PART.
To enact adaptive tracking, a measurement of the real-time variance of the particle’s position relative to the center of the observation area is required. The original implementation of 3D-DyPLoT utilized an optimized position estimation algorithm originally developed by Fields and co-workers.[6] The position xk and variance of the particle relative to the center of the scan area is defined by:
| (3) |
| (4) |
in which w is the covariance of the laser beam, ck is the beam position and nk is the detected photon number. The current estimate of position xk is calculated by updating past estimate xk-1 with the new detected photon position. The real-time estimate of the variance shown in equation (4) effectively allows an online measurement of the particle’s diffusion coefficient which is then used in combination with equation (2) to set the scan size (ss) in real-time as the particle is tracked.
2. Results
2.1. Adaptive tracking of heterogeneous dynamics
The setup of 3D-PART is based on the design of 3D-DyPLoT with a few modifications (Fig.S1). In 3D-DyPLoT, the 2D electro-optic deflector (2D-EOD) scans the laser in a 5 × 5 Knight’s tour pattern,[7] which covers a square with a predetermined side length in the objective plane, while being scanned axially using the TAG lens (Fig. S2). The size of this square is adjusted by scaling the voltage applied to the 2D-EOD as shown in Figure 1. The scan size is determined in accordance with equation (2) with a maximum of 1.2 μm and minimum 0.5 μm, to ensure that the scan area does not become too large or small, respectively. At large volumes, the spots (~ 200 nm) of the Knight’s tour no longer overlap, leading to gaps where the particle is not observed. At small scan sizes, the scan volume get close to the diffraction limited size and no position information can be extracted. These limits were determined empirically.
2.2. Precision Comparison
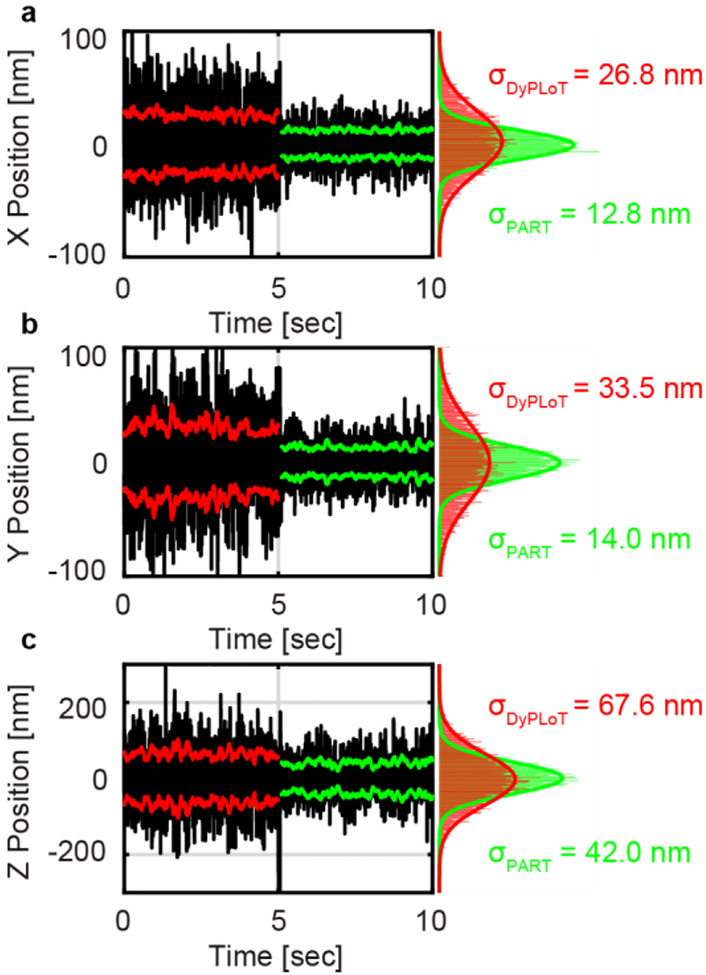
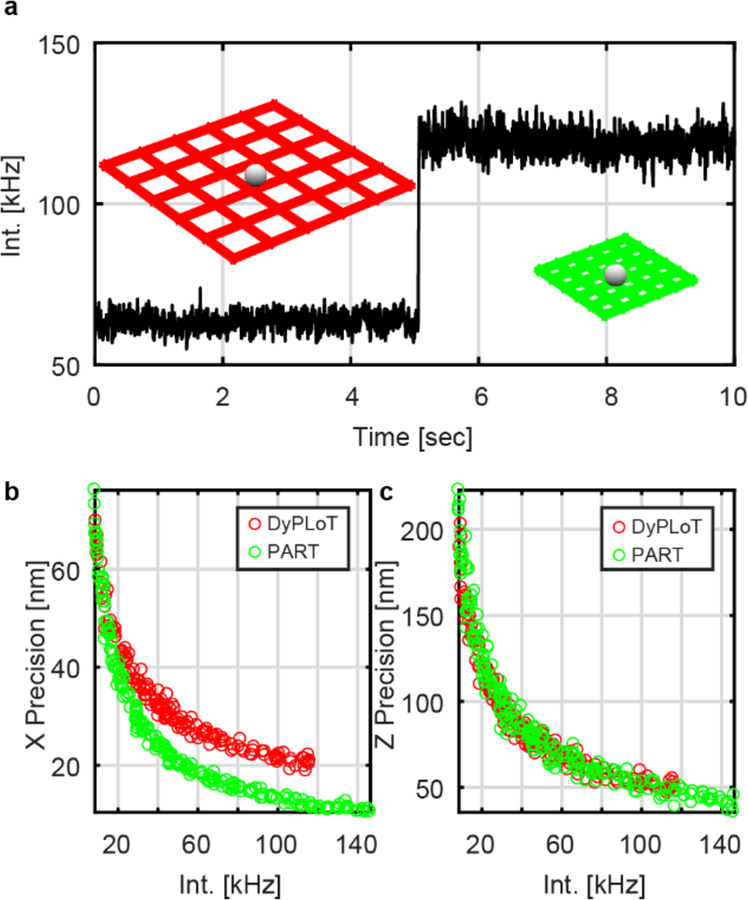
To investigate the effect of this adaptive algorithm on the localization precision of real-time tracking, 3D-PART was used to track a 190 nm fluorescent bead fixed to a coverslip. The large particles avoided possible photobleaching during the measurement. PBS was used as a solvent as it caused the particles to stick to the coverslip. The bead was tracked without 3D-PART for 5 seconds, after which the adaptive tracking algorithm was enabled (Figure 2). The particle’s position is determined from the position of the piezoelectric stage while the tracking feedback loop is enabled. The adaptive tracking resulted in a drastic increase in the localization precision of the particle in X (26.8 nm to 12.8 nm) and Y (33.5 nm to 14.0 nm). Since the particle’s position was fixed, the variance of the estimated particle position was small, leading the scan size to shrink when 3D-PART is enabled, increasing the sampling precision in the XY plane. A similar experiment performed on 23 different fixed particles yielded similar results, with precision improvements of 2.29 ± 0.05 and 2.20 ± 0.04 fold in X and Y respectively (X: 26.3 ± 2.1 nm to 11.5 ± 0.9 nm; Y: 23.3 ± 1.9 nm to 10.6 ± 0.8 nm, Figure S3). The slight difference observed in the precision between X and Y is attributed to the differing performance of the axes of the piezostage. In addition, despite the fact that the scan range along the axial direction (dictated by the amplitude of the TAG lens, which is not modulated) was held constant, the Z precision also shows an increase (67.6 nm to 42.0 nm, Figure 2c). Overall, the Z precision exhibited a 1.51 ± 0.06 fold increase in the precision (67.7 ± 2.4 nm to 44.9 ± 1.6 nm, Figure S3). This can be understood by examining the change in intensity when 3D-PART is enabled. Since the laser intensity is held constant, a decrease in the scanning area in the XY plane leads to an increased photon collection rate from the particle (1.83 ± 0.01 fold increase, Figures 3a, S3). While the increase in intensity is expected to increase precision,[8] Figure 3b demonstrates that the increase in precision in the lateral dimension is not solely due to an increase in the number of collected photons. This can be seen by comparing the precision of 3D-DyPLoT and 3D-PART at the same count rate. The increase in lateral precision is due both to the increase in count rate as well the finer sampling in the XY plane. In contrast, Figure 3c shows the increase in precision in the axial (Z) direction with photon counts, indicating that the precision of 3D-DyPLoT and 3D-PART are the same at the same count rate, confirming that the increased Z precision observed in Figure 2c is solely due to the increase in photon detection rate.
Figure 2.
Tracking precision comparison. The 3D-PART mechanism was switched on at t=5 sec. (a-c) Tracking precision as a function of time for X, Y and Z respectively. The particle position is measured using the readouts from the piezoelectric stage.
Figure 3.
(a) Collected emission intensity from a fixed fluorescent nanoparticle using 3D-DyPLoT (t < 5 sec) and 3D-PART (t > 5 sec). (b) Lateral (XY) tracking precision comparison between 3D-DyPLoT (red circles) and 3D-PART (green circles) at varying count rates. (c) Axial (Z) tracking precision comparison between 3D-DyPLoT (red circles) and 3D-PART (green circles) at varying count rates. In both cases, the axial scan range (~ 2 μm) is the same. The improvement in the lateral precision increases due to the (1) the finer sampling in the XY plane and (2) the increased photon count rate. Since the axial sampling is not changed, the axial precision is only increased indirectly by the increase in photon count rates. Bin size: (a) 1 ms; (b, c) 100 ms. Background level for all experiments: ~ 200 Hz.
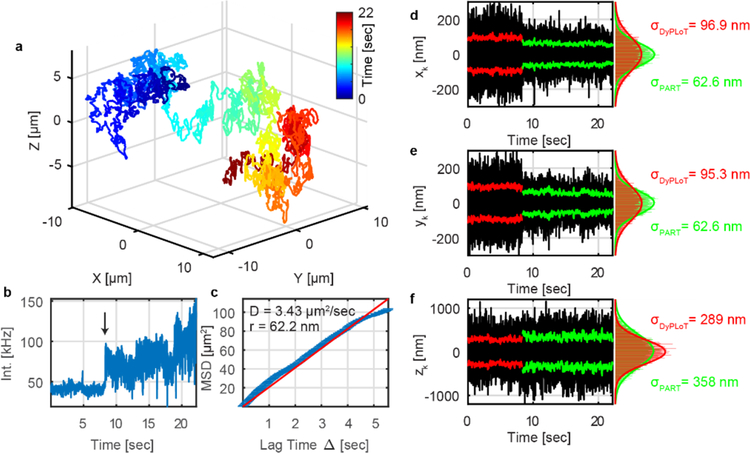
So far, we have demonstrated that PART successfully increases the precision when tracking fixed particles. The real power of PART is the ability to adapt its precision when tracking mobile objects. To demonstrate, we tracked the Brownian motion of 110 nm beads in water with PART enabled during the real-time trajectory as shown for fixed particles in Figure 2, now shown in Figure 4 for a mobile particle. The mean square displacement (MSD) analysis taken from the 3D trajectory yields a diffusion coefficient of 3.43 μm2/s, corresponding to a hydrodynamic diameter of 124 nm (calculated by Stokes-Einstein) and consistent with the manufacturer’s specification (Figure 4c). To measure the precision, the standard deviation of the particle’s position relative the center of the tracking volume (as calculated by the real-time Kalman filter on the FPGA, denoted xk, yk and zk, respectively, Equation 3) is used. The results show that 3D-PART demonstrated a higher lateral tracking precision (Figure 4 d, e). This is a result of the fact that the tracking volume shrank to optimally contain the diffusive motions of the particle, as is evidenced by the increase in the photon detection rate (Figure 4b). On average, the real-time X (Y) precision increased from 104.2 ± 5.3 (99.4 ± 4.9) nm using DyPLoT to 76.3 ± 6.5 (69.1 ± 6.2) nm using PART (Figures S4, S5). It should be noted that there is a slight Z focus shift when the scan size changes, which likely results from a slight change in beam divergence with the different deflection angle of electro-optic deflectors. This results in the decrease in the real-time Z precision seen in Figure 4f and Figure S4 and S5. Fortunately, this shift can be corrected easily in post-processing based on the relationship between the shift and scan size (Figure S6). However, the small change in the apparent z position is readout in real-time by the tracking system as a real particle motion. The online position estimate reflects these changes, leading to a larger variance in the deviation of the particle from the axial center of the scan range. This would explain why the real-time axial localization is slightly worse in PART, though for slow-moving particles the axial localization is still much higher (Figure 2).
Figure 4.
Tracking Brownian motion of 110 nm beads in water with precision modulation switching on at time=7.4 s. (a) 3D moving trajectory of beads. (b) Fluorescence intensity as a function of time. At the time indicated by the arrow the tracking was switched from 3D-DyPLoT to 3D-PART. (c) MSD of the trajectory in (a). The blue line is the measured MSD while the dotted red line is best fit line from linear regression. (d-f) x, y and z real-time tracking precision as a function of time. Bin size: 1 ms.
The limits of PART relative to the existing DyPLoT technique were further probed by examining the performance at low photon count rates and high diffusive speeds. Since the advantages of PART arise from reducing the scan volume whenever the particle position variance is reduced, it follows that low photon count rates would ultimately cause PART to have the same performance as DyPLoT. To find this point, DyPLoT and PART were performed on 110 nm beads at low count rates. In water, where the diffusion coefficient is ~ 4 μm, beads with count rates under 10 kHz showed nearly identical behavior under DyPLoT or PART (Figures S7 and S9). Adding glycerol (40%) to lower the diffusion coefficient ~ 1 μm2/s for the same particles at low count rates showed that PART showed higher tracking precision than DyPLoT (Figures S8, S9). Similarly, it was observed that DyPLoT and PART performed equally well on more rapidly diffusing particles (57 nm diameter, Figures S10, S11).
2.3. Precision adaptive real-time tracking
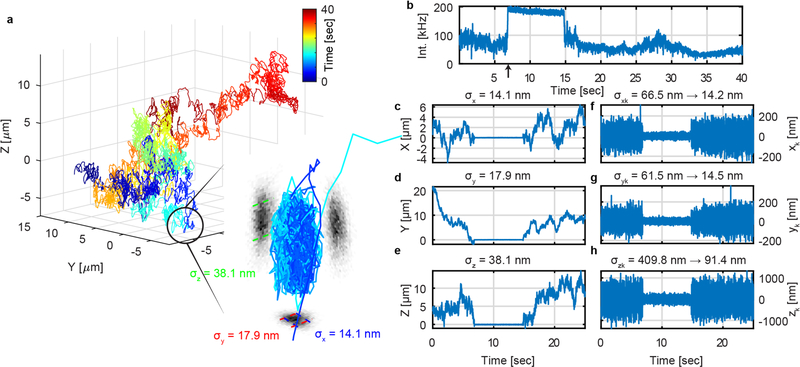
The full benefit of 3D-PART is observed when measuring processes with heterogeneous dynamics. For processes which jump between different diffusive regimes (e.g. fast to slow or vice versa), 3D-PART enables an online method for optimizing measurements for all phases of the process, with minimal a priori knowledge. To demonstrate this ability, 3D-PART was used to observe the binding of fluorescent beads to a coverslip. Figure 5 shows a binding event of 110 nm green fluorescent bead on the coverslip from aqueous solution. When the bead binds to the surface of coverslip at 6.9 s, the precision of X and Y increased from 66.5 nm to 14.2 nm and 61.5 nm to 14.5 nm, respectively, within a timescale of about 5 ms (Figures 5f, g, S12). At 14.9 s the bead becomes unbound from the coverslip, with an accompanying decrease in precision.
Figure 5.
3D-PART enables tracking of heterogeneous dynamics. (a) 3D trajectory of 110 nm green fluorescent bead freely diffusing and intermittently binding to the coverslip. The inset is a zoom in on the part of the trajectory where the particle is bound to the coverslip. The precision of the XYZ stage readouts are labeled as σx,σy, σz, respectively, showing good agreement with the fixed particle data shown in Figure 2. (b) Intensity trace of the particle shown in (a). The spike in intensity (from ~100 kHz to ~200 kHz, indicated by arrow) results from the shrunken scan area dictated by 3D-PART. (c-e) The X, Y, and Z position of particle as a function of time as measured by the piezoelectric stage position. The σx,σy, σz on top of the plots are the standard deviations for the X, Y, and Z stage readout while the particle is bound. (f-h) Deviation of particle from center of tracking volume during diffusion and landing events as measured by the real-time position estimation algorithm. A drastic reduction in the variance of the position estimates can be seen coinciding with the binding of the particle to the coverslip and the spike in intensity (indicated by arrow).” The values σxk,σyk, and σzk demonstrate the change in the particle position uncertainty as the particle transitions from free diffusion to bound on the coverslip. Bin size: (b-h) 1 ms.
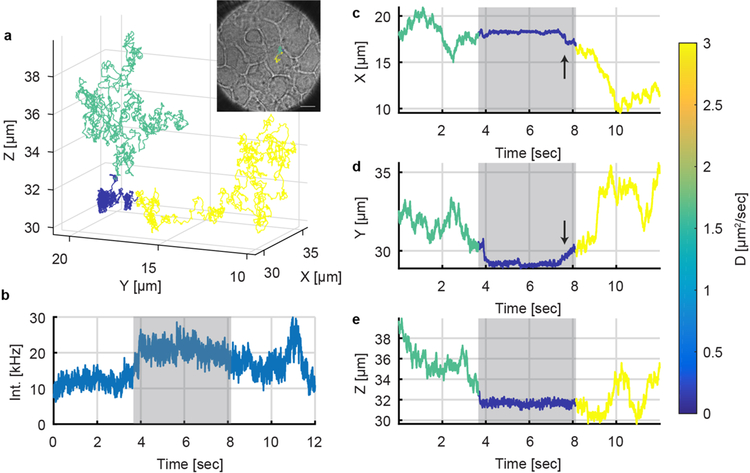
The ability to measure processes at high diffusive speeds and high precision opens the possibility to study the very first stages in viral infection, where the virus-like particle searches the complex extracellular space to find a suitable impregnation site. While it is expected that virus particles simply bind to cells from the extracellular space, the inability to capture the rapid motions prior to attachment has heretofore precluded measurements of this process. Many viral infection processes (such as influenza) must transverse a complex extracellular barrier (mucins) in order to actually bind and infect.[9] Real-time tracking would allow measurement of viral particles in this complex extracellular space. At the same time, receptor binding and viral internalization require high spatial precision to delineate. 3D-PART allows measurement of both of these spatiotemporal domains for a single particle, enabling a complete 3D spatiotemporal mapping of the viral infection process. To demonstrate, 3D-PART was applied to track the landing of ~170 nm vesicular stomatitis virus-like particles[10] expressing a pVenus (yellow fluorescent protein, YFP)-VSV-G fusion[11] on the surface of HuH7 cells (see Movie S1 and S2). The plasmid encodes the YFP on the cytoplasmic tail of the VSV-G protein, meaning that the YFP will be expressed on the inside of the viral envelope, leaving the VLP exterior free of perturbations. These VLPs are easily tracked by 3D-PART (Movie S1). As with any experiment utilizing fluorescence, photobleaching is a concern. As shown in Movie S1, the reduced scan size can lead to photobleaching of the tracked particle, though VLPs can still be tracked for minutes at a time (Fig. 7, Movie S2). In future implementations, this bleaching effect can be offset be modulating the laser power such that the excitation and emission rates are held constant. This would still lead to an increase in XY precision due to 3D-PART’s more efficient use of photons. It should be noted that trajectory duration is also affected by the choice of laser power and the photostability of the fluorescent label. Tracking at higher powers (257 nW, Movie S1) can lead to higher precision with a concomitant increase in the photobleaching rate. Lower laser powers, as those used in the VLP-cell binding experiments (66 nW, Fig. 6,7, Movie S2), can help extend trajectory duration to the scale of minutes without photobleaching. Figure 6 shows a virus undergoing a transient binding event with the cell surface. Figure 6a shows the trajectory of the viral particle in 3D. To provide context, a bright field image was taken immediately at the conclusion of the trajectory (inset). From the trajectory, it can be seen that the virus bound to the cell surface at around ~ 4 sec and detached at about ~ 8 sec. There are several pieces of evidence that suggest that the VLP is binding to the cell and not just to the coverslip. First, as shown in Fig. 4, coverslip binding leads to immobilization in all three dimensions, not just Z. Second, the optical image shows that there is a confluent layer of cells, so it is unlikely that the particle is bound to the coverslip. Third, after unbinding, the VLP diffuses to a lower Z position than the bound state. This is only possible if the initial binding was to something above the coverslip. Distinct diffusive states during binding were identified using a Gaussian changepoint algorithm. This method was originally developed by Montiel et al.[12] and was later implemented by Welsher and Yang for identifying diffusive states of particles binding to cell surfaces and diffusing on cell membrane features.[1j] The method is described in detail in those references. Briefly, the changepoint algorithm breaks the trajectory into two segments and performs a hypothesis test on whether the data before the break and after the break are better described by single diffusion coefficient (D0) or by separate diffusion coefficients (D1 and D2). The null hypothesis is rejected (D0) if the log-likelihood exceeds the asymptotic limits derived by Horvath.[13] This test is done at every point in the trajectory until no more breakpoints are found. For the trajectory shown in Fig. 6, the changepoint was run at 90% confidence (10% false positive rate). The algorithm identifies three diffusive states, with a distinct drop in diffusion coefficient which corresponds to the bound state of the VLP. The resulting diffusive regimes are color coded in Figure 6. Upon binding, the virus-like particle transitioned from free 3D Brownian diffusion (green) to confined 2D diffusion on the cell surface (blue). After several seconds on the membrane, the particle detached from the cell and returned to free 3D diffusion (yellow). We hypothesize that the transient nature of this event is related to interaction with receptors on the cell surface (here LDLR).[14] Future work will test this hypothesis by replacing wild-type cells with those expressing fluorescently labelled LDLR. 3D-PART tracking of single virus-like particles also enabled measurement of the close association of particles to the cell surface prior to binding events, as shown in Figure 7 and Movie S2.
Figure 7.
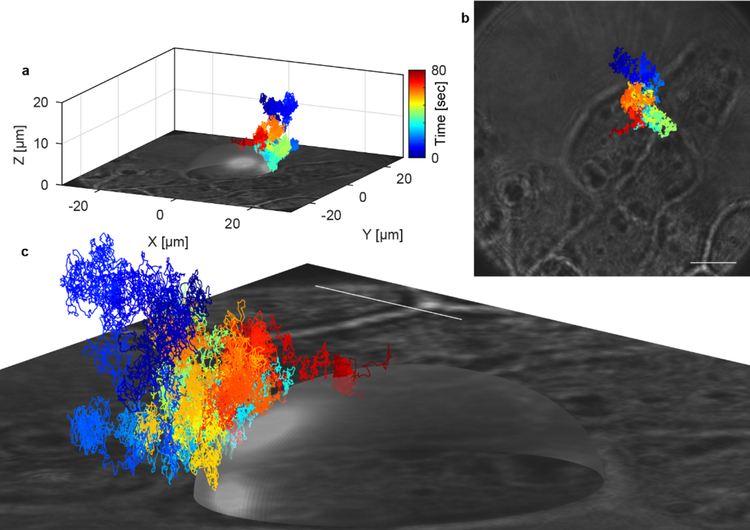
3D-PART measurement of a single virus landing on the membrane of a HuH7 cell. The transparent ellipse is a guide to the eye and is generated by fitting an ellipse to the 2D optical image of the cell and extending in Z to the virus-like particle binding event. The different colors represent elapsed time, as indicated by the colorbar, with the binding event occurring at the end of the trajectory (red). The virus diffuses in 3D with a curved excluded volume, indicating close approach to the cell surface before the actual binding event.
Figure 6.
PART measurement of a single virus landing on the membrane of a live HuH7 cell. (a) 3D trajectory of single VSV-G-YFP virus-like particle. (inset) Bright field image of HuH7 cell overlaid with top-down view of the viral trajectory in the XY plane. Scale bar: 10 μm. (b-d) The x, y and z position of particle as a function of time, color-coded for the different diffusive states extracted by the changepoint algorithm. The VLP starts in a freely diffusive state (green) with a diffusion coefficient of about 1.6 μm2/s, transitioning to a bound state (dark blue) with a diffusion coefficient of 0.58 μm2/s. The arrow indicates an increase in XY motion just prior to a jump to a higher diffusive state (yellow), presumably the VLP unbinding from the cell surface (See Figure S13).
3. Conclusions and Outlook
Here we have demonstrated a novel real-time single particle tracking method (3D Precision Adaptive Real-time Tracking (3D-PART)), which dynamically adjusts tracking parameters in real-time to measure heterogeneous dynamics. Using fluorescent beads, PART demonstrated the ability to track at both high speed (up to 7 μm2/s) and high precision (~15 nm XY, 45 nm ~ Z at 1 msec sampling). This unique ability portends new insights into the first stages of viral infection, as demonstrated for single VSV-G virus-like particles interacting with the cell surface. The benefit of 3D-PART for measuring viral binding events in comparison to 3D-DyPLoT, can be understood given the fixed particle precision differences between the two methods shown in Figure 2. The fixed particle precision is a good estimate of the localization of a viral particle bound to the cell surface as its diffusion is confined and much slower than in solution. The greater than two-fold improvement in lateral precision and 1.5-fold improvement in axial precision can yield greater a clearer picture of the viral motions upon binding. Phenomena such as receptor binding or the physical internalization across the cell membrane will potentially be much clearer with a doubling of the localization precision. Further improvement of this method to implement simultaneous 3D imaging (as in 3D Multi-resolution Microscopy)[1j, 15] will extend the application scope of 3D-PART to include a wide range of fast biological processes with highly heterogeneous dynamics, including endosomal transport,[16] exocytosis,[17] and axonal transport[18] among many others.
4. Experimental Section
4.1. Description of optical setup
The PART setup uses a 488 nm frequency-doubled solid-state laser (FCD488–30, JDSU) for excitation of green beads and virus-like particles and a 641 nm diode laser (OBIS 640LX, Coherent) for excitation of red beads. A telecentric system, consisting of two lenses with focal length f=150 mm (AC254–150-A-ML, Thorlabs) and f=200 mm (AC254–200-A-ML, Thorlabs), and a pinhole with 75 μm diameter (P75S, Thorlabs) were used to collimate and spatially filter the beam. A Glan-Thompson Polarizer (GTH5-A, Thorlabs) was employed to clean the polarization state of the beam, a requirement for electro-optic deflection. The beam then travels through two electro-optic deflectors (EODs; M310A, Conoptics) with half-wave plate (WPH05M-488) before each EOD. The EODs are used to produce the XY scanning pattern and the half-wave plates are used to adjust the laser polarization. The EOD pixel clock is set to 50 kHz, which produces a 20 μs pixel dwell time. A lens pair (AC254–75-A-ML; AC254–250-A-ML, Thorlabs) are placed after the EOD to act as a beam expander. The TAG lens (TAG Lens 2.5, TAG optics) is used to dynamically modulate the beams focal position. Here we run the TAG lens at the ~ 70 kHz resonance. The beam from the TAG lens was relayed to the microscope objective lens (100x, 1.49 NA, M27, Zeiss) by two f = 200 mm focal length lenses (AC254–200-A-ML, Thorlabs). A dichroic mirror (ZT405/488/561/640rpc, Chroma) was used to reflect the beam towards the back aperture of the objective lens. A bandpass filter (for green fluorescence: D535/40m, Chroma; for red fluorescence: ET706/95m, Chroma) separates the collected fluorescence emission from the excitation light. The emission was further split by a 10:90 beam splitter (21012, Chroma) and directed to APD (SPCM-AQRH-25, Exelitas). A micropositioning system (Microstage, MicroStage Series, Mad City Labs) was used for coarse sample positioning. A 3D piezoelectric stage (XY - Nano-PDQ275HS, Z – Nano-OP65HS, Mad City Labs) was used to move the sample and objective lens for real-time 3D tracking. For bright field imaging, the fiber-coupled 641 nm diode laser was used for wide-field illumination and a sCMOS (pco.edge 4.2, PCO.) was used for image collection. A field programmable gate array (FPGA, NI-7852r National Instruments) was used to control the EOD scanning, collect photons counts from the APD (80 MHz), interpolate the TAG lens signal, calculate the particle position estimates, apply position feedback with the piezoelectric stage and record the particle position information (50 kHz). The system operates in home-compiled software implemented with LabView 15 (National Instruments). Laser power used for different experiments: (Fixed 190 nm beads tracking: 488 nm, 10 nW; Freely diffusing 110 nm beads: 488 nm, 26 nW; Freely diffusing 110 nm beads at low intensity: 488 nm, 3.2 nW; Bead binding on coverslip: 488 nm, 132nW; VLP tracking: 488 nm, 66 nW; VLP tracking in Movie S1: 488nm, 257 nW; 57 nm red bead tracking, 641 nm 3.6 μW).
4.2. Fluorescent nanoparticles sample preparation
For fixed particles, 190 nm fluorescent nanoparticles (FC02F/9942, Bangs laboratories, ex/em: 470/525) were diluted by PBS (D8537, Sigma) with a ratio of 1:10000 and then directly dropped onto a coverslip (12–545A, Fisher Scientific). The coverslip was fixed in a home-made sample holder. For green freely diffusing particles, 110 nm fluorescent nanoparticles (FC02F/10617, Bangs laboratories, ex/em:480/520) were diluted by DI water with a ratio of 1:105 and then dropped onto a coverslip (16918, VWR). For red freely diffusing particles, 57 nm fluorescent nanoparticles (FC02F/7105, Bangs laboratories, ex/em: 660/690 nm) were diluted by DI water with a ratio of 1:105 and then dropped onto a coverslip (16918, VWR).
4.3. Preparation of VSV-G-pVenus virus-like particles
VSV lentiviral particles were prepared by the Duke Viral Vector Core following the protocol reported by Vijayraghavan et. al.[10] pVenus-VSV-G was a gift from Jennifer Lippincott-Schwartz (Addgene plasmid #11914, ex/em: 515/528 nm).[11] As produced YFP-fusion virus-like particles (~107/ml) were purified first through a 0.2 μm syringe filter (143212, Corning) to remove any aggregated virus particles. Next the particles were exchanged into PBS using a 100kDa centrifugal filter (UFC510096, Millipore).
4.4. Cell Culture
HuH7 cells were cultured following standard tissue culture protocols in DMEM supplemented with 10% FBS. Twenty-four hours before tracking, cells were plated on a 22 × 22 mm coverslip (16912, VWR). Before tracking, cells were washed five times by PBS before adding in 200 μL of the viral particles described above. The live cell imaging solution (A14291DJ, Molecular Probes) was used to obtain better signal-to-noise ratio and cell viability. The VLP binding experiments were performed using a temperature-controlled stage (TC-1–100, Bioscience Tools) set to 37 °C to maintain cell viability.
Supplementary Material
Acknowledgments
The authors acknowledge financial support from the National Institute of General Medical Sciences of the National Institutes of Health under award number R35GM124868 and from Duke University. The authors would like to thank Dr. Boris Kantor and the Duke Viral Vector Core for providing viral particles and for helpful discussions. pVenus-VSV-G was a gift from Jennifer Lippincott-Schwartz.
Footnotes
Supporting Information
Supporting Information is available from the Wiley Online Library or from the author.
References
- [1].a) Cang H; Xu CS; Montiel D; Yang H, Opt Lett 2007, 32, 2729; [DOI] [PubMed] [Google Scholar]; b) Cang H; Wong CM; Xu CS; Rizvi AH; Yang H, Applied Physics Letters 2006, 88, 223901; [Google Scholar]; c) Lessard GA; Goodwin PM; Werner JH, Applied Physics Letters 2007, 91, 224106; [Google Scholar]; d) Katayama Y; Burkacky O; Meyer M; Brauchle C; Gratton E; Lamb DC, Chemphyschem 2009, 10, 2458; [DOI] [PMC free article] [PubMed] [Google Scholar]; e) Juette MF; Bewersdorf J, Nano Lett 2010, 10, 4657; [DOI] [PubMed] [Google Scholar]; f) McHale K; Berglund AJ; Mabuchi H, Nano Lett 2007, 7, 3535; [DOI] [PubMed] [Google Scholar]; g) Levi V; Ruan Q; Gratton E, Biophys J 2005, 88, 2919; [DOI] [PMC free article] [PubMed] [Google Scholar]; h) Perillo EP; Liu YL; Huynh K; Liu C; Chou CK; Hung MC; Yeh HC; Dunn AK, Nat Commun 2015, 6, 7874; [DOI] [PMC free article] [PubMed] [Google Scholar]; i) Hou; Lang; Welsher, Opt Lett 2017, 42, 2390–2393; [DOI] [PubMed] [Google Scholar]; j) Welsher K; Yang H, Nat Nanotechnol 2014, 9, 198. [DOI] [PubMed] [Google Scholar]
- [2].a) Han JJ; Kiss C; Bradbury AR; Werner JH, ACS Nano 2012, 6, 8922; [DOI] [PubMed] [Google Scholar]; b) Wells NP; Lessard GA; Goodwin PM; Phipps ME; Cutler PJ; Lidke DS; Wilson BS; Werner JH, Nano Lett 2010, 10, 4732; [DOI] [PMC free article] [PubMed] [Google Scholar]; c) Liu C; Obliosca JM; Liu YL; Chen YA; Jiang N; Yeh HC, Nanoscale 2017, 9, 5664. [DOI] [PMC free article] [PubMed] [Google Scholar]
- [3].a) Flint SJ; Enquist LW; Racaniello VR; Skalka AM, Principles of Virology. ASM Press: Washington, DC, 2009; [Google Scholar]; b) Brandenburg B; Zhuang X, Nat Rev Microbiol 2007, 5, 197; [DOI] [PMC free article] [PubMed] [Google Scholar]; c) Wang IH; Burckhardt CJ; Yakimovich A; Greber UF, Viruses 2018, 10, 166. [DOI] [PMC free article] [PubMed] [Google Scholar]
- [4].Hou S; Welsher K, J Vis Exp 2018, e56711. [DOI] [PMC free article] [PubMed] [Google Scholar]
- [5].Mermillod-Blondin A; McLeod E; Arnold CB, Opt Lett 2008, 33, 2146. [DOI] [PubMed] [Google Scholar]
- [6].Fields AP; Cohen AE, Opt Express 2012, 20, 22585. [DOI] [PubMed] [Google Scholar]
- [7].Wang Q; Moerner WE, Appl Phys B 2010, 99, 23. [DOI] [PMC free article] [PubMed] [Google Scholar]
- [8].Thompson RE; Larson DR; Webb WW, Biophys J 2002, 82, 2775. [DOI] [PMC free article] [PubMed] [Google Scholar]
- [9].a) Cohen M; Zhang X-Q; Senaati HP; Chen H-W; Varki NM; Schooley RT; Gagneux P, Virology Journal 2013, 10, 321; [DOI] [PMC free article] [PubMed] [Google Scholar]; b) McAuley JL; Corcilius L; Tan HX; Payne RJ; McGuckin MA; Brown LE, Mucosal Immunology 2017, 10, 1581. [DOI] [PubMed] [Google Scholar]
- [10].a) Vijayraghavan S; Kantor B, J Vis Exp 2017, e56915; [DOI] [PMC free article] [PubMed] [Google Scholar]; b) Kantor B; Bayer M; Ma H; Samulski J; Li C; McCown T; Kafri T, Mol Ther 2011, 19, 547. [DOI] [PMC free article] [PubMed] [Google Scholar]
- [11].Presley JF; Cole NB; Schroer TA; Hirschberg K; Zaal KJ; Lippincott-Schwartz J, Nature 1997, 389, 81. [DOI] [PubMed] [Google Scholar]
- [12].Montiel D; Cang H; Yang H, J Phys Chem B 2006, 110, 19763. [DOI] [PubMed] [Google Scholar]
- [13].Horvath L, The Annals of Statistics 1993, 21, 671–680. [Google Scholar]
- [14].Finkelshtein D; Werman A; Novick D; Barak S; Rubinstein M, Proceedings of the National Academy of Sciences 2013, 110, 7306–7311. [DOI] [PMC free article] [PubMed] [Google Scholar]
- [15].Welsher K; Yang H, Faraday Discuss 2015, 184, 359. [DOI] [PubMed] [Google Scholar]
- [16].Hancock WO, Nat Rev Mol Cell Biol 2014, 15, 615. [DOI] [PMC free article] [PubMed] [Google Scholar]
- [17].Wu LG; Hamid E; Shin W; Chiang HC, Annu Rev Physiol 2014, 76, 301. [DOI] [PMC free article] [PubMed] [Google Scholar]
- [18].Maday S; Twelvetrees AE; Moughamian AJ; Holzbaur EL, Neuron 2014, 84, 292. [DOI] [PMC free article] [PubMed] [Google Scholar]
Associated Data
This section collects any data citations, data availability statements, or supplementary materials included in this article.


