

SUMMARY
Most high-grade serous ovarian cancer (HGSOC) patients develop resistance to platinum-based chemotherapy and recur, but 15% remain disease free over a decade. To discover drivers of long-term survival, we quantitatively analyzed the proteomes of platinum-resistant and -sensitive HGSOC patients from minute amounts of formalin-fixed, paraffin-embedded tumors. This revealed cancer/testis antigen 45 (CT45) as an independent prognostic factor associated with a doubling of disease-free survival in advanced-stage HGSOC. Phospho- and interaction proteomics tied CT45 to DNA damage pathways through direct interaction with the PP4 phosphatase complex. In vitro, CT45 regulated PP4 activity, and its high expression led to increased DNA damage and platinum sensitivity. CT45-derived HLA class I peptides, identified by immunopeptidomics, activate patient-derived cytotoxic T cells and promote tumor cell killing. This study highlights the power of clinical cancer proteomics to identify targets for chemo- and immunotherapy and illuminate their biological roles.
Graphical Abstract:
In Brief
Integrative proteomic analysis in clinical tumor samples identifies a platinum sensitivity regulator and immunotherapy target for ovarian cancer and illustrates the clinical potential of cancer proteomics.
INTRODUCTION
High-grade serous ovarian cancer (HGSOC), which originates either in the ovary or the fallopian tube, accounts for most ovarian cancer fatalities due primarily to late diagnosis and acquired resistance to chemotherapy (Bowtell et al., 2015). Because the ovaries and fallopian tube are hidden in the abdominal cavity, 80% of all HGSOC are discovered after the cancer has widely metastasized. Current standard treatment includes a combination of tumor-debulking surgery and carboplatin/paclitaxel chemotherapy. Despite this very aggressive treatment, which stretches over five months, 80% of patients suffer an intra-abdominal recurrence and will go through consecutive rounds of chemotherapy without the expectation of a cure. However, one in six patients remains disease free for more than 10 years after an initial diagnosis of advanced-stage metastatic disease (Cress et al., 2015). At present, no known molecular mechanisms are associated with this prolonged survival, and no good predictive markers exist to distinguish these patients from others with HGSOC who do poorly (Hoppenot et al., 2018). Therefore, it would be extremely useful to identify tumor-intrinsic, predisposing features underlying the favorable response to chemotherapy and long-term survival of some patients.
Cancer is predominantly studied at the genetic level, but proteomics has long been seen as a promising complementary technology that could enable insight into the disease at the protein level. Currently, there are few if any examples in cancer of clinically relevant biomarkers identified through this technology (Anderson et al., 2013; Rifai et al., 2006). However, proteomics technology has improved tremendously in recent years and is now capable of very deep and quantitative profiling of cellular systems, including formalin-fixed and paraffin-embedded (FFPE) tissue (Aebersold and Mann, 2016; Mertins et al., 2016; Wiśniewski et al., 2011). Large-scale proteogenomics has already been used to correlate changes at the protein level with those in the genome, highlighting how acetylation and phosphorylation features are linked to deficiencies in homologous recombination and reduced survival (Zhang et al., 2016).
Here, we set out to investigate whether the tumor proteome of metastatic HGSOC influences the long-term survival of patients following adjuvant chemotherapy. We developed nearly loss-less, high-sensitivity workflows to analyze a large fraction of the disease-related proteome from small amounts of FFPE tumors with the goal of discovering biomarkers of treatment response. This system-wide quantitative proteomics approach, using state-of-the-art mass spectrometry (MS), was applied to tissue from a cohort of treatment-naive HGSOC patients, identifying cancer/testis antigen (CTA) 45 (CT45) as a highly significant marker of a positive response to chemotherapy. This was followed by interaction proteomics, phosphoproteomics, and immunopeptidomics, along with extensive functional follow up, to shed light on the mechanisms of action leading to increased patient survival.
RESULTS
Identification of CT45 by High-Sensitivity Expression Proteomics
We performed quantitative proteomics on FFPE tumor samples derived from 25 chemotherapy-naive patients with advanced-stage HGSOC (Figure 1A and Tables S1, S2, and S3). Since patients with advanced-stage clinical disease have the worst prognosis (Bowtell et al., 2015), we selected metastatic tumors from the omentum for proteomic analysis. Adapting a recently described and highly sensitive label-free proteomic workflow capable of accurately quantifying a large portion of the cellular proteome (Coscia et al., 2016; Cox et al., 2014), we performed global proteomics on a cohort of chemoresistant (n = 11, median disease-free survival [DFS] = 190 days) and chemosensitive (n = 14, median DFS = 1,160 days) patient tissues (Figure 1A). We identified and quantified more than 9,000 proteins from low-μg archival samples in single-run measurements in the MaxQuant environment using a permutation-based false discovery rate (FDR) to correct for multiple hypothesis testing (Cox et al., 2014; Cox and Mann, 2008) (1% FDR at protein and peptide levels; Figure S1A). The dynamic range of protein signals spanned more than six orders of magnitude (Figure S1B). Pearson’s r values between all specimens were consistently above 0.77 (mean 0.88), and the correlation was 0.95 between independently prepared tissue from the same tumor (Figure S1C). Based on the quantitative levels of 8,190 proteins after data filtering (Figures 1B and S1A and STAR Methods), we observed few overall proteome changes across the two patient groups as shown by principal-component analysis (PCA) of all tumor proteomes (Figure 1C). However, the comparison of chemosensitive and chemoresistant patients identified CT45 as significantly more highly expressed in chemosensitive patients (FDR < 5%; Figure 1D). Kaplan-Meier survival analysis confirmed that patients with high CT45 expression (top 25%) had prolonged disease-free survival compared to all others (2,754 days versus 366 days, p = 0.008; Figure S1G) and higher overall survival time (2,903 days versus 1,078 days, p = 0.016; Figure 1F). The CT45 gene family is comprised of 10 distinct but highly similar genes that are nearly identical at the protein level (amino acid identity > 98%; Figure S1D). However, MaxQuant was able to distinguish three protein groups, and while the protein group with the majority of peptides (n = 16) showed the strongest CT45 expression difference between resistant and sensitive patients (p < 0.01), the two other protein groups showed a similar trend of higher CT45 in chemosensitive patients (Figure S1E). Immunohistochemistry for CT45 confirmed the relative expression differences of CT45 in serial sections of the tumors used in the proteomic cohort and showed nuclear localization (Figures 1E and S1F).
Figure 1. Proteomics Identifies CT45 Expression to Predict Long-Term Survival in HGSOC.

(A) Summary of the shotgun proteomics workflow applied to FFPE tumors from ovarian cancer patients. Following tissue lysis and homogenization, purified proteins were digested and analyzed in single-run high-performance liquid chromotography (HPLC)-MS using a quadrupole Orbitrap mass spectrometer. Data were analyzed and quantified in MaxQuant (Cox et al., 2014; Cox and Mann, 2008).
(B) Number of quantified proteins from chemotherapy-resistant (n = 11) and -sensitive (n = 14) tumors. Error bars show standard deviation for each group.
(C) Grouping of chemotherapy-resistant and -sensitive tumor proteomes by PCA. Component 1 accounts for 12.8% of total data variability and component 2 accounts for 9.7%.
(D) Volcano plot of chemotherapy-resistant versus -sensitive tumor proteomes. Expression fold changes are plotted against the t test p value (−log10). Dashed lines indicate the significance threshold (FDR < 0.05, s0 = 2). CT45 is highlighted in green. Chemoresistant patients were defined as those with less than 6 months disease-free survival from the date of last treatment to recurrence, and sensitive patients were defined as those with more than 12 months disease-free survival from the date of last treatment to recurrence.
(E) Immunohistochemistry for CT45 and corresponding H&E staining in serial tumor sections from three representative patients.
(F) Kaplan-Meier survival analysis (log-rank test) of overall survival based on CT45 protein levels in the proteomics dataset. The patients with the highest CT45 expression (top 25%, n = 6, green, median overall survival = 95.4 months) are compared to the lower 75% (n = 19, purple, median overall survival = 35.4 months).
(G) Kaplan-Meier analysis of disease-free survival based on CT45 staining of HGSOC TMAs. Advanced-stage HGSOC patients with a staining score of 0 (n = 82) versus 1+ (n = 42) are compared.
(H) Kaplan-Meier survival analysis based on CT45 RNA levels in 284 HGSOC patients from TCGA (p = 0.0094, log-rank test for trend, IlluminaHiseq BC dataset) (Cancer Genome Atlas Research Network, 2011).
To validate the proteomic findings in a larger patient cohort, we stained tissue microarrays (TMAs) in over 200 cases of primary and metastatic epithelial ovarian cancer (Table S4). CT45 protein levels were assessed by a gynecologic pathologist blinded to patient outcomes. CT45 was only rarely expressed in cases of endometrioid, clear cell, or mucinous ovarian cancer histologic subtypes compared to the high-grade serous papillary subtype, a finding that is in line with a previous study of mRNA expression (Zhang et al., 2015). There was no difference in protein expression between corresponding primary and metastatic tumors from the same HGSOC patients. Consistent with the discovery cohort, CT45 expression correlated with chemosensitivity in 124 patients with advanced-stage HGSOC (FIGO [International Federation of Gynecology and Obstetrics] stage IIIB or higher) (p = 0.005; Table S4). Furthermore, patients with high CT45 expression (n = 42) had prolonged disease-free survival as compared to patients in whom CT45 expression was absent (n = 82) (p = 0.02, 363 days versus 153.5 disease-free days; Figure 1G), and there was a trend toward longer overall survival (p = 0.09; Figure S1H). Finally, CT45 expression strongly correlated with increased overall survival in 284 HGSOC patients based on RNA sequencing (RNA-seq) data from the Cancer Genome Atlas (TCGA) (Cancer Genome Atlas Research Network, 2011) (Figure 1H; p = 0.0094). Therefore, CT45 expression is a novel prognostic indicator for advanced-stage HGSOC.
Phosphoproteomics Reveals a Role for CT45 in Chemosensitivity
Little is known about CT45’s cellular function, prompting us to investigate the molecular mechanisms leading to improved chemotherapy response. Overexpression of CT45 in the OVCAR-5 HGSOC cell line at levels analogous to the endogenous CT45 expression in 59M ovarian cancer cells (Figure S2A) did not affect the cell cycle or proliferation (Figures S2C and S2D). However, the addition of carboplatin reduced colony formation and proliferation in CT45 expressing cells in a dose-dependent manner (Figures 2A and S2C). Similar effects were observed using a second serous ovarian cancer cell line, OVKATE, ectopically expressing CT45 (Figures S2B and S2E).
Figure 2. CT45 Enhances Sensitivity to Chemotherapy.

(A) Clonogenic survival assay of the ovarian cancer cell line OVCAR-5 stably overexpressing CT45 (green) or control vector (purple) after carboplatin (5μM and 10 μM) treatment. Mean values are shown from three independent experiments. Error bars show SEM for each group (*p < 0.05, **p < 0.01). Representative images are shown above bars.
(B) Phosphoproteomic analysis of the OVCAR-5 cell line pair ± 5 μM carboplatin treatment. Differentially regulated pathways are plotted as heatmap. Relative enrichment scores indicate upregulated (yellow) and downregulated (black) pathways across samples. Scores represent Z-scored median values from quadruplicate measurements. Arrows indicated DNA damage and repair pathways.
(C) Quantification of the cell-cycle distribution of FANCD2 foci per nucleus in untreated (Ctrl)- and carboplatin (carbo)-treated (1 hr and 24 hr) high (green)- or low (purple)-CT45-expressing 59M cells derived from the quantitative image-based cytometry (QIBC) analysis. Representative images of the staining are shown for platinum-treated cells.
(D) DNA damage was detected following carboplatin treatment at day 5 using a comet assay, which evaluates double- and single-strand breaks. Data are means ± SEM of four independent replicates (bottom). The tail length correlates to DNA damage. Representative images of comet assays are shown. OVCAR-5 cells were treated with 5μM carboplatin, and COV318 were treated with 2 μM carboplatin.
(E) Platinum content in genomic DNA isolated from OVCAR5-V5 and OVCAR5-CT45 cells treated with carboplatin (day 3) quantified using inductively coupled plasma MS (ICP-MS). Values are mean ± SEM from five biological replicates. **p < 0.01.
(F) Left: subcutaneous growth of OVCAR5-V5 (control plasmid) and OVCAR5-CT45 tumors in mice (n = 5–8) during treatment with carboplatin. Data are means ± SEM for each group. Right: immunohistochemistry for CT45 and corresponding H&E staining in OVCAR5-V5 (control plasmid) and OVCAR5-CT45 mouse tumors. Scale bar: 50 μM.
See also Figure S2.
Carboplatin treatment induces DNA interstrand crosslinks, which are sensed and repaired by the Fanconi anemia (FA) signaling pathway (Ceccaldi et al., 2016). To assess activation of FA signaling, we used phosphoproteomics on CT45 and vector control expressing OVCAR-5 cells treated with carboplatin. Pathway analysis revealed strong activation of DNA damage pathways—including the FA pathway (Figure 2B)—which were hyperactivated in CT45-expressing cells treated with carboplatin as compared to control vector cells (Figure 2B). Several Fanconi protein phosphorylation sites, including the DNA-damage-marker FANCD2, showed higher phosphorylation in CT45-expressing cells (Figure S2F), suggesting an increased DNA repair and/or DNA damage response (DDR). To test whether the FA signaling pathway is upregulated in cells expressing high endogenous CT45 levels (Figure S2A), 59M ovarian cancer cells were co-stained for CT45 and FANCD2 following carboplatin treatment and analyzed by high-content microscopy at single-cell resolution (Hansen et al., 2016; Toledo et al., 2013). Cells expressing the highest level of CT45 had increased FANCD2 foci formation in S and G2/M phases (Figures 2C and S2G–S2I), suggesting increased replication stress and DNA damage following carboplatin exposure.
To determine whether the increase in FANCD2 foci formation following carboplatin treatment results from more efficient DNA repair or from increased DNA damage, we performed single-cell gel electrophoresis (comet assay) to detect double- and single-strand DNA breaks. CT45-expressing cells had increased tail moments compared to control cells (Figure 2D), indicating higher levels of DNA damage. Consistently, in response to carboplatin, CT45 expressing cells showed increased levels of the DNA damage marker γH2AX and apoptotic cell death (Figures S2J and S2K), as well as a higher level of platinum-DNA adducts as compared to control vector cells (Figures 2E and S2L). In vivo, treatment with carboplatin significantly reduced the growth of CT45-expressing subcutaneous tumors when compared to untreated CT45-expressing tumors in an immunodeficient mouse, while treatment had no effect on tumors generated with the vector control cell line. In addition, CT45 expression significantly reduced overall tumor growth as compared to the vector control (Figure 2F). Therefore, we conclude that CT45 expression correlates with increased carboplatin-induced DNA damage in vitro and in vivo.
Interaction Proteomics Implicates CT45 in DNA Damage Signaling
To gain further mechanistic insights into CT45-mediated chemosensitivity, we mined our recent quantitative human interactome (Hein et al., 2015) and found that CT45 interacts with the evolutionary conserved protein phosphatase 4 (PP4) complex. The PP4 interaction was confirmed in two ovarian cancer cell lines (OVCAR-5 and COV318) expressing N-terminal FLAG- and C-terminal V5-tagged CT45, respectively. The regulatory subunits of the PP4 complex—PP4R3α, PP4R3β, and PP4R2—as well as the catalytic subunit, PP4C, specifically co-immunoprecipitated with CT45 (p < 0.01; Figures 3A, S2M, and S2N). The CT45-PP4 interaction was reciprocally confirmed in 59M cells endogenously expressing CT45 (Figure S2O). Gel filtration confirmed a direct interaction of recombinant CT45 with the regulatory subunit PP4R3β (Figure 3B), while there was no interaction observed with PP4R2 (Figure S2Q). Furthermore, isothermal titration calorimetry (ITC) showed a low micromolar interaction affinity between CT45 and PP4R3β (Figure 3C; KD = 0.37 μM ± 0.03). Collectively, these data demonstrate that CT45 directly and specifically binds to the PP4 complex.
Figure 3. CT45 Is an Inhibitory PP4 Interactor Impacting on DNA Damage Signaling.

(A) Interaction proteomics screen in OVCAR-5 cells stably overexpressing FLAG-tagged CT45. Protein enrichment (t test difference) was calculated over the corresponding control cell line (FLAG tag alone) and plotted against the t test p value (−log10). Dashed lines indicate significance thresholds. The bait protein CT45 (green) and members of the PP4 complex (blue) are highlighted. Results represent three replicates per experiment group with p < 0.01.
(B) Gel filtration of recombinant PP4R3β and GST-CT45. PP4R3β and GST-CT45 were incubated for 10 min on ice and loaded onto a Superdex 200 column (top) or run individually (middle: PP4R3β, bottom: GST-CT45).
(C) ITC measurements of the binding of PP4R3β to GST-CT45 (left) or GST-CDC20 (right). Binding affinity (KD) for PP4R3β/GST-CT45 was 0.37 μM ± 0.03. No binding was observed for PP4R3β/GST-CDC20.
(D) Volcano plot of ChIP-MS results for PP4C-enriched chromatin in the 59M cell line. Fold enrichment (log2) of PP4C versus immunoglobulin G (IgG) control is plotted against the t test p value (−log10). Dashed lines indicate significance thresholds (FDR < 0.05, s0 = 1). The bait protein PP4C is highlighted in blue, CT45 is in green, and the known PP4 interactor and substrate, KAP1, is in red.
(E) Volcano plot of ChIP-MS results for PP4C-enriched chromatin in stable CT45 knockdown 59M cells. Fold enrichment (log2) of the PP4C interactome in shCT45 versus shCTRL cells is plotted against the t test p value (−log10). Dashed lines indicate significance thresholds (FDR < 0.05, s0 = 1). The bait protein PP4C is highlighted in blue, and CT45 is in green.
(F) Phosphatase activity assay of the immunopurified PP4 complex in OVCAR-5 cells expressing a control vector or CT45. Quantification results represent the average of five independent experiments with t test p < 0.001. Error bars show standard deviation for each group.
(G) Phosphatase activity assay of the immunopurified PP4 complex in the presence or absence of 3 μM recombinant GST-CT45 or GST-CDC20 control protein. Quantification results (left) represent the average of five independent experiments with t test p < 0.001. Western blot (right) is shown as loading control.
(H) Kaplan-Meier survival analysis based on PP4C mRNA levels in the CT45 negative patient group of Figure 1H. Low PP4C levels in the tumor (lowest 33%, n = 28, black line) predicted significantly increased overall survival (p = 0.03) as compared to high PP4C levels (top 33%, n = 28, purple line). Patients with high CT45 expression (green line) are plotted for relative comparison.
See also Figures S2 and S3.
Since PP4 deficiency impedes the DDR (Chowdhury et al., 2005; Lee et al., 2012; Lee et al., 2010) and renders cells hypersensitive to platinum compounds (Gingras et al., 2005; Wang et al., 2008), we hypothesized that CT45 binding may interfere with PP4 activity during the DDR. One possible mechanism is that CT45 binding blocks PP4 substrate recognition, leading to a phenotype of PP4 deficiency. Since CT45 and the PP4 regulatory subunits, PP4R3α and PP4R3β, localized predominantly to nuclease-resistant chromatin (Figure S2P), we performed chromatin immunoprecipitation coupled to MS (ChIP-MS) to investigate differences in protein binding to PP4C-enriched chromatin. CT45, as well as the known PP4 substrate and chromatin regulator, KAP1/TRIM28, were strongly co-enriched along with the bait protein, PP4C (Figures 3D and S3A). However, we only found minor interaction differences when CT45 was depleted by short hairpin RNA (shRNA), indicating that CT45 does not alter PP4 substrate binding on a global scale (Figure 3E). Furthermore, CT45 did not interfere with PP4 complex assembly, as revealed by identical co-enrichment of PP4C and PP4R2 (Figure S3A), and the interaction was independent of carboplatin treatment (Figure S3B).
Since the PP4 interactome was not altered by the expression of CT45, we tested whether CT45 binding to PP4 alters PP4 phosphatase activity. Indeed, the phosphatase activity of immunoprecipitated PP4 was significantly reduced in the presence of bound CT45 as compared to cells expressing the control vector (Figures 3F and S3C). Furthermore, recombinant CT45 reduced PP4 phosphatase activity in vitro, while no inhibition was observed with a non-binding control protein at an equimolar concentration (Figures 3C [right], 3G, and S3D). These data suggest that CT45 acts as a novel endogenous regulator of PP4 signaling.
We next hypothesized that if CT45 reduces PP4 activity, CT45 expression should partially mimic PP4C knockdown on a global phosphoproteomic level. 59M cells transfected with control small interfering RNA (siRNA; siCTRL), CT45-targeting siRNA (siCT45), or PP4C-targeting siRNA (siPP4C) were analyzed by phosphoproteomics (Figures S3E–S3G). Unsupervised clustering revealed that the top co-regulated cluster of CT45-expressing and PP4C knockdown cells was enriched for phosphorylation sites related to DDR signaling (Figures S3H and S3I). This included the phosphorylation of KAP1 at S473, a known PP4-regulated site important for cell-cycle checkpoint control upon DNA damage (Lee et al., 2012) (Figure S3J). The intensity of this phosphorylation site was lowest in CT45 knockdown cells, suggesting that PP4 activity was higher than in siPP4C and siCTRL (CT45-expressing) cells. Analysis of the CT45 chromatin interactome confirmed that PP4 and its substrate KAP1 both localized to the same chromatin environment as CT45, along with other strongly enriched DNA damage and repair proteins (Figure S3K).
Collectively, these data show that CT45 inhibits PP4 directly and uncover a link between CT45 expression, chemosensitivity, and PP4 activity in ovarian cancer patients. Interestingly, while loss of PP4 in cancer is infrequent (cBioPortal, http://www.cbioportal.org/), PP4C, PP4R2, and PP4R3α are commonly overexpressed in breast and colorectal cancers (Wang et al., 2008), and upregulation of PP4C is associated with poor prognosis in colorectal cancer (Li et al., 2015). In TCGA dataset, low PP4C levels in CT45-negative patients predicted overall survival similar to that of patients with high CT45 (Figure 3H). Conversely, patients with high expression of PP4C had significantly worse overall survival as compared to patients with low PP4C expression (885 days versus 1,324 days, p = 0.03; Figure 3H).
Immunopeptidomics Identifies CT45 as a Native Tumor Antigen Regulated by DNA Methylation
Intratumoral T cell presence has long been known to be favorably associated with survival in ovarian cancer (Zhang et al., 2003). Because CT45 is a CTA—a group considered to be promising immunotherapy targets due to their high tumor specificity and immunogenicity (Coulie et al., 2014)—we next explored a possible role for the immune response in the long-term survival of CT45-expressing patients. An ideal immunotherapy target should be highly expressed in cancerous tissue and not expressed in normal, healthy tissues. We therefore analyzed a public RNA-seq dataset of 37 normal tissues (Uhlén et al. 2015) and found that CT45 was exclusively expressed in testis (Figure 4A), an immune-privileged organ, confirming that CT45 is a classic CTA (Simpson et al., 2005). In cancer tissues, CT45 expression was highest in uterine, ovarian, and testicular cancer, while little to no expression was found for the 24 remaining cancers (Figure 4B; TCGA Pan-Cancer RNA-Seq, Cancer Genome Atlas Research Network et al., 2013). Despite previous reports on CT45 expression in several tumor types (Chen et al., 2009; Heidebrecht et al., 2006; Rudolph et al., 1999), it has not been validated as a human leukocyte antigen (HLA) class-I-receptor (HLA-I)-presented antigen. To investigate this, we coupled immunopeptidomics to MS (Bassani-Sternberg et al., 2015) using the high-CT45-expressing 59M HGSOC cell line (Figures S4A and S4B). Of 6,413 identified HLA-I peptides (Table S5), five were derived from CT45: AVDPETVFK, GVQGPTAVR, GVQGPTAVRK, VQGPTAVRK, and QGPTAVRK—all of which matched the binding motifs of the A-03:01 and A-11:01 HLA-I receptors (Figures S4C–S4F). We further confirmed the identity of these peptides using tandem MS on synthetic versions (Figure S4G). In silico HLA epitope analysis predicted weak and strong binding affinity of AVDPETVFK to HLA A-03:01 or HLA A-11:01, respectively, and low or no binding affinity for the remaining four peptides (Figure 4C). This example illustrates the power of mass-spectrometry-based approaches to identify novel antigens that might fail classic in silico predictions. Using our immunopeptidomics pipeline, we found that CT45 is a naturally occurring cancer antigen presented on HLA class I receptors on ovarian cancer cells.
Figure 4. CT45 Is a Native Tumor Antigen Regulated by DNA Methylation.

(A) RNA levels of CT45 in normal tissues from the Human Protein Atlas (Uhlén et al., 2015). RNA level (transcripts per million) of the CT45 family members A1–A10 are plotted as combined average expression for each tissue. Fallopian tube and ovary are designated by an arrow.
(B) RNA levels of CT45 in cancer tissues (TCGA Pan-Cancer) (Cancer Genome Atlas Research Network et al., 2013). RNA levels (mean centered) of the detected CT45 family members A1–A6 are plotted as combined average expression for each cancer type. Ovarian cancer is highlighted by an arrow.
(C) Predicted binding affinities for HLA class I peptides of CT45 with a length of 8–11 amino acids. Top: affinities for A*03:01. Bottom: affinities for A*11:01. Affinities are plotted on the y axis as % rank 1. Weak affinity cutoff: % rank < 2; high-affinity cut-off: % rank < 0.5. Peptides identified by MS are highlighted in green.
(D) Volcano plot of the proteomic comparison between DAC-treated and control SKOV3ip1 ovarian cancer cells. Protein fold change (t test difference, log2) is plotted against the t test p value (−log10). CTAs, including CT45, are highlighted.
(E) HLA-I peptide intensity ratio from immunopeptidomics of DAC-treated versus control SKOV3iP1 ovarian cancer cells plotted against the ranked peptide ratio. CT45 peptides are highlighted in green.
(F) Heatmap of CTA peptide presentation after treatment with DAC versus control (Ctrl). HLA-I peptides between 9 and 11 amino acids are plotted. CTAs encoded on the X chromosome are highlighted in green. CT45-derived HLA-I peptides are indicated with an arrow.
See also Figures S4 and S5 and Table S5.
CT45 expression is regulated by DNA methylation (Heidebrecht et al., 2006; Zhang et al., 2015), and patients treated with demethylating agents, such as 5-aza-2′-deoxycytidine (DAC), show an altered immune response correlating with upregulation of CTAs, as well as genes involved in immunomodulatory pathways (Chiappinelli et al., 2015; Li et al., 2014). Proteomic analysis of DAC-treated SKOV3ip1 ovarian cancer cells revealed that CT45 was among the top 10 upregulated proteins, along with the CTAs NY-ESO-1, MAGEA4, and SSX2 (Figure 4D) (Chiappinelli et al., 2015; Li et al., 2014). Interestingly, CT45 expression could also be induced with DAC treatment in several other cancer cell lines independent of cancer origin (Figure S5A). This prompted us to test if DAC-induced expression of CT45 leads to peptide presentation on HLA-I receptors. We applied our immunopeptidomics strategy to the CT45-negative SKOV3ip1 ovarian cancer cell line treated with DAC (Figure S5A). SKOV3ip1 has a HLA-A genotypic background (A-03:01/A-68:01) similar to 59M cells, which we used for peptide discovery (A-03:01/A-11:01). Indeed, we identified three CT45 peptides in DAC-treated SKOV3ip1 cells derived from the same protein regions as those in the 59M cell line (Figure S4D), which matched the alleles A-03:01 and/or A-68:01 (Figures 4E and S5B–S5D and Table S5). Interestingly, while one peptide (GVQGPTAVR) was identical in the DAC-treated SKOV3ip1 cells and the 59M cell line, the two remaining peptides (EGVQGPTAVR and VAVDPETVFKR) were close sequence variants of our newly identified 59M peptides (Figure S4D). The small peptide sequence differences we observed between the two cell lines indicate different intracellular antigen processing, highlighting the potential of an even broader repertoire of ligands from CT45. Of note, we identified several other CTA peptides from SSX2, MAGEA4, and SPANXB1, which were presented on HLA-I molecules following DAC treatment (Figure 4F and Table S5), findings similar to those in a recent study in glioblastoma (Shraibman et al., 2016). These data provide a useful resource for the design of specific anti-cancer immunotherapies directed against CTAs.
CT45 Peptides Activate Patient-Derived Cytotoxic T Cells
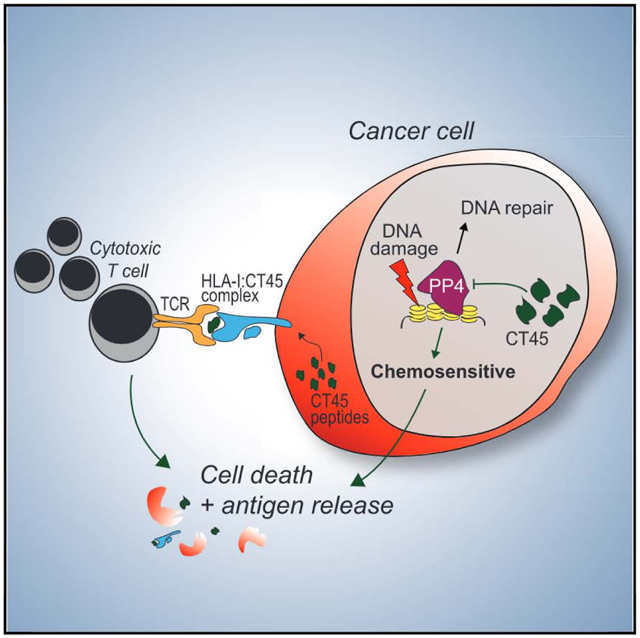
To investigate if the identified epitopes function as targets for cytotoxic CD8+ T cells, we stimulated patient-derived A-11:01 CD8+ T cells, collected from a woman with chemosensitive, CT45-positive HGSOC, with the two CT45 peptides that had the best predicted binding affinities. Both CT45 peptides, but not a control peptide, induced CD8+ T cell activation as assessed by Ki-67 and intracellular interferon γ (IFNγ) staining (Figure 5A). Similar results were obtained with HLA A-03:01 CD8+ T cells using three peptides identified after DAC treatment (Figure 5B). The A-11:01 CD8+ T cells reacted with one of two CT45 tetramers (A-11) containing the peptide AVDPETVFK, which had the highest predicted affinity for A-11:01, while A-03:01 CD8+ T cells reacted with the tetramer (A-03) containing the GVQPTAVRK peptide (Figure 5C). Co-culture of the HLA-matched CT45+ 59M cell line with peptide-stimulated A-11:01 CD8+ tumor-infiltrating lymphocytes (TILs) targeting two different CT45 peptides, lysed cancer cells in a dose-dependent manner (Figure 5D). These data demonstrate that CT45 is an endogenously processed and presented antigen, recognized and targeted by patient-derived CD8+ T cells.
Figure 5. CT45 Peptides Activate Patient-Derived Cytotoxic T Cells.

(A) Staining for Ki-67 and intracellular IFN-γ of A-11:01 CD8+ T cells after stimulation with two CT45 peptides (AVDPETVFK and GVQGPTAVRK) or one HIV negative control peptide analyzed by flow cytometry.
(B) Staining for Ki-67 and intracellular IFN-γ of A-03:01 CD8+ T cells after stimulation with three different CT45 peptides (EGVQGPTAVR, GVQGPTAVR, and VAVDPETVFKR) or HIV-negative control peptide analyzed with flow cytometry.
(C) Tetramer staining of A-11:01 or A-03:01 CD8+ T cells with two CT45 PE-labeled tetramers (AVDPETVFK and GVQGPTAVRK) and one HIV-negative control PE-labeled tetramer analyzed by flow cytometry.
(D) Lysis of HLA-A11:01 positive 59M cell line by CD8+ effector T cells (A-11:01) at indicated effector: target ratios using a chromium release assay. Data are means ± SD from two independent experiments.
(E) Proposed model of CT45 mediated chemosensitivity and long-term survival in metastatic HGSOC.
DISCUSSION
Archival biobank material is especially appropriate for proteomic analysis due to its broad availability and the possibility, essential for the identification of novel disease related factors, of integrating detailed clinico-pathologic information into the study design and data analysis. However, until recently, proteomic technology was poorly suited for in-depth proteome analysis of FFPE biobank tissue, since it required extensive sample prefractionation, large sample amounts, and long measurement times. Using a high-sensitivity, single-run strategy on minute amounts of FFPE tissue, we quantified over 9,000 proteins and identified CT45 as an independent prognostic factor for patients with advanced-stage HGSOC. To our knowledge, this is the first example of MS-based proteomics leading to the discovery of a prognostic and functionally important cancer biomarker.
In this study, MS-based proteomics indicated that CT45, a CTA of unknown function, could serve as a marker of long-term survival following chemotherapy in advanced-stage metastatic HGSOC. With a combination of quantitative proteomics and functional assays, we found that CT45 functions both as a cell intrinsic enhancer of chemosensitivity and as a non-mutant tumor antigen recognized by cytotoxic T cells (Figure 5E). These findings illustrate how a multi-level proteomics strategy can successfully discover cancer biomarkers and, at the same time, play a key role in their functional characterization—leading to the identification of novel therapeutic targets. We propose that our comprehensive strategy, which incorporates proteome quantification, phosphoproteomics, interactomics, and immunopeptidomics, is advantageous for future biomarker studies to facilitate the discovery of novel factors relevant for disease biology.
Ovarian cancer patients treated with immune checkpoint inhibitors have not benefitted from the impressive response rates evident in some other cancers (Hamanishi et al., 2015). This has been attributed to the low mutational burden present in ovarian tumors, which are characterized by massive copy-number alterations (Ciriello et al., 2013; Eckert et al., 2016). Mutational load was shown to correlate with the clinical response to CTLA-4 blockade in melanoma (Snyder et al., 2014) and to PD-1 inhibition in colorectal cancers with mismatch-repair deficiencies (Le et al., 2015). However, newer studies have revealed that defects in DNA damage repair pathways, such as the homologous recombination deficiency present in 50% of ovarian cancers, are associated with enhanced responses to immune-directed therapies (Mouw et al., 2017). Our results indicate that CT45 expression modulates chemosensitivity in ovarian cancer by affecting DNA damage repair pathways, which could also lead to improved response to immune-targeted therapies.
Little was previously known about the function of CT45. We provide evidence that tumors with high CT45 levels show an increased formation of platinum-DNA adducts following chemotherapy, which has long been known to be linked to favorable patient outcomes and increased chemosensitivity (Reed et al., 1987). We further identified CT45 as a novel endogenous regulator of PP4 signaling, directly impacting on PP4 activity. Interestingly, a recent interactomics screen revealed that CT45 is in close proximity to the DNA repair factors 53BP1 and BRCA1 (Gupta et al., 2018). These data provide additional evidence to support our findings that CT45 might play a role in the DDR and indicate a potential and yet unknown function of the protein.
The clinical implications of these findings could be significant: while an enhanced chemotherapy response results in immediate disease control and remission, CT45’s role as a tumor-specific antigen may be particularly relevant to long-term survival. In our discovery cohort, three patients that had CT45-positive tumors showed relapse-free long-term survival for an average of 7 years. Two of these patients are positive for the HLA class I alleles A-03:01 or A-11:01, which, through immunopeptidomics, were found to bind CT45-derived peptides (Figures 4 and 5). Tumor-infiltrating T cells from the CT45-positive tumors of several patients bound to CT45-peptide-containing tetramers. Future studies could seek to identify the T cell receptor responsible for CT45 recognition and engineer T cells recognizing CT45 for adoptive T cell transfer in the setting of acquired platinum resistance. In addition, a treatment strategy in which CT45 expression is reactivated using demethylating agents, which are in clinical trials, may be effective against tumors lacking CT45. Based on our results, expression of CT45 is expected to improve the efficacy of platinum-based chemotherapy or immunotherapy for patients with advanced-stage ovarian cancer.
STAR★METHODS
CONTACT FOR REAGENT AND RESOURCE SHARING
Further information and requests for resources and reagents should be directed to and will be fulfilled by the Lead Contact, Matthias Mann (mmann@biochem.mpg.de).
EXPERIMENTAL MODEL AND SUBJECT DETAILS
Cell lines
All cell lines were tested for mycoplasma and authenticated using a commercial service (CellCheck, IDEXX Bioresearch). The ovarian cancer cell lines SKOV3ip1, OVCAR5, and COV318 were cultured in DMEM + 10% FCS + 1% pen/strep and are of female origin. 59M (ovarian cancer) was cultured in DMEM + 10% FCS + 1% pen/strep + 10μg/mL insulin and is of female origin. HCC1143 (breast cancer) and OVKATE (ovarian cancer) were cultured in RPMI 1640 + 10% FCS + 1% pen/strep and are of female origin. MFM223 (breast cancer) was cultured in MEM + 10% FCS + 1% pen/strep and is of female origin. JY (lymphoblastoid) was cultured in RPMI 1640 + 10% FCS + 1% pen/strep and is of male origin. Derivatives of these cell lines generated in this paper were maintained under the same conditions. A complete list of cell lines can be found in the KEY RESOURCES TABLE.
KEY RESOURCES TABLE
| REAGENT or RESOURCE | SOURCE | IDENTIFIER |
|---|---|---|
| Antibodies | ||
| Mouse monoclonal Ki-CT45-2 antibody | Dr. Hans-Jürgen Heidebrecht (Kiel, Germany) | N/A |
| Mouse monoclonal anti-HLA-ABC antibodies W6/32 | Thermo Fisher Scientific | #MA1-19027; RRID: AB_1076699 |
| Rabbit monoclonal anti-γH2AX | Cell Signaling | #9718; RRID: AB_2118009 |
| Rabbit polyclonal anti-Cleaved CASP-3 | Cell Signaling | #9661; RRID: AB_2341188 |
| Rabbit anti-IgG-HRP | Cell Signaling | #7074; RRID: AB_2099233 |
| Mouse anti-IgG-HRP | Cell Signaling | #7076; RRID: AB_330924 |
| Rabbit polyclonal anti-PPP4C | Bethyl | #A300-835A; RRID: AB_597901 |
| Rabbit polyclonal anti-SMEK2 | Bethyl | #A300-842A; RRID: AB_597905 |
| Rabbit polyclonal anti-KAP1 | Bethyl | #A300-274A; RRID: AB_185559 |
| Mouse monoclonal anti-Actin | Sigma | #A5441; RRID: AB_476744 |
| Rabbit polyclonal anti-CT45A | Sigma | #SAB1301842 |
| Rabbit polyclonal anti-PPP4R2 | Sigma | #HPA034695; RRID: AB_10671231 |
| Rabbit polyclonal anti-PPP4R3α | Sigma | #HPA002568; RRID: AB_1079207 |
| Rabbit monoclonal anti-FANCD2 | Abcam | #ab108928; RRID: AB_10862535 |
| Mouse monoclonal anti-γH2AX | Life Technologies | #MA1-2022; RRID: AB_559491 |
| Mouse monoclonal anti-V5 | Life Technologies | #MA5-15253; RRID: AB_10977225 |
| Mouse monoclonal anti-GST | Abcam | #3G10/1B3; RRID: AB_524046 |
| Biological Samples | ||
| Ovarian cancer specimens, Tables S1 and S2 | This paper | N/A |
| Tumor infiltrating T cells | This paper | N/A |
| Chemicals, Peptides, and Recombinant Proteins | ||
| Carboplatin | Hospira | N/A |
| Growth factor reduced Matrigel | BD Biosciences (Rockville, MD) | 356231 |
| Synthetic HLA-I peptides of CT45 | Core facility, Max Planck Institute of Biochemistry, Martinsried, Germany | N/A |
| MHC class-I tetramers | NIH Tetramer Core Facility | N/A |
| Recombinant PP4R3β | Dr. Jakob Nilsson (University of Copenhagen, Denmark) | N/A |
| Recombinant GST-CDC20 | Dr. Jakob Nilsson (University of Copenhagen, Denmark) | N/A |
| Critical Commercial Assays | ||
| Ser/Thr phosphatase assay kit | Millipore | #17-127 |
| Deposited Data | ||
| Raw and analyzed data | This paper | http://proteomecentral.proteomexchange.org/cgi/GetDataset (dataset identifier PXD010372) |
| Patient information Tables S1 and S2 | This paper | N/A |
| Ovarian cancer proteome data, Table S3 | This paper | N/A |
| Patient information of tissue microarray, Table S4 | This paper | N/A |
| HLA-I peptidomes of cell lines, Table S5 | This paper | N/A |
| RNaseq analysis of 37 tissues | Uhlén et al., 2015 | https://www.proteinatlas.org/about/download |
| RNAseq expression analysis of HGSOC and across cancers | TCGA | IlluminaHiseq BC and HiSeqV2_PANCAN |
| Experimental Models: Cell Lines | ||
| SKOV3ip1, female origin. | Dr. Gordon Mills, M.D. Anderson Cancer Center, Houston, TX | N/A |
| OVCAR5, female origin. | UCSF | N/A |
| COV318, female origin. | Dr. Gottfried Koneczny, UCLA | N/A |
| 59M, female origin. | ECACC | #89081802 |
| HCC1143, female origin. | DSMZ | #ACC-517 |
| MFM223, female origin. | ECACC | #98050130 |
| JY, male origin. | Sigma | #94022533 |
| OVKATE, female origin. | Dr. Gottfried Koneczny, UCLA | N/A |
| OVCAR-5-V5, female origin. | This paper | N/A |
| OVCAR-5-CT45, female origin. | This paper | N/A |
| OVKATE-V5, female origin. | This paper | N/A |
| OVKATE-CT45, female origin. | This paper | N/A |
| COV318-V5, female origin. | This paper | N/A |
| COV318-CT45, female origin. | This paper | N/A |
| 59M shCTRL (control), female origin. | This paper | N/A |
| 59M shCT45, female origin. | This paper | N/A |
| Experimental Models: Organisms/Strains | ||
| Athymic nude mice (Hsd: Athymic Nude-Foxn1nu) | Envigo (Harlan) | N/A |
| Oligonucleotides | ||
| siRNA anti-CT45A1-A10 | siTools Biotech | 23094 SIPA1L3 |
| siRNA anti-PP4C | Dharmacon | M-008486-01 |
| siRNA anti-CT45A2 | Dharmacon | M-190513-00 |
| Non-targeting siRNA control pool | Dharmacon | D-001206-13-05 |
| Recombinant DNA | ||
| pLX304 plasmid | Yang et al., 2011 | Addgene plasmid #25890 |
| pLX304-CT45A5 plasmid | Cormier et al., 2010, 2011; Seiler et al., 2014 | DNASU Plasmid Repository, clone HsCD00446210 |
| pcDNA3.1 plasmid | Invitrogen | Catalog no. V790-20 |
| pcDNA™5/FRT/TO-Venus, pcDNA™5/FRT/TO-SMEK1-Venus and pcDNA™5/FRT/TO-SMEK2-Venus | Dr. Jakob Nilsson (University of Copenhagen, Denmark) | N/A |
| pGFP-C-shLenti-CT45, sequence: ATGCTTGAAGGAGTGCAAGGACCTACTGC | OriGene Technologies | TL315298 |
| pGFP-C-shLenti control | OriGene Technologies | TR30021 |
| Software and Algorithms | ||
| MaxQuant | Cox and Mann, 2008 | http://www.coxdocs.org/doku.php?id=maxquant:start |
| Perseus | Tyanova et al., 2016a | http://www.coxdocs.org/doku.php?id=maxquant:start |
| R framework | R Development Core Team, 2011 | https://www.r-project.org/ |
| Stata Version 14 | Stata, College Station, TX | https://www.stata.com/stata14/ |
| Graphpad Prism | GraphPad | https://www.graphpad.com/scientific-software/prism/ |
Clinical samples
Clinico-pathologic parameters for all patients included in this study are summarized in Tables S1, S2, and S4. Informed consent was obtained before surgery and the study was approved by the IRB of the University of Chicago. All clinical samples included in this study were obtained from women diagnosed with advanced stage HGSOC (minimum age at diagnosis 50).
Mouse models
All experiments were approved by the Institutional Animal Care and Use Committee of the University of Chicago. Five million OVCAR5-V5 or OVCAR5-V5-CT45 cells suspended in a 1:2 solution of serum-free media to growth-factor reduced matrigel. Cells were injected subcutaneously into the right and left flanks respectively, of eight weeks old, female, immunodeficient, athymic nude mice (Hsd: Athymic Nude-Foxn1nu). Mice were not involved in previous procedures and were treatment naive. Mice were housed under standard conditions with a normal light/dark cycle and treatment occurred during the light cycle. After five days, treatment with carboplatin was administered through the tail vein 1 time/week at 20 mg/kg. Sterile water served as the control treatment. Tumor growth was measured every 2-3 days using calipers until the tumor volume approached 1 cm3 and then tumors were measured daily. Once the tumor reached 1 cm3 the mice were sacrificed. Four mice were removed from the study early due to skin ulcerations.
METHOD DETAILS
Formalin fixed paraffin embedded tissue preparation for MS analysis
Tumors were collected from patients undergoing primary debulking surgery by a gynecologic oncologist at the University of Chicago Hospital, Department of Obstetrics and Gynecology, Section of Gynecologic Oncology. Informed consent was obtained before surgery and the study was approved by the IRB of the University of Chicago. FFPE biobank specimens (5 serial sections, 10 μM thick) were first deparaffinized by two washes in 1ml xylene (5 min at 50°C each) followed by two washes in 1ml absolute ethanol. Ethanol was removed completely and sections air-dried. Areas containing 70% or more tumor were macrodissected from the slide using a scalpel blade. For this purpose, a hematoxylin stained section of the same tumor was used as reference. Lysis was then carried out in 4% SDS, 10 mM HEPES pH 8.0 at 99°C for 60 min and by 15 min sonication (Bioruptor, Diagenode, Belgium). Proteins in the cleared lysate (16,000 g, 10 min) were reduced with 10 mM DTT for 30 min and alkylated with 55 mM iodoacetamide for an additional 30 min. 100 ug of proteins were purified from SDS by acetone precipitation and the protein pellet resolved in 100 μL 6 M urea/2 M thiourea (in 10 mM HEPES pH 8.0). LysC digestion was carried out with 1 μg of LysC for 3 h at room temperature. After adding 4 volumes of 50 mM ammonium bicarbonate buffer, 1 μg trypsin was added for tryptic digestion overnight. The next day, digestion was stopped by adding 1% TFA. Peptides were finally desalted on C18 StageTips, suspended in 10 μL 2% acetonitrile, 0.1% TFA and kept at −20°C until MS analysis. The majority of samples were injected twice for MS analysis. Samples from the two patient groups were measured in random order.
Liquid Chromatography-MS analysis of FFPE samples
For LC-MS analysis, a Q Exactive (Michalski et al., 2011) (Thermo Fisher Scientific) mass spectrometer was coupled on-line to an EASY-nLC 1000 HPLC system (Thermo Fisher Scientific). Desalted peptides were separated on in-house packed C18 columns (75 μm inner diameter, 50 cm length, 1.9 μm particles, Dr. Maisch GmbH, Germany) in a 250 min gradient from 2% to 60% in buffer B (80% acetonitrile, 0.5% formic acid) at 200 nL/min. Mass spectra were acquired in data-dependent mode. Briefly, each survey scan (range 300 to 1,650 m/z, resolution of 70,000 at m/z 200, maximum injection time 20 ms, ion target value of 3E6) was followed by high-energy collisional dissociation based fragmentation (HCD) of the 5 most abundant isotope patterns with a charge ≥ 2 (normalized collision energy of 25, an isolation window of 2.2 m/z, resolution of 17,500, maximum injection time 120 ms, ion target value of 1E5). Dynamic exclusion of sequenced peptides was set to 45 s. All data was acquired using Xcalibur software (Thermo Scientific).
Data analysis of proteomic raw files
MS raw files were processed with the MaxQuant software (Cox and Mann, 2008) (version 1.5.3.15). The integrated Andromeda search engine (Cox et al., 2011) was used for peptide and protein identification at an FDR of less than 1%. The human UniProtKB database (August 2015) was used as forward database and the automatically generated reverse database for the decoy search. ‘Trypsin’ was set as the enzyme specificity. We required a minimum number of 7 amino acids for the peptide identification process. Proteins that could not be discriminated by unique peptides were assigned to the same protein group (Cox and Mann, 2008). Label-free protein quantification was performed using the MaxLFQ (Cox et al., 2014) algorithm. Briefly, quantification was based on extracted high-resolution 3D peptide features in mass-to-charge, retention time and intensity space. Only common peptides were used for pairwise ratio calculations. Protein ratios were then determined based on median peptide ratios. We required a minimum peptide ratio count of 1 to report a quantitative readout and averaged the results from duplicate measurements of the same sample. The ‘match-between-runs’ feature of MaxQuant was enabled to transfer peptide identifications across runs based on high mass accuracy and normalized retention times. Prior to data analysis, proteins, which were found as reverse hits or only identified by site-modification, were filtered out.
Tissue microarray
Tumors were collected from patients undergoing primary debulking surgery by a gynecologic oncologist at the University of Chicago Hospital, Department of Obstetrics and Gynecology, Section of Gynecologic Oncology. Informed consent was obtained before surgery and the study was approved by the IRB of the University of Chicago. Tissue were assembled in TMAs as 1 μM cores in duplicates. Tissue microarrays (TMAs) were deparaffinized and rehydrated through xylenes and serial dilutions of EtOH to deionized water. They were incubated in antigen retrieval buffer (Tris-EDTA, pH 9, S2367, DAKO) and heated in steamer at over 97°C for 20 min. Tissue sections were incubated in a humidity chamber with CT45A antibody (1:200, Sigma, SAB1301842) for 1h at room temperature. The antigen-antibody binding was detected by Bond Polymer Refine Detection (DS9800, Leica Microsystems). Tissue sections were briefly immersed in hematoxylin for counterstaining and were covered with cover glasses. The stained TMAs were scored by an expert pathologist on a scale from 0-3 reflecting staining intensity. Data acquisition and analysis were blinded.
Human Leukocyte Antigen peptidomics
SKOV3ip1 cells were treated with 500nM 5-aza-2′-deoxycytidine (DAC) (Sigma, MO) for 3 days with DAC refreshed every 24 hours. After treatment cells were cultured an additional 4 days without DAC and collected for HLA-I purification at day seven. 59M ovarian cancer cells were cultured under normal conditions prior to collection. HLA-I types of cell lines were determined using high-resolution genotyping (Center for Human Genetics and Laboratory Medicine, Martinsried). HLA peptide purification, mass spectrometric analysis and data analysis were performed as previously described (Bassani-Sternberg et al., 2015).
Briefly, HLA-I complexes were purified from 1×10⁸ cells after lysis with 0.25% sodium deoxycholate, 0.2 mM iodoacetamide, 1 mM EDTA, 1:200 Protease Inhibitors Cocktail (Sigma, MO), 1 mM PMSF, 1% octyl-β-D glucopyranoside (Sigma, MO) in PBS at 4°C for 1 h. The lysates were cleared by centrifugation (40,000 × g, 30min) and HLA-I molecules immunopurified with the W6/32 antibody covalently bound to Protein-A Sepharose beads (Invitrogen). Affinity columns were washed with 10 column volumes of 150 mM NaCl, 20 mM Tris∙HCl (buffer A), 10 column volumes of 400 mM NaCl, 20 mM Tris∙HCl, 10 volumes of buffer A again, and seven column volumes of 20 mM Tris∙HCl, pH 8.0. Elution was carried out at room temperature with 500 μl of 0.1 N acetic acid, in total 7 elutions per sxample. Small aliquots of each elution fraction were analyzed by 12% SDS- PAGE to evaluate the yield and purity of the eluted HLA-I. To purify HLA-I peptides, eluted samples were loaded on Sep-Pak tC18 (Waters, MA) cartridges pre-washed with 80% acetonitrile (ACN) in 0.1% trifluoroacetic acid (TFA) and with 0.1% TFA only. After sample loading and washing with 0.1% TFA, peptides were separated from HLA-I heavy chains by eluting them with 30% ACN in 0.1% TFA and further purified using a Silica C-18 column tips (Harvard Apparatus, MA). Elution was again carried out with 30% ACN in 0.1% TFA. Finally, peptides were vacuum concentrated until 15ul remained and kept at −20°C until MS analysis. 5 μl of each sample containing highly enriched HLA peptides were injected to LC-MS/MS analysis. During LC-MS/MS analysis, precursor fragmentation was excluded for unassigned precursor ion charge states, or charge states of four and above. Raw files were then analyzed with MaxQuant including the following adaptations. Peptide length was restricted to 8-15 amino acids with a maximum peptide mass of 1500 Da and maximum charge state of 3. Protease mode was set to ‘unspecific’, protein FDR was set to 1 and ‘Arg’ and ‘Lys’ sequence constraints of the decoy database were disabled. The final list of HLA-I peptides was derived from the ‘peptide.txt’ output table and reverse hits were neglected in the data analysis.
We used the GibbsCluster-1.0 Server tool (Andreatta et al., 2013) to perform Gibbs clustering analysis of all identified 9-mer HLA-I peptides as input using the default settings for 1 -6 clusters. The resulting motifs were compared to the known and predicted motifs of the HLA-I alleles using the MHC motif viewer (Rapin et al., 2010). Binding motifs were plotted using the Seq2Logo tool (Thomsen and Nielsen, 2012). The NetMHC 4.0 algorithm (Andreatta and Nielsen, 2016) was used to model binding affinity of the identified peptides using default affinity thresholds for peptide binding (% rank 0.5 for strong binders and 2 for weak binders - in silico analysis Figure 4C). The list of cancer-testis antigens (Figures 4D–4F) was obtained from the CT database (http://www.cta.lncc.br/).
T cell peptide stimulation
Tumors and ascites were collected from patients with advanced stage high grade serous ovarian cancer undergoing primary debulking surgery at the University of Chicago. Tumor infiltrating lymphocytes (TIL) were thawed and resuspended in RPMI, 10% FCS (or human serum). Cells were adjusted to 2×10⁶/mL in 24-well plates and cultured for 7-10 days in the presence or absence of 1 μg/mL peptide. After 3 days, 6 IU/mL of rhIL-2 was added to the culture, followed by flow cytometric analysis of cultured cells.
Intracellular cytokine staining
In vitro expanded TILs were restimulated at the end of culture with the relevant peptide (100 ng/mL) in the presence of Brefeldin A (BD Biosciences) for about 5-6 hours at 37°C in a 5% CO2 incubator. The cells were washed once with FACS buffer and stained with surface makers (anti-CD3, −CD8, live/dead stain) for 30 min on ice. Then they were fixed and permeabilization with the Cytofix/Cytoperm kit (BD Biosciences), and stained for cytokines using an anti-IFN-γ antibody. After washing, the cells were analyzed on a flow cytometer.
Tetramer staining
PE-labeled, MHC class-I tetramers carrying CT45 antigen (GVQGPTAVRK AVDPETVFK) or HIV peptides (RLRPGGKKK or QVPLRPMTYK) were provided by the NIH Tetramer Core Facility (Atlanta, GA). In vitro expanded TILs were incubated with PE-labeled MHC Class I tetramers along with surface staining antibodies (anti-CD3,−CD8, live/dead stain) for 1 hour on ice. After washing, the cells were analyzed on a flow cytometer.
51Cr release assays
The 59M ovarian tumor cell line (target cells) was labeled with 100 μCi 51Cr at 37°C for 1 hour. Target cells were than washed three times in PBS, resuspended in culture medium at 1×10⁵ viable cells/mL and 100 μL was added per well of a 96-well U-bottom plate. In vitro expanded TILs (effector cells) were washed twice in culture medium and added to targets at the given ratios. Plates were shortly centrifuged to settle cells, and incubated at 37°C in a 5% CO2 incubator for 5 hours after which time the supernatants were harvested, transferred to small tubes and counted using a Liquid Scintillation Counter. Spontaneous 51Cr release was evaluated in target cells incubated with medium alone. Maximal 51Cr release was measured in target cells incubated with a cell lysis solution (Zap-Oglobin II; Beckman Coulter) at a final concentration of 1% (v/v). Percent specific lysis was calculated as (experimental - spontaneous lysis/maximal - spontaneous lysis) times 100.
Clonogenic survival assay
Cells were treated with different carboplatin concentrations (as indicated in the figure legends) for 48-72 hours. 2000 cells per 6-well were then plated for 7-9 days in drug-free medium. Grown colonies were fixed and stained with 1% formaldehyde, 1% methanol and 0.05% Crystal Violet for 20 min. The colonies were counted with the ColonyArea ImageJ plugin and plotted as percent of control on a logarithmic scale.
Western blot analysis
Cells were treated with the indicated drugs for three days and then media was changed. On the indicated day of collection, both adherent and non-adherent cells were collected in RIPA buffer (25mM Tris-HCl pH 7.6, 150mM NaCl, 1% NP-40, 0.5% sodium deoxycholate, 0.1% SDS) supplemented with protease inhibitor cocktail (Thermo Scientific) and phosphatase inhibitor cocktail (Sigma). Lysates were incubated for 30 min on ice, sonicated and cleared by centrifugation (15min, 14 000 rpm, 4°C). The quantity of protein was determined by BCA reagent (Pierce). The extracts were resolved by SDS-PAGE on a 4%–20% gradient gel (Bio-Rad), transferred, and incubated with the indicated antibodies, followed by detection using enhanced chemiluminescent regent (Bio-Rad). Membrane images were acquired using a G:BOX (Syngene).
Comet assay
Cells were treated with carboplatin as described in the legend to Figure 2D for three days and then incubated an additional two days without drug. The comet assay was performed on day 5 as previously described (Nandhakumar et al., 2011). Briefly, grease-free, glass slides were prepared by layering 150 μl of hot 1% normal melting point agarose (NMPA) in PBS on top of the slide. Once dried, 1 × 10⁵ cancer cells were resuspended in 500 μl 0.5% low melting point agarose (LMPA) in PBS at 37°C and 70 μl of the cell suspension was placed over the NMPA layer with a coverslip added on top. The cell layer was solidified in the refrigerator for 15 min. Then, the coverslip was removed and a second layer of 70 μl 0.5% LMPA was added on top with a new coverslip. After solidifying, the coverslip was removed and the slides were immersed in cold lysis working solution (Stock solution: 2.5M NaCl, 100mM EDTA, 10mM Tris, pH 10; Working solution: 108ml of stock + 1.6ml of 1% Triton X-100) for 1 hr. Slides were then transferred to a new tray containing cold electrophoresis buffer (Stock solution I: 10N NaOH; Stock solution II: 200mM EDTA, pH 10; Working solution: 30ml Stock I + 5ml Stock II, up to 1L with distilled water) and incubated for 20min at 4°C. Slides were then arranged in a gel electrophoresis apparatus perpendicular to the electrodes and just covered with buffer. The gels were run for 20min at 25 V, covered with aluminum foil. The slides were then incubated in neutralization buffer (0.4M Tris, pH 7.5) 2 times, 5min each and then placed in distilled water for 3min. To stain the DNA, 70 μl of SYBR Gold (1:10,000) was placed on top of the slide with a clean coverslip. Images were taken at 10× using a Zeiss AxioObserver A.1. At least 100 cells were quantified/ sample using the software OpenComet (Gyori et al., 2014). Data shown is the mean ± SEM of 4 biological repeats.
Inductively coupled plasma-high resolution mass spectrometry
To detect carboplatin accumulation in genomic DNA, total DNA was extracted from cells following 3 days of treatment with 5μM carboplatin using the Wizard Genomic DNA Purification Kit (Promega). DNA concentrations were determined using a NanoDrop (ThermoFisher Scientific). Cells were pelleted and washed 3 times with ice-cold PBS prior to DNA extraction. Platinum content was measured using ICP-MS at Northwestern University. An aliquot of DNA was set aside for dot-blot analysis.
Platinum-DNA adduct detection by dot-blot
5 μg DNA was spotted onto a nitrocellular membrane using a 96-well Bio-Dot apparatus (Bio-Rad). The blot was subjected to a standard western blot procedure using anti-CDDP adducts antibody (1:1000; clone ICR4, EMD Millipore). Following development, membranes were incubated with 0.1ug/mL Hoechst (Life Technologies) for 10min in PBS. Total DNA was visualized under UV light.
Affinity purification and mass spectrometry
Affinity purification coupled to mass spectrometry (AP-MS) was performed as previously described (Hubner and Mann, 2011). Cells were lysed in 150mM NaCl, 50mM Tris (pH 7.5), 5% glycerol, 1% IGPAL-CA-630 (Sigma, #I8896), protease inhibitors (EDTA-free, Roche), phosphatase inhibitors (Roche), 1mM MgCl2 and 1% Benzonase for 30min on ice. For immunoprecipitation of cell lines ectopically expressing N-terminally tagged CT45A1 (3×FLAG tag) or C-terminally tagged CT45A5 (V5 tag), 30 μL of ANTI-FLAG M2 Affinity Gel (Sigma) or ANTI-V5 Affinity Gel (Sigma, CLONE V5-10), respectively, was used and incubated with 1 mg of total lysate overnight at 4°C. After three washing steps in washing buffer (150mM NaCl, 50mM Tris (pH 7.5), 5% glycerol, 0.05% IGPAL-CA-630) and three washing steps in a buffer containing 150mM NaCl, 50mM Tris (pH 7.5), 5% glycerol, elution was carried out by a partial on-bead digest. Peptides were finally desalted with C18 StageTips prior to MS analysis.
Chromatin experiments
Chromatin fractionation was performed as described previously (Goodarzi et al., 2008). Briefly, soluble proteins and proteins bound to open or compacted chromatin were separated by stepwise increasing the salt and nuclease (MNase) treatment. 1E7 cells were washed with PBS and 1 mL low salt buffer (LSB:10 mM HEPES [pH 7.4], 25 mM KCl, 10 mM NaCl, 1mM MgCl2, 0.1 mM EDTA). Pelleted cells were then resuspended in six times the packed cell volume (PCV) of LSB supplemented with protease and phosphatase inhibitor cocktail (Roche). After snap freezing in liquid nitrogen, samples were quickly thawed and immediately centrifuged (10 min at 10,000 rpm). The pellet was resuspended in a volume of high-salt buffer (HSB: 50 mM Tris-HCl [pH 8.0], 5% [v/v] glycerol, 1 mM EDTA, 10 mM MgCl2, 400 mM KCl, supplemented with protease and phosphatase inhibitor cocktail), equal to 0.25 V of LSB. After centrifugation at 10,000 rpm (supernatant = nucleoplasmic fraction), the pellet was resuspended in a volume nuclease buffer containing 10 U/mL MNase (NEB) and incubated at 37°C for 10 min and centrifuged for 5 min at 10,000 rpm (supernatant = chromatin fraction 1). The pellet was then resuspended in the same volume of nuclease buffer containing 100 U/mL MNase and incubated another 45 min at 37°C before an equal V of solubilization buffer (nuclease buffer + 2% [v/v] NP-40, 2% [v/v] Triton X-100, 600 mM NaCl) was added. After brief vortexing, samples were centrifuged (5 min, 10,000 rpm) and the supernatant collected (chromatin fraction 2). Finally, the pellet was resuspended in a volume of solubilization buffer and an equal V of denaturing buffer (50 mM Tris [pH 6.8], 1% [v/v] SDS, 100 mM DTT, 10% glycerol), briefly sonicated, boiled for 5 min, and centrifuged for 5 min at 10,000 rpm (supernatant = chromatin fraction 3).
For ChIP-MS, freshly harvested cells were crosslinked with 1% formaldehyde for 10 min in PBS. Cells were lysed in IP Buffer (50 mM Tris-HCl (pH 8), 100 mM NaCl, 5mM EDTA (pH 8), 0.3% SDS, 1.7% Triton X-100, supplemented with EDTA-free protease inhibitor cocktail (Roche) and phosphatase inhibitor cocktail (Roche)) and chromatin sonicated to an average size of 200-400 bp. 1 mg of total cell lysate was incubated with 3 μg of respective antibody overnight at 4°C under constant rotation. The next day, 30 μl of protein G-coupled agarose beads (Cell signaling technology) were added and incubated for 3h at 4°C under constant rotation. Antibody-bait complexes were then washed three times with low salt wash buffer (50 mM HEPES pH 7,5, 140 mM NaCl, 1% Triton), once with high salt wash buffer (50 mM HEPES pH 7,5, 500 mM NaCl, 1% Triton) and twice with TBS. Elution was carried out by a partial on-bead digest as recently described (Hubner and Mann, 2011). Peptides were finally desalted with C18 StageTips prior to MS analysis.
Purification of proteins
GST-CT45 expressing in BL21 (DE3) was induced by 0.5 mM IPTG for 3 hours at 37 degrees. Cells were harvested and pellets suspended in buffer R (500 mM NaCl, 50 mM Tris pH = 8.0, 5% glycerol, 5 mM beta-mercaptoethanol, 0,05% Tween-20, 1mM PMSF) and lyzed using a high-pressure homogenizer (EmulsiFlex-C3, Avestin) and centrifuged at 25000 g for 45 min. Supernatant was incubated with Glutathione Sepharose 4B (GE Healthcare) for 60 min at 4 degrees and resin washed with 40 column volumes of buffer R. GST-CT45 was eluted with 1 column volume of 500 mM NaCl, 50 mM Tris 8.8, 20 mM glutathione for 20 min and further purified on a superdex 200 10/300 (GE healthcare) column equilibrated with buffer R and non-aggregated form of GST-CT45 used for binding experiments. Preparation of GST-CT45 for ITC measurements were done as above but glycerol and Tween-20 was omitted from buffer R.
His tagged SMEK2 and PPP4R2 were expressed at 18 degrees overnight and suspended in lysis buffer (50 mM NaP pH = 7.5, 300 mM NaCl, 10 mM immidazole, 10% glycerol, 0.5 mM TCEP, benzonase and protease inhibitor cocktail (complete EDTA-free (Roche)) and lyzed using a high-pressure homogenizer (Avestin). Supernatant was clarified by centrifugation and loaded on a 5 mL HiTrap chelating Nickel column (GE healthcare) and washed with lysis buffer containing 30 mM immidazole. His tagged proteins were eluted using lysis buffer containing 500 mM immidazole and further purified using size exclusion chromatography in 50 mM NaP pH = 7.5, 150 mM NaCl, 10% glycerol, 0.5 mM TCEP.
Size exclusion chromatography binding experiments
GST-CT45 (140 ug) was incubated with 200 ug of SMEK2 or PP4R2 in 550 ul binding buffer (500 mM NaCl, 50 mM Tris pH = 8.0, 5% glycerol, 0.05% Tween 20, 5 mM mercaptoethanol) for 10 min on ice. Binding reactions were fractionated on superdex 200 10/300 (GE healthcare) equilibrated with binding buffer and fractions analyzed by SDS-PAGE.
Isothermal Titration Calorimetry
All ITC experiments were performed on an Auto-iTC200 instrument (Microcal, Malvern Instruments) at 25°C. Prior to ITC experiments protein samples were extensively dialyzed against 40 mM Tris pH 8.0, 500 mM NaCl, 5 mM β-mercaptoethanol. Protein concentrations were determined using a spectrometer by measuring the absorbance at 280 nm and applying values for the extinction coefficients computed from the corresponding sequences by the ProtParam program (https://web.expasy.org/protparam/). PPP4R3B at approximately 100 μM concentration was loaded into the syringe and titrated into the calorimetric cell containing either GST-CT45A1 or GST-CDC20-mut1 at ~5 μM (dimer concentration). The reference cell was filled with distilled water. The titration sequence consisted in all cases of a single 0.4 μL injection followed by 19 injections, 2 μL each, with 150 s spacing between injections to ensure that the thermal power returns to the baseline before the next injection. The stirring speed was 750 rpm. Control experiments with the titrants injected in the sample cell filled with buffer were carried out under the same experimental conditions. These control experiments showed heats of dilution negligible in all cases. The heats per injection normalized per mole of injectant versus the molar ratio [titrant in the syringe]/[titrate in the cell] were fitted to a single-site model. Data were analyzed with MicroCal PEAQ-ITC (version 1.1.0.1262) analysis software (Malvern Instruments).
Phosphatase activity assay and phosphoproteomics
Cellular protein phosphatase 4 (PP4) activity was measured after transfection with PP4R3α-Venus or Venus control vector. 24h after transfection, cells were washed with TBS twice before lysis in 150mM NaCl, 50mM Tris (pH 7.5), 5% glycerol, 1% IGPAL-CA-630 (Sigma, #I8896), protease inhibitors (EDTA-free, Roche), 1mM MgCl2 and 1% Benzonase for 30min on ice. Immunoprecipitation was carried out from lysates (500ug) using 25 μL GFP-trap agarose (2h at 4°C). Beads were washed three times in 1ml wash buffer (150mM NaCl, 50mM Tris (pH 7.5), 5% glycerol, 0.05% IGPAL-CA-630) and once in 0.5ml assay buffer (150mM NaCl, 50mM Tris (pH 7.5), 5% glycerol, 1mM MnCl2). PP4 activity was assayed in 50 μL assay buffer by incubating the immunoprecipitated protein with 200 μM of the synthetic phosphopeptide K-R-pT-I-R-R (Millipore) as a substrate at 30°C for 30 min. PP4 activity was detected with malachite green solution (Millipore) and read at 630nm. Venus control values were subtracted as unspecific background. The immunoblot intensity of PP4C calculated by ImageJ software (NIH) was used for normalization. Phosphoproteomic analysis of cell lines was done according to the ‘EasyPhos’ protocol (Humphrey et al., 2015) using 5×10⁶ - 1×10⁷ cells per replicate.
Immunofluorescence
Cells were treated with 4 μM carboplatin on coverslips. After 72hr, media was changed. At designated time points, cells were first incubated with 5-ethynyl-2 deoxyuridine (EdU) for 30min, then fixed for 10min at room temperature with 4% paraformaldehyde and washed three times with PBS. Cells were then permeabilized with PBS/0.5% Triton-X for 2 min and blocked for 30min in blocking buffer (3% BSA in PBS). Cells were then stained with an EdU labeling kit (Life Technologies) and incubated with primary antibody (Ki-CT45-2 and FANCD2) for 1h in PBS/1% BSA in at RT. Following three washes, cells were incubated with secondary antibodies (diluted in PBS/1% BSA) for 1hr at room temperature and then counterstained with Hoechst 33342 for 20 min. Slides were mounted with ProLong Gold Antifade.
Quantitative image-based cytometry
QIBC was performed as previously described (Hansen et al., 2016; Toledo et al., 2013). In short, images were acquired with a ScanR high-content microscope (Olympus) equipped with wide-field optics, a 20 × , 0.75-NA (UPLSAPO 20 × ) dry objective, a quadruple-band filter set for DAPI, FITC, Cy3 and Cy5 fluorescent dyes, a MT20 Illumination system and a digital monochrome Hamamatsu C9100 electron-multiplying CCD camera. Images were acquired in an automated fashion with the ScanR acquisition software. Typically 25 to 49 images were acquired containing at least 3,000 cells per condition. Acquisition times for the different channels were adjusted for non-saturated conditions for each data point. Images were processed and analyzed with ScanR analysis software. Extracted values were exported and analyzed with TIBCO Software. This software was used to quantify absolute, median, and average values in cell populations and to generate all color-coded plots. Within one experiment, same cell numbers were compared for the different conditions. Boxplots show the results of 4 biological repeats.
QUANTIFICATION AND STATISTICAL ANALYSIS
All statistical and bioinformatics analyses were done using the freely available software Perseus (Tyanova et al., 2016a) (MaxQuant environment), R framework, Stata Version 14 (Stata, College Station, TX), or GraphPad Prism (GraphPad). RNaseq expression analysis of the CT45 gene set from TCGA (IlluminaHiseq BC and RNaseq Pan-Cancer) was performed using the UCSC Cancer Browser (https://xena.ucsc.edu/welcome-to-ucsc-xena/) (Cline et al., 2013). For the IlluminaHiseq BC dataset, patients were filtered for stage IIIC or IV serous-papillary cancers and age > 50. A CT45 signature score was generated by combining expression of CT45A1-A6. The score and survival data was downloaded and used for Kaplan-Meier analysis (log-rank test for trend) based on four equally sized CT45 expression groups (Figure 1H). For normal tissue expression analysis (Figure 4A), RNaseq data of 37 tissues was downloaded from the Human Protein Atlas (Uhlén et al., 2015). For pairwise proteomic comparisons, we used a 2-sided t test statistic including a permutation-based false discovery rate (FDR) of 1% (5% for Figure 1D after filtering for a minimum of 5 valid values in at least one patient group) and an s0 value (Tusher et al., 2001) of 2. Missing values were imputed based on a normal distribution (width = 0.15; downshift = 1.8). For phosphoproteomic analyses, we filtered for class I phosphorylation sites (positional probability calculated by MaxQuant > 0.75) and required a minimum of 2 valid values in each group of quadruplicates. Unsupervised hierarchical clustering (heatmaps) of z-scored logarithmic intensities was based on Euclidean distances for row-wise and column-wise clustering. For the phosphoproteomic pathway analysis (Figure 2B), we used the annotation matrix algorithm in Perseus which calculates for each sample how the intensity distribution of a specific pathway/annotation (here comprised of individual phosphosites) compares to the intensity distribution of all phosphosites in the same sample. For all pathways significantly different from the overall intensity distribution (two-sided Wilcoxon-Mann-Whitney test, P value threshold of 0.005), a position score (between −1 and 1) is calculated, for which a value of 0 indicates the center of the overall distribution of values. The resulting annotation matrix of ‘enrichment scores’ (here Keyword pathways and kinase motifs) was then used to identify pathways differentially regulated across different samples groups (ANOVA, permutation-based FDR cutoff of 0.05). Results are visualized as heatmap based on z-scored annotation matrix scores.
For analysis of clinico-pathological data, comparisons between groups were performed using chi-square or Fisher’s exact tests for categorical variables and Wilcoxon rank-sum tests for continuous variables. Overall survival and disease-free survival was compared between groups using the log-rank test. Pathway enrichment analysis (Figure S3I) was performed in the Perseus software based on a Fisher exact test with a Benjamini-Hochberg FDR cutoff of 0.02. GOBP annotations were used for the analysis.
Sample sizes were determined based on previous experience with the individual experiment except for animal studies where power calculations were used. With the exception of the tissue microarray analysis, no randomization or blinding was done for data acquisition or assessment of outcome. The mean and the standard error of the mean (SEM) indicating variance are reported for all graphs. For experiments making one comparison, data was analyzed using a two-tailed Mann Whitney U test to account for non-normal distribution of the data. For experiments with more than one comparison, One-way ANOVA with Tukey’s multiple comparisons post-test was used. Before applying ANOVA, we first tested whether the variation was similar among the groups using the Bartlett’s test. Where the standard deviations were significantly different, a log2 transformation was applied to the data before analysis. Differences were considered significant at p < 0.05.
DATA AND SOFTWARE AVAILABILITY
The mass spectrometry proteomics data have been deposited to the ProteomeXchange Consortium (http://proteomecentral.proteomexchange.org/cgi/GetDataset) via the PRIDE partner repository with the dataset identifier PXD010372. All other data supporting the findings of this study are available within the article and its supplemental information files or from the Lead Contact upon reasonable request.
Supplementary Material
Highlights.
Clinical proteomics workflow for the analysis of archived tumor samples
Cancer/testis antigen 45 enhances chemosensitivity in metastatic ovarian cancer
CT45 is a novel protein phosphatase 4 regulator linked to DNA damage signaling
CT45 derived peptides bind HLA-I receptors and activate cytotoxic T cells
ACKNOWLEDGMENTS
We thank Ani Solaki for assistance with tail-vein injections and Shawn Pan for assistance with the comet assay (University of Chicago). We also thank Dirk Wischnewski and Rebeca Romero for the great laboratory support and fruitful scientific discussions and Korbinian Mayr, Dr. Igor Paron, and Gabriele Sowa for their assistance in mass spectrometry analysis (Max Planck Institute). We thank the core facility of the Max Planck Institute of Biochemistry (Martinsried, Germany) and the protein production and characterization platform at NNF CPR for their great scientific support. We thank the University of Chicago Human Tissue Resource Center for immunohistochemical stainings (University of Chicago Cancer Center support grant P30CA014599), the NIH Tetramer Core Facility (Atlanta, GA) for supplying CT45 tetramers, and Dr. Hans-Jürgen Heidebrecht (Kiel, Germany) for the CT45 antibody. Also, we thank Dr. Marie Larsen (CPR, Denmark) for supplying the pcDNA5-PP4R3α-Venus plasmid and Gail Isenberg for proofreading. This work was supported by the National Cancer Institute grant CA111882 (E.L.), a Harris Family Foundation award (S.D.Y.), the Körber Foundation (Körber European Science Prize), the Max Planck Society for the Advancement of Science (M.M.), the Novo Nordisk Foundation (grant agreements NNF14CC0001 and NNF15CC0001), the Danish Cancer Society (grant R167-A10951-17-S2) (J.N.), and the Ann and Sol Schreiber Mentored Investigator Award from the Ovarian Cancer Research Fund Alliance (M.C.).
Footnotes
SUPPLEMENTAL INFORMATION
Supplemental Information includes five figures and five tables and can be found with this article online at https://doi.org/10.1016/j.cell.2018.08.065.
DECLARATION OF INTERESTS
For authors F.C., E.L., M.M., and M.C., the University of Chicago and the Max Planck Society have jointly filed a patent application related to this technology.
REFERENCES
- Aebersold R, and Mann M (2016). Mass-spectrometric exploration of proteome structure and function. Nature 537, 347–355. [DOI] [PubMed] [Google Scholar]
- Anderson NL, Ptolemy AS, and Rifai N (2013). The riddle of protein diagnostics: future bleak or bright? Clin. Chem 59, 194–197. [DOI] [PubMed] [Google Scholar]
- Andreatta M, and Nielsen M (2016). Gapped sequence alignment using artificial neural networks: application to the MHC class I system. Bioinformatics 32, 511–517. [DOI] [PMC free article] [PubMed] [Google Scholar]
- Andreatta M, Lund O, and Nielsen M (2013). Simultaneous alignment and clustering of peptide data using a Gibbs sampling approach. Bioinformatics 29, 8–14. [DOI] [PubMed] [Google Scholar]
- Bassani-Sternberg M, Pletscher-Frankild S, Jensen LJ, and Mann M (2015). Mass spectrometry of human leukocyte antigen class I peptidomes reveals strong effects of protein abundance and turnover on antigen presentation. Mol. Cell. Proteomics 14, 658–673. [DOI] [PMC free article] [PubMed] [Google Scholar]
- Bowtell DD, Böhm S, Ahmed AA, Aspuria PJ, Bast RC Jr., Beral V, Berek JS, Birrer MJ, Blagden S, Bookman MA, et al. (2015). Rethinking ovarian cancer II: reducing mortality from high-grade serous ovarian cancer. Nat. Rev. Cancer 15, 668–679. [DOI] [PMC free article] [PubMed] [Google Scholar]
- Cancer Genome Atlas Research Network (2011). Integrated genomic analyses of ovarian carcinoma. Nature 474, 609–615. [DOI] [PMC free article] [PubMed] [Google Scholar]
- Cancer Genome Atlas Research Network, Weinstein JN, Collisson EA, Mills GB, Shaw KR, Ozenberger BA, Ellrott K, Shmulevich I, Sander C, and Stuart JM (2013). The Cancer Genome Atlas Pan-Cancer analysis project. Nat. Genet 45, 1113–1120. [DOI] [PMC free article] [PubMed] [Google Scholar]
- Ceccaldi R, Sarangi P, and D’Andrea AD (2016). The Fanconi anaemia pathway: new players and new functions. Nat. Rev. Mol. Cell Biol 17, 337–349. [DOI] [PubMed] [Google Scholar]
- Chen YT, Hsu M, Lee P, Shin SJ, Mhawech-Fauceglia P, Odunsi K, Altorki NK, Song CJ, Jin BQ, Simpson AJ, and Old LJ (2009). Cancer/testis antigen CT45: analysis of mRNA and protein expression in human cancer. Int. J. Cancer 124, 2893–2898. [DOI] [PubMed] [Google Scholar]
- Chiappinelli KB, Strissel PL, Desrichard A, Li H, Henke C, Akman B, Hein A, Rote NS, Cope LM, Snyder A, et al. (2015). Inhibiting DNA Methylation Causes an Interferon Response in Cancer via dsRNA Including Endogenous Retroviruses. Cell 162, 974–986. [DOI] [PMC free article] [PubMed] [Google Scholar]
- Chowdhury D, Keogh MC, Ishii H, Peterson CL, Buratowski S, and Lieberman J (2005). gamma-H2AX dephosphorylation by protein phosphatase 2A facilitates DNA double-strand break repair. Mol. Cell 20, 801–809. [DOI] [PubMed] [Google Scholar]
- Ciriello G, Miller ML, Aksoy BA, Senbabaoglu Y, Schultz N, and Sander C (2013). Emerging landscape of oncogenic signatures across human cancers. Nat. Genet 45, 1127–1133. [DOI] [PMC free article] [PubMed] [Google Scholar]
- Cline MS, Craft B, Swatloski T, Goldman M, Ma S, Haussler D, and Zhu J (2013). Exploring TCGA Pan-Cancer data at the UCSC Cancer Genomics Browser. Sci. Rep 3, 2652. [DOI] [PMC free article] [PubMed] [Google Scholar]
- Cormier CY, Mohr SE, Zuo D, Hu Y, Rolfs A, Kramer J, Taycher E, Kelley F, Fiacco M, Turnbull G, and LaBaer J (2010). Protein Structure Initiative Material Repository: an open shared public resource of structural genomics plasmids for the biological community. Nucleic Acids Res. 38, D743–D749. [DOI] [PMC free article] [PubMed] [Google Scholar]
- Cormier CY, Park JG, Fiacco M, Steel J, Hunter P, Kramer J, Singla R, and LaBaer J (2011). PSI:Biology-materials repository: a biologist’s resource for protein expression plasmids. J. Struct. Funct. Genomics 12, 55–62. [DOI] [PMC free article] [PubMed] [Google Scholar]
- Coscia F, Watters KM, Curtis M, Eckert MA, Chiang CY, Tyanova S, Montag A, Lastra RR, Lengyel E, and Mann M (2016). Integrative proteomic profiling of ovarian cancer cell lines reveals precursor cell associated proteins and functional status. Nat. Commun 7, 12645. [DOI] [PMC free article] [PubMed] [Google Scholar]
- Coulie PG, Van den Eynde BJ, van der Bruggen P, and Boon T (2014). Tumour antigens recognized by T lymphocytes: at the core of cancer immunotherapy. Nat. Rev. Cancer 14, 135–146. [DOI] [PubMed] [Google Scholar]
- Cox J, and Mann M (2008). MaxQuant enables high peptide identification rates, individualized p.p.b.-range mass accuracies and proteome-wide protein quantification. Nat. Biotechnol 26, 1367–1372. [DOI] [PubMed] [Google Scholar]
- Cox J, Neuhauser N, Michalski A, Scheltema RA, Olsen JV, and Mann M (2011). Andromeda: a peptide search engine integrated into the MaxQuant environment. J. Proteome Res 10, 1794–1805. [DOI] [PubMed] [Google Scholar]
- Cox J, Hein MY, Luber CA, Paron I, Nagaraj N, and Mann M (2014). Accurate proteome-wide label-free quantification by delayed normalization and maximal peptide ratio extraction, termed MaxLFQ. Mol. Cell. Proteomics 13, 2513–2526. [DOI] [PMC free article] [PubMed] [Google Scholar]
- Cress RD, Chen YS, Morris CR, Petersen M, and Leiserowitz GS (2015). Characteristics of Long-Term Survivors of Epithelial Ovarian Cancer. Obstet. Gynecol 126, 491–497. [DOI] [PMC free article] [PubMed] [Google Scholar]
- Eckert MA, Pan S, Hernandez KM, Loth RM, Andrade J, Volchenboum SL, Faber P, Montag A, Lastra R, Peter ME, et al. (2016). Genomics of ovarian cancer progression reveals diverse metastatic trajectories including intraepithelial metastasis to the fallopian tube. Cancer Discov. 6, 1342–1351. [DOI] [PMC free article] [PubMed] [Google Scholar]
- Gingras AC, Caballero M, Zarske M, Sanchez A, Hazbun TR, Fields S, Sonenberg N, Hafen E, Raught B, and Aebersold R (2005). A novel, evolutionary conserved protein phosphatase complex involved in cisplatin sensitivity. Mol. Cell. Proteomics 4, 1725–1740. [DOI] [PubMed] [Google Scholar]
- Goodarzi AA, Noon AT, Deckbar D, Ziv Y, Shiloh Y, Löbrich M, and Jeggo PA (2008). ATM signaling facilitates repair of DNA double-strand breaks associated with heterochromatin. Mol. Cell 31, 167–177. [DOI] [PubMed] [Google Scholar]
- Gupta R, Somyajit K, Narita T, Maskey E, Stanlie A, Kremer M, Typas D, Lammers M, Mailand N, Nussenzweig A, et al. (2018). DNA Repair Network Analysis Reveals Shieldin as a Key Regulator of NHEJ and PARP Inhibitor Sensitivity. Cell 173, 972–988. [DOI] [PMC free article] [PubMed] [Google Scholar]
- Gyori BM, Venkatachalam G, Thiagarajan PS, Hsu D, and Clement MV (2014). OpenComet: an automated tool for comet assay image analysis. Redox Biol. 2, 457–465. [DOI] [PMC free article] [PubMed] [Google Scholar]
- Hamanishi J, Mandai M, Ikeda T, Minami M, Kawaguchi A, Murayama T, Kanai M, Mori Y, Matsumoto S, Chikuma S, et al. (2015). Safety and Antitumor Activity of Anti-PD-1 Antibody, Nivolumab, in Patients With Platinum-Resistant Ovarian Cancer. J. Clin. Oncol 33, 4015–4022. [DOI] [PubMed] [Google Scholar]
- Hansen RK, Mund A, Poulsen SL, Sandoval M, Klement K, Tsouroula K, Tollenaere MA, Räschle M, Soria R, Offermanns S, et al. (2016). SCAI promotes DNA double-strand break repair in distinct chromosomal contexts. Nat. Cell Biol 18, 1357–1366. [DOI] [PMC free article] [PubMed] [Google Scholar]
- Heidebrecht HJ, Claviez A, Kruse ML, Pollmann M, Buck F, Harder S, Tiemann M, Dörffel W, and Parwaresch R (2006). Characterization and expression of CT45 in Hodgkin’s lymphoma. Clin. Cancer Res 12, 4804–4811. [DOI] [PubMed] [Google Scholar]
- Hein MY, Hubner NC, Poser I, Cox J, Nagaraj N, Toyoda Y, Gak IA, Weisswange I, Mansfeld J, Buchholz F, et al. (2015). A human interactome in three quantitative dimensions organized by stoichiometries and abundances. Cell 163, 712–723. [DOI] [PubMed] [Google Scholar]
- Hoppenot C, Eckert MA, Tienda SM, and Lengyel E (2018). Who are the long-term survivors of high grade serous ovarian cancer? Gynecol. Oncol 148, 204–212. [DOI] [PubMed] [Google Scholar]
- Hubner NC, and Mann M (2011). Extracting gene function from protein-protein interactions using Quantitative BAC InteraCtomics (QUBIC). Methods 53, 453–459. [DOI] [PubMed] [Google Scholar]
- Humphrey SJ, Azimifar SB, and Mann M (2015). High-throughput phosphoproteomics reveals in vivo insulin signaling dynamics. Nat. Biotechnol 33, 990–995. [DOI] [PubMed] [Google Scholar]
- Le DT, Uram JN, Wang H, Bartlett BR, Kemberling H, Eyring AD, Skora AD, Luber BS, Azad NS, Laheru D, et al. (2015). PD-1 Blockade in Tumors with Mismatch-Repair Deficiency. N. Engl. J. Med 372, 2509–2520. [DOI] [PMC free article] [PubMed] [Google Scholar]
- Lee DH, Pan Y, Kanner S, Sung P, Borowiec JA, and Chowdhury D (2010). A PP4 phosphatase complex dephosphorylates RPA2 to facilitate DNA repair via homologous recombination. Nat. Struct. Mol. Biol 17, 365–372. [DOI] [PMC free article] [PubMed] [Google Scholar]
- Lee DH, Goodarzi AA, Adelmant GO, Pan Y, Jeggo PA, Marto JA, and Chowdhury D (2012). Phosphoproteomic analysis reveals that PP4 dephosphorylates KAP-1 impacting the DNA damage response. EMBO J. 31, 2403–2415. [DOI] [PMC free article] [PubMed] [Google Scholar]
- Li H, Chiappinelli KB, Guzzetta AA, Easwaran H, Yen RW, Vatapalli R, Topper MJ, Luo J, Connolly RM, Azad NS, et al. (2014). Immune regulation by low doses of the DNA methyltransferase inhibitor 5-azacitidine in common human epithelial cancers. Oncotarget 5, 587–598. [DOI] [PMC free article] [PubMed] [Google Scholar]
- Li X, Liang L, Huang L, Ma X, Li D, and Cai S (2015). High expression of protein phosphatase 4 is associated with the aggressive malignant behavior of colorectal carcinoma. Mol. Cancer 14, 95. [DOI] [PMC free article] [PubMed] [Google Scholar]
- Mertins P, Mani DR, Ruggles KV, Gillette MA, Clauser KR, Wang P, Wang X, Qiao JW, Cao S, Petralia F, et al. ; NCI CPTAC (2016). Proteogenomics connects somatic mutations to signalling in breast cancer. Nature 534, 55–62. [DOI] [PMC free article] [PubMed] [Google Scholar]
- Michalski A, Damoc E, Hauschild JP, Lange O, Wieghaus A, Makarov A, Nagaraj N, Cox J, Mann M, and Horning S (2011). Mass spectrometry-based proteomics using Q Exactive, a high-performance benchtop quadrupole Orbitrap mass spectrometer. Mol. Cell Proteomics 10. [DOI] [PMC free article] [PubMed] [Google Scholar]
- Mouw KW, Goldberg MS, Konstantinopoulos PA, and D’Andrea AD (2017). DNA Damage and Repair Biomarkers of Immunotherapy Response. Cancer Discov. 7, 675–693. [DOI] [PMC free article] [PubMed] [Google Scholar]
- Nandhakumar S, Parasuraman S, Shanmugam MM, Rao KR, Chand P, and Bhat BV (2011). Evaluation of DNA damage using single-cell gel electrophoresis (Comet Assay). J. Pharmacol. Pharmacother 2, 107–111. [DOI] [PMC free article] [PubMed] [Google Scholar]
- R Development Core Team (2011). R: A Language and Environment for Statistical Computing (R Foundation for Statistical Computing; ). [Google Scholar]
- Rapin N, Hoof I, Lund O, and Nielsen M (2010). The MHC motif viewer: a visualization tool for MHC binding motifs. Curr. Protoc. Immunol Chapter 18, Unit 18.17. [DOI] [PubMed] [Google Scholar]
- Reed E, Ozols RF, Tarone R, Yuspa SH, and Poirier MC (1987). Platinum-DNA adducts in leukocyte DNA correlate with disease response in ovarian cancer patients receiving platinum-based chemotherapy. Proc. Natl. Acad. Sci. USA 84, 5024–5028. [DOI] [PMC free article] [PubMed] [Google Scholar]
- Rifai N, Gillette MA, and Carr SA (2006). Protein biomarker discovery and validation: the long and uncertain path to clinical utility. Nat. Biotechnol 24, 971–983. [DOI] [PubMed] [Google Scholar]
- Rudolph P, Kellner U, Schmidt D, Kirchner V, Talerman A, Harms D, and Parwaresch R (1999). Ki-A10, a germ cell nuclear antigen retained in a subset of germ cell-derived tumors. Am. J. Pathol 154, 795–803. [DOI] [PMC free article] [PubMed] [Google Scholar]
- Seiler CY, Park JG, Sharma A, Hunter P, Surapaneni P, Sedillo C, Field J, Algar R, Price A, Steel J, et al. (2014). DNASU plasmid and PSI:Biology-Materials repositories: resources to accelerate biological research. Nucleic Acids Res. 42, D1253–D1260. [DOI] [PMC free article] [PubMed] [Google Scholar]
- Shraibman B, Kadosh DM, Barnea E, and Admon A (2016). Human Leukocyte Antigen (HLA) Peptides Derived from Tumor Antigens Induced by Inhibition of DNA Methylation for Development of Drug-facilitated Immunotherapy. Mol. Cell. Proteomics 15, 3058–3070. [DOI] [PMC free article] [PubMed] [Google Scholar]
- Simpson AJ, Caballero OL, Jungbluth A, Chen YT, and Old LJ (2005). Cancer/testis antigens, gametogenesis and cancer. Nat. Rev. Cancer 5, 615–625. [DOI] [PubMed] [Google Scholar]
- Snyder A, Makarov V, Merghoub T, Yuan J, Zaretsky JM, Desrichard A, Walsh LA, Postow MA, Wong P, Ho TS, et al. (2014). Genetic basis for clinical response to CTLA-4 blockade in melanoma. N. Engl. J. Med 371, 2189–2199. [DOI] [PMC free article] [PubMed] [Google Scholar]
- Thomsen MC, and Nielsen M (2012). Seq2Logo: a method for construction and visualization of amino acid binding motifs and sequence profiles including sequence weighting, pseudo counts and two-sided representation of amino acid enrichment and depletion. Nucleic Acids Res. 40, W281–W287. [DOI] [PMC free article] [PubMed] [Google Scholar]
- Toledo LI, Altmeyer M, Rask MB, Lukas C, Larsen DH, Povlsen LK, Bekker-Jensen S, Mailand N, Bartek J, and Lukas J (2013). ATR prohibits replication catastrophe by preventing global exhaustion of RPA. Cell 155, 1088–1103. [DOI] [PubMed] [Google Scholar]
- Tusher VG, Tibshirani R, and Chu G (2001). Significance analysis of microarrays applied to the ionizing radiation response. Proc. Natl. Acad. Sci. USA 98, 5116–5121. [DOI] [PMC free article] [PubMed] [Google Scholar]
- Tyanova S, Temu T, Sinitcyn P, Carlson A, Hein MY, Geiger T, Mann M, and Cox J (2016a). The Perseus computational platform for comprehensive analysis of (prote)omics data. Nat. Methods 13, 731–740. [DOI] [PubMed] [Google Scholar]
- Uhlén M, Fagerberg L, Hallström BM, Lindskog C, Oksvold P, Mardinoglu A, Sivertsson Å, Kampf C, Sjöstedt E, Asplund A, et al. (2015). Proteomics. Tissue-based map of the human proteome. Science 347, 1260419. [DOI] [PubMed] [Google Scholar]
- Wang B, Zhao A, Sun L, Zhong X, Zhong J, Wang H, Cai M, Li J, Xu Y, Liao J, et al. (2008). Protein phosphatase PP4 is overexpressed in human breast and lung tumors. Cell Res. 18, 974–977. [DOI] [PubMed] [Google Scholar]
- Wiśniewski JR, Ostasiewicz P, and Mann M (2011). High recovery FASP applied to the proteomic analysis of microdissected formalin fixed paraffin embedded cancer tissues retrieves known colon cancer markers. J. Proteome Res. 10, 3040–3049. [DOI] [PubMed] [Google Scholar]
- Yang X, Boehm JS, Yang X, Salehi-Ashtiani K, Hao T, Shen Y, Lubonja R, Thomas SR, Alkan O, Bhimdi T, et al. (2011). A public genome-scale lentiviral expression library of human ORFs. Nat. Methods 8, 659–661. [DOI] [PMC free article] [PubMed] [Google Scholar]
- Zhang L, Conejo-Garcia JR, Katsaros D, Gimotty PA, Massobrio M, Regnani G, Makrigiannakis A, Gray H, Schlienger K, Liebman MN, et al. (2003). Intratumoral T cells, recurrence, and survival in epithelial ovarian cancer. N. Engl. J. Med 348, 203–213. [DOI] [PubMed] [Google Scholar]
- Zhang W, Barger CJ, Link PA, Mhawech-Fauceglia P, Miller A, Akers SN, Odunsi K, and Karpf AR (2015). DNA hypomethylation-mediated activation of Cancer/Testis Antigen 45 (CT45) genes is associated with disease progression and reduced survival in epithelial ovarian cancer. Epigenetics 10, 736–748. [DOI] [PMC free article] [PubMed] [Google Scholar]
- Zhang H, Liu T, Zhang Z, Payne SH, Zhang B, McDermott JE, Zhou JY, Petyuk VA, Chen L, Ray D, et al. ; CPTAC Investigators (2016). Integrated Proteogenomic Characterization of Human High-Grade Serous Ovarian Cancer. Cell 166, 755–765. [DOI] [PMC free article] [PubMed] [Google Scholar]
Associated Data
This section collects any data citations, data availability statements, or supplementary materials included in this article.
Supplementary Materials
Data Availability Statement
The mass spectrometry proteomics data have been deposited to the ProteomeXchange Consortium (http://proteomecentral.proteomexchange.org/cgi/GetDataset) via the PRIDE partner repository with the dataset identifier PXD010372. All other data supporting the findings of this study are available within the article and its supplemental information files or from the Lead Contact upon reasonable request.