

Summary
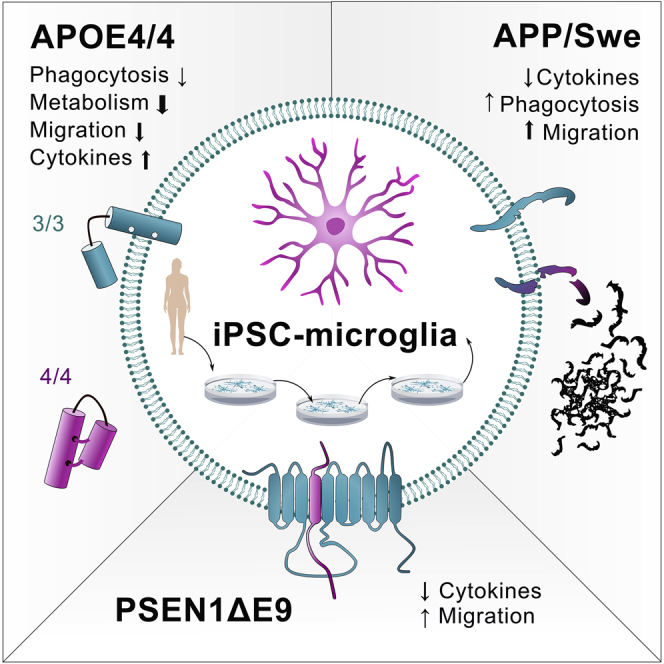
Here we elucidate the effect of Alzheimer disease (AD)-predisposing genetic backgrounds, APOE4, PSEN1ΔE9, and APPswe, on functionality of human microglia-like cells (iMGLs). We present a physiologically relevant high-yield protocol for producing iMGLs from induced pluripotent stem cells. Differentiation is directed with small molecules through primitive erythromyeloid progenitors to re-create microglial ontogeny from yolk sac. The iMGLs express microglial signature genes and respond to ADP with intracellular Ca2+ release distinguishing them from macrophages. Using 16 iPSC lines from healthy donors, AD patients and isogenic controls, we reveal that the APOE4 genotype has a profound impact on several aspects of microglial functionality, whereas PSEN1ΔE9 and APPswe mutations trigger minor alterations. The APOE4 genotype impairs phagocytosis, migration, and metabolic activity of iMGLs but exacerbates their cytokine secretion. This indicates that APOE4 iMGLs are fundamentally unable to mount normal microglial functionality in AD.
Keywords: Alzheimer disease, iPSC, microglia, PSEN1Δ, E9, APPswe, APOE, phagocytosis, mitochondria, metabolism
Graphical Abstract
Highlights
-
•
APOE4 genotype has a profound impact on several functions of microglia-like cells
-
•
Inflammatory responses are aggravated in cells with APOE4 genotype
-
•
Metabolism, phagocytosis, and migration are decreased in APOE4 microglia-like cells
-
•
Familial mutations APPswe and PSEN1ΔE9 have only minor effects on functionality
The study provides a useful, clinically relevant iPSC-derived model for investigating the role of genetic backgrounds of Alzheimer disease in human microglia-like cells. The effect of two Alzheimer mutations and the APOE4 genotype on the functionality of cells are characterized in detail. Results feature a profound impact of APOE4 genotype on several functions of cells.
Introduction
Alzheimer disease (AD) is a progressive neurodegenerative disorder and the most common cause of dementia (Weuve et al., 2014). AD pathology begins decades before the onset of clinical symptoms and neuroinflammation is strongly indicated in its progression (Shi and Holtzman, 2018). Neuroinflammation is mediated by microglia, the innate immune cells of the CNS. Microglia originate from erythromyeloid progenitor cells (EMPs) in the embryonic yolk sac (Ginhoux et al., 2013) and play pivotal roles in CNS development, as well as in tissue maintenance, injury response, and pathogen defense (Colonna and Butovsky, 2017). In AD, microglia are aberrantly activated and their normal functions are compromised (Saijo and Glass, 2011).
The major genetic risk factor for multifactorial late-onset AD (LOAD) (Liu et al., 2013) is a gene variant apolipoprotein E4 (APOE4), whereas inherited genetic mutations in presenilin 1 (PSEN1), presenilin 2 (PSEN2), or amyloid precursor protein (APP) genes (Selkoe, 1998) cause rarer early-onset familial AD (FAD) (Bagyinszky et al., 2014). Human APOE is primarily expressed in three variants, the most abundant APOE3 being neutral, and the rarest APOE2 being protective in AD. All forms are involved in transport and elimination of lipids, but a common mode of action in the brain remains largely unexplored. APOE is highly expressed in microglia, and APOE4 is shown to promote the neurodegeneration-associated inflammatory phenotype of mouse microglia (Krasemann et al., 2017) and alter functions of human microglia-like cells (iMGLs) (Lin et al., 2018). However, the precise role of APOE4 in the development of AD remains elusive. PSEN1 and APP participate in the production of neurotoxic amyloid-beta (Aβ) peptide, the main component of the amyloid plaques found in the brains of AD patients. The expression of APP and PSEN1 in microglia is shown to increase upon brain insults (Banati et al., 1993, Nadler et al., 2008) and these genes are implicated in inflammatory processes (Manocha et al., 2016, Zhao et al., 2017), but it is unclear whether they contribute to AD through microglial functions.
Given the central role of microglia in AD and the lack of knowledge of FAD mutations or APOE4 in human microglia, we established a method to generate iMGLs from induced pluripotent stem cells (iPSCs) carrying APOE4 genotype or PSEN1ΔE9 or APPswe mutations. iMGLs have a robust microglial phenotype and resemble recently published iPSC-derived microglia (Abud et al., 2017, Douvaras et al., 2017, McQuade et al., 2018). We conclude that APOE4 genotype has a substantial impact on the function of iMGLs, whereas the FAD mutations have only minor effects. APOE4 contributes particularly to reduced migration, increased proinflammatory responses and defective glycolytic and mitochondrial metabolism. This study elucidates the role of human microglia in disease pathogenesis in FAD and LOAD.
Results
iPSCs Differentiate into iMGLs through Primitive Hematopoiesis
We developed a high-yield 24-day protocol to differentiate human iPSCs into iMGLs. To recapitulate microglial ontogeny from the yolk sac (Ginhoux et al., 2010, Kierdorf et al., 2013, Schwartz et al., 2015, Uenishi et al., 2014), we used small molecules under defined oxygen conditions to direct differentiation through primitive EMPs followed by microglial maturation (Figure 1A). Morphological changes and the expression of the key markers for each stage of differentiation were assessed by flow cytometry and phase-contrast microscopy (Figures 1B–1E and S1).
Figure 1.

iPSCs Differentiate into iMGLs through Primitive Hematopoiesis
(A–E) Schematic protocol (A). Percentages of positive cells analyzed by flow cytometry for markers of (B) pluripotency, (C) EMPs and mesodermal brachyury (BRAC), (D) primitive EMPs, and (E) and mature microglia. n = 4 cell lines, repeated in 3 batches.
(F) The expression of microglial signature genes in RNA sequencing (RNA-seq) data of D24 iMGLs as log2 CPM values. n = 3 batches, 4 cell lines.
(G) Hierarchical clustering of RNA-seq data shows that our iMGLs cluster with published iMGLs and human microglia (MG), but are distinct from dendritic cells (DCs), monocytes (CD14M and CD16M), iPSCs, and hematopoietic progenitor cells (HPCs) (Abud et al., 2017).
(H–J) Immunostainings of D24 iMGLs (H). Repeated with two batches for all cell lines. Images of iMGLs labeled with IBA1 (red) in (I) 3D-Matrigel co-culture with neurons and in (J) cerebral brain organoids. Repeated with two batches for 2–4 cell lines. Scale bars as μm. Data presented mean ± SEM.
See also Figures S1 and S2; Tables S1 and S2.
During the first differentiation days (D0–2), mesodermal lineage was induced with BMP4, Activin A and CHIR99021 under low oxygen (5% O2) conditions and was accompanied with a reduction of pluripotency markers (Figure 1B). When the expression of mesodermal brachyury was the highest, 48 h after initiation (Figure 1C), basic fibroblast growth factor (bFGF), SB431542, vascular endothelial growth factor (VEGF), and insulin were applied to evoke hemogenic differentiation. Subsequently, the areas of endothelial-like cells formed (Figure S1) and the expression of hemogenic EMP markers KDR, CD117 (c-kit), VE-cadherin, and CD34 increased (Figure 1C). On D6–7, loosely attached round cells appeared with a high expression of primitive EMP markers CD235a (Sturgeon et al., 2014) and CD41a (Kennedy et al., 2007) (Figure 1D). MCSF1 and interleukin-34 (IL-34) were used to induce microglial differentiation and expansion on ultra-low attachment (ULA) dishes. On maturation, the expression of myeloid markers increased and on D24, 88% of cells expressed CD11b, 99% CD45, and 91% IBA1 when cultured on ULA dishes (Figure 1E). To mature iMGLs for functional experiments, D16 progenitors were cultured on poly-D-lysine (PDL)-coated vessels until D24 to promote ramified and elongated morphology and IBA1 expression (Figure S1).
The microglial identity of iMGLs was confirmed with whole-transcriptome analysis and qRT-PCR (Figures 1F and S2; Table S1). The microglial signature genes, C1QA, GAS6, GPR34, MERTK, PROS1, and TMEM119 (Butovsky et al., 2014), were highly expressed (logCPM>2, Figures 1F and S2). Comparison of RNA sequencing profiles to published dataset GSE89189 (Abud et al., 2017) using microglia genes (Lavin et al., 2014) revealed that iMGLs cluster with published iPSC-derived microglia (Abud et al., 2017), as well as with human microglia (Zhang et al., 2014), but remain distinct from iPSCs and other tissue myeloid cells (Figures 1G and S2). Immunostaining of D24 iMGLs verified ubiquitous expression of IBA1, CX3CR1, and PU.1 (Figures 1H and S1) and, importantly, microglia-specific proteins TMEM119, P2RY12, and TREM2 (Bennett et al., 2016) (Figure 1H). Furthermore, iMGLs spontaneously migrated into 3D co-cultures and adopted a ramified morphology (Figures 1I and 1J). Thus, the iMGLs generated through induction of primitive EMPs show a typical microglia-like genetic signature and protein expression.
iMGLs Express APP and PSEN1, and PSEN1ΔE9 Mutation Leads to Expected Alterations in PSEN1 Endoproteolysis
To assess the reproducibility of the differentiation protocol, we successfully generated iMGLs from 16 different iPSC lines (Table S3) with a 20-fold average yield. iPSCs originated from adult donors. Neutral APOEɛ3/3 alleles (APOE3) were carried by five healthy subjects, two subjects with familial KM670/671NL Swedish double mutation in APP (APPswe) (Mullan et al., 1992), and two with a familial 4.6-kb deletion of exon 9 in PSEN1 (PSEN1ΔE9) (Crook et al., 1998). Three subjects carried APOEɛ4/4 alleles (APOE4) (Balez et al., 2016, Engel et al., 2018, Munoz et al., 2018, Ooi et al., 2013). One APPswe carrier had symptomatic AD (referred spAPP) and one was presymptomatic (pAPP) with no clinical diagnosis. Similarly, one PSEN1ΔE9 carrier was presymptomatic (pPSEN) and one had AD diagnosis (spPSEN). The effect of PSEN1ΔE9 mutation was validated with gene-corrected isogenic control lines from the symptomatic (spISO) and the presymptomatic (pISO) PSEN1ΔE9 carriers (Oksanen et al., 2017). Pluripotency and the karyotype of previously unpublished pAPP, APOE3, and APOE4 lines were characterized (Figure S3).
We next analyzed the effect of genetic background on processing of APP protein into toxic Aβ. APPswe iMGLs showed 2.5-fold increase in PSEN1 protein but no consistent changes in APP compared with control cells (Figures 2A–2D). As expected, PSEN1ΔE9 iMGLs showed a robust accumulation of PSEN1 and a 3-fold increase in APP compared with isogenic controls (Figures 2E–2H), thereby establishing that the PSEN1ΔE9 mutation resulted in a loss of γ-secretase cleavage of APP. Furthermore, APOE3 and APOE4 lines showed low levels of APP, PSEN1, and C-terminal fragments of PSEN1, and no differences between the genotypes (Figures 2I–2L). Quantification of Aβ fragments from cell lysates and culture media revealed that iMGLs had no intracellular Aβ and secreted only Aβ1-42 at similar levels regardless of the genotype (Figure 2M). Taken together, all cell lines had a normal karyotype and expressed FAD mutations or LOAD risk variants supporting their use for studying AD, even though genotypes failed to alter iMGL Aβ production.
Figure 2.

iMGLs Express APP and PSEN1 Proteins, and PSEN1ΔE9 Mutation Leads to Expected Alterations in PSEN1 Endoproteolysis
(A–L) Western blots for full-length (FL) and C-terminal fragment (CTF) of PSEN1 and APP proteins from 3 batches of control (CTRL) and APPswe (pAPP, spAPP) iMGLs (A). GAPDH and b-ACTIN as loading controls. Quantification of blots normalized to GAPDH for (B) PSEN1-FL, (C) PSEN1-CTF, and (D) APP protein. n = 3 batches. Respective western blots (E) and quantification (F–H) for PSEN1ΔE9 iMGLs (pPSEN, spPSEN) and their isogenic controls (pISO and spISO). n = 2–5 batches. Western blots (I) for APOE3 and APOE4 iMGLs and quantification (J–L) for the proteins. n = 3 batches.
(M) Aβ 1-42 levels in cell culture medium after 48 h analyzed by ELISA. n = 2–5 batches for APP and PSEN; n = 3 wells for APOE repeated in three batches.
Data presented mean ± SEM unpaired two-tailed t test,∗p < 0.05, ∗∗p < 0.01, ∗∗∗p < 0.001. p, presymptomatic; sp, symptomatic. See also Figure S3.
ATP and ADP Evoke Intracellular Calcium Transients in iMGLs
Since calcium may control microglial functions under resting and activated conditions (Hoffmann et al., 2003), we next investigated intracellular calcium [Ca2+]i transients in response to ATP and ADP. The representative traces of [Ca2+]i transients demonstrate similar responses in all genotypes (Figure 3A). The average amplitudes of the responding cells were equal in control and APPswe iMGLs (Figure 3B). In contrast, there was a 22% reduction in ATP-responsive cells in pAPP iMGLs and a 27% reduction in ADP-responsive cells in both pre- and symptomatic APPswe iMGLs compared with control (Figure 3C). Equal amplitudes and percentages of responsive cells were observed for isogenic and PSEN1ΔE9 iMGLs (Figures 3D and 3E), and for APOE3 and APOE4 iMGLs (Figures 3F and 3G) demonstrating the consistent functionality of iMGLs harboring these genotypes. Collectively, all cell lines responded to ADP and ATP by intracellular calcium release, supporting microglia-like functionality of the iMGLs. Reduction in APPswe responses suggests that FAD mutation can alter intracellular calcium signaling.
Figure 3.

ATP and ADP Evoke Intracellular Calcium [Ca2+]i Transients in iMGLs
(A) Example traces of [Ca2+]i transients following 100 μM ATP (left panel) and ADP (right panel) applications for 5 s (indicated by bars) in iMGLs loaded with the Ca2+ indicator Fluo-4 AM.
(B) The ratio of maximum amplitudes normalized to amplitudes evoked by ionomycin that was applied in the end of experiment and used as inclusion criteria. n = 4 batches, each with 9–10 coverslips, altogether 3,994 CTRL, 3,015 pAPP, and 3,906 spAPP cells.
(C–E) Percentages of ATP- and ADP-responsive cells in APPswe lines compared with control iMGLs (C). Ratio of maximum amplitudes (D) and percentages of responsive cells (E) obtained from isogenic and PSENΔE9 iMGLs. n = 4 batches, each with 9–12 coverslips, altogether 1,969 pISO, 2,355 spISO, 1,856 pPSEN, and 2,823 spPSEN cells.
(F and G) Similar data for APOE3 and APOE4 iMGLs. n = 4 coverslips, altogether 482 APOE3 and 991 APOE4 cells, repeated in three batches.
Data presented mean ± SEM unpaired two-tailed t test or one-way ANOVA followed by Bonferroni's post hoc test, ∗p < 0.05, ∗∗p < 0.01. CTRL, control; p, presymptomatic; sp, symptomatic; PSEN, PSEN1ΔE9; APP, APPswe; and ISO, isogenic control iMGLs.
Chemokinesis Is Accelerated in APPswe and PSEN1ΔE9 iMGLs but Decelerated in APOE4 iMGLs
Microglial migration to the injury site is crucial for maintaining homeostasis in the brain. We analyzed the chemokinesis of iMGLs using a scratch wound assay with live-cell imaging for 24 h (Figure 4A). Acute application of ATP and ADP, which can be released from injured neurons, increased migration in all tested cell lines, whereas soluble oligomeric Aβ (sAβ) failed to alter migration (Figures 4B, 4C, and S4). We observed increased basal migration in APPswe lines compared with control iMGLs as well as in spPSEN iMGLs compared with their isogenic controls (Figures 4D, 4F, and S4). In contrast, APOE4 genotype reduced basal migration (Figures 4E and 4F). ATP or ADP induced similar increase in migration in all genotypes (Figure 4G). In contrast, migration evoked by fractalkine was restrained in APOE4 iMGLs compared with APOE3 (Figures 4H and 4I), indicating impairment in motility in response to this neuron-derived chemokine. The migration was reduced if fetal bovine serum (FBS) was withdrawn from cell culture and therefore the experiments were performed in the presence of FBS (Figure 4S). Overall, all iMGL lines migrated and responded to different stimuli as expected for microglia. A reduction in APOE4 and a mild increase in APP and PSEN1 iMGLs suggest that LOAD risk variant and FAD mutations have different effects on microglial functions.
Figure 4.

Chemokinesis Is Accelerated in APPswe and PSEN1ΔE9 iMGLs but Decelerated in APOE4 iMGLs
(A) Representative images of iMGLs in scratch wound migration assay at 0, 12, and 24 h time points. Scale bar 300 µm.
(B) Wound densities measured for 25 h with vehicle (VEH), 100 μM ATP, 100 μM ADP, or 1-μM soluble sAβ treatments.
(C–E) Wound densities at 24 h normalized to vehicle (C). Time curves for (D) control (CTRL) and APPswe (APP), and (E) APOE3 and APOE4 iMGLs.
(F) Wound densities at 24 h normalized to control or isogenic (ISO) iMGLs.
(G) A heatmap for increase (darker color) or decrease (lighter color) in wound density compared with vehicle. White asterisks indicate significance compared with vehicle and black asterisks to control genotype.
(H) Time curves for wound density with 100 μM fractalkine (CX3CL1) treatment in APO3 iMGLs.
(I) Corresponding wound density at 24 h normalized to vehicle for APOE iMGLs. Curve graphs show a representative experiment of three replicates, n = 3–5 wells. Boxplots and heatmap show normalized results from n = 3–5 replicate batches.
Data presented mean ± SEM, unpaired two-tailed t test, ∗p < 0.05, ∗p < 0.01, ∗∗∗p < 0.001. p, presymptomatic; sp, symptomatic. See also Figure S4.
Phagocytosis Is Dampened in APOE4 iMGLs, but Not in APPswe or PSEN1ΔE9 iMGLs
Since microglia fail to efficiently clear Aβ plaques in AD (Lee and Landreth, 2010), we examined phagocytosis by live-cell imaging. iMGLs spontaneously phagocytosed pHrodo Zymosan A bioparticles (Figures 5A and 5B) equivalently despite of their genotypes (Figures 5C, 5D, and S4). Since APOE4 variant was recently reported to reduce phagocytosis in iPSC-derived microglia (Lin et al., 2018), we investigated APOE iMGLs also with confocal microscopy and with fewer number of larger fluorescein isothiocyanate (FITC) Zymosan A bioparticles to count internalized particles (Figures 5E and 5F). Indeed, despite the equal overall intensity of phagocytosed pHrodo particles (Figure 5G), APOE4 iMGLs ingested a smaller number of FITC particles per cell compared with APOE3 (Figure 5H).
Figure 5.

Phagocytosis Is Dampened in APOE4 iMGLs, but not in APPswe or PSEN1ΔE9 iMGLs
(A and B) Representative images of phagocytosed green pHrodo Zymosan A bioparticles in iMGLs at 5 h.
(C) Time curves for pHrodo fluorescence intensity in control (CTRL) and APPswe (APP) iMGLs normalized to cell amount.
(D) Respective boxplots at 5 h normalized to control or isogenic (ISO) iMGLs.
(E and F) Representative images of phagocytosed FITC Zymosan A bioparticles in iMGLs.
(G) pHrodo time curves for APOE3 and APOE4 iMGLs.
(H) Percentages of APOE iMGLs that internalized certain number of FITC particles per cell. n = 290–750 cells.
(I–L) pHrodo intensity at 5 h, after 24 h pretreatment with 100 ng/mL LPS, 20 ng/mL IFN-γ, or LPS-IFN-γ, or with simultaneous treatment with 0.5 μM soluble sAβ or fibrillar fAβ, compared with vehicle (Veh) in APPswe (I), pPSEN (J), spPSEN (K), and APOE (L) iMGLs.
(M) Representative image of phagocytosed green fluor-Aβ1-42 in iMGLs at 5 h.
(N) Time curves for fluorescence intensity of fluor-Aβ in control and APPswe iMGLs.
(O) Respective bar graphs at 5 h normalized to control iMGLs.
(P) Representative image of iMGLs treated with fluor-Aβ and fAβ depicting enlarged vacuoles. Scale bars, 50 μm. Curve graphs show a representative experiment of 3 replicates, n = 4 wells. Boxplots and bar graphs show normalized results from n = 2–6 replicate batches.
Data presented mean ± SEM unpaired two-tailed t test or two-way ANOVA with Bonferroni's post hoc test,∗p < 0.05, ∗∗p < 0.01, ∗∗∗p < 0.001. p, presymptomatic; sp, symptomatic; PSEN, PSEN1ΔE9 iMGLs. See also Figure S4.
Next, we tested whether proinflammatory stimuli attenuate the phagocytosis of iMGLs as reported for murine microglia (Koenigsknecht-Talboo and Landreth, 2005). iMGLs were pretreated with lipopolysaccharide (LPS), interferon γ (IFN-γ), or both LPS and IFN-γ (LPS-IFN-γ) for 24 h or treated with sAβ or insoluble fibrillary (fAβ) Aβ1-42 at the time of particle application. Unexpectedly, LPS failed to alter phagocytosis of pHrodo beads, whereas IFN-γ or LPS-IFN-γ suppressed it (Figures 5I–5L). Withdrawal of stimuli before to the measurement did not restore IFN-γ-mediated suppression, but in the LPS-pretreated group phagocytosis was first abrogated and then potentiated 5 h after withdrawal (Figure S4). Addition of fAβ only slightly enhanced the phagocytosis of pHrodo beads in presymptomatic isogenic and PSEN1ΔE9 iMGLs, whereas sAβ had no effect (Figures 5J and 5K).
iMGLs phagocytosed also fluorescent Aβ1-42 spontaneously (Figure 5M). APPswe iMGLs internalized 1.2-fold more Aβ compared with their controls (Figures 5N and 5O). PSEN1ΔE9 or APOE4 genotypes had no effect (Figure S4). To test the impact of proinflammatory activation on Aβ phagocytosis, we treated the cells with LPS, sAβ, or fAβ simultaneously with fluorescent Aβ. LPS reduced Aβ phagocytosis only in isogenic and PSEN1ΔE9 iMGLs (Figure S4), and fAβ induced engorged vacuoles in all genotypes (Figure 5P). In summary, iMGLs presented microglia-like phagocytosis of both particles and Aβ and altered phagocytosis upon inflammatory stimuli. Only APOE4 iMGLs showed mild impairment in phagocytosis.
Cytokine Release under Proinflammatory Conditions Is Aggravated in APOE4 iMGLs but Decreased in PSEN1ΔE9 and APPswe iMGLs
To study cytokine release, conditioned medium was analyzed with cytokine bead array after 24 h treatment with vehicle, LPS, IFN-γ, or LPS-IFN-γ (Figure 6A). Under basal conditions, the levels of proinflammatory cytokines IL-6, tumor necrosis factor alpha (TNF-α), regulated on activation, normal T cell expressed and secreted (RANTES), and granulocyte-macrophage colony-stimulating factor (GM-CSF) were negligible (<1 pg/mL), whereas IL-8 levels were small (10 pg/mL) and MCP1 reached even 1 ng/mL concentrations (Figure 6A). As expected, iMGLs robustly responded to LPS with significant induction in all measured cytokines. The combination of LPS-IFN-γ triggered similar or even higher release of cytokines except GM-CSF, whereas IFN-γ alone induced only small, yet detectable, increase.
Figure 6.

Cytokine Release under Proinflammatory Conditions Is Aggravated in APOE4 iMGLs but Decreased in PSEN1ΔE9 and APPswe iMGLs
(A) iMGLs secrete cytokines when stimulated for 24 h with LPS 100 ng/mL, IFN-γ 20 ng/mL, or their combination LPS-IFN-γ as measured from media by cytometric bead array assay. Representative graphs. n = 4 wells.
(B) spAPP iMGLs released less TNF-α, and pAPP less TNF-α and MCP1, compared with control iMGLs in response to LPS-IFN-γ treatment.
(C) PSEN1ΔE9 iMGLs released less IL-6, TNF-α, and RANTES compared with isogenic iMGLs.
(D) In contrast, APOE4 iMGLs released aggregated amounts of TNF-α and IL-8 compared with APOE3. For (B–D) n = 3–6 batches, each with 4 wells.
Data presented mean ± SEM unpaired two-tailed t test, ∗p < 0.05, ∗p < 0.01, ∗∗∗p < 0.001. See also Figure S4. CTRL, control; p, presymptomatic; sp, symptomatic; PSEN, PSEN1ΔE9; APP, APPswe; and ISO, isogenic control iMGLs.
We investigated further LPS-IFN-γ effect since it simulates in vivo damage-associated molecular patterns acting on Toll-like receptors and IFN-γ produced by CNS cells (Pulido-Salgado et al., 2018). APPswe iMGLs produced less TNF-α and MCP1 in response to LPS-IFN-γ compared with control iMGLs (Figure 6B). Similarly, PSEN1ΔE9 iMGLs secreted less IL-6, TNF-α, and RANTES compared with their isogenic controls (Figure 6C). Concomitantly, LPS or IFN-γ alone resulted in decreased cytokine secretion in iMGLs harboring these genotypes (Figure S4). In contrast, APOE4 iMGLs produced more cytokines compared with APOE3 iMGLs upon treatment with LPS-IFN-γ (Figure 6D), LPS or IFN-γ (Figure S4). Taken together, APOE4 genotype increased cytokine secretion, whereas FAD mutations reduced it.
Metabolism of iMGLs Is Altered under Pro- and Anti-inflammatory Stimuli and by APOE4 Genetic Background
To investigate metabolism under anti- or proinflammatory stimuli we measured the cellular respiration of iMGLs after 24 h treatment with IL-4, LPS, IFN-γ, or LPS-IFN-γ (Figures 7A and 7B). An anti-inflammatory IL-4 increased parameters of oxidative respiration, whereas proinflammatory LPS and LPS-IFN-γ reduced them (Figure 7C). IFN-γ increased all parameters except ATP production (Figure 7C). Compared with LPS, LPS-IFN-γ reversed oxidative parameters toward the levels of the vehicle (Figure 7C). On the contrary, all proinflammatory stimuli increased anaerobic glycolysis and glycolytic capacity indicating a shift from oxidative respiration toward anaerobic glycolysis (Figure 7D). The pooled data for LPS normalized to the vehicle confirmed the equal shifts in all genotypes, except the proton leak was increased in pAPP and glycolytic capacity in spAPP compared with control iMGLs (Figure 7E).
Figure 7.

Metabolism of iMGLs Is Altered under Pro- and Anti-inflammatory Stimuli and by APOE4 Genetic Background
(A) Representative oxygen consumption rate (OCR) curves for iMGLs following 24 h vehicle (VEH), LPS, IL-4, IFN-γ, and LPS-IFN-γ treatments, all 20 ng/mL. n = 3–5 wells.
(B–D) Corresponding extracellular acidification rate (ECAR) curves (B). Mitochondrial parameters calculated from (C) OCRs in (A and D) from ECARs in (B).
(E–H) Heatmap indicating decrease (blue) or increase (red) in fold change of mitochondrial parameters of LPS-treated iMGLs compared with vehicle (E). White equals 1. n = 5 CTRL, n = 4 pAPP, n = 2 spAPP, n = 3 APOE3, and n = 2 APOE4 batches with 10 wells; n = 1 isogenic, and n = 3 PSEN1 batches with 4–5 wells. Representative OCR and ECAR curves for (F) control and APPswe, (G) isogenic and PSEN1ΔE9, and for (H) APOE4 and APOE3 iMGLs. n = 5–10 wells, repeated with three batches.
(I) Mitochondrial parameters calculated from OCRs and ECARs in (H) ∗p < 0.05, ∗∗p < 0.01, ∗∗∗p < 0.001 compared with vehicle, #compared with LPS, †compared with IFN-γ, two-tailed unpaired t test. Olig, oligomycin; FCCP, carbonyl cyanide-4-(trifluoromethoxy)phenylhydrazone; R/A, rotenone and antimycin A, each 1 μM. CTRL, control; p, presymptomatic; sp, symptomatic; PSEN, PSEN1ΔE9; APP, APPswe; and ISO, isogenic control iMGLs.
To elucidate whether AD-predisposing genetic backgrounds provoked a metabolic shift toward a proinflammatory glycolytic phenotype, we next compared respiration between the genotypes without stimulus. FAD mutations did not alter the metabolism (Figures 7F and 7G). In contrast, oxygen consumption rate was lower in APOE4 iMGLs compared with APOE3 iMGLs, demonstrating a similar shift as with LPS treatment (Figure 7H). Surprisingly, the APOE4 genotype led to a reduced extracellular acidification (Figure 7H), whereas LPS had increased it (Figure 7A). In accordance, APOE4 iMGLs showed a reduction in all mitochondrial parameters compared with the APOE3 iMGLs (Figure 7I).
Discussion
Here, we demonstrate the power of iPSC-derived microglia to elucidate distinct functional phenotypes of human microglia in disease. Differentiated iMGLs show a typical microglia-like gene and protein expression and respond to inflammatory stimuli robustly in multiple functional assays. We pinpoint specific phenotypes in iMGLs with three AD-predisposing genetic backgrounds, revealing that APOE4 has a profound impact on several aspects of microglial functionality, whereas APPswe and PSEN1ΔE9 have minor effects. The distinct phenotypes were observed without changes in amounts of Aβ, suggesting that Aβ burden associated with PSEN1ΔE9, APPswe, and APOE4 is of neuronal and astrocytic origin (Oberstein et al., 2015, Scheuner et al., 1996), and that human microglia with these genotypes harbor alternative mechanisms underlying development and progression of AD.
This study reveals that APOE4 iMGLs are fundamentally unable to mount normal microglial functionality as hypothesized for AD (Saijo and Glass, 2011). The APOE4 genotype impaired phagocytosis and migration, and aggravated inflammatory responses of iMGLs, suggesting that APOE4 confers iMGLs toward a proinflammatory disease-associated microglial (DAM) phenotype (Lin et al., 2018, Olah et al., 2018). We also reported similar responses to proinflammatory IFN-γ and LPS in phagocytosis and cytokine release, consistent with murine microglia (Townsend et al., 2005, Koenigsknecht-Talboo and Landreth, 2005). APOE4 conferred decrease in migration at basal level and in response to fractalkine, although no changes in P2RY12 or CX3CR1 expression were observed. Furthermore, no increase in chemokinesis upon Aβ exposure was seen in scratch wound assay, although invasion assays could be more relevant to study chemotaxis. In mouse models, the switch to DAM is triggered by TREM2-APOE interaction (Krasemann et al., 2017); however, exact mechanisms underlying human APOE4-induced inflammatory phenotype in AD microglia remain incompletely defined.
We extend these findings to highlight a novel role of APOE4 in impaired metabolism of microglia. The cellular metabolism was robustly shifted in all iMGLs in response to inflammatory stimuli. LPS induced switch from oxidative metabolism to anaerobic glycolysis in line with recent evidence (Ghosh et al., 2018, Orihuela et al., 2016), whereas less studied IFN-γ increased both oxidative and glycolytic metabolism, supporting its role in the priming of microglia to meet the energy demands upon activation (Ta et al., 2019). Metabolic shift toward glycolysis is reported to occur also in AD microglia with TREM2 mutations (Ulland et al., 2017). On the contrary, we observed a general downregulation of all metabolic parameters, both oxidative and glycolytic, in APOE4 iMGLs. Thus, APOE4-induced inhibition of microglial metabolism and phagocytosis accompanied with heightened cytokine release may partly explain the development AD-related plaque burden in the brain.
In contrast to APOE4, the FAD mutations caused only a slight decrease in proinflammatory cytokine release and increase in chemokinesis. Unlike that recently reported for sporadic AD lines (Xu et al., 2019), APPswe and PSEN1ΔE9 mutations did not predispose iMGLs toward a more proinflammatory phenotype, but rather toward a senescent phenotype incapable of implementing a full inflammatory response. Cytokine-mediated inflammation has been strongly established in multiple animal models of AD, but human patients show varied results (Wang et al., 2015, Smith et al., 2012, Barroeta-Espar et al., 2019). PSEN2 rather than PSEN1 has been reported to modulate microglial cytokine release (Jayadev et al., 2013). iMGLs secreted similar levels of cytokines with human autopsy microglia (Rustenhoven et al., 2016), and decrease in FAD iMGLs is consistent with lower cytokine levels reported in certain brain areas of AD patients compared with non-AD subjects (Lanzrein et al., 1998). These mild and opposite outcomes in iMGLs with FAD mutations compared with the APOE4 genotype indicate that functionality of human microglia with different genetic backgrounds is sensitively and distinctly modulated, and that pathogenic effects of APPswe and PSEN1ΔE9 are mainly mediated by other cell types.
To elucidate the aforementioned functional AD phenotypes of human microglia we used a novel method to generate iMGLs. Several groups have recently reported protocols (Douvaras et al., 2017, Haenseler et al., 2017, Muffat et al., 2016, Pandya et al., 2017) to produce microglia from stem cells, and our protocol closely resembles methods from the Blurton-Jones group (Abud et al., 2017, McQuade et al., 2018). In our method, differentiation is initiated simply with a defined number of single cells to generate functional high-purity microglia-like cells in 24 days with a 20-fold yield. Importantly, we confirmed that most cells differentiate through primitive EMPs, the most critical step making microglia distinct from other tissue macrophages (Kennedy et al., 2007, Sturgeon et al., 2014). In our hands, low oxygen conditions during the early stages were pivotal in yielding considerable numbers of primitive EMPs, even though a recent study (McQuade et al., 2018) suggests that normoxic conditions would be advantageous for simplifying equipment. The microglia-like identity of iMGLs was confirmed with high expression of microglial signature genes and low expression of macrophage genes, since microglial genes are expressed to some extent also in primitive macrophages (Haenseler et al., 2017).
Considering that iPSC-models fundamentally produce rather immature cell types, the iMGLs probably represent relatively young microglia. In accordance, P2RY12, a marker for mature microglia, was expressed at a relatively low level (Bennett et al., 2016, Butovsky et al., 2014). iMGLs also exhibited a high migration capacity in response to chemotactic signals, such as ATP (De Simone et al., 2010, Lambert et al., 2010), as has been shown previously for young microglia (Caldeira et al., 2017). Thus, we recognize that the method can be further optimized by utilizing the advantages presented in other iPSC-derived microglia protocols. FBS could be replaced with more defined supplements to reduce potential unwanted priming that might mask subtle genotype differences and additional maturation factors, such as transforming growth factor β, CD200, and CX3CL1, could be applied.
Taken together, we report here a short and relatively easy to use protocol to differentiate iMGLs from iPSCs. We characterize the effect of AD-predisposing genetic backgrounds on the functionality of cells featuring a profound impact of APOE on the phenotype of microglia. The current study highlights the importance of investigating the role of gene variants in human microglia and provides a useful, clinically relevant model for studying microglia in disease.
Experimental Procedures
See further details in the Supplemental Experimental Procedures.
Generation and Maintenance of iPSCs
iPSC lines Ctrl1, Ctrl3, and PSEN1, and their isogenic control lines were previously generated and characterized (Oksanen et al., 2017) by the approval of the committee on Research Ethics of Northern Savo Hospital district (123/2016) after written consent from the subjects. pAPP and spAPP lines were approved by the ethical review board of Karolinska Institutet/University (2017/834–31/1), and spAPP was characterized previously (Oksanen et al., 2018). HC1-3 and LOAD1-3 lines were characterized (Balez et al., 2016, Munoz et al., 2018, Ooi et al., 2013) with the approval of the University of Wollongong human research ethics committee (HE13/299). Previously uncharacterized lines pAPP, TOB0002c3, and MBE2968c1 were approved by the ethical review board of Karolinska Institutet/University (2017/834–31/1), or by the human research ethics committees of the Royal Victorian Eye and Ear Hospital (11/1031H, 13/1151H-004), University of Melbourne (1545394), University of Tasmania (H0014124), with the requirements of the National Health & Medical Research Council of Australia and conformed with the Declarations of Helsinki (McCaughey et al., 2016). Fibroblasts were isolated and cultured as described previously (Crombie et al., 2017, Qu et al., 2013) and were reprogrammed to iPSCs either with Sendai virus using CytoTune 1.0 kit (Invitrogen) (Holmqvist et al., 2016) or by nucleofection (Lonza Amaxa Nucleofector) (Okita et al., 2011). iPSCs were maintained in Essential 8 Medium (E8, Gibco) on Matrigel (Corning) and were passaged with 0.5 mM EDTA (Invitrogen) in the presence of 5 μM Y-27632 (Selleckchem). All iPSCs were confirmed to be sterile and all cell cultures were tested for mycoplasma using a MycoAlert Kit (Lonza).
Differentiation of iMGLs
On D0, iPSCs were dissociated to single cells with 0.5 mM EDTA or Accutase (Innovative Cell Technologies) and were replated at a density of 6,000–16,000 cells/cm2 on Matrigel in E8, 0.5% penicillin/streptomycin (P/S) (50 IU/50 mg/mL), 5 ng/mL BMP4, 25 ng/mL Activin A (both from PeproTech or Miltenyi Biotec), 1 μM CHIR 99021 (Axon or Stem Cell Technologies) and 10 μM Y-27632. The cells were maintained in low oxygen at 5% O2, 5% CO2, 37°C. On D1, the medium was replaced with a lower concentration of 1 μM Y-27632. After 48 h on D2 the medium was changed to differentiation base medium (dif-base) containing DMEM/F-12, 0.5% P/S, 1% GlutaMAX, 0.0543% sodium bicarbonate (all from Thermo Fisher Scientific), 64 mg/L L-ascorbic acid and 14 μg/L sodium selenite (both from Sigma). The dif-base was supplemented with 100 ng/mL FGF2, 50 ng/mL VEGF (both from PeproTech), 10 μM SB431542 (Selleckchem or Stem Cell Technologies), and 5 μg/mL insulin (Sigma). On D4, the media was replaced by dif-base supplemented with 5 μg/mL insulin, 50 ng/mL FGF2, VEGF, IL-6, and thyroid peroxidase, and 10 ng/mL IL-3 and stem cell factor. From then on, the cells were maintained in a normoxic incubator. Fresh EMP medium was changed daily until D8, when floating round EMPs were collected from the top of the monolayer. After centrifugation 300 × g for 5 min, 350,000 cells/mL were transferred to ULA dishes (Corning) in microglial medium containing Iscove's modified Dulbecco's medium (Thermo Fisher Scientific), 0.5% P/S, and 10% heat inactivated FBS (Biowest) or DMEM/F12, 0.5% N2, 0.5% B27 supplemented with 5 μg/mL insulin, 5 ng/mL MCSF, and 100 ng/mL IL-34 (both from PeproTech). On D10, the cell suspension was changed by centrifuging and 350,000 cells/mL were seeded back to ULA dishes in microglial maturation medium supplemented with 10 ng/mL MCSF and 10 ng/mL IL-34. This medium was changed similarly every second day until D16, when the cells were detached from ULA dishes with Accutase and replated on PDL-coated (Sigma) nunclon cell culture-treated plates (Thermo Fisher Scientific) in desired densities for experiments. Half of the maturation medium was changed daily until D23–24 when experiments were performed. To ensure the functionality of the cells after longer maturation, iMGLs from APOE lines were maturated in presence of IL-34 (100 ng/mL) and MCSF (5 ng/mL) until D42, and similar results were obtained for cytokine secretion, qRT-PCR and phagocytosis.
Statistical Analysis
Statistical analysis was performed using Graphpad Prism 7. Comparisons involving two groups were analyzed with two-tailed Student’s t test. One-way ANOVA was utilized for comparisons with more than two groups followed by Tukey's post hoc test. Two-way ANOVA was utilized for comparisons of genotypes and treatment groups and followed by Bonferroni's multiple-comparison post hoc test. Corrected p values for multiple comparisons were reported. Differences were considered significant when p < 0.05.
Author Contributions
H.K. and M.C.-S. designed and performed the experiments and analyzed the data. T.M., L.O., K.M.K., and H.K. conceived and designed the study. T.M. and H.K. developed the differentiation method of iMGLs with guidance from M.P.S. and N.P. T.M., H.K., L.O., and M.C.-S. supervised experiments and interpreted the results. D.H., A.P., A.W.H., J.V., C.G., G.C.S., S.L., J.K., and M.O. generated and characterized iPSCs lines. H.K. and M.C.-S. cultured the iPSCs and iMGLs with input from S.O., S.E., M.G.B., I.F., P.K., and M.F.F. R.G., S.C., and M.F.F. performed transcriptome analysis. I.F. developed the 3D brain organoids and M.O. prepared neuronal 3D-cultures. Y.I. and A.S. did calcium imaging. H.K. and S.W. conducted flow cytometer analysis with input from F.S. N.H., and A.W.H. performed western blots. H.K., T.M., L.O., and M.C.-S. interpreted the data and wrote the paper, while all authors provided feedback.
Acknowledgments
This work is part of an EU Joint Program – Neurodegenerative Disease Research (JPND) project. This study was funded by the University of Eastern Finland, the Academy of Finland under grant nos. 301234, 298071, 305516, and 315459 (FiNeFTD), the European Union’s Horizon 2020 research and innovation program under grant agreement no. 643417, Finnish Instrumentarium Science Foundation, and Yrjö Jahnsson’s Foundation grant no. 20187070, the National Health and Medical Research Council of Australia (NHMRC, APP1125796), an NHMRC Boosting Dementia Research Leadership Fellowship (APP1135720), Yulgilbar Alzheimer’s Research Program, the DHB Foundation, the C.F. Leung Memorial Trust, the Brain Foundation, Dementia Australia, a National Health and Medical Research Council Practitioner Fellowship (AWH) and Senior Research Fellowship (AP, 1154389), an Australian Research Council Future Fellowship (AP, FT140100047), the University of Melbourne and Operational Infrastructure Support from the Victorian Government. We thank Matti Viitala for skin biopsies, Louise A. Rooney, Sophie Chevalier, and Maciej Daniszewski for the characterization of iPSC lines, Vikrant Singh for virtual karyotype help, and Helena H. Liang for culture of biopsies to fibroblasts. We also thank Finnish Functional Genomics Center (FFGC), University of Turku and Åbo Akademi and Biocenter Finland, for RNA sequencing. This work was carried out with the support of UEF Cell and Tissue Imaging Unit, University of Eastern Finland.
Published: September 12, 2019
Footnotes
Supplemental Information can be found online at https://doi.org/10.1016/j.stemcr.2019.08.004.
Accession Numbers
The accession number for the RNA sequencing data generated in this paper is GEO: GSE135707. The datasets reanalyzed for this study are available through GEO: GSE89189 (Abud et al., 2017).
Supplemental Information
References
- Abud E.M., Ramirez R.N., Martinez E.S., Healy L.M., Nguyen C.H.H., Newman S.A., Yeromin A.V., Scarfone V.M., Marsh S.E., Fimbres C. iPSC-derived human microglia-like cells to study neurological diseases. Neuron. 2017;94:278–293.e9. doi: 10.1016/j.neuron.2017.03.042. [DOI] [PMC free article] [PubMed] [Google Scholar]
- Bagyinszky E., Youn Y.C., An S.S., Kim S. The genetics of Alzheimer's disease. Clin. Interv. Aging. 2014;9:535–551. doi: 10.2147/CIA.S51571. [DOI] [PMC free article] [PubMed] [Google Scholar]
- Balez R., Steiner N., Engel M., Munoz S.S., Lum J.S., Wu Y., Wang D., Vallotton P., Sachdev P., O'Connor M. Neuroprotective effects of apigenin against inflammation, neuronal excitability and apoptosis in an induced pluripotent stem cell model of Alzheimer's disease. Sci. Rep. 2016;6:31450. doi: 10.1038/srep31450. [DOI] [PMC free article] [PubMed] [Google Scholar]
- Banati R.B., Gehrmann J., Czech C., Monning U., Jones L.L., Konig G., Beyreuther K., Kreutzberg G.W. Early and rapid de novo synthesis of Alzheimer beta A4-amyloid precursor protein (APP) in activated microglia. Glia. 1993;9:199–210. doi: 10.1002/glia.440090305. [DOI] [PubMed] [Google Scholar]
- Barroeta-Espar I., Weinstock L.D., Perez-Nievas B.G., Meltzer A.C., Siao Tick Chong M., Amaral A.C., Murray M.E., Moulder K.L., Morris J.C., Cairns N.J. Distinct cytokine profiles in human brains resilient to Alzheimer's pathology. Neurobiol. Dis. 2019;121:327–337. doi: 10.1016/j.nbd.2018.10.009. [DOI] [PMC free article] [PubMed] [Google Scholar]
- Bennett M.L., Bennett F.C., Liddelow S.A., Ajami B., Zamanian J.L., Fernhoff N.B., Mulinyawe S.B., Bohlen C.J., Adil A., Tucker A. New tools for studying microglia in the mouse and human CNS. Proc. Natl. Acad. Sci. U S A. 2016;113:E1738–E1746. doi: 10.1073/pnas.1525528113. [DOI] [PMC free article] [PubMed] [Google Scholar]
- Butovsky O., Jedrychowski M.P., Moore C.S., Cialic R., Lanser A.J., Gabriely G., Koeglsperger T., Dake B., Wu P.M., Doykan C.E. Identification of a unique TGF-beta-dependent molecular and functional signature in microglia. Nat. Neurosci. 2014;17:131–143. doi: 10.1038/nn.3599. [DOI] [PMC free article] [PubMed] [Google Scholar]
- Caldeira C., Cunha C., Vaz A.R., Falcao A.S., Barateiro A., Seixas E., Fernandes A., Brites D. Key aging-associated alterations in primary microglia response to beta-amyloid stimulation. Front. Aging Neurosci. 2017;9:277. doi: 10.3389/fnagi.2017.00277. [DOI] [PMC free article] [PubMed] [Google Scholar]
- Colonna M., Butovsky O. Microglia function in the central nervous system during health and neurodegeneration. Annu. Rev. Immunol. 2017;35:441–468. doi: 10.1146/annurev-immunol-051116-052358. [DOI] [PMC free article] [PubMed] [Google Scholar]
- Crombie D.E., Daniszewski M., Liang H.H., Kulkarni T., Li F., Lidgerwood G.E., Conquest A., Hernandez D., Hung S.S., Gill K.P. Development of a modular automated system for maintenance and differentiation of adherent human pluripotent stem cells. SLAS Discov. 2017;22:1016–1025. doi: 10.1177/2472555217696797. [DOI] [PubMed] [Google Scholar]
- Crook R., Verkkoniemi A., Perez-Tur J., Mehta N., Baker M., Houlden H., Farrer M., Hutton M., Lincoln S., Hardy J. A variant of Alzheimer's disease with spastic paraparesis and unusual plaques due to deletion of exon 9 of presenilin 1. Nat. Med. 1998;4:452–455. doi: 10.1038/nm0498-452. [DOI] [PubMed] [Google Scholar]
- De Simone R., Niturad C.E., De Nuccio C., Ajmone-Cat M.A., Visentin S., Minghetti L. TGF-beta and LPS modulate ADP-induced migration of microglial cells through P2Y1 and P2Y12 receptor expression. J. Neurochem. 2010;115:450–459. doi: 10.1111/j.1471-4159.2010.06937.x. [DOI] [PubMed] [Google Scholar]
- Douvaras P., Sun B., Wang M., Kruglikov I., Lallos G., Zimmer M., Terrenoire C., Zhang B., Gandy S., Schadt E. Directed differentiation of human pluripotent stem cells to Microglia. Stem Cell Reports. 2017;8:1516–1524. doi: 10.1016/j.stemcr.2017.04.023. [DOI] [PMC free article] [PubMed] [Google Scholar]
- Engel M., Balez R., Munoz S.S., Cabral-da-Silva M.C., Stevens C.H., Bax M., Do-Ha D., Sidhu K., Sachdev P., Ooi L. Viral-free generation and characterization of a human induced pluripotent stem cell line from dermal fibroblasts. Stem Cell Res. 2018;32:135–138. doi: 10.1016/j.scr.2018.09.014. [DOI] [PubMed] [Google Scholar]
- Ghosh S., Castillo E., Frias E.S., Swanson R.A. Bioenergetic regulation of microglia. Glia. 2018;66:1200–1212. doi: 10.1002/glia.23271. [DOI] [PMC free article] [PubMed] [Google Scholar]
- Ginhoux F., Greter M., Leboeuf M., Nandi S., See P., Gokhan S., Mehler M.F., Conway S.J., Ng L.G., Stanley E.R. Fate mapping analysis reveals that adult microglia derive from primitive macrophages. Science. 2010;330:841–845. doi: 10.1126/science.1194637. [DOI] [PMC free article] [PubMed] [Google Scholar]
- Ginhoux F., Lim S., Hoeffel G., Low D., Huber T. Origin and differentiation of microglia. Front. Cell Neurosci. 2013;7:45. doi: 10.3389/fncel.2013.00045. [DOI] [PMC free article] [PubMed] [Google Scholar]
- Haenseler W., Sansom S.N., Buchrieser J., Newey S.E., Moore C.S., Nicholls F.J., Chintawar S., Schnell C., Antel J.P., Allen N.D. A highly efficient human pluripotent stem cell Microglia model displays a neuronal-co-culture-specific expression profile and inflammatory response. Stem Cell Reports. 2017;8:1727–1742. doi: 10.1016/j.stemcr.2017.05.017. [DOI] [PMC free article] [PubMed] [Google Scholar]
- Hoffmann A., Kann O., Ohlemeyer C., Hanisch U.K., Kettenmann H. Elevation of basal intracellular calcium as a central element in the activation of brain macrophages (microglia): suppression of receptor-evoked calcium signaling and control of release function. J. Neurosci. 2003;23:4410–4419. doi: 10.1523/JNEUROSCI.23-11-04410.2003. [DOI] [PMC free article] [PubMed] [Google Scholar]
- Holmqvist S., Lehtonen S., Chumarina M., Puttonen K.A., Azevedo C., Lebedeva O., Ruponen M., Oksanen M., Djelloul M., Collin A. Creation of a library of induced pluripotent stem cells from Parkinsonian patients. NPJ Parkinson's Dis. 2016;2:16009. doi: 10.1038/npjparkd.2016.9. [DOI] [PMC free article] [PubMed] [Google Scholar]
- Jayadev S., Case A., Alajajian B., Eastman A.J., Moller T., Garden G.A. Presenilin 2 influences miR146 level and activity in microglia. J. Neurochem. 2013;127:592–599. doi: 10.1111/jnc.12400. [DOI] [PMC free article] [PubMed] [Google Scholar]
- Kennedy M., D'Souza S.L., Lynch-Kattman M., Schwantz S., Keller G. Development of the hemangioblast defines the onset of hematopoiesis in human ES cell differentiation cultures. Blood. 2007;109:2679–2687. doi: 10.1182/blood-2006-09-047704. [DOI] [PMC free article] [PubMed] [Google Scholar]
- Kierdorf K., Erny D., Goldmann T., Sander V., Schulz C., Perdiguero E.G., Wieghofer P., Heinrich A., Riemke P., Holscher C. Microglia emerge from erythromyeloid precursors via Pu.1- and Irf8-dependent pathways. Nat. Neurosci. 2013;16:273–280. doi: 10.1038/nn.3318. [DOI] [PubMed] [Google Scholar]
- Koenigsknecht-Talboo J., Landreth G.E. Microglial phagocytosis induced by fibrillar beta-amyloid and IgGs are differentially regulated by proinflammatory cytokines. J. Neurosci. 2005;25:8240–8249. doi: 10.1523/JNEUROSCI.1808-05.2005. [DOI] [PMC free article] [PubMed] [Google Scholar]
- Krasemann S., Madore C., Cialic R., Baufeld C., Calcagno N., El Fatimy R., Beckers L., O'Loughlin E., Xu Y., Fanek Z. The TREM2-APOE pathway drives the transcriptional phenotype of dysfunctional microglia in neurodegenerative diseases. Immunity. 2017;47:566–581.e9. doi: 10.1016/j.immuni.2017.08.008. [DOI] [PMC free article] [PubMed] [Google Scholar]
- Lambert C., Ase A.R., Seguela P., Antel J.P. Distinct migratory and cytokine responses of human microglia and macrophages to ATP. Brain Behav. Immun. 2010;24:1241–1248. doi: 10.1016/j.bbi.2010.02.010. [DOI] [PubMed] [Google Scholar]
- Lanzrein A.S., Johnston C.M., Perry V.H., Jobst K.A., King E.M., Smith A.D. Longitudinal study of inflammatory factors in serum, cerebrospinal fluid, and brain tissue in Alzheimer disease: interleukin-1beta, interleukin-6, interleukin-1 receptor antagonist, tumor necrosis factor-alpha, the soluble tumor necrosis factor receptors I and II, and alpha1-antichymotrypsin. Alzheimer Dis. Assoc. Disord. 1998;12:215–227. doi: 10.1097/00002093-199809000-00016. [DOI] [PubMed] [Google Scholar]
- Lavin Y., Winter D., Blecher-Gonen R., David E., Keren-Shaul H., Merad M., Jung S., Amit I. Tissue-resident macrophage enhancer landscapes are shaped by the local microenvironment. Cell. 2014;159:1312–1326. doi: 10.1016/j.cell.2014.11.018. [DOI] [PMC free article] [PubMed] [Google Scholar]
- Lee C.Y., Landreth G.E. The role of microglia in amyloid clearance from the AD brain. J. Neural Transm. (Vienna) 2010;117:949–960. doi: 10.1007/s00702-010-0433-4. [DOI] [PMC free article] [PubMed] [Google Scholar]
- Lin Y.T., Seo J., Gao F., Feldman H.M., Wen H.L., Penney J., Cam H.P., Gjoneska E., Raja W.K., Cheng J. APOE4 causes widespread molecular and cellular alterations associated with Alzheimer's disease phenotypes in human iPSC-derived brain cell types. Neuron. 2018;98:1141–1154.e7. doi: 10.1016/j.neuron.2018.05.008. [DOI] [PMC free article] [PubMed] [Google Scholar]
- Liu C.C., Liu C.C., Kanekiyo T., Xu H., Bu G. Apolipoprotein E and Alzheimer disease: risk, mechanisms and therapy. Nat. Rev. Neurol. 2013;9:106–118. doi: 10.1038/nrneurol.2012.263. [DOI] [PMC free article] [PubMed] [Google Scholar]
- Manocha G.D., Floden A.M., Rausch K., Kulas J.A., McGregor B.A., Rojanathammanee L., Puig K.R., Puig K.L., Karki S., Nichols M.R. APP regulates microglial phenotype in a mouse model of Alzheimer's disease. J. Neurosci. 2016;36:8471–8486. doi: 10.1523/JNEUROSCI.4654-15.2016. [DOI] [PMC free article] [PubMed] [Google Scholar]
- McCaughey T., Liang H.H., Chen C., Fenwick E., Rees G., Wong R.C., Vickers J.C., Summers M.J., MacGregor C., Craig J.E. An interactive multimedia approach to improving informed consent for induced pluripotent stem cell research. Cell Stem Cell. 2016;18:307–308. doi: 10.1016/j.stem.2016.02.006. [DOI] [PubMed] [Google Scholar]
- McQuade A., Coburn M., Tu C.H., Hasselmann J., Davtyan H., Blurton-Jones M. Development and validation of a simplified method to generate human microglia from pluripotent stem cells. Mol. Neurodegener. 2018;13:67. doi: 10.1186/s13024-018-0297-x. [DOI] [PMC free article] [PubMed] [Google Scholar]
- Muffat J., Li Y., Yuan B., Mitalipova M., Omer A., Corcoran S., Bakiasi G., Tsai L.H., Aubourg P., Ransohoff R.M. Efficient derivation of microglia-like cells from human pluripotent stem cells. Nat. Med. 2016;22:1358–1367. doi: 10.1038/nm.4189. [DOI] [PMC free article] [PubMed] [Google Scholar]
- Mullan M., Crawford F., Axelman K., Houlden H., Lilius L., Winblad B., Lannfelt L. A pathogenic mutation for probable Alzheimer's disease in the APP gene at the N-terminus of beta-amyloid. Nat. Genet. 1992;1:345–347. doi: 10.1038/ng0892-345. [DOI] [PubMed] [Google Scholar]
- Munoz S.S., Balez R., Castro Cabral-da-Silva M.E., Berg T., Engel M., Bax M., Do-Ha D., Stevens C.H., Greenough M., Bush A. Generation and characterization of human induced pluripotent stem cell lines from a familial Alzheimer's disease PSEN1 A246E patient and a non-demented family member bearing wild-type PSEN1. Stem Cell Res. 2018;31:227–230. doi: 10.1016/j.scr.2018.08.006. [DOI] [PubMed] [Google Scholar]
- Nadler Y., Alexandrovich A., Grigoriadis N., Hartmann T., Rao K.S., Shohami E., Stein R. Increased expression of the gamma-secretase components presenilin-1 and nicastrin in activated astrocytes and microglia following traumatic brain injury. Glia. 2008;56:552–567. doi: 10.1002/glia.20638. [DOI] [PubMed] [Google Scholar]
- Oberstein T.J., Spitzer P., Klafki H.W., Linning P., Neff F., Knolker H.J., Lewczuk P., Wiltfang J., Kornhuber J., Maler J.M. Astrocytes and microglia but not neurons preferentially generate N-terminally truncated Abeta peptides. Neurobiol. Dis. 2015;73:24–35. doi: 10.1016/j.nbd.2014.08.031. [DOI] [PubMed] [Google Scholar]
- Okita K., Matsumura Y., Sato Y., Okada A., Morizane A., Okamoto S., Hong H., Nakagawa M., Tanabe K., Tezuka K. A more efficient method to generate integration-free human iPS cells. Nat. Methods. 2011;8:409–412. doi: 10.1038/nmeth.1591. [DOI] [PubMed] [Google Scholar]
- Oksanen M., Hyotylainen I., Voutilainen J., Puttonen K.A., Hamalainen R.H., Graff C., Lehtonen S., Koistinaho J. Generation of a human induced pluripotent stem cell line (LL008 1.4) from a familial Alzheimer's disease patient carrying a double KM670/671NL (Swedish) mutation in APP gene. Stem Cell Res. 2018;31:181–185. doi: 10.1016/j.scr.2018.07.024. [DOI] [PubMed] [Google Scholar]
- Oksanen M., Petersen A.J., Naumenko N., Puttonen K., Lehtonen S., Gubert Olive M., Shakirzyanova A., Leskela S., Sarajarvi T., Viitanen M. PSEN1 mutant iPSC-derived model reveals severe astrocyte pathology in Alzheimer's disease. Stem Cell Reports. 2017;9:1885–1897. doi: 10.1016/j.stemcr.2017.10.016. [DOI] [PMC free article] [PubMed] [Google Scholar]
- Olah M., Patrick E., Villani A.C., Xu J., White C.C., Ryan K.J., Piehowski P., Kapasi A., Nejad P., Cimpean M. A transcriptomic atlas of aged human microglia. Nat. Commun. 2018;9:539. doi: 10.1038/s41467-018-02926-5. [DOI] [PMC free article] [PubMed] [Google Scholar]
- Ooi L., Sidhu K., Poljak A., Sutherland G., O'Connor M.D., Sachdev P., Munch G. Induced pluripotent stem cells as tools for disease modelling and drug discovery in Alzheimer's disease. J. Neural Transm. (Vienna) 2013;120:103–111. doi: 10.1007/s00702-012-0839-2. [DOI] [PubMed] [Google Scholar]
- Orihuela R., McPherson C.A., Harry G.J. Microglial M1/M2 polarization and metabolic states. Br. J. Pharmacol. 2016;173:649–665. doi: 10.1111/bph.13139. [DOI] [PMC free article] [PubMed] [Google Scholar]
- Pandya H., Shen M.J., Ichikawa D.M., Sedlock A.B., Choi Y., Johnson K.R., Kim G., Brown M.A., Elkahloun A.G., Maric D. Differentiation of human and murine induced pluripotent stem cells to microglia-like cells. Nat. Neurosci. 2017;20:753–759. doi: 10.1038/nn.4534. [DOI] [PMC free article] [PubMed] [Google Scholar]
- Pulido-Salgado M., Vidal-Taboada J.M., Barriga G.G., Sola C., Saura J. RNA-Seq transcriptomic profiling of primary murine microglia treated with LPS or LPS + IFNgamma. Sci. Rep. 2018;8:16096. doi: 10.1038/s41598-018-34412-9. [DOI] [PMC free article] [PubMed] [Google Scholar]
- Qu C., Puttonen K.A., Lindeberg H., Ruponen M., Hovatta O., Koistinaho J., Lammi M.J. Chondrogenic differentiation of human pluripotent stem cells in chondrocyte co-culture. Int. J. Biochem. Cell Biol. 2013;45:1802–1812. doi: 10.1016/j.biocel.2013.05.029. [DOI] [PubMed] [Google Scholar]
- Rustenhoven J., Park T.I., Schweder P., Scotter J., Correia J., Smith A.M., Gibbons H.M., Oldfield R.L., Bergin P.S., Mee E.W. Isolation of highly enriched primary human microglia for functional studies. Sci. Rep. 2016;6:19371. doi: 10.1038/srep19371. [DOI] [PMC free article] [PubMed] [Google Scholar]
- Saijo K., Glass C.K. Microglial cell origin and phenotypes in health and disease. Nat. Rev. Immunol. 2011;11:775–787. doi: 10.1038/nri3086. [DOI] [PubMed] [Google Scholar]
- Scheuner D., Eckman C., Jensen M., Song X., Citron M., Suzuki N., Bird T.D., Hardy J., Hutton M., Kukull W. Secreted amyloid beta-protein similar to that in the senile plaques of Alzheimer's disease is increased in vivo by the presenilin 1 and 2 and APP mutations linked to familial Alzheimer's disease. Nat. Med. 1996;2:864–870. doi: 10.1038/nm0896-864. [DOI] [PubMed] [Google Scholar]
- Schwartz M.P., Hou Z., Propson N.E., Zhang J., Engstrom C.J., Santos Costa V., Jiang P., Nguyen B.K., Bolin J.M., Daly W. Human pluripotent stem cell-derived neural constructs for predicting neural toxicity. Proc. Natl. Acad. Sci. U S A. 2015;112:12516–12521. doi: 10.1073/pnas.1516645112. [DOI] [PMC free article] [PubMed] [Google Scholar]
- Selkoe D.J. The cell biology of beta-amyloid precursor protein and presenilin in Alzheimer's disease. Trends Cell Biol. 1998;8:447–453. doi: 10.1016/s0962-8924(98)01363-4. [DOI] [PubMed] [Google Scholar]
- Shi Y., Holtzman D.M. Interplay between innate immunity and Alzheimer disease: APOE and TREM2 in the spotlight. Nat. Rev. Immunol. 2018;18:759–772. doi: 10.1038/s41577-018-0051-1. [DOI] [PMC free article] [PubMed] [Google Scholar]
- Smith J.A., Das A., Ray S.K., Banik N.L. Role of pro-inflammatory cytokines released from microglia in neurodegenerative diseases. Brain Res. Bull. 2012;87:10–20. doi: 10.1016/j.brainresbull.2011.10.004. [DOI] [PMC free article] [PubMed] [Google Scholar]
- Sturgeon C.M., Ditadi A., Awong G., Kennedy M., Keller G. Wnt signaling controls the specification of definitive and primitive hematopoiesis from human pluripotent stem cells. Nat. Biotechnol. 2014;32:554–561. doi: 10.1038/nbt.2915. [DOI] [PMC free article] [PubMed] [Google Scholar]
- Ta T.T., Dikmen H.O., Schilling S., Chausse B., Lewen A., Hollnagel J.O., Kann O. Priming of microglia with IFN-gamma slows neuronal gamma oscillations in situ. Proc. Natl. Acad. Sci. U S A. 2019 doi: 10.1073/pnas.1813562116. [DOI] [PMC free article] [PubMed] [Google Scholar]
- Townsend K.P., Town T., Mori T., Lue L.F., Shytle D., Sanberg P.R., Morgan D., Fernandez F., Flavell R.A., Tan J. CD40 signaling regulates innate and adaptive activation of microglia in response to amyloid beta-peptide. Eur. J. Immunol. 2005;35:901–910. doi: 10.1002/eji.200425585. [DOI] [PubMed] [Google Scholar]
- Uenishi G., Theisen D., Lee J.H., Kumar A., Raymond M., Vodyanik M., Swanson S., Stewart R., Thomson J., Slukvin I. Tenascin C promotes hematoendothelial development and T lymphoid commitment from human pluripotent stem cells in chemically defined conditions. Stem Cell Reports. 2014;3:1073–1084. doi: 10.1016/j.stemcr.2014.09.014. [DOI] [PMC free article] [PubMed] [Google Scholar]
- Ulland T.K., Song W.M., Huang S.C., Ulrich J.D., Sergushichev A., Beatty W.L., Loboda A.A., Zhou Y., Cairns N.J., Kambal A. TREM2 maintains microglial metabolic fitness in Alzheimer's disease. Cell. 2017;170:649–663.e13. doi: 10.1016/j.cell.2017.07.023. [DOI] [PMC free article] [PubMed] [Google Scholar]
- Wang W.Y., Tan M.S., Yu J.T., Tan L. Role of pro-inflammatory cytokines released from microglia in Alzheimer's disease. Ann. Transl. Med. 2015;3:136. doi: 10.3978/j.issn.2305-5839.2015.03.49. [DOI] [PMC free article] [PubMed] [Google Scholar]
- Weuve J., Hebert L.E., Scherr P.A., Evans D.A. Deaths in the United States among persons with Alzheimer's disease (2010-2050) Alzheimers Dement. 2014;10:e40–e46. doi: 10.1016/j.jalz.2014.01.004. [DOI] [PMC free article] [PubMed] [Google Scholar]
- Xu M., Zhang L., Liu G., Jiang N., Zhou W., Zhang Y. Pathological changes in alzheimer's disease analyzed using induced pluripotent stem cell-derived human Microglia-like cells. J. Alzheimers Dis. 2019;67:357–368. doi: 10.3233/JAD-180722. [DOI] [PubMed] [Google Scholar]
- Zhang Y., Chen K., Sloan S.A., Bennett M.L., Scholze A.R., O'Keeffe S., Phatnani H.P., Guarnieri P., Caneda C., Ruderisch N. An RNA-sequencing transcriptome and splicing database of glia, neurons, and vascular cells of the cerebral cortex. J. Neurosci. 2014;34:11929–11947. doi: 10.1523/JNEUROSCI.1860-14.2014. [DOI] [PMC free article] [PubMed] [Google Scholar]
- Zhao Y., Li X., Huang T., Jiang L.L., Tan Z., Zhang M., Cheng I.H., Wang X., Bu G., Zhang Y.W. Intracellular trafficking of TREM2 is regulated by presenilin 1. Exp. Mol. Med. 2017;49:e405. doi: 10.1038/emm.2017.200. [DOI] [PMC free article] [PubMed] [Google Scholar]
Associated Data
This section collects any data citations, data availability statements, or supplementary materials included in this article.