

Summary
We introduce and develop a method that demonstrates that the algorithmic information content of a system can be used as a steering handle in the dynamical phase space, thus affording an avenue for controlling and reprogramming systems. The method consists of applying a series of controlled interventions to a networked system while estimating how the algorithmic information content is affected. We demonstrate the method by reconstructing the phase space and their generative rules of some discrete dynamical systems (cellular automata) serving as controlled case studies. Next, the model-based interventional or causal calculus is evaluated and validated using (1) a huge large set of small graphs, (2) a number of larger networks with different topologies, and finally (3) biological networks derived from a widely studied and validated genetic network (E. coli) as well as on a significant number of differentiating (Th17) and differentiated human cells from a curated biological network data.
Subject Areas: Gene Network, Systems Biology, Complex Systems, Computer Science, Algorithms
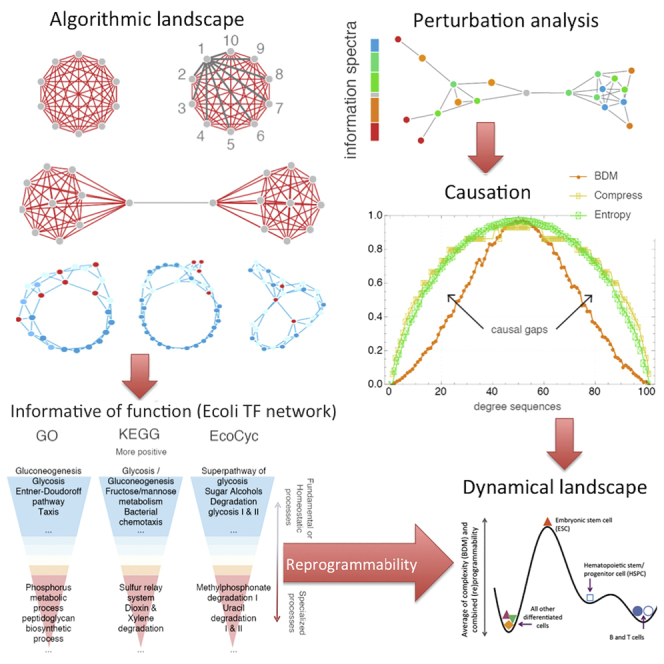
Graphical Abstract
Highlights
-
•
Use of algorithmic randomness to steer systems in dynamical space to control and reprogram them
-
•
Applying series of controlled interventions we reprogram systems, programs, and networks
-
•
The method reconstructs the phase space and generative rules of discrete systems
-
•
We validate on a number of networks with different topologies, and on biological networks
Gene Network; Systems Biology; Complex Systems; Computer Science; Algorithms
Introduction
Since the turn of the century, we have witnessed a rapid increase in the amount of data, which is produced in a number of different domains. Examples include financial information, social data, and biological and health-related data. Finding non-random patterns within such data, which can be used for predictions, constitutes a generic challenge in those realms. Concurrently, there has been a surge of analytical techniques and machine learning tools to search for patterns in huge amounts of data. Increasing computational capacity to monitor, model, and analyze huge datasets has largely fueled this.
Furthermore, it turns out that data lends itself for a network representation, which can readily be appreciated in the case of social networks and biological interaction data. Hence, there is a rise of what sometimes is referred to as network science, which has grown rapidly during the last 15 years (Yildirim et al., 2007, Barabási et al., 2011, Kiani and Kaderali, 2014, Deng et al., 2017, Tényi et al., 2018). Here a growing toolbox of analytical techniques has been developed to facilitate the search for sub-structures such as motifs, clusters, and modules in such networks in addition to statistical characterization of such networks (Cimini et al., 2019). Now, despite all these impressive and promising progress, we are still far behind when asking questions such as how to control such networked systems in an engineering sense (Tegnér et al., 2016). For example, which intervention would steer or reprogram the network behavior and associated patterns in a particular direction. This includes both controlling a system for avoiding systems failure as well as increasing or decreasing the production of entities from the system, using a biological metabolic metaphor. Furthermore, when referring to which intervention we do not necessarily mean a single point of control, it could well be controlling several points in the networked systems, with or without a certain temporal ordering. This is a generic and difficult challenge in science. Here we present a general framework, based on algorithmic information theory, to address this challenge. We have recently demonstrated that such a problem formulation is sufficiently powerful to disentangle different generative programs from each other (Zenil et al., 2019b, Zenil et al., 2019a). Here we address how to unpack a single generative program from observational data.
This problem is at the core of the challenge of how to make optimal predictions about the behavior of dynamical complex systems. It remains an outstanding challenge of how to understand and ultimately reprogram the behavior of such systems with access to only partial systems knowledge due to incomplete or noisy data. Our motivation for searching and defining a new way to address the problem of control originates from the difficulty in applying what may appear as a more straightforward modeling approach (Liu et al., 2011). For example, a natural approach would be to work directly with either an input-output description of the system or the kinetic equations of the networks. This would enable us to analyze and decode efficient control of the specific system using forward simulations coupled with an analysis of the effects of different simulated interventions. What could be referred to classical control theory has over the decades produced a powerful toolbox when dealing with linear transfer functions. However, when faced with non-linear transfer functions, our understanding is much more limited. Furthermore, for large nonlinear-networked system, then the notion of input-output transformation is not readily applicable. For example, depending on the nature of the input signal and the particular location of the readout (output), the effective transfer function will as a rule differ. Moreover, within physics and applied mathematics, there is limited experience and tools for working with large non-linear systems of equations. Techniques such as averaging (mean-field), model reduction (slow-fast analysis), or feature section (machine learning) can be applied under restricted (Tegnér et al., 2016). Finally, techniques for inferring kinetic equations from data when the generative system is non-linear are still in their infancy.
In conclusion, as of now, there is a limited prospect in either deriving non-linear equations from first principles or inferring such equations directly from data. Thus, the challenge of how to control such a system, when they to a large degree are unknown from a dynamical standpoint, is not readily tractable. Hence, not having access to the causal structure and dynamics, as encoded in kinetic equations, is one major remaining general challenge across numerous domains of science.
Here we develop an approach, based on algorithmic information theory, which could in a simplified manner be characterized to be situated in between explicit linear or non-linear models (Zenil et al., 2018a, Zenil et al., 2016). This allows us to analyze the objects directly using—what we refer to as—an algorithmic calculus to address the control problem, with special reference on reprogrammability, i.e., how to move a network from one state to another state. This provides us with strong fundamental tools to probe causality from such complex networked systems. In Zenil et al., 2016, Zenil et al., 2019a, we show how these tools can help deconvolve systems by most likely generative model. Here we further elaborate on the theory, methods associated, and numerical applications, especially in the context of biological systems. Why do we need algorithmic information theory in contrast to, say, the classical Shannon information theory? The latter is the established reference to describe communication channels, transformations, in essence, counting bits and their conversion in systems. Yet, as we have previously demonstrated (Zenil et al., 2017), there are cases in which a counting (Shannon) approach is not sufficient to detect differences in structure in systems, i.e., to capture differences in regularities, and therefore in extension—causality. At the core, to count bits or states, we need to know what is the macroscopic property we are interested in. This is a bias, akin to the challenge of optimization in machine learning, where we need to define which function to minimize or maximize at the outset. However, this becomes a fundamental restriction when we require a powerful tool to detect causal regularities in non-linear networked system, without kinetic equations, and with no access to a well-defined objective function. Algorithmic Information Theory (AIT), with roots in precise fundamental theorems in mathematics, is therefore exactly the kind foundation needed for our purposes. The seminal work of Kolmogorov, Chaitin, Solomonoff, Levin, and Martin-Löf (Chaitin, 1966, Martin-Löf, 1966, Solomonoff, 2008) proved to be sufficiently powerful to enable an unbiased characterization of randomness, complexity, and in effect solving Hume's inference problem conclusively. Based on such established knowledge drawn from the mathematical theories of computability and algorithmic probability that describe the limits of optimal characterization and algorithmic inference, we introduce a conceptual framework, with specific methods and applications that demonstrate the use and advantage of a powerful calculus based on the change of a system's algorithmic content over time and when subject to perturbations (Figure 1). At the core, we utilize the formal notion of algorithmic randomness as a foundation instead of using a prescribed objective function for the problem at hand. The catch is, however, that quantities in AIT are not computable in a Church-Turing sense. This clearly mitigated the developments of applications of AIT since its inception. Yet, recent breakthroughs (Delahaye and Zenil, 2012, Soler-Toscano et al., 2014) have demonstrated that those quantities can be numerically approximated (bounded from above) beyond what can be achieved using lossless compression. The paper presented here is, therefore, based on established knowledge and recent numerical advances drawn from the mathematical theories of computability and algorithmic probability that describe the limits of optimal characterization and algorithmic inference. We introduce what we think to the best of our knowledge constitutes a novel conceptual framework, with specific methods and applications that demonstrate the use and advantage of a powerful causal calculus based on the change of a system's algorithmic content over time and when subject to perturbations, without requiring the non-linear systems equations.
Figure 1.

From Statistical Correlation to Algorithmic Causation
(A–C) Graphs of different origin require different encodings capable of recursively generating each graph, interventions to the graph may or may not have an effect on the candidate algorithmic models depending on their algorithmic causal content. (A) A simple graph represented by a short code. (B) A random graph requires a longer code of about the same size as the graph itself in number of bits. (C) Most graphs are between these extremes namely complex graphs that neither are represented by shortest descriptions nor by the longest but in between.
(D) A sequence such as s cannot be characterized by measures based on Entropy or classical statistics, but it can be characterized as of low algorithmic complexity because more than one-third of all possible Turing machines with two states encode a decimal counter and are thus many small computer programs that encode a highly algorithmic sequence that may not have any statistical regularity (called the Champernowne constant, s has been proven to be Borel normal and thus of maximal Shannon Entropy).
(E) Shows a generative model of a Turing machine rule table able to generate the output of a counter that may underlie the sequence of natural numbers.
(F–I) (F) A computer program whose halting criterion is to reach the next leftmost head position of the Turing machine and (G) respective space-time evolution whose output in binary reproduces the sequence s in decimal. (H) A unary non-halting computer program that computes s directly followed by (I) its space-time diagram effectively encoding the sequence generating function f(x) = x + 1.
(J) It is thus clear that while Entropy H(s) can diverge from algorithmic (Kolmogorov-Chaitin) complexity C(s), it is C(s) encoding the simplicity of s and therefore characterizing its causal mechanistic nature by way of having been found by a procedure based on what will be described and exploited in this paper at the heart of the causal interventional calculus.
The Algorithmic Calculus
In brief, the theory of Algorithmic Information (Li and Vitanyi, 2008) defines what constitutes a cause as opposed to randomness in the realm of discrete and deterministic dynamical systems. Formally, the algorithmic complexity (Kolmogorov, 1965, Chaitin, 1966) of a string s is given by C(s|e): = min{|p|: U(p,e) = s}, where p is the program that produces s and halts, running on a (prefix-free [Calude and Stay, 2008]) universal Turing machine U with input e, which can be empty and is represented simply by C(s). C(s) is the length of the description of the generating mechanism. An object s is referred to as random, and consequently non-causal, if the algorithmic complexity C(s) of s is about the length of s itself (in bits), i.e., it has no generating mechanism other than a print(s) function. Algorithmic complexity C is the accepted mathematical measure of intrinsic randomness of an object (independent of probability distributions), which is a generalization of statistical randomness and refinement over the concept of Shannon entropy, as it does not depend on a choice of the probability distribution. Moreover, it has been proved to be mathematically robust (by virtue of the fact that independent definitions converge) (Chaitin, 1966, Gács, 1974, Schnorr, 1971), unlike the case of Shannon Entropy (Zenil et al., 2017), and because no computable measure can fully characterize (non-statistical) randomness (and indicate causality versus non-causality [Zenil et al., 2019b, Zenil et al., 2019a]) due to the lack of universal computational power to test for every possible non-random feature (Martin-Löf, 1966). The measure C can also be seen as a measure of compressibility, but compression algorithms (e.g., LZ, LZW) are in fact closer to entropy rate estimations (Figure 1J) than to algorithmic complexity despite their generalized use (or abuse).
The Invariance theorem (Solomonoff, 1964, Kolmogorov, 1965, Chaitin, 1966) guarantees that complexity values will only diverge by a constant (e.g., the length of a computer compiler, i.e., a translating program between universal reference Turing machines U1 and U2) and will asymptotically converge. Formally, |C(s)U1 - C(s)U2| < c, where C(s) is a function that takes s to be the length in bits of the length of the shortest program p that generates s (and halts) is lower semi-computable, which means it can only be approximated from above. Proper introductions to the areas of finite algorithmic complexity and applications are provided in Li and Vitanyi (2008), and introductions to algorithmic (infinite sequence) randomness can be found in Calude and Stay, 2008, Nies, 2009; and Hirschfeldt and Downey, 2010.
Algorithmic probability allows reaching a consensus of possible explanations of an underlying generating mechanism of a system (e.g., a network) at any time, thereby providing the most robust hypothesis for the available observable data. Algorithmic probability establishes and shows (Delahaye and Zenil, 2012, Soler-Toscano et al., 2014) that the consensus of several algorithmically likely solutions is the most likely one.
The chief advantage of algorithmic indices is that causal signals in a sequence may escape entropic measures if they do not contain statistical regularities (Zenil et al., 2017), but they do not escape the metric of algorithmic probability (AP) as there will be a Turing machine T capturing every statistical and also algorithmic aspect of s that compresses s but produces s in full with no more or less information than s itself (thus being lossless).
But, in practice, how to approximate C(s)? Lossless compression has been a common practice to estimate the algorithmic content of an object s. The algorithmic complexity of a sequence s is then defined as the length of the shortest compressed file producing s when decompressing it (the file must contain the decompression instructions and thus always comes with a natural overhead). Although lossless compression is an approximation of algorithmic complexity, actual implementations of lossless compression algorithms (e.g., Compress, Bzip2, gzip, PNG) are based purely upon entropy rate (Zenil, 2016, Zenil et al., 2017) and thus can only deal with statistical regularities of up to a window length size, hence being no more closely related to algorithmic complexity than entropy itself.
Unlike other computable measures, such as Shannon Entropy, Coding Theorem Method (CTM) has the potential to identify regularities that are not merely statistical (e.g., a sequence such as 1234 …) and that have as shortest program (and generating model) n: = n + 1, that is, even sequences with high Entropy but no statistical regularities that are not random have low algorithmic complexity and are thus causal as the result of an evolving computer program. As previously demonstrated (Delahaye and Zenil, 2012, Soler-Toscano et al., 2014), an exhaustive search can be carried out for a small-enough number of Turing machines for which the halting problem is known, thanks to the Busy Beaver game (Rado, 1962).
Because CTM is computationally very expensive (as expensive as estimating the Busy Beaver function), only the algorithmic complexity for short sequences (currently all sequences up to length k = 12) has thus far been estimated by the CTM method. To approximate the complexity of a longer sequence it is, therefore, necessary to aggregate the various computer programs that generate the string cleverly by taking advantage of properties related to Shannon entropy thereby establishing an interesting hybrid algorithmic-statistical measure.
The causal calculus, presented here, consists in studying the algorithmic-information dynamic properties of objects to construct an algorithmic-information landscape to identify and rank the elements by their algorithmic contribution and the changes they may exert on the original object, moving it toward or away from randomness. In essence, the landscape is estimated using such a perturbation analysis of the object. In what follows, we demonstrate that insights garnered from the algorithmic information landscape can effectively be used to find and unveil the dynamics and reprogramming capabilities of the systems, starting from a reconstruction of space-time dynamics and their initial and boundary conditions, helping infer the (most algorithmically likely) generating mechanism of an evolving system from a set of (partial and even disordered) observations (see Figure 2). These models and trajectories have the advantage of highlighting the principles by which a system or a network is organized, uncovering candidate mechanisms by which it may grow or develop.
Figure 2.

Representations and Dynamical Systems
(A) The causal calculus being introduced can help reveal the generating mechanism of a discrete dynamical system, regardless of the different lossless representations it may have, that is, representations that preserve (most of) the information of the system from which it can be reconstructed in full. This ability comes from the property of closed deterministic systems that must preserve their algorithmic complexity along its time evolution given that its generating mechanism is always the same at every time step except for the time index that can be encoded by only log(n) bits. This means that any deviation from log(n) indicates that the system is not closed or not deterministic and is thus possibly interacting with some other system for which we can identify its interacting elements by perturbing them and measuring their deviation from log(n).
(B) A one-dimensional evolving system displays the same information elements determining the different causal regions after an instantaneous observation following a perturbation analysis. In a Cellular Automaton, after two random row perturbations, the algorithmic calculus reveals which rows have been artificially perturbed, with gray cells showing the identified neutral row, the last (top-down) in the dynamic evolution, indicating the time direction of the system. See Figure 3.
(C) Unlike (A), Entropy is not invariant to different object descriptions. Shown here is a tree-like representation of a constructed causal network with low algorithmic randomness but near maximum Entropy degree sequence (Supplemental Information 8), a contradiction, given the recursive nature of the graph and the zero Shannon entropy rate of its adjacency matrix, diverging from its expected Shannon entropy.
(D) Latest nodes in the same graph depicted in (C) are identified by their neutral nature, revealing the time order and thereby exposing the generating mechanism of the recursive network.
To date, there are no alternatives to applying non-linear interventions to complex systems in the phase space when no access to the kinetic model is possible or available other than to make assumptions such as a system at a fixed point, linearity and arbitrary underlying mass probability distributions to perform simulations of candidate dynamical trajectories often requiring unavailable computing resources. This new calculus, however, requires much less prior information and makes significantly fewer assumptions to produce a collection of guiding causal interventions through desired even if rough dynamical trajectories that promise a wide range of applications. We explore the potential of this calculus to characterize genes in regulatory networks and to reprogram systems in general, including specific examples, theoretical and experimental, focusing on synthetic and biological data.
Results
Phase-Space and Mechanistic Model Reconstruction
In Figure 3 it is demonstrated how the algorithmic calculus can help reconstruct discrete dynamical systems (illustrated using one-dimensional cellular automata called Elementary Cellular Automata or ECA) with high accuracy from disordered states, and even index observations correctly, effectively providing a mechanistic generating model that can be run backward and forward in time. This is because late perturbations are more akin to a neutral information value (as established, in deterministic systems they should contribute less than log(n), with n representing the step index of the dynamical). The minor disagreements between the reconstructed order of observations shown in Figures 3A and 3B come from three sources: (1) it should be expected because more than one model may explain several arrangements of the same data; (2) we apply only single- (all experiments reported in Figure 3 except F and G) and double-row perturbations (for Figures 3F and 4G). Single perturbations have their limitations. For example, a greater number of simultaneous perturbations would be needed to correctly reconstruct deterministic order-R Markov systems for R > 1; and, finally, (3) algorithms to approximate the algorithmic information content are upper bounds and not exact values. The reconstruction of the same dynamical systems (cellular automata) taking into consideration an increasing number of observations illustrates (Figures 3D–3G), however, that the more the data the more accurate the reconstruction thereby demonstrating that the numerical algorithm is not at fault and that reconstruction in practice is not only possible but also computationally feasible and reliable. The method is scalable owing to the clever shortcuts implemented in the block decomposition method (BDM) method (decomposition of causal patches that together can construct candidate models of much larger systems).
Figure 3.

Space-Time Dynamics Reconstruction
(A) Reconstruction of the space-time evolution of dynamic systems (Elementary Cellular Automata or ECA Morris et al., 2014). Normal space-time evolution is displayed on the left-hand side; on the right-hand side are the reconstructed space-times after row scrambling by finding the lowest algorithmic complexity configuration among all possible 9! = 362,880 row permutations (8 steps + initial configuration). All are followed by Spearman correlation values for row order.
(B) Row time inference in linear time by the generation of an algorithmic model that can run forward and backward, thus revealing the dynamics and first principles of the underlying dynamic systems without any brute force exploration or simulation.
(C) As predicted, the later in time a perturbation is performed the less disruptive (change of hypothesized generating mechanism length after perturbation) it is compared with the length of the hypothesized generating mechanism of evolution of the original system. Each pair shows the statistical rho and p values between the reconstructed and original space-time evolutions, with some models separating the system into different apparent causal elements.
(D and E) (D) Depicted is the reconstruction of one of the simplest elementary cellular automata (rule 254) and (E) one of the most random-looking ECA, both after 280 steps, illustrating the perturbation-based algorithmic calculus for model generation in two opposite behavioral cases.
(F and G) The accuracy of the reconstruction can be scaled and improved at the cost of greater computational resources by going beyond single row perturbation up to the power set (all subsets). Depicted here are reconstructions of random-looking cellular automata (30 and 73 running for 200 steps) from (F) single- (1R) and (G) double-row-knockout (2R) perturbation analysis. Errors inherited from the decomposition method (see Supplemental Information, BDM) look like “shadows” and are explained (and can be counteracted) by numerical deviations from the boundary conditions in the estimation of BDM (Zenil et al., 2018a, Zenil et al., 2016).
(H) Variations of the magnitude of the found effect are different in systems with different qualitative behavior: the simpler the less different the effects of deleterious perturbations at different times.
Figure 4.

Connecting Algorithmic Complexity and Dynamical Systems
(A) Numerically pushing a complete graph away from randomness by edge deletion produces complete graphs (after 10 and 19 steps, respectively, starting from the complete graph with 10 nodes K10) as theoretically expected.
(B) Pushing a network toward randomness, however, produces ER graphs approaching edge density (d = 0.5) also as theoretically expected.
(C) Pushing a random graph toward simplicity reveals (after 32 and 41 steps) structured subgraphs contained in the original random one thereby revealing structure in randomness by single in silico perturbations.
(D) Distributions (Supplemental Information 6) of the number of attractors for all possible five-node Boolean networks. The small difference is significant because the number of attractors in such small graphs is tightly bounded.
(E) Numerical calculation of the change in the number of attractors in simple directed complete graphs, ER and scale-free networks converted into Boolean networks (Supplemental Information 5 and 6). Scale-free networks, like regular networks, are more resilient in the face of perturbations.
(F) For larger random graphs, the trends are validated, in particular, for negative (red) elements vs positive (blue) elements in comparison to neutral (gray) and control random (yellow).
(G) Also for larger Scale-free (SF) networks, attractor counts are low but interventions/perturbations to negative elements (those that make the graph more random) have the same expected effect namely an increase in attractor count, consistent with the rest of the experiments.
That we can reconstruct the space-time evolution of discrete dynamical systems with high accuracy from an instantaneous non-ordered set of observations (rows) demonstrates that we identify them as causal even among those random-looking systems such as ECA rules 73, 45 and 30, for which correlation values rho (Figure 3) may be lower, although reconstructions are still qualitatively close. By exploiting the result that the later the step in time in a dynamical system such as an elementary cellular automaton the less disruptive the effect of the perturbation with respect to the algorithmic-information of the original system, we were able not only to reconstruct the cellular automata after row-scrambling but we gave each row a time index (Figure 4B). The automatic reconstruction of possible generating mechanisms by quantifying how disruptive a perturbation is to the algorithmic information content of the space-time evolution of a CA allows us to extract the generating mechanism from the order in which perturbations are less to more disruptive in the hypothesized generating mechanism inferred from an instantaneous observation. Apparently simpler rules have simpler hypotheses, with an almost perfect correspondence in row order (Figures 3A and 3B second columns from each pair). The ranking of the observations for some systems may look more random than others, but locally the relationship between single rows is mostly preserved, even among the more random-looking, either in the right or exact reverse order (indicating possible local reversibility).
The rule generating a dynamical system (such as an ECA) that maps st to st+1 can then be derived from the causal deconvolution of blocks, as demonstrated in Riedel and Zenil (2018) and applied in Zenil et al., 2019b, Zenil et al., 2019a. This is accomplished by looking at the smallest valid transformation among all consecutive observations to infer the influence of each event on the outcome where each local state st leads to only a single future st+1, i.e., their “light cones.” This amounts to claiming that the regions are causally disconnected. The only assumption is that the system is deterministic and that we can also infer the system's rule space (e.g., the ECA), and thus the maximum length of the generating rule. But because we can always start by assuming the smallest possible rule-space size, the correct rule length will be the one that first causally disconnects all regions in a manner consistent with observations of the model 's rule. For example, to infer the rule behind ECA rule 254 (observations of the behavior of which we could trivially rank and index, as we have also done for non-trivial cases) we would start from the simplest rule hypothesis that assigns every black cell to either black or white and vice versa. So we have: 1->1 and 0->0, or 1->0 and 0->1. However, neither of these cases is consistent with the observations, so we move on to consider a mapping of two cells to one, e.g., 0,1->1 and 0,0->1 and so on. However, 0,0 maps onto both 0 and 1, thereby failing to causally separate future states from the same past (invalidating the assumption that the system is deterministic/causal in nature). The rule that will first separate regions in a manner that accords with the observations is thus precisely ECA rule 254, that is, the triplets that are all sent to 1 (black cell), except 0,0,0->0. To properly rank observations by correct time index is thus a sufficient condition to make an optimal prediction based on the most likely generating rule/mapping—by the principle of the unnecessary multiplication of assumptions.
Minimal Information Loss Sparsification
Our causal algorithmic calculus defines an optimal parameter-free dimension reduction algorithm, which minimizes information loss while reducing the size of the original (network) object. The Minimal Information Loss Sparsification (or MILS) method is based on removing neutral elements while preserving the information content of a network, and therefore its properties, and it can be used for reduction by minimizing the loss of any informational feature of G that needs to be described and cannot be compressed into some shorter description of G (see Transparent Methods Supplement Section 2 for the pseudocode and evaluation).
We validated MILS using real-world networks. Depicted in Figure 1M(i) and (j) is an example of a scale-free network with 100 nodes and its original information signature (see Supplement Section 1), which after neutral edge removal preserves the information signature (by design) after deleting 30 neutral edges, and also preserves graph theoretic properties such as edge betweenness, clustering coefficient, and node degree distribution after deleting all graph edges, thus being superior to several other common sparsification methods (validated on 20 other gold-standard networks, see also Supplement Section 1). This is because an element that is deleted will lead to a reduction of a network's algorithmic information content, so in the maximization attempt to preserve its algorithmic information content, only the less informative or most redundant properties of a network/system will be removed.
When MILS is applied to a set of well-known networks used before in pioneering studies, we find that not only is the loss of information signatures and thus the non-linear algorithmic information content of the system minimized, but also all the tested and most common graph-theoretic measures are maximally preserved outperforming two of state-of-the-art algorithms: transitive and spectral sparsification (see Figures S5 and S6). For a review and comparison of complexity measures for graphs and networks and how they are mostly unsuitable to characterize complexity properties see Zenil et al. (2018b).
Algorithmic Information Dynamics of Networks
From a mathematical standpoint we have it that for every non-random network, there exists a generative (causal) program of a certain size (represented, e.g., by its degree sequence or any lossless matrix representation). In contrast, if a network has no shorter (lossless) description than itself, then it has no generative causal program and is defined as algorithmically random. This very generative program, and the number of possible halting states that it can be driven into, determines the number of attractors in a dynamical system. In a network with internal dynamics, both topological and kinetic details can be encoded in a full lossless description and can thus be handled by the algorithmic causal calculus introduced here. Observations over time are the result of these two factors, but with no access to the generative program, deconvolution of all the measured elements contributing to the underlying system's dynamics is impossible, and we usually only keep a partial account of the system's dynamic output (see Figure 2A and Supplement Section 2).
This algorithmic calculus enables the identification of a system's causal core and facilitates the assessment of the causal contribution of a system's elements (detailed in Supplement Sections 1 and 2). We evaluated whether this calculus could serve as a guide to reprogramming a system represented by a network corresponding to qualitative shifts in the attractor landscape associated with the system's behavior, even in the absence of access to the dynamical system's equations. In low algorithmic content networks such as complete graphs, all nodes are immune to perturbations up to a logarithmic effect, leaving the basins of attraction and number of attractors the same (as a function of graph size only). Maximally algorithmic graphs (Zenil et al., 2019b) or MAR graphs (Supplement Section 2), however, have no (algorithmic or statistical) structure (by definition) and are thus predicted to have numerous shallow attractors. Moving an Erdős–Rényi (ER) Maximally Algorithmic Random (MAR) network away from randomness will thus have an effect on the number and depth of its attractors, as it moves all the way away from randomness. Conversely, networks removed from randomness (e.g., a simple directed regular graph) have fewer but deeper attractors, but moving them toward randomness will eventually increase the number of attractors and decrease their average depth.
These theoretical inferences are confirmed through simulation of Boolean networks (see Figures 4D–4G and Supplement Section 2). Based on these principles, using, e.g., complete graphs as a model, we could predictively push networks toward and away from randomness (Figures 4A–4C). We also emulated Boolean dynamic networks with different topologies, predicting the nature and change in the number of attractors (Figure S5 and Supplement Section 1) after pushing networks toward or away from algorithmic randomness. Here the number of attractors is based on the simulation of the networks equipped with random (or specific) Boolean functions (AND, OR, XOR, see Supplemental Information) in their nodes and (randomly) directing the edges to be inputs and outputs, that is, a kinetic model is associated to each network and the effect of the said perturbations quantified with respect to both algorithmic randomness and the number of attractors of the network. The results show that not moving or moving toward and away from algorithmic randomness has a significant difference versus control experiments removing random nodes, hubs, and even using state-of-the-art algorithms for sparsification (see Figures S5 and S6), thereby establishing a connection between algorithmic complexity and dynamical systems. Consider that no alternative to perform educated perturbations existed to move a network along its attractor landscape to guide and steer its behavior other than to perform actual simulations or finding “drivers” using control theory making strong assumptions of linearity (Liu and Barabási, 2016).
Application to Biological Networks and Reconstruction of Epigenetic Landscapes
We tested whether this algorithmic causal calculus can provide biological insight and has any explanatory power. First, we applied the calculus to an experimentally validated TF network of E coli (Marbach et al., 2012) (Figure 5A). BDM values did not correlate with degree distribution, compression, or Shannon entropy. The negatively labeled genes (nodes) protect the network from becoming random, and they were therefore found to be the genes that provide specialization to the cellular network, whereas positive nodes (genes) contribute to processes of homeostasis, pinpointing the elements of the network that make it prevail (Figure 5E), since their removal would deprive the network of all its algorithmic content and thus of its most important properties. This is in agreement with the idea that cellular development is an unfolding process in which core functions are algorithmically developed first, then more specialized functions, enabling training-free and parameter-free gene profiling, targeting (see Supplement Section 3 for more details), and reconstruction (Figure 5H).
Figure 5.

The Programmability of Natural Systems
(A) K-medoid clustering of transcription factors by algorithmic-information node perturbation analysis on a validated E. coli network (extended Figures S8–S16) according to GO, KEGG, and EcoCyc. Positive genes were found to be related to homeostasis and negative genes to processes of specialization.
(B–D) Distribution of genes according to their causal information value in the differentiation process from CD4+ to Th17 cells. (B) Early (undifferentiated T naive) (C) in the process of differentiation and (D) differentiated (Th17).
(E) Uneven distribution of genes by information value strengthens the significance of the enrichment analysis.
(F) Heatmap of normalized information values with approximately half the genes (Early) able to move the early network toward or away from randomness. Genes turn positive at the differentiated stage.
(G) Charting the regulatory networks (for different cell types from the CellNet database using their complexity and combined programmability).
(H) A sketch of the suggested epigenetic differentiation landscape reconstructed from the average of the reprogrammability and the algorithmic randomness (BDM) (see Supplemental Information 1) for each cell network.
Then we analyzed a network controlling cell differentiation to assess the informative value of the qualitatively reconstructed attractor/differentiation landscape. Proceeding from an undifferentiated cell state toward a more mature cell state, our calculus predicts fewer but deeper attractors in the differentiated state (Supplement Section 3). In Figures 5B–5D, we follow the process from a naive T cell differentiating into a Th17 cell signature (Yosef et al., 2013). This revealed an information spectrum with significantly different values over time and the (re)programmability (ratio of negative versus positive edges) was significantly higher in the first two time points than in the final terminal time point. Interestingly, the Th17 network signatures suggest information stability at the 48th point where only three nodes (STAT6, TCFEB, and TRIM24) can further move the network toward greater randomness. After a gene enrichment analysis (Figure 5F; Supplement Section 3, Figures S8–S13), genes classified as having the most positive or negative information values comprised many genes known to be involved in T cell differentiation, such as transcription factors from the IRF and STAT families.
Finally, retrieving network data from CellNet (Morris et al., 2014), we reconstructed heights in a corresponding epigenetic Waddington landscape for different cell types conforming to the biological developmental expectation (Figure 5G; Supplement Section 3). A Waddington landscape can be derived from the location in the complexity and programmability quadrants according to the theoretical expectation. According to Figure S3, more differentiated cells tend to be closer to x = 0, whereas non-differentiated ones tend to be farther away because they start from a state of randomness with shallow attractors and are very sensitive to perturbations but can only move in one direction—toward creating functions represented by structures moving away from randomness. This is exactly what we found when calculating and plotting the CellNet networks from 16 cell lines in Homo sapiens. The cells from the CellNet networks were organized into about the same shape as in the theoretical sketch (Figure S3) describing their thermodynamic-like behavior and in agreement with the biological stage expectation placing stem cells in order (hspc and esc) closer to randomness and high in reprogrammability, conforming with the theoretical expectation to have the greatest number of possible shallow attractors, with the network only able to move away from randomness, followed by blood-related cells (bcell and tcell) that are known to be highly programmable and adaptable, followed by the bulk of differentiated cells in the first and second quadrants. The distribution of the (re)programmability of cells as represented by networks from CellNet fits the naturally expected (re)programmability (c.f. Supplement Section 1 and Figures 3G and 3H).
Conclusion
To summarize, the prevailing paradigm in system identification and control (Liu and Barabási, 2016, Noël and Kerschen, 2017) can broadly be described as aiming to understand what the relevant features are in a system to formulate models to fit some properties of interest and then maximize the fitting of the model with respect to these properties. The unbiased identification of features is an NP complete problem unless additional assumptions are made on the nature of the underlying data distribution (Nilsson et al., 2007). Despite advances in computational tools and fitting data techniques, the challenge of finding the relevant properties and how to perform the model maximization or error minimization remains essentially unresolved. Since the causal calculus introduced here is based on fundamental mathematical results in algorithmic information theory, in combination with novel schemes for numerical evaluations, we have advanced a model-free proxy with which to estimate the qualitative shape of the dynamic possibilities of a system and thus make educated assumptions beyond current statistical approaches. Such an approach gives us a handle with which to intervene in and steer a system using these powerful parameter-free algorithms. This may enable modeling and understanding of diseases in particular when the data are insufficient to specify a quantitative kinetic model (Tegnér et al., 2009). Our results bridge concepts across disciplines and connect mature mathematical theories such as computability, algorithmic complexity, and dynamic systems with the challenge of causality in science.
Methods
All methods can be found in the accompanying Transparent Methods supplemental file.
Acknowledgements
We want to thank the reviewers for their valuable input.
Author Contributions
H.Z., N.A.K., and J.T. conceived and designed the methods. H.Z. and N.A.K. are responsible for data acquisition. H.Z., N.A.K., Y.D., F.M. contributed to data analysis. H.Z. and N.A.K. developed the methodology, with key contributions from J.T. H.Z. performed most of the numerical experiments with Y.D. and F.M. also contributing. H.Z., A.S., G.B., and S.E. contributed the literature-based Th17 enrichment analysis. H.Z. and J.T. wrote the article with key contributions from N.A.K. H.Z. was supported by the Swedish Research Council grant no. 2015-05299.
Declaration of Interests
The authors declare no competing interests.
Published: September 27, 2019
Footnotes
The Online Algorithmic Complexity Calculator implements the perturbation analysis method introduced in this paper: http://complexitycalculator.com/ and an online animated video explains some of the basic concepts and motivations to a general audience: https://youtu.be/ufzq2p5tVLI.
Supplemental Information can be found online at https://doi.org/10.1016/j.isci.2019.07.043.
Data and Code Availability
The Online Algorithmic Complexity Calculator implements the perturbation analysis method introduced in this paper: http://complexitycalculator.com/, online and freely accessible libraries with all the code necessary to reproduce the main results is available at: https://github.com/allgebrist/algodyn/tree/master/R for R, and under https://www.algorithmicdynamics.net/software.html for several programming languages, and an online animation specially produced for this paper for the general audience is available at: https://youtu.be/ufzq2p5tVLI.
Supplemental Information
References
- Barabási A.-L., Gulbahce N., Loscalzo J. Network medicine: a network-based approach to human disease. Nat. Rev. Genet. 2011;12:56–68. doi: 10.1038/nrg2918. [DOI] [PMC free article] [PubMed] [Google Scholar]
- Calude C.S., Stay M.A. Most programs stop quickly or never halt. Adv. Appl. Math. 2008;40:295–308. [Google Scholar]
- Chaitin G.J. On the length of programs for computing finite binary sequences. J. ACM. 1966;13:547–569. [Google Scholar]
- Cimini G., Squartini T., Saracco F., Garlaschelli D., Gabrielli A., Caldarelli G. The statistical physics of real-world networks. Nat. Rev. Phys. 2019;1:58–71. [Google Scholar]
- Delahaye J., Zenil H. Numerical evaluation of algorithmic complexity for short strings: a glance into the innermost structure of randomness. Appl. Math. Comput. 2012;219:63–77. [Google Scholar]
- Deng Y., Zenil H., Tegnér J., Kiani N.A. HiDi: an efficient reverse engineering schema for large-scale dynamic regulatory network reconstruction using adaptive differentiation. Bioinformatics. 2017 doi: 10.1093/bioinformatics/btx501. [DOI] [PubMed] [Google Scholar]
- Gács P. On the symmetry of algorithmic information. Soviet Mathematics Doklady. 1974;15:1477–1480. [Google Scholar]
- Hirschfeldt D.R., Downey R.G. Springer; 2010. Algorithmic Randomness and Complexity. [Google Scholar]
- Kiani N.A., Kaderali L. Dynamic probabilistic threshold networks to infer signaling pathways from time-course perturbation data. BMC Bioinformatics. 2014;15:250. doi: 10.1186/1471-2105-15-250. [DOI] [PMC free article] [PubMed] [Google Scholar]
- Kolmogorov A.N. Three approaches to the quantitative definition of information. Problemy Peredachi Informatisii. 1965;1:3–11. [Google Scholar]
- Li M., Vitanyi P.M.B. Third Edition. Springer International Publishing; 2008. An Introduction to Kolmogorov Complexity and Its Applications. [Google Scholar]
- Liu Y.-Y., Barabási A.-L. Control principles of complex systems. Rev. Mod. Phys. 2016;88:035006. [Google Scholar]
- Liu Y.-Y., Slotine J.-J., Barabási A.-L. Controllability of complex networks. Nature. 2011;473:167–173. doi: 10.1038/nature10011. [DOI] [PubMed] [Google Scholar]
- Marbach D., Costello J.C., Küffner R., Vega N.M., Prill R.J., Camacho D.M., Allison K.R., DREAM5 Consortium, Kellis M., Collins J.J. Wisdom of crowds for robust gene network inference. Nat. Methods. 2012;9:796–804. doi: 10.1038/nmeth.2016. [DOI] [PMC free article] [PubMed] [Google Scholar]
- Martin-Löf P. The definition of random sequences. Inf. Control. 1966;9:602–619. [Google Scholar]
- Morris S.A., Cahan P., Li H., Zhao A.M., San Roman A.K., Shivdasani R.A., Collins J.J., Daley G.Q. Dissecting engineered cell types and enhancing cell fate conversion via CellNet. Cell. 2014;158:889–902. doi: 10.1016/j.cell.2014.07.021. [DOI] [PMC free article] [PubMed] [Google Scholar]
- Nies A. oxford univeristy press; 2009. Computability and Randomness. [Google Scholar]
- Nilsson R., Peña J.M., Björkegren J., Tegnér J. Consistent feature selection for pattern recognition in polynomial time. J. Mach. Learn. Res. 2007;8:589–612. [Google Scholar]
- Noël J.P., Kerschen G. Nonlinear system identification in structural dynamics: 10 more years of progress. Mech. Syst. Signal Process. 2017;83:2–35. [Google Scholar]
- Rado T. On non-computable functions. Bell Syst. Tech. J. 1962;41:877–884. [Google Scholar]
- Riedel J., Zenil H. Cross-boundary Behavioural Reprogrammability Reveals Evidence of Pervasive Universality. International Journal of Unconventional Computing. 2018;13:14-15:309–357. [Google Scholar]
- Schnorr C.-P. Springer; 1971. Zufälligkeit und Wahrscheinlichkeit. Eine algorithmische Begründung der Wahrscheinlichkeitstheorie; p. 218. [Google Scholar]
- Soler-Toscano F., Zenil H., Delahaye J.P., Gauvrit N. Calculating Kolmogorov complexity from the output frequency distributions of small turing machines. PLoS One. 2014;9:e96223. doi: 10.1371/journal.pone.0096223. [DOI] [PMC free article] [PubMed] [Google Scholar]
- Solomonoff R.J. A formal theory of inductive inference. Part I. Inf. Control. 1964;7:1–22. [Google Scholar]
- Solomonoff R.J. A formal theory of inductive inference. Part I and II. Inf. Control. 2008;40:295–308. https://linkinghub.elsevier.com/retrieve/pii/S0019995864902232 Accessed: 14 February 2019. [Google Scholar]
- Tegnér J., Zenil H., Kiani N.A., Ball G., Gomez-Cabrero D. A perspective on bridging scales and design of models using low-dimensional manifolds and data-driven model inference. Philos. Trans. A Math. Phys. Eng. Sci. 2016;374 doi: 10.1098/rsta.2016.0144. [DOI] [PMC free article] [PubMed] [Google Scholar]
- Tegnér J.N., Compte A., Auffray C., An G., Cedersund G., Clermont G., Gutkin B., Oltvai Z.N., Stephan K.E., Thomas R. Computational disease modeling - fact or fiction? BMC Syst. Biol. 2009;3:56. doi: 10.1186/1752-0509-3-56. [DOI] [PMC free article] [PubMed] [Google Scholar]
- Tényi Á., Cano I., Marabita F., Kiani N., Kalko S.G., Barreiro E., de Atauri P., Cascante M., Gomez-Cabrero D., Roca J. Network modules uncover mechanisms of skeletal muscle dysfunction in COPD patients. J. Transl. Med. 2018;16:34. doi: 10.1186/s12967-018-1405-y. [DOI] [PMC free article] [PubMed] [Google Scholar]
- Yildirim M.A., Goh K.I., Cusick M.E., Barabási A.L., Vidal M. Drug-target network. Nat. Biotechnol. 2007;25:1119–1126. doi: 10.1038/nbt1338. [DOI] [PubMed] [Google Scholar]
- Yosef N., Shalek A.K., Gaublomme J.T., Jin H., Lee Y., Awasthi A., Wu C., Karwacz K., Xiao S., Jorgolli M. Dynamic regulatory network controlling TH17 cell differentiation. Nature. 2013;496:461–468. doi: 10.1038/nature11981. [DOI] [PMC free article] [PubMed] [Google Scholar]
- Zenil H. Small data matters and correlation versus causation. In: Ott M., Pietsch W., Wernecke J., editors. Computability of the World? Philosophy and Science in the Age of Big Data. Springer International Publishing; 2016. pp. 453–476. [Google Scholar]
- Zenil H., Kiani N.A., Tegnér J. Methods of information theory and algorithmic complexity for network biology. Semin. Cell Dev. Biol. 2016;51:32–43. doi: 10.1016/j.semcdb.2016.01.011. [DOI] [PubMed] [Google Scholar]
- Zenil H., Kiani N.A., Tegnér J. Low algorithmic complexity entropy-deceiving graphs. Phys. Rev. E. 2017;96:12308. doi: 10.1103/PhysRevE.96.012308. [DOI] [PubMed] [Google Scholar]
- Zenil H., Hernández-Orozco S., Kiani N.A., Soler-Toscano F., Rueda-Toicen A. A Decomposition Method for Global Evaluation of Shannon Entropy and Local Estimations of Algorithmic Complexity. Entropy. 2018;20:605. doi: 10.3390/e20080605. [DOI] [PMC free article] [PubMed] [Google Scholar]
- Zenil H., Kiani N.A., Tegnér J. Review of graph and network complexity from an algorithmic information perspective. Entropy. 2018;20:551. doi: 10.3390/e20080551. [DOI] [PMC free article] [PubMed] [Google Scholar]
- Zenil H., Kiani N.A., Zea A.A., Tegnér J. Causal deconvolution by algorithmic generative models. Nat. Mach. Intell. 2019;1:58–66. [Google Scholar]
- Zenil H., Kiani N.A., Tegnér J. Thermodynamics of random and recursive networks as ComputerPrograms and a refinement to the principle of maximum entropy. Entropy. 2019;21:560. doi: 10.3390/e21060560. [DOI] [PMC free article] [PubMed] [Google Scholar]
Associated Data
This section collects any data citations, data availability statements, or supplementary materials included in this article.
Supplementary Materials
Data Availability Statement
The Online Algorithmic Complexity Calculator implements the perturbation analysis method introduced in this paper: http://complexitycalculator.com/, online and freely accessible libraries with all the code necessary to reproduce the main results is available at: https://github.com/allgebrist/algodyn/tree/master/R for R, and under https://www.algorithmicdynamics.net/software.html for several programming languages, and an online animation specially produced for this paper for the general audience is available at: https://youtu.be/ufzq2p5tVLI.