

Abstract
Codon bias has been implicated as one of the major factors contributing to mRNA stability in several model organisms. However, the molecular mechanisms of codon bias on mRNA stability remain unclear in humans. Here, we show that human cells possess a mechanism to modulate RNA stability through a unique codon bias. Bioinformatics analysis showed that codons could be clustered into two distinct groups—codons with G or C at the third base position (GC3) and codons with either A or T at the third base position (AT3): the former stabilizing while the latter destabilizing mRNA. Quantification of codon bias showed that increased GC3‐content entails proportionately higher GC‐content. Through bioinformatics, ribosome profiling, and in vitro analysis, we show that decoupling the effects of codon bias reveals two modes of mRNA regulation, one GC3‐ and one GC‐content dependent. Employing an immunoprecipitation‐based strategy, we identify ILF2 and ILF3 as RNA‐binding proteins that differentially regulate global mRNA abundances based on codon bias. Our results demonstrate that codon bias is a two‐pronged system that governs mRNA abundance.
Keywords: codon bias, codon optimality, GC‐content, mRNA stability, translation efficiency
Subject Categories: RNA Biology
Introduction
Messenger RNA (mRNA) regulation represents an essential part of regulating a myriad of physiological processes in cells, being indicated in the maintenance of cellular homeostasis to immune responses 1, 2, 3. In addition to transcription regulation, post‐transcriptional regulation of mRNA stability is vital to the fine‐tuning of mRNA abundance. To date, several mRNA‐intrinsic properties, often in 5′ or 3′ untranslated regions (UTRs), have been shown to affect mRNA stability 4, 5. Due to the recent advances in technology, the contribution of mRNA stability to gene expression has been suggested 6. However, the regulation of mRNA stability, which is possibly governed by mRNA‐intrinsic features, has not been fully elucidated.
One of the most crucial mRNA‐intrinsic features is codon bias. To scrutinize this bias in usage of redundant codons, several metrics to measure how efficiently codons are decoded by ribosomes (codon optimality) have been proposed. In a classical metric called the codon Adaptation Index (cAI), gene optimality is calculated by comparison between codon usage bias of a target gene and reference genes, which are highly expressed 7, 8. Another index termed the tRNA Adaption Index (tAI) gauges how efficiently tRNA is utilized by the translating ribosome 9, 10. More recently, the normalized translation efficiency (nTE), which takes into consideration not only the availability of tRNA but also demand, was also proposed 11. In addition to these, there are estimators of codon ribosome translation speed 12 as well as calculators of species‐specific tAI 13.
Recently, Presnyak and colleagues showed that mRNA half‐lives are correlated with optimal codon content based on a metric, the codon stabilization coefficient (CSC), which was calculated from the correlations between the codon frequencies in mRNAs and stabilities of mRNAs. Additionally, they showed that the substitutions of codons with their synonymous optimal and non‐optimal counterparts resulted in significant increases and decreases in mRNA stability in yeast 14. This effect was brought by an RNA‐binding protein (RBP) Dhh1p (mammalian ortholog DDX6), which senses ribosome elongation speed 14, 15, 16. In yeast, these differences in ribosome elongation speed in turn are influenced by tRNA availability and demand 11, 17, 18. Taken together, codons can be designated into optimal and non‐optimal categories: the former hypothesized to be decoded efficiently and accurately 19, 20, while the latter slow ribosome elongation, resulting in decreased mRNA stability 14, 15, 16. It is also important to make the distinction that common and rare codons do not necessarily imply optimal and non‐optimal codons.
At present, codon optimality‐mediated decay has been extensively studied and established particularly in Saccharomyces cerevisiae as well as other model organisms such as Schizosaccharomyces pombe, Drosophila melanogaster, Danio rerio, Escherichia coli, Trypanosoma brucei, and Neurospora crassa 21, 22, 23, 24, 25, 26, 27. At present, the molecular mechanisms of this system of codon optimality in humans are under intense scrutiny [28, preprint: 29].
In this study, we show that codon bias‐mediated decay exists in humans. Principal component analysis (PCA) showed that codons could be clustered into two distinct groups: codons with A or T at the third base position (AT3) and codons with either G or C at the third base position (GC3). This clustering was associated with mRNA half‐lives enabling us to determine GC3 and AT3 codons as stabilizing and non‐stabilizing codons, respectively. In this regard, the increased usage of GC3 codons entails an inevitable increase GC‐content. We then developed an algorithm to quantify the codon bias of GC3 codons. With ribosome profiling, we show that codon bias‐derived occupancy scores agreed with ribosome occupancy. Additionally, bioinformatics analysis revealed that frameshifts abrogate this GC3‐AT3 delineation. We then verified our results in vitro using optimized and deoptimized reporter constructs. Here, we propose that GC3 codons and AT3 codons are optimized and deoptimized codons, respectively. Importantly, frameshifted optimized transcripts retain a certain level of stability, suggesting that overall the overall GC‐content of transcripts is an additional determinant of stability. Finally, employing a ribonucleoprotein immunoprecipitation strategy, we identified RNA‐binding proteins, which were bound to transcripts with low or high GC3‐content. We propose that interleukin enhancer‐binding factor 2 (ILF2) mediates mRNA stability of transcripts via codon bias.
Results
Codons in Homo sapiens can be categorized into GC3 and AT3 codons
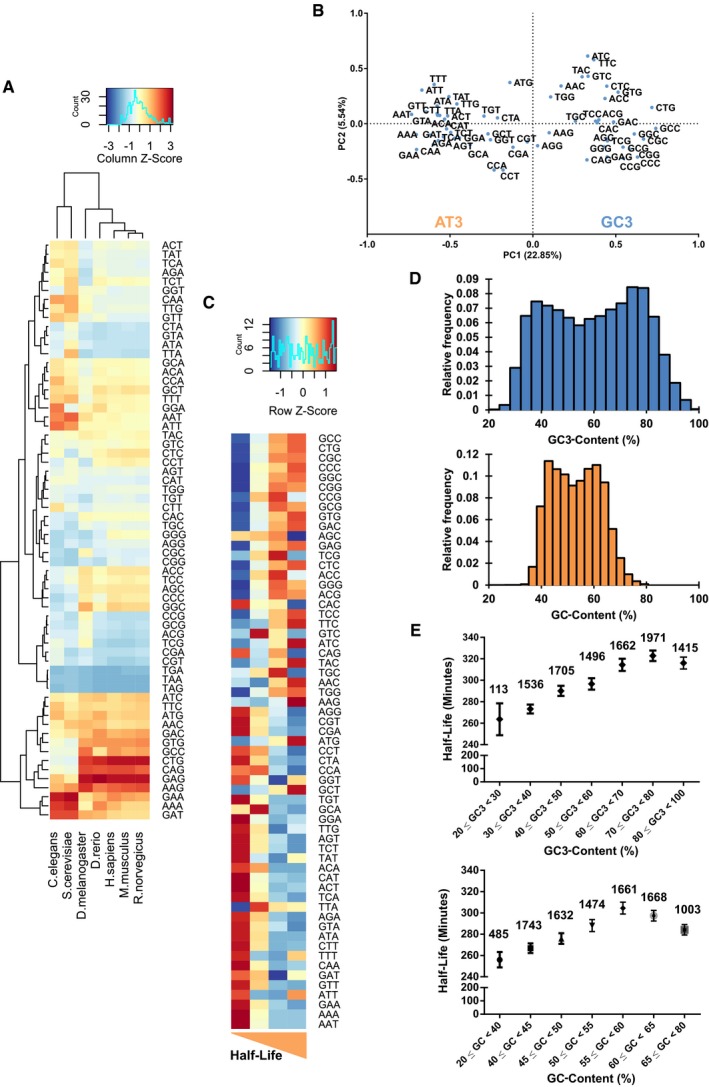
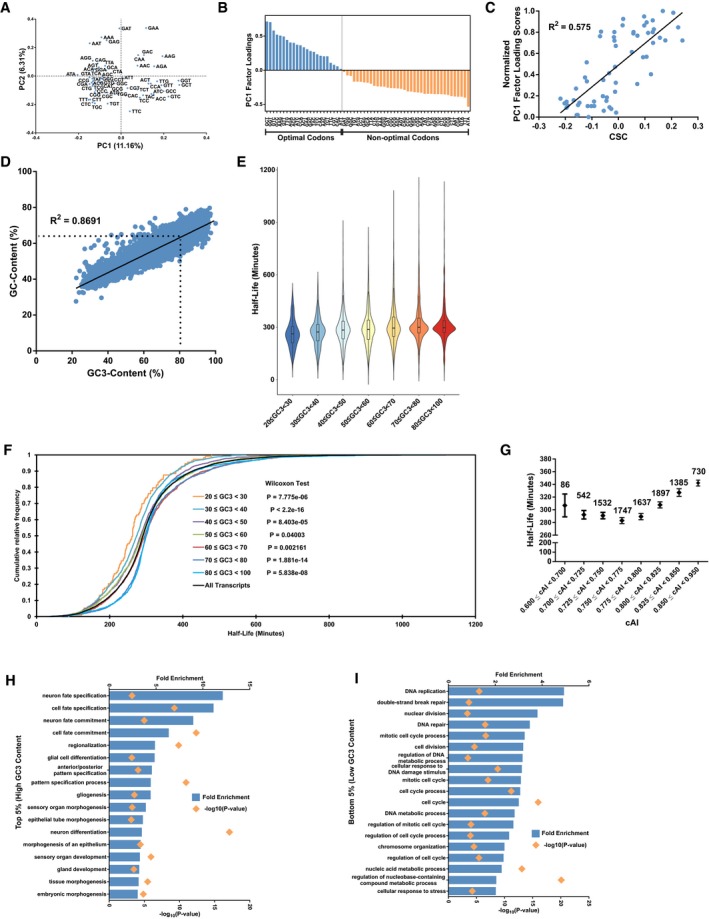
To examine whether a system of codon bias exists in humans, we first compared codon frequencies in Homo sapiens and other model organisms. Hierarchical clustering analysis of codon frequency data obtained from Ensembl database 30 showed a difference between lower eukaryotes such as Saccharomyces cerevisiae and Caenorhabditis elegans, and higher eukaryotes such as Homo sapiens and Mus musculus (Fig 1A). To investigate codon bias in humans, we downloaded human coding sequence (CDS) data from the Ensembl BioMart database and calculated the codon counts for each coding sequence. For each CDS, we calculated the codon frequencies by expressing the codon counts as a fraction of the total number of codons in the CDS. We then performed a principal component analysis (PCA) on the CDS codon frequencies. The first principal component (PC1) of the PCA, which accounted for 22.85% of the total variance, divided codons into two clusters: codons with either G or C at the third base position (GC3) and codons with either A or T at the third base position (AT3) (Fig 1B). Interestingly, the division within the second principal component (PC2) appeared to be split along the number of G/C or A/T bases in codons. We repeated our analysis on the CDS sequences from S. cerevisiae and found no such clustering (Fig EV1A). However, we discovered that the factor loading scores of the codons along the first principal component of our analysis in yeast corresponded to the CSC metric 14, albeit differences in the order (Fig EV1B). The above‐mentioned results therefore raised the possibility that the PCA method might have identified optimal and non‐optimal codons; GC3 and AT3 codons in humans may have a valid effect on mRNA stability. To investigate the agreement between the PCA method and CSC in humans, we calculated the CSC scores in humans using published datasets of global mRNA decay rates in physiologically growing HEK293 cells (GSE69153) [Data ref: 31,32] and compared them to the PC1 factor loading scores of the codons (Fig EV1C). We observed a correlation of R 2 = 0.58 between the two outputs, indicating a moderately strong agreement despite the methodologies being different.
Figure 1. Bioinformatics analysis reveals that biased codons can be categorized into GC3 and AT3 codons, respectively.
-
AHierarchical clustering analysis of model organisms and their average CDS codon frequencies.
-
BPrincipal component analysis of the CDS codon frequencies of 9,666 protein‐coding genes. PC1 and PC2 indicate the first and second principal components.
-
CHeatmap of half‐lives of mRNA and their CDS codon frequencies. The transcripts were ranked according to their half‐lives and divided equally into quartiles. The respective codon frequencies of each group were then averaged.
-
DHistogram illustrating the distribution of genes and their respective GC3‐ and GC‐content.
-
EComparison of average transcript mRNA half‐lives across their respective GC3‐ and GC‐content ranges. Number of transcripts within each gene optimality range is indicated above their respective points.
Figure EV1. Bioinformatics analysis reveals that GC3‐content is a determinant of stability.
-
APrincipal component analysis of the CDS codon frequencies of protein‐coding genes in S. cerevisiae. PC1 and PC2 indicate the first and second principal components.
-
BPC1 factor loadings of codons from the yeast dataset ranked from the highest to the lowest. The optimal and non‐optimal designation at the bottom of the figure refers to the designation according to Presnyak and colleagues 14.
-
CPearson's correlation between PC1 factor loading scores and CSC for individual codons (excluding stop codons).
-
DPearson's correlation between GC‐content and GC3‐content for 9,666 protein‐coding genes.
-
E, FViolin plots (E) and cumulative relative frequency distributions (F) visualizing the distribution of mRNA half‐lives across their respective GC3‐content brackets.
-
GComparison of average transcript mRNA half‐lives across their respective cAI. Number of transcripts within each range is indicated above their respective points.
-
HGene ontology analysis (biological processes) of the top 5% ranked genes in terms of gene GC3‐content.
-
IGene ontology analysis (biological processes) of the bottom 5% ranked genes in terms of gene GC3‐content.
We then tested the link between mRNA stability and GC3‐AT3 codons using the above‐mentioned mRNA stability data (GSE69153) [Data ref: 31,32]. Briefly, we divided the transcripts equally into quartiles based on their half‐lives and averaged the codon frequencies within the quartiles. Strikingly, genes with short half‐lives were associated with AT3 codons, while genes with longer half‐lives were associated with GC3 codons (Fig 1C), suggesting a connection between third base of codons and the stability of mRNAs.
Broadly, the codon bias in mRNA can predict the stability of the mRNA. Classification by GC3‐content might potentially implicate GC‐content as a factor, which might affect the stability of mRNA. By summing the GC3 frequencies and GC bases of CDS sequences, we could determine the GC3‐ and GC‐content of a gene (Dataset EV1). We then visualized the genome‐wide GC3 and GC landscape by plotting the corresponding values via a histogram (Fig 1D). GC3‐content was represented as a bimodal distribution with a range of values from the minimum of 24.1% to the maximum of 100%, while GC‐content appeared similarly as a bimodal distribution with a range of values from a minimum of 27.6% to the maximum of 79.7%. A Pearson correlation analysis (R 2 = 0.869) between gene GC‐content and GC3‐content (Fig EV1D) reflected an enrichment of GC‐content with increased GC3‐content. Indeed, higher GC3‐content was generally associated with better stability (Fig 1E top and Fig EV1E). To further verify the impact of GC3‐content on mRNA stability, we plot the GC3‐content data in Fig 1E (top) in the form of cumulative distribution functions and found these distributions to be significantly different from the genome average (Fig EV1F). As with our analysis with GC3‐content, we grouped the half‐life data by GC‐content (Fig 1E, bottom) and observed a similar increase in half‐lives even with the GC‐content grouping. Interestingly, we also noted a decrease in half‐life beyond a GC‐content of 60%; this decrease also coincides with the decrease in half‐lives in the GC3‐content grouping (Fig EV1D). While we are currently unable to explain the associated decrease in both plots at extreme GC3‐ and GC‐content, it would be interesting to investigate this particular drop‐off in stability in the future.
Additionally, we noted that the codon bias per se was different between yeast and humans (Figs 1B and EV1A) 14. We also observed this difference in Xenopus, zebrafish, and Drosophila, when compared to humans 24, 33. We repeated our analysis, this time grouping the half‐life dataset by their respective cAI (Fig EV1G). With the cAI dataset, we were able to observe increased half‐life with an associated increased in cAI albeit only from the range of 0.75–0.95. In contrast, the PCA‐derived GC3‐content method was better able to recapitulate this increase in half‐life compared to the cAI metric. Taken together, our analysis allowed us to designate GC3 and AT3 codons as stabilizing and destabilizing codons, respectively. Additionally, high GC3‐content in transcripts inevitably results in high GC‐content, which is a feature of stable mRNAs.
We then asked about the biological relevance associated with codon bias. Taking the 5% of lowest and highest ranked genes into account, we observed that genes with high GC3‐content were enriched in developmental processes, while genes with low GC3‐content were enriched in cellular division processes (Fig EV1H and I), suggesting the importance of codon bias‐mediated mRNA decay across dynamic cellular processes in humans.
GC3‐AT3 codon bias can explain ribosome occupancy to a certain extent
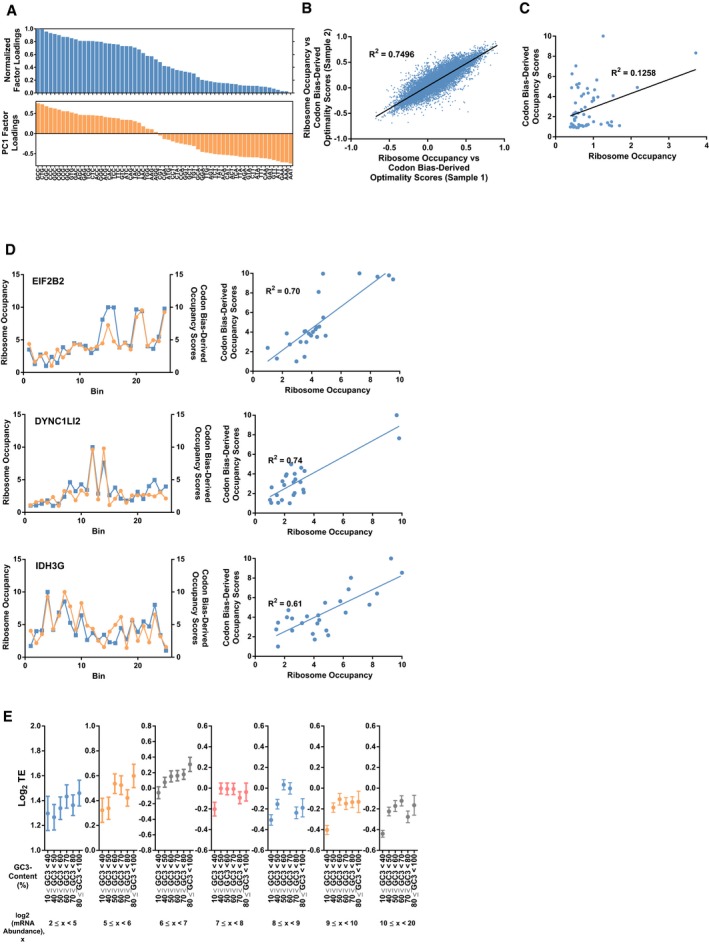
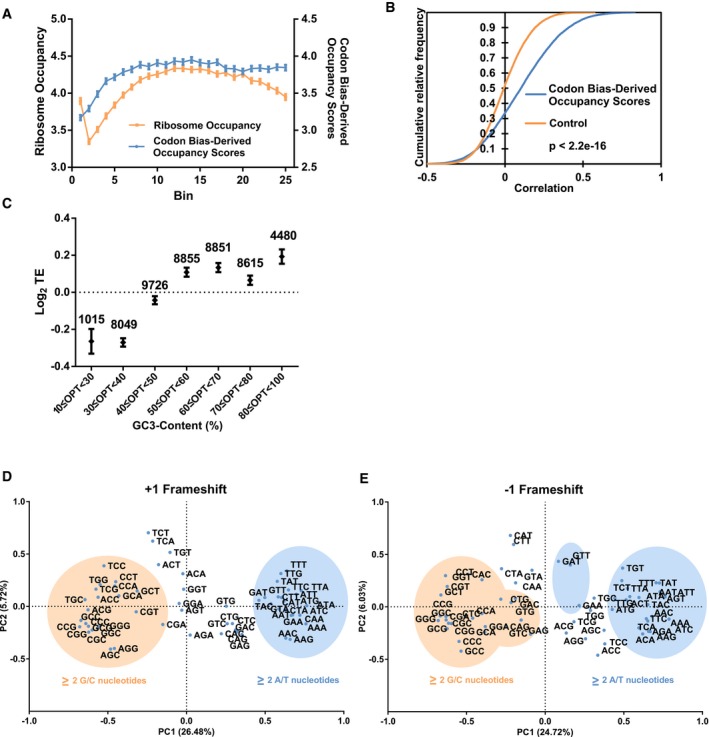
Given that GC3‐AT3 codons were associated with high and low stability, respectively, we wondered whether these two groups were synonymous with optimal and non‐optimal codons. It has been proposed that slower ribosome elongation rate modulated by low codon optimality affects the stability of mRNAs in yeast 14. This led us to examine whether decelerated ribosomes could be observed especially in regions where optimality was low. From the PCA, PC1 factor loadings of the codons were indicative of how much a particular codon contributed to the AT3‐GC3 grouping, i.e., instability–stability (Fig EV2A). Therefore, as a measure of estimating ribosome occupancy, the factor loading scores of the codons from the first principal component were utilized to derive codon bias‐derived occupancy scores (refer to Materials and Methods for details on the calculation of scores). Because we speculated that a single codon would be insufficient in eliciting any noticeable effects on the speed of the ribosome, we divided each CDS into 25 bins from start codon to stop codon and summed up the codon bias‐derived occupancy scores. We then compared these scores with corresponding ribosome occupancies derived from ribosome profiling 34. Ribosome occupancy obtained from HEK293 cells growing under physiological conditions generally coincided with codon bias‐derived occupancy (Fig 2A). These measurements were highly reproducible between replicates of ribosome profiling experiments across the transcriptome (R 2 = 0.750, 16,423 transcripts) (Fig EV2B). We observed a significantly better prediction of ribosome occupancy by codon bias‐derived occupancy scores than that derived from scrambled codon bias‐derived occupancy scores (Fig 2B). Unfortunately, at the individual codon level, we only observed a weak but positive correlation (R 2 = 0.13) between ribosome occupancy and codon bias‐derived scores (Fig EV2C). We believe that this difference in both calculations can be attributed to the binning of the ribosome occupancy data, which ensures that any reasonable slowing of ribosomes in regions of low optimality could be accurately manifested. Indeed, representative transcripts showed a good correlation between our binned codon bias‐derived occupancy scores and ribosome occupancy as exemplified by EIF2B2, DYNC1LI2, and IDH3G transcripts (Fig EV2D).
Figure EV2. GC3‐content can explain ribosome occupancy and translation efficiency to a certain extent.
-
APC1 factor loadings of codons from the human dataset ranked from the highest to the lowest (bottom) and their corresponding normalized factor loadings after linear normalization onto a percentage scale (top).
-
BPearson's correlation between the correlations derived from comparison of ribosome occupancy and codon bias‐derived scores for two ribosome profiling sample replicates.
-
CPearson's correlation between codon bias‐derived occupancy scores and ribosome occupancy for individual codons (excluding stop codons).
-
DThree example transcripts (EIF2B2, DYNC1LI2, and IDH3G) that demonstrate high correlation between ribosome occupancy and codon bias‐derived scores (left) as well as their corresponding Pearson's correlations over 25 bins (right).
-
EComparison of average transcript translation efficiencies (TEs) across their respective GC3‐content ranges after grouping by mRNA abundances. Error bars represent the 95% confidence intervals.
Figure 2. GC3‐AT3 codon bias can explain ribosome occupancy to a certain extent.
-
AAverage ribosome occupancy and their respective codon bias‐derived occupancy scores across the CDS of transcript (in 25 bins). Ribosome occupancy for 16,423 transcripts and their respective codon bias‐derived occupancy were firstly binned into 25 bins, and the mean occupancy was calculated for each bin.
-
BCumulative distribution plots showing the distributions of correlations between ribosome occupancy and codon bias‐derived occupancy. Correlations obtained from the ribosome occupancy and scrambled codon bias‐derived occupancy served as the control. A Kolmogorov–Smirnov test was performed between the codon bias‐derived occupancy and the control group.
-
CComparison of average transcript translation efficiencies (TEs) across their respective GC3‐content ranges. Number of transcripts within each gene optimality range is indicated above their respective points.
-
D, EPrincipal component analysis of CDS codon frequencies of protein‐coding genes derived from a +1 frameshift (D) and a −1 frameshift (E). Shaded ellipses indicate codons which are GC‐rich (orange) and AT‐rich (blue).
Although translation elongation and initiation are distinct steps, previous literature has suggested that optimal codons are also enriched in mRNAs with high translation 35. Ribosome footprint reads normalized by mRNA abundances from RNA‐seq enable the calculation of translation efficiency, which in turn is also generally regarded as the translation initiation rate 36. Therefore, to establish the link between translation status and codon bias, we calculated the translation efficiency (TE)—ribosome footprints normalized by mRNA abundance. Indeed, our results showed that mRNAs with high GC3‐content generally possessed high TE (Fig 2C). This phenomena also coincide with known research in zebrafish and yeast in that optimal genes generally have high TE 33, 37. To exclude the effect of mRNA abundances on TE, we grouped mRNA of similar abundances into separate groups and repeated our analysis (Fig EV2E). Within these groups, we still observed a general increase in TE within each of the groups, albeit a decrease in TE at a GC‐content of 70–80% across all ranges of mRNA abundances (similar to Fig 2C).
To verify whether GC3 and AT3 codons were indeed associated with stability and instability respectively, we performed PCA on +1 and −1 frameshifted CDS sequences genome‐wide and show that the GC3‐AT3 demarcation was abolished (Fig 2D and E). Interestingly, we found that GC‐rich (two or three G/C bases) and AT‐rich (two or three A/T bases) codons contributed strongly to PC1 of the frameshifted data, showing that GC/AT‐content is a natural consequence GC3‐AT3 usage (Figs 1D and EV1D).
Thus far, we show that GC3 and AT3 codons are associated with mRNA stability, ribosome translation speed, and efficiency, thereby suggesting that the former and latter can be designated into optimal and non‐optimal codons, respectively.
Codon bias affects mRNA stability
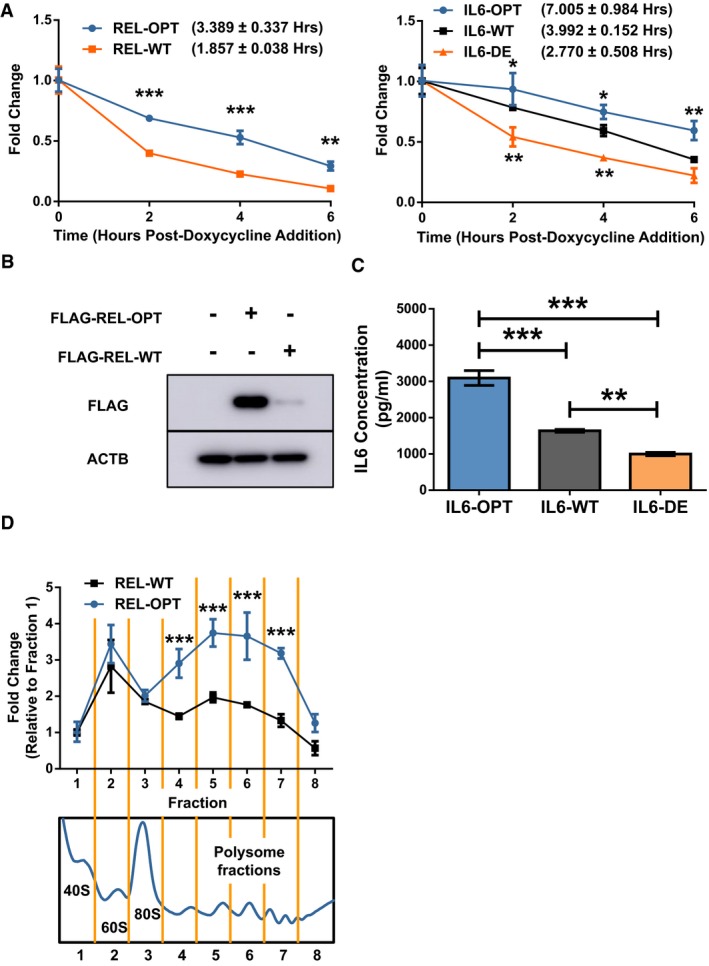
We then experimentally validated our bioinformatics observations of GC3 and AT3 codons in human cells. We developed a scheme based on the PC1 factor loadings in which we previously utilized in our ribosome profiling analysis (Fig EV2A). Based on this scheme, codons could be optimized and deoptimized with regard to GC3‐content within their codon boxes, i.e., synonymous substitutions (Fig EV3A). Single box codons such as TGG (Trp) and ATG (Met) would remain unchanged. We synthesized two independent genes (REL and IL6) with differential GC3‐content (Fig EV3B, Dataset EV2) and examined the stability of these reporter RNAs in HEK293 cells utilizing the Tet‐off system (Fig 3A). As expected, the optimized transcripts of REL and IL6 were more stable than their wild‐type counterparts. Additionally, the decay rate of the deoptimized IL6 reporter was faster, confirming that low GC3‐content transcripts were unstable.
Figure EV3. GC3‐content of transcripts affects translation efficiency and stability.
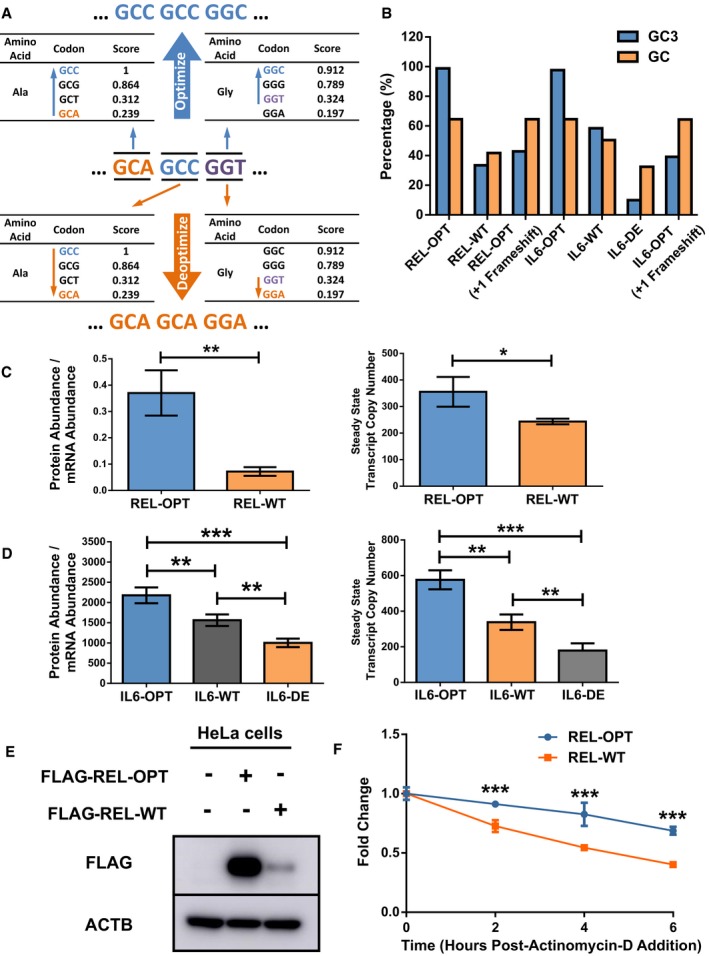
-
AExample of how transcript GC3 optimization and GC3 deoptimization were performed to generate GC3‐optimized and GC3‐deoptimized versions of REL and IL6 transcripts.
-
BGC3‐ and GC‐content of REL‐OPT/WT, REL‐OPT (+1 Frameshift), and IL6‐OPT/WT/DE and IL6‐OPT (+1 Frameshift) transcripts.
-
CProtein abundance of immunoblot of FLAG‐tagged REL‐OPT and REL‐WT in HEK293T cells (normalized by respective mRNA levels) transfected with either empty plasmids, or plasmids bearing REL‐OPT or REL‐WT (corresponding to Fig 3B). The data are representative of threew independent experiments. The respective steady‐state mRNA levels (transcript copy numbers) are shown on the right.
-
DIL6 protein abundance as determined by ELISA of IL6‐OPT, IL6‐WT, and IL6‐DE in HEK293T cells (normalized by respective mRNA levels) transfected with either empty plasmids, or plasmids bearing IL6‐OPT, IL6‐WT, or IL6‐DE (corresponding to Fig 3C). The ELISA quantification is representative of three independent experiments. The respective steady‐state mRNA levels (transcript copy numbers) are shown on the right.
-
ERepresentative immunoblot of FLAG‐tagged REL‐OPT and REL‐WT expressed in HeLa cells (left). The immunoblot is representative of three independent experiments.
-
FmRNA stability experiments showing the degradation of REL‐OPT and REL‐WT transcripts in HeLa cells, post‐actinomycin‐D addition.
Figure 3. GC3‐content of transcripts determines their fate.
-
AHEK293 Tet‐off experiments showing the degradation of REL‐OPT and REL‐WT transcripts (left) and IL6‐OPT, IL6‐WT, and IL6‐DE transcripts (right), post‐doxycycline addition.
-
BRepresentative immunoblot of FLAG‐tagged REL‐OPT and REL‐WT in HEK293T cells transfected with either empty plasmids, or plasmids bearing REL‐OPT or REL‐WT. The immunoblot is representative of three independent experiments. ACTB is shown as the loading controls.
-
CELISA of secreted IL6 concentrations of IL6‐OPT, IL6‐WT, and IL6‐DE from HEK293T cells transfected with plasmids bearing IL6‐OPT, IL6‐WT, and IL6‐DE.
-
DFold changes of REL‐OPT and REL‐WT transcript levels (top) relative to their abundances from fraction 1 as detected by qPCR across polysome fractions (below). Data represent the mean ± SD for three biological replicates.
In addition to the RNA stability, higher GC3‐content was also associated with higher translation efficiency (Fig 2C), thereby increasing protein production. Indeed, the protein abundance of the optimized REL reporter was higher than REL‐WT even after normalization of protein abundance by steady‐state mRNA levels (Figs 3B and EV3C). Using enzyme‐linked immunosorbent assay (ELISA), we observed that expression of IL6‐OPT resulted in a 1.5‐fold and twofold significantly higher level of IL6 compared to its WT and IL6‐DE, respectively (Fig 3C). In a similar fashion, normalization of IL6 protein abundance by mRNA levels revealed that translation efficiency of the optimized IL6 reporter was higher than its WT and deoptimized reporter counterparts (Fig EV3D). We tested our REL reporters in HeLa cells and show that the high protein abundance of REL‐OPT could also be observed (Fig EV3E). Similarly, actinomycin‐based stability measurements of the REL reporters in HeLa cells revealed a similar increase in mRNA stability in the REL‐OPT transcript (Fig EV3F). Moreover, polysome fractionation and subsequent qPCR analysis revealed that within the polysome fractions, REL‐OPT transcript amounts were proportionately higher than REL‐WT transcripts, suggesting that REL‐OPT was translated more efficiently than REL‐WT (Fig 3D). Thus far, our results validate the bioinformatics analyses and show that GC3 and AT3 codons can be designated as optimal and non‐optimal codons.
GC‐content as an additional determinant of stability
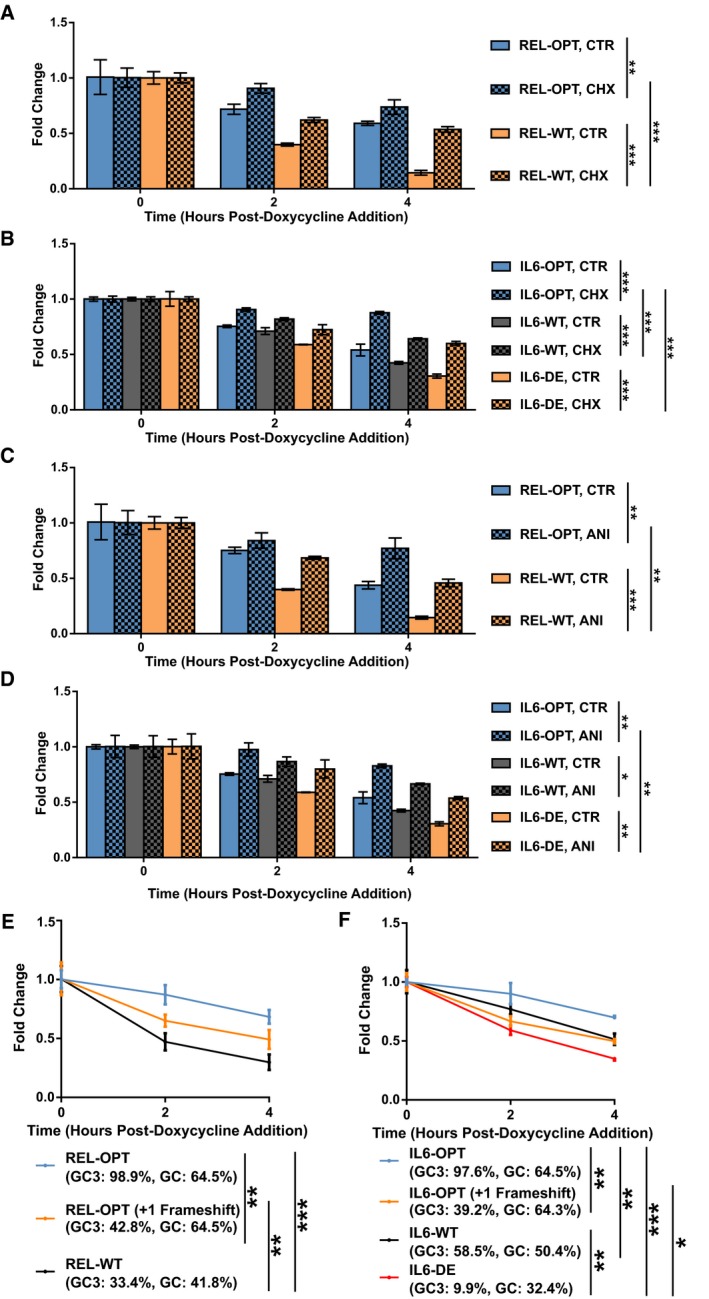
We then hypothesized that if the effect on mRNA stability was entirely the result of translational elongation, blocking translational elongation would restore stability to transcripts possessing low optimality to levels similar to that of their high optimality counterparts. We therefore treated cells expressing the REL reporters with a translation inhibitor, cycloheximide (CHX), and assayed the mRNA decay rates via the Tet‐off system (Fig 4A). Treatment with CHX improved the stability of both REL‐OPT and REL‐WT transcripts compared to the control group. Interestingly, the stability of CHX‐treated REL‐WT transcripts was still significantly lower than that of CHX‐treated REL‐OPT transcripts. We repeated our experiments using the IL6 reporters and found that in a similar fashion, CHX‐treated IL6‐DE transcripts were stabilized, albeit, not to the same extent as CHX‐treated IL6‐OPT (Fig 4B). Following this, we repeated our experiments using a different translation inhibitor, anisomycin (ANI), and obtained similar results (Fig 4C and D), suggesting that a translation‐independent mRNA degradation pathway could also be present. It should be noted that an important caveat to the use of global translation inhibitors, CHX in particular, is that they have been reported to potentially distort mRNA level measurements as well as translation efficiency 38, 39, 40.
Figure 4. GC‐content as an additional determinant of stability.
-
A, BHEK293 Tet‐off experiments showing the degradation of REL‐OPT and REL‐WT transcripts (A) and IL6‐OPT, IL6‐WT, and IL6‐DE transcripts (B), under vehicle (DMSO) and cycloheximide (CHX) treatment, post‐doxycycline addition.
-
C, DHEK293 Tet‐off experiments showing the degradation of REL‐OPT and REL‐WT transcripts (C) and IL6‐OPT, IL6‐WT, and IL6‐DE transcripts (D), under vehicle (PBS) and anisomycin (ANI) treatment, post‐doxycycline addition.
-
E, FHEK293 Tet‐off experiments showing the degradation of REL‐OPT, REL‐OPT (+1 Frameshift), and REL‐WT transcripts (E) and IL6‐OPT, IL6‐WT, IL6‐DE, and IL6‐OPT (+1 Frameshift) transcripts (F), post‐doxycycline addition.
We then synthesized a +1 frameshifted version of the REL‐OPT transcript, removing any potential stop codons, which would have resulted in premature termination of transcription, and measured its stability via the Tet‐off system (Fig 4E). This frameshifted version, while retaining a high GC‐content (similar to REL‐OPT), possessed a lower GC3‐content than its in‐frame counterpart (Fig EV3B). Surprisingly, the frameshifted version was still more stable than the WT form, yet less stable compared to its in‐frame optimized counterpart, suggesting that high GC/low AU‐content was able to retain a significant amount of transcript stability. To verify our findings, we similarly synthesized a +1 frameshifted version of the IL6‐OPT transcript, which had a high GC‐content (similar to IL6‐OPT) but a GC3‐content of 39.15%, the GC3‐content falling between its WT and DE counterparts (Fig EV3B). This frameshifted version of IL6 was relatively more stable compared to the DE transcript (Fig 4F). Taken together, our results reinforce the notion that in addition to GC3‐content, GC‐content could be an additional determinant of stability. Taken together, our results show that codon bias encompasses two modes of mRNA regulation, GC3‐ and GC‐content dependent.
RNA‐binding proteins differentially bind to transcripts of varying degrees of codon bias
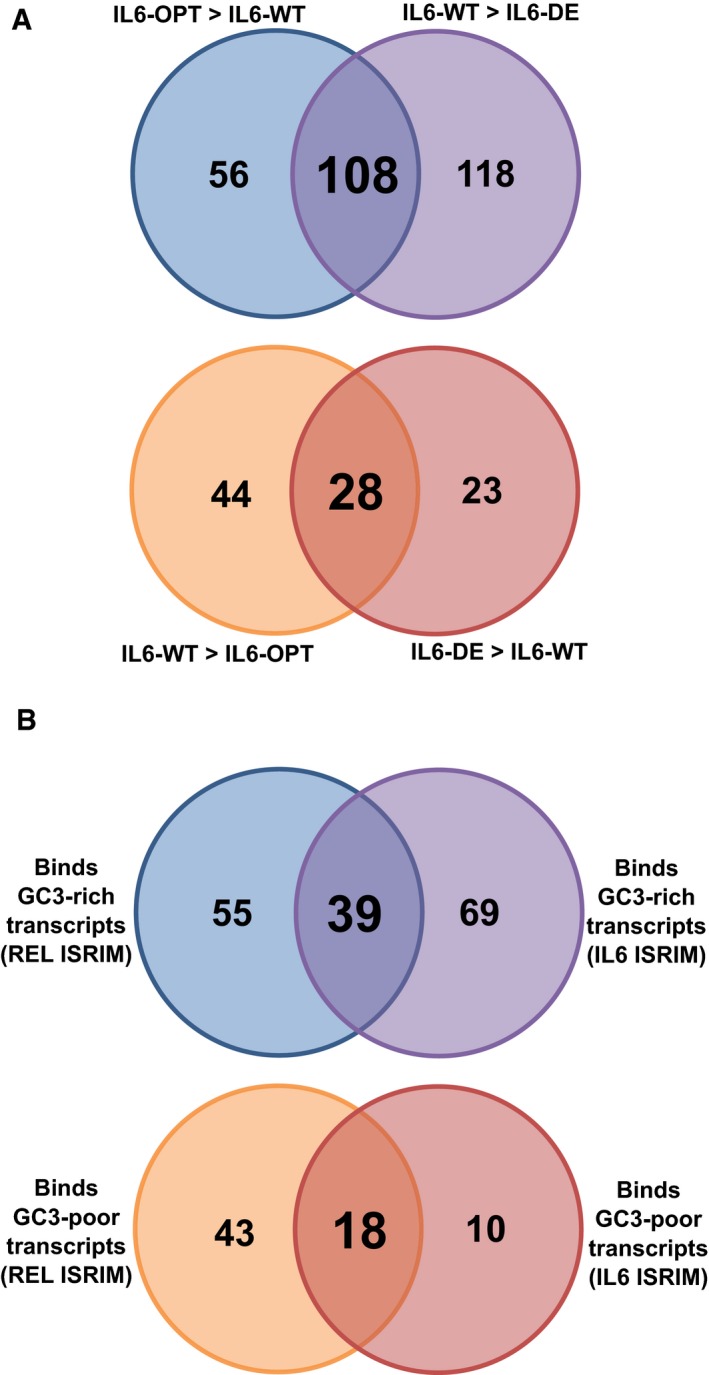
Having shown that high optimality content inevitably accords high GC‐content that in turn promotes mRNA stability, we wondered whether there were RNA‐binding proteins (RBPs), which scrutinize, discriminate, or even affect an mRNA's fate. To identify RBPs that were either bound to transcripts bearing high or low optimality, we performed a ribonucleoprotein immunoprecipitation‐based approach termed ISRIM (In vitro Specificity‐based RNA Regulatory protein Identification Method) 41. Lysates of HEK293 cells were mixed with FLAG peptide‐conjugated REL and IL6 transcripts of high and low optimality, and their interacting proteins were determined using mass spectrometry. We then calculated the fold changes based on the abundance of RBPs bound to REL‐WT with respect to REL‐OPT (Fig 5A).
Figure 5. RNA‐binding proteins bind differentially to transcripts with different levels of GC3‐content.
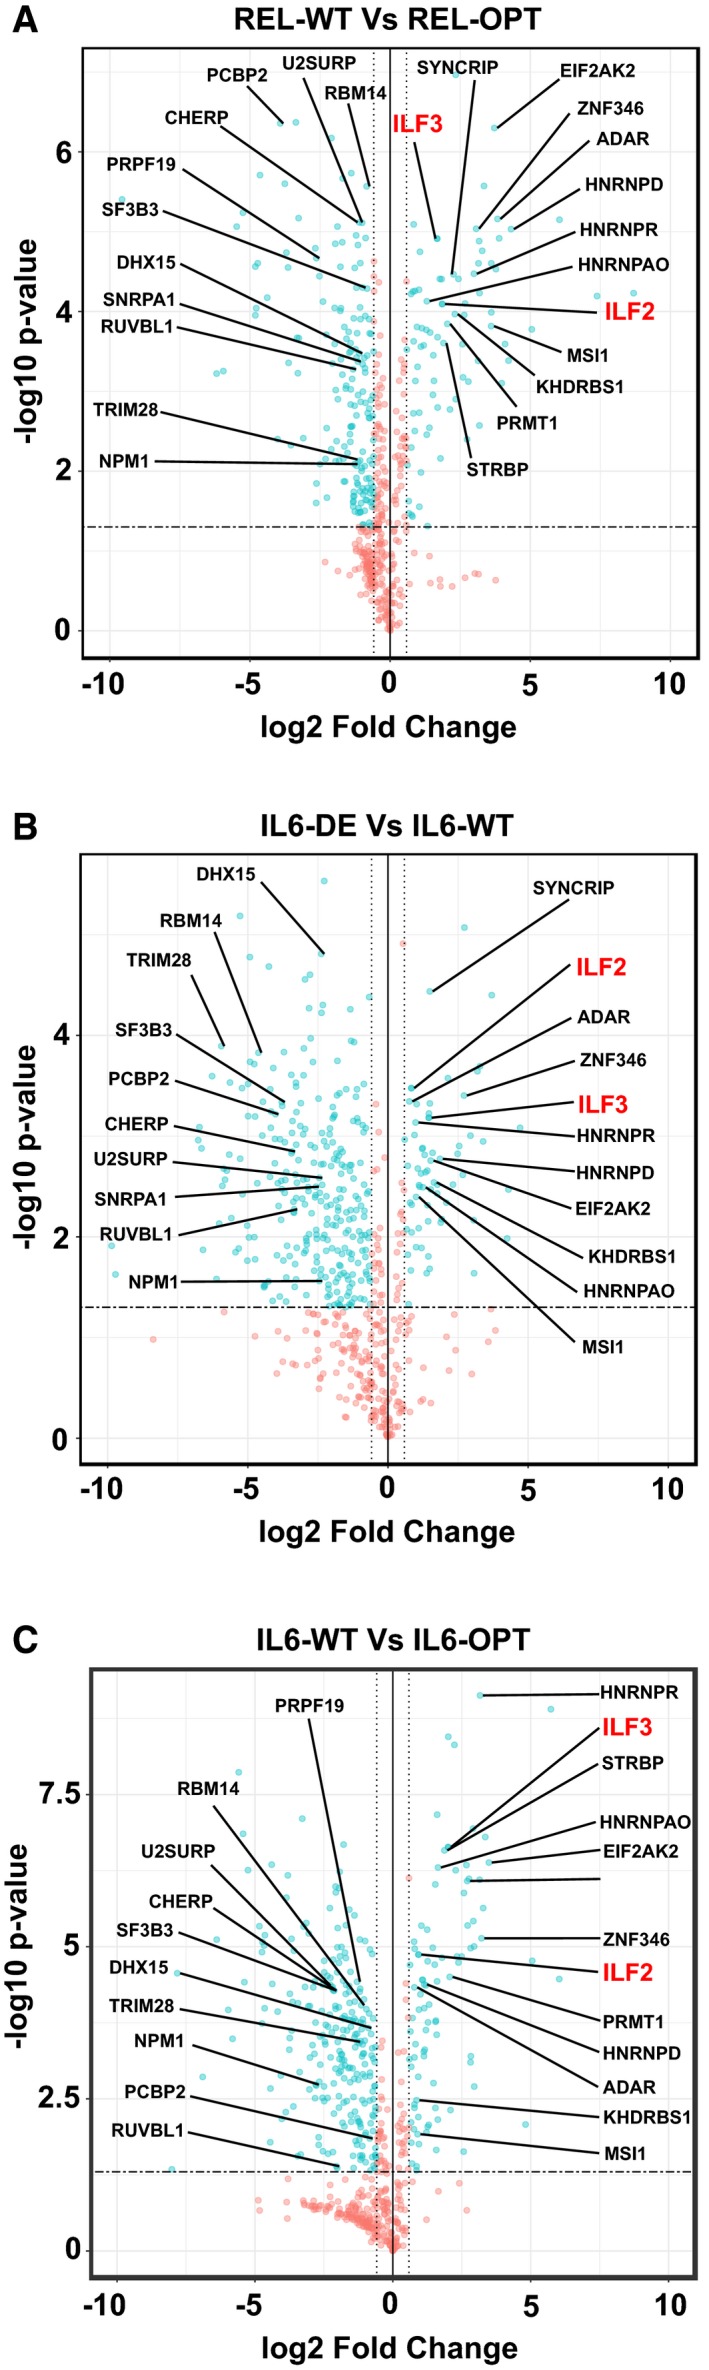
-
A–CVolcano plots showing the enrichment of RBPs, which bind to REL‐WT relative to REL‐OPT transcripts (A), IL6‐DE relative to IL6‐WT transcripts (B), and IL6‐WT relative to IL6‐OPT transcripts (C).
As IL6 transcripts possessed three levels of GC3‐content (OPT, WT, and DE), we defined high GC3‐content binding RBPs based on the RBP enrichment of IL6‐DE to IL6‐WT (Fig 5B) as well as IL6‐WT compared to IL6‐OPT (Fig 5C). Similarly, we defined low GC3‐content binding RBPs based on the RBP enrichment of IL6‐DE compared to IL6‐WT (Fig 5B) as well as IL6‐WT to IL6‐OPT (Fig 5C). By selecting common RBPs belonging to each group, we defined a set of RBPs, which bound differentially to high GC3 and low GC3 IL6 transcripts, respectively (Fig EV4A). We then selected RBP candidates, which were specifically enriched with either low or high GC3 transcripts common to both REL and IL6 ISRIM experiments (Fig EV4B, Dataset EV3). In all, we show that RBPs can differentiate between transcripts of high GC3‐ and low GC3‐content.
Figure EV4. RNA‐binding proteins can be identified from ISRIM experiments.
-
AVenn diagram indicating the number of RBPs identified from the IL6 ISRIM experiments.
-
BVenn diagram indicating the number of RBPs identified from the REL and IL6 ISRIM experiments.
ILF2 regulates the stability of low GC3/high AT3 transcripts
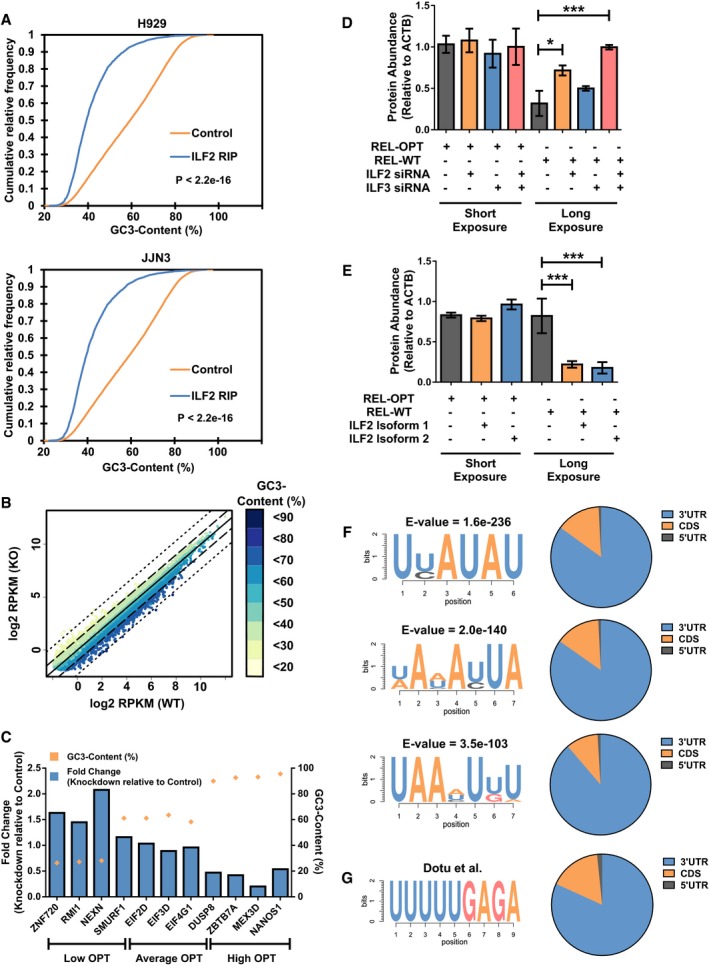
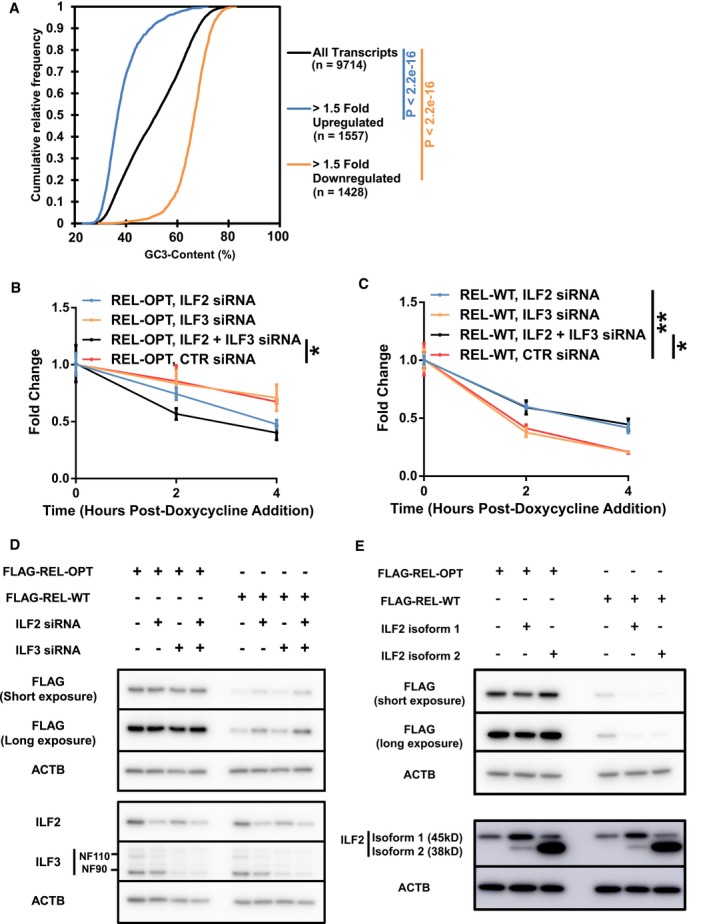
We investigated the role of RBPs in modulating the stability of transcripts with different codon bias. Of interest were ILF2 and ILF3, RPBs identified from the list of RBPs interacting exclusively with low optimality transcripts. ILF2 and ILF3, also known as NF45 and NF90/NF110, respectively, are well known to function dominantly as heterodimers, which bind double‐stranded RNA. ILF3 has been extensively studied, having shown to bind to AU‐rich sequences in 3′ UTR of target RNA to repress its translation 42. We hypothesize that the binding of ILF2 and ILF3 as a heterodimer to their targets occurs as low optimality transcripts are inadvertently AU‐rich. Here, we focused on the effects of these RBPs on low optimality transcripts. Firstly, using published RIP‐seq data of ILF2 in two multiple myeloma cell lines, H929 and JJN3, we observed that ILF2 interacts with low optimality transcripts (Fig EV5A) [Data ref: 43,44]. Additionally, we analyzed RNA‐seq data obtained from the ENCODE project of K562 cells treated by CRISPR interference targeting ILF2 [Data ref: 45]. Strikingly, we observed that transcripts that possessed low optimality scores were upregulated, whereas transcripts that possessed high optimality scores were downregulated (Figs 6A and EV5B). The abundance changes in representative mRNAs by ILF2 knockdown were antiparallel to their GC3‐content (Fig EV5C).
Figure EV5. ILF2 is an RNA‐binding protein that can bind differentially to transcripts with different levels of GC3‐content.
-
ACumulative distribution plots showing the GC3‐content distribution of transcripts bound to by ILF2 in H929 (top) and JJN3 cells (bottom). Wilcoxon signed rank tests were performed on the ILF2 RIP group against the control group. P‐values are denoted in the figure.
-
BScatterplot of the RPKM values of mRNA transcripts in K562 cells subject to ILF2 CRISPR interference and its corresponding WT control. mRNA transcripts are colored according to their respective GC3‐content.
-
CFold changes of example mRNA representing low, average, and high GC3‐content transcripts from the RPKM values of mRNA transcripts in K562 cells subject to ILF2 CRISPR interference.
-
DDensitometric analysis of immunoblot of FLAG‐tagged REL‐OPT and REL‐WT expressed in HEK293T cells under ILF2 and ILF3 siRNA treatment (corresponding to Fig 6D).
-
EDensitometric analysis of immunoblot of FLAG‐tagged REL‐OPT and REL‐WT expressed in HEK293T cells co‐expressed with two different isoforms of ILF2 (corresponding to Fig 6E).
-
F, GTop three RNA motifs enriched in upregulated transcripts (> 5 fold) in ILF2 RIP‐seq data (A) derived from both H929 and JJN3 datasets (left) and their corresponding annotations in transcripts (right) (F), followed by the ILF3 motif and its distribution identified by Dotu et al 47 from ILF3 RNA Bind‐n‐seq experiments (G).
Figure 6. ILF2 regulates the stability of low GC3/high AT3 transcripts.
-
ACumulative distribution plots showing the difference in distribution of transcript optimality between upregulated and downregulated transcripts in K562 cells subject to ILF2 CRISPR interference targeting ILF2. Transcript quantities are indicated in the figure legend.
-
B, CHEK293 Tet‐off experiments showing the degradation of REL‐OPT (B) and REL‐WT (C) transcripts with ILF2 and ILF3 siRNA and control (CTR) siRNA treatment, post‐doxycycline addition.
-
DRepresentative immunoblot of FLAG‐tagged REL‐OPT and REL‐WT expressed in HEK293T cells under ILF2 and ILF3 siRNA treatment. The immunoblot is representative of three independent experiments. ACTB is shown as loading controls.
-
ERepresentative immunoblot of FLAG‐tagged REL‐OPT and REL‐WT in HEK293T cells co‐expressed with two different isoforms of ILF2. The immunoblot is representative of three independent experiments. ACTB is shown as loading controls.
However, differences in mRNA levels do not necessarily imply a difference in mRNA stability. To confirm whether mRNA stability was indeed affected, we examined the stability of FLAG‐tagged versions of REL‐OPT and REL‐WT in the Tet‐off system after ILF2 and ILF3 knockdown via siRNA (Fig 6B and C). Interestingly, we observed that the optimized reporter was more unstable under the knockdown of both ILF2 and ILF3, whereas the WT reporter was more stable with the knockdown of ILF2 and a combination of both ILF2 and ILF3 knockdown. In agreement with this, we found a significant increase in protein levels of REL‐WT when cells were treated with ILF2‐ and ILF3‐targeting siRNA (Figs 6D and EV5D). However, despite seeing a decrease in stability of the GC3‐optimized reporter under both ILF2 and ILF3 knockdown, we were unable to observe this change at the protein level. Focusing our attention on ILF2, we expressed FLAG‐tagged versions of REL‐OPT and REL‐WT, along with the two isoforms of ILF2, and detected the reporter protein levels via Western blot. A significant decrease in band intensity was observed for the REL‐WT bands when both isoforms of ILF2 were expressed, whereas the amount of REL‐OPT was not changed (Figs 6E and EV5E). Taken together, our results suggest that ILF2 and ILF3 affect mRNA transcripts with low GC3‐content (and inadvertently low GC‐content) to induce their decay.
Next, we sought to identify possible motifs, which are enriched in ILF2/3 targets. Based on the RIP‐seq data in JJN3 and H929 [Data ref: 43,44], we identified common transcripts, which were more than fivefold differentially upregulated, and subjected their cDNA sequences to de novo motif identification via the MEME (Multiple EM for Motif Elicitation) software 46. Our analysis identified AU‐rich motifs of about 6–7 nt long (Fig EV5F) as well as their distributions mainly in the CDS and 3′UTR along target transcripts. It should be noted that that these motifs are enriched in mRNA targets and may not necessarily imply bona fide binding motifs of ILF2/3. Therefore, we performed an additional motif search on a recently identified and experimentally validated ILF3 motif from RNA Bind‐n‐seq experiments by Dotu and colleagues 47 and found a similar distribution of motifs in the CDS and 3′UTR of targets (Fig EV5F).
Discussion
This study provides a framework describing codon bias‐mediated RNA decay in humans. We first show that GC3 codons are associated with stability and AT3 codons with instability. We quantified codon bias by calculating the GC3‐content within the CDS of genes and showed that GC3‐content is strongly correlated with RNA stability and amount of protein expressed. In general, the use of optimal GC3 codons correlated with higher GC‐content at a genome‐wide level. We then show a modest agreement between codon bias‐derived scores and ribosome occupancy as determined by ribosome profiling. Using GC3‐optimized and GC3‐deoptimized reporters, we validate our bioinformatics observations in vitro. Screening of RNA‐binding proteins and further in vitro analysis suggests a role of ILF2, possibly in complex with ILF3, in the codon‐mediated regulation of mRNA. Taken together, we conclude that gene expression can be shaped by codon bias and inevitably by GC/AU‐content through the modulation of mRNA stability in human cells.
Investigating the system of codon bias in humans
Since translation elongation is affected by tRNA availability, the tRNA Adaptation Index (tAI), which is based on genomic tRNA copy number, has been used as a surrogate for codon optimality. However, in contrast to yeast, tRNA copy number in the genome is not always correlated with tRNA abundance in higher eukaryotes 48. Hence, this metric is less suitable for quantifying codon optimality in humans. Independent of tRNA‐based metrics, we addressed these challenges by utilizing an unsupervised learning algorithm, PCA, to identify features in that were mRNA‐intrinsic. In the PCA of both yeast and humans, we demonstrated that the first principal component mirrored optimal/non‐optimal assignments. We also show that the codon bias is different between these two organisms (Figs 1B and EV1A). In humans, the classification of codons into AT3 and GC3 groups was striking, but the percentage by which it accounts for its variation, however, was modest.
From the PCA, the first and second principal components only explain a quarter of total variance in codon frequencies (Fig 1B), implying that other factors that explain bias of codon frequency possibly remain in human cells. The limitation of this method is reflected in the use of codon frequencies as our input data for the PCA. This approach might have neglected other factors of stability or instability, which might be codon‐independent or which might be inherent at the nucleotide level. Assuming that evolution drives the selection of codons, synonymous codon usage in different organisms must be fine‐tuned over time to achieve precise expression levels of mRNA and eventually proteins in essential physiological process. Indeed, similar to our findings, a study by Bazzini et al 33 showed that a system of codon optimality is conserved among vertebrates, Xenopus and Zebrafish. In addition, they demonstrated that in Zebrafish embryos, low codon optimality was associated with shorter poly(A) tail length in addition to lower levels of translation. Our data together with recently published work by Wu and colleagues 28 indicate that a system of codon optimality exists in humans.
Our investigations show that high GC3/AT3‐content or GC/AT‐content in mRNA is selected for to modulate transcript stability in essential physiological processes, but is subject to constraints by amino sequence. Indeed, we show that transcripts with high and low GC3‐content were linked to particular physiological and cellular processes (Fig EV1H and I). In a particular study, Gingold and colleagues argue that tRNA abundances vary in proliferating and differentiating cell types 49. Interestingly, they showed that codons preferred by cell cycling genes were AT3 codons, while pattern specification preferred codons tended to be GC3 codons—in agreement with our GO analyses. In Drosophila, the correlation between codon optimality and mRNA stability has been demonstrated to be attenuated in neural development, possibly allowing the effect of trans‐acting factors to dominate development 24.
Our results show that the codon bias we have identified affects ribosome occupancy to a significant but limited extent (Fig 2B). At the level of individual codon occupancies, we only observed a weak but positive correlation (R 2 = 0.13) between ribosome occupancy and codon optimality‐derived scores (Fig EV2C). These results, however, are not surprising given that studies based on ribosome profiling data found no correlations between ribosome occupancy and rare codons 50, 51. In view of this, we binned the CDS into 25 evenly spaced groups to ensure that any reasonable slowing of ribosomes in regions of low optimality could be accurately represented by the GC3‐AT3 bias. However, we acknowledge that our metric is only able to demonstrate a prediction to a limited extent. There are many factors that can affect ribosome profiling results such as growth conditions, coverage, cloning and sequencing biases, methods of bioinformatics analysis, and experimental noise 18, 52, 53.
Taking into account our in vitro experiment results together with the ribosomal profiling results, we suggest that GC3 and AT3 codons are synonymous with optimal and non‐optimal codons. Additionally, our study along with others’ suggests that slower elongation of ribosome is a key feature of mRNA stability. However, it should be noted that in our analysis methodology, the assumption that stability is solely a function of ribosome speed might only hold true to a limited extent. There is evidence to show that mRNA‐intrinsic features that have the propensity to regulate ribosome velocity are essential in maintaining the function and correct expression of proteins, the failure of which may result in degradation of the mRNA and protein: Although codon optimality is a dominant factor in general, other factors may also be involved in decelerated ribosomes, such as secondary structures 54, 55. These obstacles for ribosome elongation are reversible and dynamically regulated by RNA helicases 56, 57. Importantly, these structures may serve to reduce ribosome speed when the nascent peptide requires additional time to fold to its correct conformation 58. Furthermore, it has been shown in Neurospora that codon usage can regulate co‐translational protein folding and, subsequently, its function 59.
As such, while we have shown that the optimizations of transcripts lead to increases in protein production, further studies are required to investigate protein folding dynamics and determine whether the produced protein still retains its functionality. Furthermore, in a study of two model organisms, E. coli and S. cerevisiae by Tuller et al 60, the rate of translation elongation was shown to be determined by the folding energy, codon bias, and amino acid charge at the beginning of the CDS. It is likely that these factors may also affect the local speed of the ribosome further down the CDS and, by extension, the stability of the mRNA. Further studies will be required to elucidate the role of RNA secondary structures and helicases and their relevance to codon bias, protein folding, and mRNA stability decay.
In attempts to quantify the effect of ribosomal density on mRNA stability, several studies have demonstrated that in general, increased ribosomal density results in increased mRNA stability of a transcript 61, 62. This phenomenon has been attributed to competition between the initiation complex and decay factors as well as ribosomes sterically excluding decay factors from accessing the mRNA 63, 64. To this effect, reduction in translation initiation has been shown to decrease ribosomal density and, subsequently, mRNA stability 65. On the other hand, inhibiting translation elongation causes an increase in ribosome density and, consequently, mRNA stability 66. Here, we show that optimized transcripts are highly polysome‐bound as opposed to their WT counterparts suggesting increased rates of translation initiation (Fig 3D). This is corroborated by our ribosome profiling findings that high GC3‐containing transcripts have higher TE (Fig 2C), possibly protecting transcripts from decay factors.
In this regard, transcripts with high optimality have higher translation initiation rates, causing them to be highly polysome‐bound. Additionally, optimized codons allow for efficient decoding and, thus, smoother ribosome traffic. On the other hand, transcripts with low optimality tend to be less polysome‐bound with frequent ribosome deceleration and/or stalling. Our ribosome profiling analyses in Fig 2B, however, is tailored to comparing the relative ribosome densities (in bins) within an individual transcript, against the codon bias optimality scores. While we show relative accumulation of ribosomes in low optimality regions locally within a transcript, this particular analysis can neither be extended to comparing total ribosome densities across the transcriptome nor compared to the polysome profiling results.
Interestingly, in a separate study in Neurospora, gene expression modulated by codon usage was shown to be due to the effects of transcription rather than translation 67. In a follow‐up study, the group also demonstrated C/G bias is able to promote gene expression by suppressing premature transcription termination 68. In addition, several other studies have demonstrated that in mammalian cells, GC‐rich genes are transcribed with increased efficiency, resulting in higher levels of transcripts independent of mRNA degradation 69, 70. Next, a study by Fu et al, which investigated the effects of codon usage bias on two proto‐oncogenes with similar amino acid identity, but differing levels of optimality, KRAS and HRAS, showed that codon usage can affect both transcription efficiency and translation efficiency, suggesting that the effect of codon bias is multilevel 71. In this and another study, changing the rare codons of KRAS to common ones increased its enrichment in the polysome fractions 72. Likewise, REL‐OPT transcripts were enriched in the polysome fractions compared to REL‐WT transcripts. Nevertheless, our investigations also show that steady‐state transcript copy number of the optimized reporter transcripts was significantly higher than that of the WT (and DE versions) (Fig EV3C and D). In addition to this, however, we also show increased translation efficiency in mRNA that contains a higher proportion of optimized codons. In our study and several other vertebrates, however, translation is the predominant effector of gene expression 33.
At the time of writing this manuscript, a study was published by Wu and colleagues, which demonstrated that translation is indeed a determinant of mRNA stability in human cells 28. While paper by Wu et al had assigned optimal and non‐optimal designations to codons via the calculation of the CSC derived from ORFeome and SLAM‐seq experiments, we noted that some of the findings paralleled ours. Indeed, the codon designations of optimal and non‐optimal codons also showed modest delineation of codons into GC3 and AT3 codons, respectively. In another article published in the bioRxiv preprint server, Forrest and colleagues utilized a combination of endogenous and human ORFeome collection mRNAs in human cells to derive the CSC for human cells [preprint: 29]. Similar to the study by Wu and colleagues, the codon designations of optimal and non‐optimal codons also showed a modest division of codons into GC3 and AT3 codons, respectively. Similarly, we also show that the use of optimal and non‐optimal codons can affect both mRNA stability and translation initiation to a large extent (Figs 1, 2, 3), albeit transcription to a limited extent. However, we have yet to identify an RBP that is involved in direct co‐translational decay of mRNAs in humans as with that in yeast. Moreover, DDX6, the mammalian ortholog of DHH1, was recently demonstrated in humans to be involved in miRNA‐driven translational repression, not mRNA destabilization as previously shown in yeast 73. DDX6 aside, it would certainly be exciting for future experiments to uncover the nature of this elusive RBP.
c‐Rel, a protein encoded by the REL gene and a canonical nuclear factor κB (NF‐κB) subunit, is expressed abundantly in differentiated lymphoid cells and has been shown to be vital in thymic regulatory T‐cell development in addition to controlling cancer via activated regulatory T cells 74, 75. Given the inherent low optimality and associated instability of REL in its WT form (Fig 3A), we wonder whether besides transcriptional control of REL, could there be other post‐transcriptional regulation systems at play. Further studies would be necessary to investigate whether codon optimality or codon optimality‐associated RBPs modulate REL gene expression.
In our investigation, mRNA stability can be affected by GC3‐ and GC‐content. It is important to note that the latter of which is also implicated in several processes such as miRNA binding, mRNA folding, and splicing, which in turn can affect mRNA stability. It is thus plausible that GC‐content can also affect gene expression independent of RBP association. A study of transcriptome miRNA‐binding sites has shown that effective miRNA‐binding sites tend to dwell in G‐poor and U‐rich environments 76. In addition, while our analyses are CDS‐based, it has been shown that GC‐content of both introns and exons is important in splicing via RNA structures 77, 78, 79. Taken together, we propose that codon bias is able to exert its effects at multiple levels, consequently effecting gene and protein expression.
The stability of mRNA can be modulated by RBPs, which bind AU‐rich sequences
Whereas AU‐rich elements (AREs) in the 3′UTR have been traditionally targeted by RBPs, we found that coding regions are also targeted by ARE‐recognizing RBPs. The identification of the heterodimeric complex consisting of ILF2 and ILF3 among others shows that a wide array of RBPs recognizes low optimality (AU‐rich) sequences (Fig 5). However, the binding of ILF2/3 to target RNA presents as a challenge when trying to identify its target motif. Studies have shown that the RNA‐binding portion of the ILF2/3 complex, ILF3, in particular is a promiscuous RBP, binding to RNA with no obvious sequence specificity 80. It is interesting to note that several binding motifs, all of which are AU‐rich have been proposed for ILF3. Analysis of ILF3 RNA Bind‐n‐seq measurements identified a 9 nt AU‐rich motif that is bound to by ILF3 47. Kuwano and colleagues show that NF90, the shorter isoform of ILF3, specifically targets a 30 nt AU‐rich sequence in mRNA 3′UTRs and represses their translation, not stability 42. This state of promiscuousness was compounded by a recent study by Wu and colleagues, in which in almost all genes where ILF3 occupancy was detected on the genome by ChIP‐seq, ILF3 occupancy was on the corresponding transcript. Indeed, ILF3 is a multifunctional protein, affecting several biological processes. In addition to ours, other studies have shown that ILF3 can contribute to splicing 81, stabilization, nuclear export 82, and, as mentioned, translation 42.
ILF2 on the other hand has been less scrutinized compared to its partner. From our experiments, we find that the longer isoform of ILF2 is predominantly and highly expressed, while the shorter isoform is low in expression. Additionally, we observed that overexpression of the longer isoform appeared to upregulate the expression of the shorter isoform albeit to a small extent. From the literature, it is known that ILF2 stabilizes ILF3 in the heterodimeric form 83. We postulate that it is possible that the ILF2/3 heterodimer represses translation of mRNA with AU‐rich sequences at a steady state in both CDS and 3′UTR. Knockdown of ILF2/3 relieves the repression on translation initiation allowing an increase in bound (translating) ribosomes, which sterically exclude decay factors from accessing the mRNA, thereby increasing stability. Indeed, the knockdown of ILF2, which is critical in maintaining the stability of the heterodimeric complex, results in a stabilization of mRNA possibly due to increased ribosome traffic. At the protein level, while the knockdown of ILF2 results in an increased protein expression of target mRNA, the combined effect of both ILF3 and ILF2 knockdown results in a higher increase in target mRNA expression as compared to the ILF2‐only knockdown. Unfortunately, in the case of the ILF2/3 siRNA experiments (Fig 6D), we were unable to achieve a complete knockdown of ILF2 due to the very high and constitutive production of ILF2. However, we still noted a small reduction in ILF3 protein levels, hinting that ILF2 stabilizes ILF3 in the heterodimer form. In addition, taking into consideration reports that ILF2 and ILF3 can function independently of each other 84, 85, 86, it is also possible that ILF2 and ILF3 regulate the fate of mRNA differently, ILF2 being able to dimerize with other binding partners such as ZFR and SPNR. It is unknown, however, how optimized transcripts are affected. Whereas our screens revealed that ILF2/3 bind exclusively to low optimality targets, we noted from our analysis of ILF2 knockdown data from the ENCODE database [Data ref: 45] as well as tests from our reporter constructs that high optimality transcripts are being regulated. Given this, we postulate that ILF2/3 might not interact directly with high optimality targets. Instead, ILF2/3 may be indirectly (de)antagonizing certain transcripts, which may code for other regulators of high optimality genes. Further investigations will be required to assess how high optimality transcripts are antagonized.
Our screens also detected HNRNPD/AUF1, which destabilizes transcripts via recognition of AU‐rich motifs 87, binding to low optimality mRNAs (Dataset EV3). These observations emphasize the importance of AU‐content, which is strongly connected with low optimality, in RNA destabilization. However, it is possible that these factors induced the degradation of AU‐rich transcripts different from the model proposed by Presnyak and Radhakrishnan 14, 15 as our RBP identification method was not fully reflective of the active translational status required for co‐translational degradation of mRNA transcripts. Further studies would be necessary to discern whether these or other factors act as sensors of codon optimality during translation.
In conclusion, in human cells, the redundancy of the genetic code allows the choice between alternative codons for the same amino acid, which may exert dramatic effects on the process of translation and mRNA stability. In our experiments, we show that two modes of mRNA regulation exist—GC3‐ and GC‐content dependent. This system potentially confers freedom for calibrating protein and mRNA abundances without altering protein sequence. Beginning from our exploratory analysis, we have developed an approach to quantify codon bias and demonstrate that beneath the redundancy of codons, exists a system, which modulates mRNA and, consequently, protein abundance.
Materials and Methods
Cell cultures, growth, and transfection conditions
HEK293T cells were maintained in Dulbecco's modified Eagle's medium (DMEM) (Nacalai Tesque), supplemented with 10% (v/v) fetal bovine serum. HEK293 Tet‐off cells were maintained in Minimum Essential Medium Eagle—Alpha Modification (α‐MEM) (Nacalai Tesque), supplemented with 10% (v/v) Tet‐off system‐approved fetal bovine serum (Takara Bio) and 100 μg/ml of G418 (Nacalai Tesque). For REL and IL6 overexpression experiments, plasmids were transfected using PEI MAX (Polysciences, Inc). For co‐transfection of ILF2 siRNA with REL plasmids, Lipofectamine 2000 was used as per the manufacturer's protocol. ILF2 siRNA that targeted ILF2 at exons 8 and 9 was Silencer Select siRNA, S7399 (Ambion, Life Technologies). Actinomycin D‐based stability assays in HeLa cells were performed by adding actinomycin D to the transfected cells to a final concentration of 2 μg/ml.
Plasmid construction
Codon‐optimized REL (REL‐OPT) and IL6 (IL6‐OPT) and codon‐deoptimized IL6 (IL6‐DE) sequences were synthesized as gBlocks Gene Fragments (Integrated DNA Technologies) (Dataset EV2). The REL‐OPT (+1 frameshift) sequence was constructed by adding a +1 frameshift just after the start codon. Resulting stop codons were removed to ensure no premature termination. These sequences and corresponding WT sequences were polymerase chain reaction (PCR) amplified (with the inclusion of a FLAG tag for REL sequences) and inserted into the pcDNA3.1(+) vector (Invitrogen) and pTRE‐TIGHT vector (Takara Bio). The sequences were confirmed via restriction enzyme digest and sequencing.
Tet‐off assay
HEK293 Tet‐off cells (Clontech) were transfected with pTRE‐TIGHT plasmids bearing the (de)optimized and WT sequences and incubated overnight at 37°C. Transcriptional shut‐off for the indicated plasmids was achieved by the addition of doxycycline (LKT Laboratories Inc.) to a final concentration of 1 μg/ml. Cycloheximide‐based stability assays in HEK293 Tet‐off cells were performed by adding actinomycin D to the transfected cells to a final concentration of 50 μg/ml. Anisomycin‐based stability assays in HEK293 Tet‐off cells were performed by adding anisomycin to the transfected cells to a final concentration of 20 μg/ml. Samples were harvested at the indicated time points after the addition of doxycycline (and cycloheximide/anisomycin).
RNA extraction, reverse transcription–PCR, and quantitative real‐time PCR
Total RNA was isolated from cells using TRIzol reagent (Invitrogen) as per the manufacturer's instructions. Reverse transcription was performed using the ReverTra Ace qPCR RT Master Mix with gDNA Removal Kit (Toyobo) as per the manufacturer's instructions. cDNA was amplified with PowerUp SYBR Green Master Mix (Applied Biosystems), and quantitative real‐time PCR (qPCR) was performed on the StepOne Real‐Time PCR System (Applied Biosystems). To quantify transcript abundance of the REL reporters, pTRE‐TIGHT plasmids bearing the (de)optimized and WT reporter sequences were used as standards. Human GAPDH abundance was used for normalization. The list of qPCR primers can be found in Dataset EV2.
Sucrose gradient centrifugation (polysome profiling)
HEK293T were transfected with equal concentrations of REL‐OPT and REL‐WT plasmids. Cells were lysed the next day in polysome buffer [20 mM 4‐(2‐hydroxyethyl)‐1‐piperazineethanesulfonic acid (HEPES‐KOH) (pH 7.5), 100 mM KCl, 5 mM MgCl2, 0.25% (v/v) Nonidet P‐40, 10 μg/ml cycloheximide, 100 units/ml RNase inhibitor, and protease inhibitor cocktail (Roche)]. Lysates were loaded on top of a linear 15–60% sucrose gradient [15–60% sucrose, 20 mM HEPES‐KOH [pH 7.5], 100 mM KCl, 5 mM MgCl2, 10 μg/ml cycloheximide, 100 units/ml RNase inhibitor, and protease inhibitor cocktail (Roche)]. After ultracentrifugation at 256,800 g for 2.5 h at 4°C in a HITACHI P40ST rotor, fractions were collected from the top of the gradient and subjected to UV‐densitometric analysis. The absorbance profiles of the gradients were determined at 254 nm. For disassociation of ribosome and polysome, EDTA was added to Mg2+‐free polysome buffer and 15–60% sucrose gradient at concentrations of 50 and 20 mM, respectively. For RNA analysis, RNA from each fraction was extracted via the High Pure RNA Isolation Kit (Roche) and subject to reverse transcription and qPCR.
Immunoblot analysis
Samples were lysed in RIPA buffer (20 mM Tris–HCl [pH 8], 150 mM NaCl, 10 mM EDTA, 1% Nonidet‐P40, 0.1% SDS, 1% sodium deoxycholate, and cOmplete Mini EDTA‐free Protease Inhibitor Cocktail [Roche]). Protein concentration was determined by the BCA Protein Assay (Thermo Fisher). Whole‐cell lysates were resolved by SDS–PAGE and transferred onto PVDF membranes (Bio‐Rad). The following antibodies were used for immunoblot analysis: mouse monoclonal anti‐FLAG (F3165, Sigma), mouse monoclonal anti‐ILF2 (sc‐365283, Santa Cruz Biotechnology), mouse anti‐β‐actin (sc‐47778, Santa Cruz), and mouse IgG HRP‐linked F(ab’)2 fragment (NA9310, GE Healthcare). Luminescence was detected with a luminescent image analyzer (Amersham Imager 600; GE Healthcare).
ELISA
HEK293T cells were transfected with pcDNA3.1(+) plasmids bearing the (de)optimized and WT sequences and incubated overnight at 37°C. Cell supernatant was aspirated, and the cell monolayer was washed with 1× PBS (pre‐warmed at 37°C). Pre‐warmed DMEM was added to the monolayer, and the cells were incubated for 2 h at 37°C. Thereafter, the cell supernatant was harvested and centrifuged at 300 ×g to pellet residual cells. The resulting supernatant was decanted, and the concentration of secreted IL6 was measured by the Human IL6 ELISA Kit (Invitrogen) according to the manufacturer's instructions.
ISRIM (In vitro specificity‐based RNA regulatory protein identification method)
Preparation of bait RNAs
T7‐tagged cDNA template was PCR‐amplified and subjected to in vitro transcription using a MEGAscript T7 Kit (Applied Biosystems). Amplified cRNA was purified with an RNeasy Mini Kit (Qiagen) and then subjected to FLAG conjugation as described (10) with some modifications. Briefly, 60 μl of freshly prepared 0.1 M NaIO4 was added to 60 μl of 250 pmol cRNA, and the mixture was incubated at 0°C for 10 min. The 3′ dialdehyde RNA was precipitated with 1 ml of 2% LiClO4 in acetone followed by washing with 1 ml acetone. The pellet was dissolved in 10 μl of 0.1 M sodium acetate, pH 5.2, and then mixed with 12 μl of 30 mM hydrazide–FLAG peptide. The reaction solution was mixed at room temperature for 30 min. The resulting imine moiety of the cRNA was reduced by adding 12 μl of 1 M NaCNBH3 and then incubated at room temperature for 30 min. The RNA was purified with an RNeasy Mini Kit (Qiagen).
Purification and analysis of RNA‐binding proteins
Purification and analysis of RNA‐binding protein (RBP) were carried out as described 41 with some modifications. Briefly, HEK293T cells were lysed with lysis buffer [10 mM HEPES (pH 7.5), 150 mM NaCl, 50 mM NaF, 1 mM Na3VO4, 5 μg/ml leupeptin, 5 μg ml aprotinin, 3 μg/ml pepstatin A, 1 mM phenylmethylsulfonyl fluoride (PMSF), and 1 mg/ml digitonin] and cleared by centrifugation. The cleared lysate was incubated with indicated amounts of FLAG‐tagged bait RNA, antisense oligos, and FLAG‐M2‐conjugated agarose for 1 h. The agarose resin was then washed three times with wash buffer [10 mM HEPES (pH 7.5), 150 mM NaCl, and 0.1% Triton X‐100], and co‐immunoprecipitated RNA and proteins were eluted with FLAG elution buffer [0.5 mg/ml FLAG peptide, 10 mM HEPES (pH 7.5), 150 mM NaCl, and 0.05% Triton X‐100]. The bait RNA‐associated proteins were digested with lysyl endopeptidase and trypsin. Digested peptide mixture was applied to a Mightysil‐PR‐18 (Kanto Chemical) frit‐less column (45 3 0.150 mm ID) and separated using a 0–40% gradient of acetonitrile containing 0.1% formic acid for 80 min at a flow rate of 100 nl/min. Eluted peptides were sprayed directly into a mass spectrometer (Triple TOF 5600+; AB Sciex). MS and MS/MS spectra were obtained using the information‐dependent mode. Up to 25 precursor ions above an intensity threshold of 50 counts/s were selected for MS/MS analyses from each survey scan. All MS/MS spectra were searched against protein sequences of RefSeq (NCBI) human protein database using the Protein Pilot software package (AB Sciex), and its decoy sequences then selected the peptides (FDR < 1%). Ion intensity of peptide peaks was obtained using Progenesis QI for proteomics software (version 3 Nonlinear Dynamics, UK) according to the manufacturer's instructions.
Ribosome profiling and RNA‐seq
Ribosome profiling was performed according to the method previously described with following modifications 34. RNA concentration of naïve HEK293T lysate was measured by Qubit RNA BR Assay Kit (Thermo Fisher Scientific). The lysate containing 10 μg RNA was treated with 20 U of RNase I (Lucigen) for 45 min at 25°C. After ribosomes were recovered by ultracentrifugation, RNA fragments corresponding to 26–34 nt were excised from footprint fragment purification gel. Library length distribution was checked using a microchip electrophoresis system (MultiNA, MCE‐202, Shimadzu).
For RNA‐seq, total RNA was extracted from the lysate using TRIzol LS reagent (Thermo Fisher Scientific) and Direct‐zol RNA Kit (Zymo Research). Ribosomal RNA was depleted using the Ribo‐Zero Gold rRNA Removal Kit (Human/Mouse/Rat) (Illumina), and the RNA‐seq library was prepared using TruSeq Stranded mRNA Library Prep Kit (Illumina) according to the manufacturer's instructions.
The libraries were sequenced on a HiSeq 4000 (Illumina) with a single‐end 50 bp sequencing run. Reads were aligned to human hg38 genome as described 34, 88. The offsets of A site from the 5′ end of ribosome footprints were determined empirically as 15 for 25–30 nt, 16 for 31–32 nt, and 17 for 33 nt. For RNA‐seq, offsets were set to 15 for all mRNA fragments. For calculation of the ribosome occupancies, mRNAs with lower than one footprint per codon were excluded. For calculation of the translation efficiencies (TEs), we counted the number of reads within each CDS, and ribosome profiling counts were normalized by RNA‐seq counts using the DESeq package 89. Reads corresponding to the first and last five codons of each CDS were omitted from the analysis of TEs. The Custom R Scripts will be available upon requests.
Bioinformatics and computational analyses
Principal component analysis
To calculate the codon frequencies of individual genes from H. sapiens, we first downloaded coding sequences (CDS) data (human genes, GRCh38p12) from the Ensembl BioMart Database. For each CDS, we tabulated the occurrences of each codon – excluding the stop codons. We then expressed the codon counts as a percentage of the total number of codons in its CDS to obtain the codon frequencies for each CDS. The codon frequencies for all 9,666 CDS were used as the input for the PCA using the Python 3.4 environment via the factoextra program 90. Finally, the data were trimmed to remove truncated sequences as well as sequences with non‐canonical start codons to a final of 9,898 genes.
Hierarchical clustering analysis
mRNA transcripts ranked in order of their half‐lives divided equally into four groups, and their average half‐lives within each group were calculated. The corresponding codon frequencies of transcripts within each group were averaged. Hierarchical clustering was performed using the average linkage method to cluster the codon frequencies in R using the ggplot2 program 91.
Quantification of GC3‐content
To quantify GC3‐content, we summed up the codon frequencies of GC3 codons and expressed the frequencies on a percentage scale.
Calculation of cAI and CSC
cAI values were calculated using the standalone CAIcal program 92 in which the human mean codon usage dataset obtained from the Kazusa Codon Usage Database 93 was used as the reference set. The CSC was calculated as described by Presnyak and colleagues 14 using the HEK293 mRNA stability dataset (GSE69153) [Data ref: 31,32].
Binning of ribosomal occupancy frequencies and calculation of codon bias‐derived occupancy scores
To quantify codon bias for ribosome profiling, the factor loading scores of the codons from the first principal component were normalized linearly on a percentage scale from 0 to 1, where 0 corresponded to the codon with the lowest score (AAT) and 1 to the codon with the highest score (GCC) (Fig EV2A). Binning of the ribosome occupancies was performed in the R environment via a custom script. To calculate the corresponding codon bias‐derived occupancy scores, we substituted the codon sequences of mRNA transcripts with their respective codon scores and, in a similar fashion, binned the data into 25 bins. As the scores of codons should inversely reflect the ribosome occupancy (i.e., higher ribosome occupancy associated with lower codon scores), we calculated the reciprocal of the binned codon scores within each bin for all 25 bins to derive the codon bias‐derived occupancy scores. Both ribosome occupancy and codon bias‐derived occupancy scores were normalized on a linear scale, and a Pearson correlation was performed on each transcript. To exclude the possibility that the correlations were due to chance, we shuffled the bins for the codon bias‐derived occupancy scores within each individual transcripts and calculated the Pearson correlation between shuffled and ribosomal occupancy data.
De novo motif discovery
Common transcripts that were more than fivefold differentially upregulated between the RIP‐seq data [Data ref: 43,44] in JJN3 and H929 cells were firstly identified. The corresponding cDNA sequences of the transcripts were downloaded from the UCSC table browser, with the option of masking repeats in the sequences 94. The sequences were subject to de novo motif discovery via the MEME (Multiple EM for Motif Elicitation) software under the MEME tool suite of programs 46.
Author contributions
FH wrote the manuscript and together with SFY performed the experiments and analyzed the data. MY provided insightful comments and proofreading for the manuscript. YM and ML performed the mRNA decay experiments. YS and SI performed the ribosomal profiling and proofreading of the manuscript.SA and TN performed the ISRIM experiments. AV provided advice and bioinformatics expertise. AF and TF performed the polysome profiling experiments. OT supervised and designed the experiments.
Conflict of interest
The authors declare that they have no conflict of interest.
Supporting information
Expanded View Figures PDF
Dataset EV1
Dataset EV2
Dataset EV3
Review Process File
Acknowledgements
The authors express their gratitude to all members of the laboratory of Medical Chemistry, Kyoto University, for their kind advice and discussions. DNA libraries were sequenced by the Vincent J. Coates Genomics Sequencing Laboratory at UC Berkeley, supported by NIH S10 OD018174 Instrumentation Grant. Computations were supported by Manabu Ishii, Itoshi Nikaido, and the Bioinformatics Analysis Environment Service on RIKEN Cloud at RIKEN ACCC. This work was supported by the JSPS KAKENHI (18H05278), AMED‐CREST from Japan Agency for Medical Research and Development, and the JSPS through Core‐to‐Core Program. This work was supported by Joint Usage/Research Center program of Institute for Frontier Life and Medical Sciences, Takeda Science Foundation, the Uehara Memorial Foundation. S.I. was supported by Grant‐in‐Aid for Scientific Research on Innovative Areas “nascent chain biology” (JP17H05679) and Grant‐in‐Aid for Young Scientists (A) (JP17H04998) from JSPS, the Pioneering Projects (“Cellular Evolution”) and the Aging Project from RIKEN, and Takeda Science Foundation.
EMBO Reports (2019) 20: e48220
Data availability
Ribosome profiling and RNA‐seq results of HEK293 cells have been deposited at GEO and can be accessed under dataset GSE126298 (https://www.ncbi.nlm.nih.gov/geo/query/acc.cgi?acc=GSE126298).
References
- 1. Huang L, Lou C‐H, Chan W, Shum EY, Shao A, Stone E, Karam R, Song H‐W, Wilkinson MF (2011) RNA homeostasis governed by cell type‐specific and branched feedback loops acting on NMD. Mol Cell 43: 950–961 [DOI] [PMC free article] [PubMed] [Google Scholar]
- 2. Mino T, Murakawa Y, Fukao A, Vandenbon A, Wessels H‐H, Ori D, Uehata T, Tartey S, Akira S, Suzuki Y et al (2015) Regnase‐1 and roquin regulate a common element in inflammatory mRNAs by spatiotemporally distinct mechanisms. Cell 161: 1058–1073 [DOI] [PubMed] [Google Scholar]
- 3. Yoshinaga M, Nakatsuka Y, Vandenbon A, Ori D, Uehata T, Tsujimura T, Suzuki Y, Mino T, Takeuchi O (2017) Regnase‐1 maintains iron homeostasis via the degradation of transferrin receptor 1 and prolyl‐hydroxylase‐domain‐containing protein 3 mRNAs. Cell Rep 19: 1614–1630 [DOI] [PubMed] [Google Scholar]
- 4. Leppek K, Das R, Barna M (2018) Functional 5′ UTR mRNA structures in eukaryotic translation regulation and how to find them. Nat Rev Mol Cell Biol 19: 158–174 [DOI] [PMC free article] [PubMed] [Google Scholar]
- 5. Cheng J, Maier KC, Avsec Ž, Rus P, Gagneur J (2017) Cis‐regulatory elements explain most of the mRNA stability variation across genes in yeast. RNA 23: 1648–1659 [DOI] [PMC free article] [PubMed] [Google Scholar]
- 6. Vogel C, Marcotte EM (2012) Insights into the regulation of protein abundance from proteomic and transcriptomic analyses. Nat Rev Genet 13: 227–232 [DOI] [PMC free article] [PubMed] [Google Scholar]
- 7. Zhou T, Weems M, Wilke CO (2009) Translationally optimal codons associate with structurally sensitive sites in proteins. Mol Biol Evol 26: 1571–1580 [DOI] [PMC free article] [PubMed] [Google Scholar]
- 8. Sharp PM, Li WH (1987) The codon adaptation index–a measure of directional synonymous codon usage bias, and its potential applications. Nucleic Acids Res 15: 1281–1295 [DOI] [PMC free article] [PubMed] [Google Scholar]
- 9. dos Reis M, Savva R, Wernisch L (2004) Solving the riddle of codon usage preferences: a test for translational selection. Nucleic Acids Res 32: 5036–5044 [DOI] [PMC free article] [PubMed] [Google Scholar]
- 10. dos Reis M, Wernisch L, Savva R (2003) Unexpected correlations between gene expression and codon usage bias from microarray data for the whole Escherichia coli K‐12 genome. Nucleic Acids Res 31: 6976–6985 [DOI] [PMC free article] [PubMed] [Google Scholar]
- 11. Pechmann S, Frydman J (2013) Evolutionary conservation of codon optimality reveals hidden signatures of co‐translational folding. Nat Struct Mol Biol 20: 237–243 [DOI] [PMC free article] [PubMed] [Google Scholar]
- 12. Dana A, Tuller T (2014) Mean of the typical decoding rates: a new translation efficiency index based on the analysis of ribosome profiling data. G3 5: 73–80 [DOI] [PMC free article] [PubMed] [Google Scholar]
- 13. Sabi R, Volvovitch Daniel R, Tuller T (2017) stAIcalc: tRNA adaptation index calculator based on species‐specific weights. Bioinformatics 33: 589–591 [DOI] [PubMed] [Google Scholar]
- 14. Presnyak V, Alhusaini N, Chen Y‐H, Martin S, Morris N, Kline N, Olson S, Weinberg D, Baker KE, Graveley BR et al (2015) Codon optimality is a major determinant of mRNA stability. Cell 160: 1111–1124 [DOI] [PMC free article] [PubMed] [Google Scholar]
- 15. Radhakrishnan A, Chen Y‐H, Martin S, Alhusaini N, Green R, Coller J (2016) The DEAD‐box protein Dhh1p couples mRNA decay and translation by monitoring codon optimality. Cell 167: 122–132.e9 [DOI] [PMC free article] [PubMed] [Google Scholar]
- 16. Sweet T, Kovalak C, Coller J (2012) The DEAD‐box protein Dhh1 promotes decapping by slowing ribosome movement. PLoS Biol 10: e1001342 [DOI] [PMC free article] [PubMed] [Google Scholar]
- 17. Dana A, Tuller T (2014) The effect of tRNA levels on decoding times of mRNA codons. Nucleic Acids Res 42: 9171–9181 [DOI] [PMC free article] [PubMed] [Google Scholar]
- 18. Gardin J, Yeasmin R, Yurovsky A, Cai Y, Skiena S, Futcher B (2014) Measurement of average decoding rates of the 61 sense codons in vivo . Elife 3: e03735 [DOI] [PMC free article] [PubMed] [Google Scholar]
- 19. Drummond DA, Wilke CO (2008) Mistranslation‐induced protein misfolding as a dominant constraint on coding‐sequence evolution. Cell 134: 341–352 [DOI] [PMC free article] [PubMed] [Google Scholar]
- 20. Akashi H (1994) Synonymous codon usage in Drosophila melanogaster: natural selection and translational accuracy. Genetics 136: 927–935 [DOI] [PMC free article] [PubMed] [Google Scholar]
- 21. Harigaya Y, Parker R (2016) Analysis of the association between codon optimality and mRNA stability in Schizosaccharomyces pombe . BMC Genom 17: 895 [DOI] [PMC free article] [PubMed] [Google Scholar]
- 22. Lee Y, Zhou T, Tartaglia GG, Vendruscolo M, Wilke CO (2010) Translationally optimal codons associate with aggregation‐prone sites in proteins. Proteomics 10: 4163–4171 [DOI] [PMC free article] [PubMed] [Google Scholar]
- 23. Mishima Y, Tomari Y (2016) Codon usage and 3′UTR length determine maternal mRNA stability in zebrafish. Mol Cell 61: 874–885 [DOI] [PubMed] [Google Scholar]
- 24. Burow DA, Martin S, Quail JF, Alhusaini N, Coller J, Cleary MD (2018) Attenuated codon optimality contributes to neural‐specific mRNA decay in Drosophila . Cell Rep 24: 1704–1712 [DOI] [PMC free article] [PubMed] [Google Scholar]
- 25. Boël G, Letso R, Neely H, Price WN, Wong K‐H, Su M, Luff J, Valecha M, Everett JK, Acton TB et al (2016) Codon influence on protein expression in E. coli correlates with mRNA levels. Nature 529: 358–363 [DOI] [PMC free article] [PubMed] [Google Scholar]
- 26. Jeacock L, Faria J, Horn D (2018) Codon usage bias controls mRNA and protein abundance in trypanosomatids. Elife 7: e32496 [DOI] [PMC free article] [PubMed] [Google Scholar]
- 27. de Freitas Nascimento J, Kelly S, Sunter J, Carrington M (2018) Codon choice directs constitutive mRNA levels in trypanosomes. Elife 7: e32467 [DOI] [PMC free article] [PubMed] [Google Scholar]
- 28. Wu Q, Medina SG, Kushawah G, DeVore ML, Castellano LA, Hand JM, Wright M, Bazzini AA (2019) Translation affects mRNA stability in a codon‐dependent manner in human cells. Elife 8: e45396 [DOI] [PMC free article] [PubMed] [Google Scholar]
- 29. Forrest ME, Narula A, Sweet TJ, Arango D, Hanson G, Ellis J, Oberdoerffer S, Coller J, Rissland OS (2018) Codon usage and amino acid identity are major determinants of mRNA stability in humans. bioRxiv 10.1101/488676 [PREPRINT] [DOI]
- 30. Zerbino DR, Achuthan P, Akanni W, Amode MR, Barrell D, Bhai J, Billis K, Cummins C, Gall A, Girón CG et al (2018) Ensembl 2018. Nucleic Acids Res 46: D754–D761 [DOI] [PMC free article] [PubMed] [Google Scholar]
- 31. Murakawa Y, Hinz M, Mothes J, Schuetz A, Uhl M, Wyler E, Yasuda T, Mastrobuoni G, Friedel CC, Dölken L et al (2015) Gene Expression Omnibus GSE69153 (https://www.ncbi.nlm.nih.gov/geo/query/acc.cgi?acc=GSE69153). [DATASET]
- 32. Murakawa Y, Hinz M, Mothes J, Schuetz A, Uhl M, Wyler E, Yasuda T, Mastrobuoni G, Friedel CC, Dölken L et al (2015) RC3H1 post‐transcriptionally regulates A20 mRNA and modulates the activity of the IKK/NF‐κB pathway. Nat Commun 6: 7367 [DOI] [PMC free article] [PubMed] [Google Scholar]
- 33. Bazzini AA, Del Viso F, Moreno‐Mateos MA, Johnstone TG, Vejnar CE, Qin Y, Yao J, Khokha MK, Giraldez AJ (2016) Codon identity regulates mRNA stability and translation efficiency during the maternal‐to‐zygotic transition. EMBO J 35: 2087–2103 [DOI] [PMC free article] [PubMed] [Google Scholar]
- 34. McGlincy NJ, Ingolia NT (2017) Transcriptome‐wide measurement of translation by ribosome profiling. Methods 126: 112–129 [DOI] [PMC free article] [PubMed] [Google Scholar]
- 35. Tuller T, Kupiec M, Ruppin E (2007) Determinants of protein abundance and translation efficiency in S. cerevisiae . PLoS Comput Biol 3: e248 [DOI] [PMC free article] [PubMed] [Google Scholar]
- 36. Iwasaki S, Ingolia NT (2016) Seeing translation. Science 352: 1391–1392 [DOI] [PubMed] [Google Scholar]
- 37. Ingolia NT, Ghaemmaghami S, Newman JRS, Weissman JS (2009) Genome‐wide analysis in vivo of translation with nucleotide resolution using ribosome profiling. Science 324: 218–223 [DOI] [PMC free article] [PubMed] [Google Scholar]
- 38. Duncan CDS, Mata J (2017) Effects of cycloheximide on the interpretation of ribosome profiling experiments in Schizosaccharomyces pombe . Sci Rep 7: 1–11 [DOI] [PMC free article] [PubMed] [Google Scholar]
- 39. Gerashchenko MV, Gladyshev VN (2014) Translation inhibitors cause abnormalities in ribosome profiling experiments. Nucleic Acids Res 42: e134 [DOI] [PMC free article] [PubMed] [Google Scholar]
- 40. Santos DA, Shi L, Tu BP, Weissman JS (2019) Cycloheximide can distort measurements of mRNA levels and translation efficiency. Nucleic Acids Res 47: 4974–4985 [DOI] [PMC free article] [PubMed] [Google Scholar]
- 41. Adachi S, Homoto M, Tanaka R, Hioki Y, Murakami H, Suga H, Matsumoto M, Nakayama KI, Hatta T, Iemura S et al (2014) ZFP36L1 and ZFP36L2 control LDLR mRNA stability via the ERK–RSK pathway. Nucleic Acids Res 42: 10037–10049 [DOI] [PMC free article] [PubMed] [Google Scholar]
- 42. Kuwano Y, Pullmann R, Marasa BS, Abdelmohsen K, Lee EK, Yang X, Martindale JL, Zhan M, Gorospe M (2010) NF90 selectively represses the translation of target mRNAs bearing an AU‐rich signature motif. Nucleic Acids Res 38: 225–238 [DOI] [PMC free article] [PubMed] [Google Scholar]
- 43. Marchesini M, Ogoti Y, Fiorini E, Aktas Samur A, Nezi L, D'Anca M, Storti P, Samur MK, Ganan‐Gomez I, Fulciniti MT et al (2017) Gene Expression Omnibus GSE83662 (https://www.ncbi.nlm.nih.gov/geo/query/acc.cgi?acc=GSE83662). [DATASET]
- 44. Marchesini M, Ogoti Y, Fiorini E, Aktas Samur A, Nezi L, D'Anca M, Storti P, Samur MK, Ganan‐Gomez I, Fulciniti MT et al (2017) ILF2 is a regulator of RNA splicing and DNA damage response in 1q21‐amplified multiple myeloma. Cancer Cell 32: 88–100.e6 [DOI] [PMC free article] [PubMed] [Google Scholar]
- 45. Snyder M (2017) ENCODE Project Experiment ENCSR073QLQ (https://www.encodeproject.org/experiments/ENCSR073QLQ/) [DATASET]
- 46. Bailey TL, Boden M, Buske FA, Frith M, Grant CE, Clementi L, Ren J, Li WW, Noble WS (2009) MEME SUITE: tools for motif discovery and searching. Nucleic Acids Res 37: W202–W208 [DOI] [PMC free article] [PubMed] [Google Scholar]
- 47. Dotu I, Adamson SI, Coleman B, Fournier C, Ricart‐Altimiras E, Eyras E, Chuang JH (2018) SARNAclust: semi‐automatic detection of RNA protein binding motifs from immunoprecipitation data. PLoS Comput Biol 14: e1006078 [DOI] [PMC free article] [PubMed] [Google Scholar]
- 48. Zheng G, Qin Y, Clark WC, Dai Q, Yi C, He C, Lambowitz AM, Pan T (2015) Efficient and quantitative high‐throughput transfer RNA sequencing. Nat Methods 12: 835–837 [DOI] [PMC free article] [PubMed] [Google Scholar]
- 49. Gingold H, Tehler D, Christoffersen NR, Nielsen MM, Asmar F, Kooistra SM, Christophersen NS, Christensen LL, Borre M, Sørensen KD et al (2014) A dual program for translation regulation in cellular proliferation and differentiation. Cell 158: 1281–1292 [DOI] [PubMed] [Google Scholar]
- 50. Charneski CA, Hurst LD (2013) Positively charged residues are the major determinants of ribosomal velocity. PLoS Biol 11: e1001508 [DOI] [PMC free article] [PubMed] [Google Scholar]
- 51. Ingolia NT, Lareau LF, Weissman JS (2011) Ribosome profiling of mouse embryonic stem cells reveals the complexity and dynamics of mammalian proteomes. Cell 147: 789–802 [DOI] [PMC free article] [PubMed] [Google Scholar]
- 52. Artieri CG, Fraser HB (2014) Accounting for biases in riboprofiling data indicates a major role for proline in stalling translation. Genome Res 24: 2011–2021 [DOI] [PMC free article] [PubMed] [Google Scholar]
- 53. Lareau LF, Hite DH, Hogan GJ, Brown PO (2014) Distinct stages of the translation elongation cycle revealed by sequencing ribosome‐protected mRNA fragments. Elife 3: e01257 [DOI] [PMC free article] [PubMed] [Google Scholar]
- 54. Pop C, Rouskin S, Ingolia NT, Han L, Phizicky EM, Weissman JS, Koller D (2014) Causal signals between codon bias, mRNA structure, and the efficiency of translation and elongation. Mol Syst Biol 10: 770 [DOI] [PMC free article] [PubMed] [Google Scholar]
- 55. Endoh T, Sugimoto N (2016) Mechanical insights into ribosomal progression overcoming RNA G‐quadruplex from periodical translation suppression in cells. Sci Rep 6: 22719 [DOI] [PMC free article] [PubMed] [Google Scholar]
- 56. Thandapani P, Song J, Gandin V, Cai Y, Rouleau SG, Garant J‐M, Boisvert F‐M, Yu Z, Perreault J‐P, Topisirovic I et al (2015) Aven recognition of RNA G‐quadruplexes regulates translation of the mixed lineage leukemia protooncogenes. Elife 4: e06234 [DOI] [PMC free article] [PubMed] [Google Scholar]
- 57. Pan L, Li Y, Zhang H‐Y, Zheng Y, Liu X‐L, Hu Z, Wang Y, Wang J, Cai Y‐H, Liu Q et al (2017) DHX15 is associated with poor prognosis in acute myeloid leukemia (AML) and regulates cell apoptosis via the NF‐kB signaling pathway. Oncotarget 8: 89643–89654 [DOI] [PMC free article] [PubMed] [Google Scholar]
- 58. Faure G, Ogurtsov AY, Shabalina SA, Koonin EV (2016) Role of mRNA structure in the control of protein folding. Nucleic Acids Res 44: 10898–10911 [DOI] [PMC free article] [PubMed] [Google Scholar]
- 59. Yu C‐H, Dang Y, Zhou Z, Wu C, Zhao F, Sachs MS, Liu Y (2015) Codon usage influences the local rate of translation elongation to regulate co‐translational protein folding. Mol Cell 59: 744–754 [DOI] [PMC free article] [PubMed] [Google Scholar]
- 60. Tuller T, Veksler‐Lublinsky I, Gazit N, Kupiec M, Ruppin E, Ziv‐Ukelson M (2011) Composite effects of gene determinants on the translation speed and density of ribosomes. Genome Biol 12: R110 [DOI] [PMC free article] [PubMed] [Google Scholar]
- 61. Edri S, Tuller T (2014) Quantifying the effect of ribosomal density on mRNA stability. PLoS ONE 9: e102308 [DOI] [PMC free article] [PubMed] [Google Scholar]
- 62. Neymotin B, Ettorre V, Gresham D (2016) Multiple transcript properties related to translation affect mRNA degradation rates in Saccharomyces cerevisiae . G3 6: 3475–3483 [DOI] [PMC free article] [PubMed] [Google Scholar]
- 63. Schwartz DC, Parker R (2000) mRNA decapping in yeast requires dissociation of the cap binding protein, eukaryotic translation initiation factor 4E. Mol Cell Biol 20: 7933–7942 [DOI] [PMC free article] [PubMed] [Google Scholar]
- 64. Chan LY, Mugler CF, Heinrich S, Vallotton P, Weis K (2018) Non‐invasive measurement of mRNA decay reveals translation initiation as the major determinant of mRNA stability. Elife 7: e32536 [DOI] [PMC free article] [PubMed] [Google Scholar]
- 65. Schwartz DC, Parker R (1999) Mutations in translation initiation factors lead to increased rates of deadenylation and decapping of mRNAs in Saccharomyces cerevisiae . Mol Cell Biol 19: 5247–5256 [DOI] [PMC free article] [PubMed] [Google Scholar]
- 66. Saini P, Eyler DE, Green R, Dever TE (2009) Hypusine‐containing protein eIF5A promotes translation elongation. Nature 459: 118–121 [DOI] [PMC free article] [PubMed] [Google Scholar]
- 67. Zhou Z, Dang Y, Zhou M, Li L, Yu C, Fu J, Chen S, Liu Y (2016) Codon usage is an important determinant of gene expression levels largely through its effects on transcription. Proc Natl Acad Sci USA 113: E6117–E6125 [DOI] [PMC free article] [PubMed] [Google Scholar]
- 68. Zhou Z, Dang Y, Zhou M, Yuan H, Liu Y (2018) Codon usage biases co‐evolve with transcription termination machinery to suppress premature cleavage and polyadenylation. Elife 7: e33569 [DOI] [PMC free article] [PubMed] [Google Scholar]
- 69. Kudla G, Lipinski L, Caffin F, Helwak A, Zylicz M (2006) High guanine and cytosine content increases mRNA levels in mammalian cells. PLoS Biol 4: e180 [DOI] [PMC free article] [PubMed] [Google Scholar]
- 70. Newman ZR, Young JM, Ingolia NT, Barton GM (2016) Differences in codon bias and GC content contribute to the balanced expression of TLR7 and TLR9. Proc Natl Acad Sci USA 113: E1362–E1371 [DOI] [PMC free article] [PubMed] [Google Scholar]
- 71. Fu J, Dang Y, Counter C, Liu Y (2018) Codon usage regulates human KRAS expression at both transcriptional and translational levels. J Biol Chem 293: 17929–17940 [DOI] [PMC free article] [PubMed] [Google Scholar]
- 72. Lampson BL, Pershing NLK, Prinz JA, Lacsina JR, Marzluff WF, Nicchitta CV, MacAlpine DM, Counter CM (2013) Rare codons regulate KRas oncogenesis. Curr Biol 23: 70–75 [DOI] [PMC free article] [PubMed] [Google Scholar]
- 73. Freimer JW, Hu TJ, Blelloch R (2018) Decoupling the impact of microRNAs on translational repression versus RNA degradation in embryonic stem cells. Elife 7: e38014 [DOI] [PMC free article] [PubMed] [Google Scholar]
- 74. Grinberg‐Bleyer Y, Oh H, Desrichard A, Bhatt DM, Caron R, Chan TA, Schmid RM, Hayden MS, Klein U, Ghosh S (2017) NF‐κB c‐Rel is crucial for the regulatory T cell immune checkpoint in cancer. Cell 170: 1096–1108.e13 [DOI] [PMC free article] [PubMed] [Google Scholar]
- 75. Oh H, Grinberg‐Bleyer Y, Liao W, Maloney D, Wang P, Wu Z, Wang J, Bhatt DM, Heise N, Schmid RM et al (2017) An NF‐κB transcription‐factor‐dependent lineage‐specific transcriptional program promotes regulatory T cell identity and function. Immunity 47: 450–465.e5 [DOI] [PMC free article] [PubMed] [Google Scholar]
- 76. Gumienny R, Zavolan M (2015) Accurate transcriptome‐wide prediction of microRNA targets and small interfering RNA off‐targets with MIRZA‐G. Nucleic Acids Res 43: 9095 [DOI] [PMC free article] [PubMed] [Google Scholar]
- 77. Zafrir Z, Tuller T (2015) Nucleotide sequence composition adjacent to intronic splice sites improves splicing efficiency via its effect on pre‐mRNA local folding in fungi. RNA 21: 1704–1718 [DOI] [PMC free article] [PubMed] [Google Scholar]
- 78. Amit M, Donyo M, Hollander D, Goren A, Kim E, Gelfman S, Lev‐Maor G, Burstein D, Schwartz S, Postolsky B et al (2012) Differential GC content between exons and introns establishes distinct strategies of splice‐site recognition. Cell Rep 1: 543–556 [DOI] [PubMed] [Google Scholar]
- 79. Zhang J, Kuo CCJ, Chen L (2011) GC content around splice sites affects splicing through pre‐mRNA secondary structures. BMC Genom 12: 90 [DOI] [PMC free article] [PubMed] [Google Scholar]
- 80. Parrott AM, Walsh MR, Mathews MB (2007) Analysis of RNA: protein interactions in vivo: identification of RNA‐binding partners of nuclear factor 90. Meth Enzymol 429: 243–260 [DOI] [PubMed] [Google Scholar]
- 81. Zhou Z, Licklider LJ, Gygi SP, Reed R (2002) Comprehensive proteomic analysis of the human spliceosome. Nature 419: 182–185 [DOI] [PubMed] [Google Scholar]
- 82. Pfeifer I, Elsby R, Fernandez M, Faria PA, Nussenzveig DR, Lossos IS, Fontoura BMA, Martin WD, Barber GN (2008) NFAR‐1 and ‐2 modulate translation and are required for efficient host defense. Proc Natl Acad Sci USA 105: 4173–4178 [DOI] [PMC free article] [PubMed] [Google Scholar]
- 83. Guan D, Altan‐Bonnet N, Parrott AM, Arrigo CJ, Li Q, Khaleduzzaman M, Li H, Lee C‐G, Pe'ery T, Mathews MB (2008) Nuclear factor 45 (NF45) is a regulatory subunit of complexes with NF90/110 involved in mitotic control. Mol Cell Biol 28: 4629–4641 [DOI] [PMC free article] [PubMed] [Google Scholar]
- 84. Harashima A, Guettouche T, Barber GN (2010) Phosphorylation of the NFAR proteins by the dsRNA‐dependent protein kinase PKR constitutes a novel mechanism of translational regulation and cellular defense. Genes Dev 24: 2640–2653 [DOI] [PMC free article] [PubMed] [Google Scholar]
- 85. Wolkowicz UM, Cook AG (2012) NF45 dimerizes with NF90, Zfr and SPNR via a conserved domain that has a nucleotidyltransferase fold. Nucleic Acids Res 40: 9356–9368 [DOI] [PMC free article] [PubMed] [Google Scholar]
- 86. Graber T, Baird S, Kao P, Mathews M, Holcik M (2010) NF45 functions as an IRES trans‐acting factor that is required for translation of cIAP1 during the unfolded protein response. Cell Death Differ 17: 719–729 [DOI] [PMC free article] [PubMed] [Google Scholar]
- 87. Gratacós FM, Brewer G (2010) The role of AUF1 in regulated mRNA decay. Wiley Interdiscip Rev RNA 1: 457–473 [DOI] [PMC free article] [PubMed] [Google Scholar]
- 88. Akichika S, Hirano S, Shichino Y, Suzuki T, Nishimasu H, Ishitani R, Sugita A, Hirose Y, Iwasaki S, Nureki O et al (2019) Cap‐specific terminal N6‐methylation of RNA by an RNA polymerase II‐associated methyltransferase. Science 363: eaav0080 [DOI] [PubMed] [Google Scholar]
- 89. Anders S, Huber W (2010) Differential expression analysis for sequence count data. Genome Biol 11: R106 [DOI] [PMC free article] [PubMed] [Google Scholar]
- 90. Kassambara A, Mundt F (2017) factoextra: extract and visualize the results of multivariate data analyses.
- 91. Wickham H, Chang W, Henry L, Pedersen TL, Takahashi K, Wilke C, Woo K, RStudio (2018) ggplot2: create elegant data visualisations using the grammar of graphics
- 92. Puigbò P, Bravo IG, Garcia‐Vallve S (2008) CAIcal: a combined set of tools to assess codon usage adaptation. Biol Direct 3: 38 [DOI] [PMC free article] [PubMed] [Google Scholar]
- 93. Nakamura Y, Gojobori T, Ikemura T (2000) Codon usage tabulated from international DNA sequence databases: status for the year 2000. Nucleic Acids Res 28: 292 [DOI] [PMC free article] [PubMed] [Google Scholar]
- 94. Karolchik D, Hinrichs AS, Furey TS, Roskin KM, Sugnet CW, Haussler D, Kent WJ (2004) The UCSC table browser data retrieval tool. Nucleic Acids Res 32: D493–D496 [DOI] [PMC free article] [PubMed] [Google Scholar]
Associated Data
This section collects any data citations, data availability statements, or supplementary materials included in this article.
Supplementary Materials
Expanded View Figures PDF
Dataset EV1
Dataset EV2
Dataset EV3
Review Process File
Data Availability Statement
Ribosome profiling and RNA‐seq results of HEK293 cells have been deposited at GEO and can be accessed under dataset GSE126298 (https://www.ncbi.nlm.nih.gov/geo/query/acc.cgi?acc=GSE126298).