Abstract
The transcription factors STAT3 and STAT4 are essential for lymphocyte differentiation and function. Interleukin (IL)‐17 producing γδ T (γδT17) cells are innate lymphocytes important for anti‐bacterial and inflammatory responses at barrier surfaces. Herein, we examine the role of STAT3 and STAT4 in regulating the homeostasis, activation, and pathogenicity of γδT17 cells. We show that STAT3 sustains γδT17 numbers in the skin but not in the lymph nodes, while STAT4 deficiency does not affect their homeostasis. Similarly, STAT3 but not STAT4 is essential for IL‐23‐induced IL‐22 production by γδT17 cells. Concomitantly, mice lacking STAT3 expression in γδT17 cells develop significantly reduced psoriasis‐like inflammation. STAT3‐deficient γδT17 cells fail to expand and to upregulate IL‐17A, IL‐17F, and IL‐22 in response to psoriatic stimuli. Although STAT4‐deficient animals develop psoriasis‐like disease, γδT17 cells in these mice are defective in IL‐17F production. Collectively, our data demonstrate for the first time a critical role for STAT3 in orchestrating the homeostasis and pathogenicity of γδT17 cells and provide evidence for the requirement of STAT4 for optimal cytokine responses during inflammation.
Keywords: cytokine, psoriasis, STAT3, STAT4, γδ T cells
Subject Categories: Immunology
Introduction
STAT transcription factors are evolutionary conserved signal‐transducing molecules, which in the mammalian immune system regulate many cytokine receptors and are critical in orchestrating lymphocyte activation during infection, inflammation, and cancer 1, 2, 3. STAT3 is downstream of the interleukin (IL)‐6, IL‐21, and IL‐23 receptors, all of which are important for the generation and maintenance of T‐helper (H)‐17 cells 4, 5, 6. STAT3 is a key initiator of the Th17 differentiation program by inducing the expression of the lineage specifying transcription factor RORγt 7 as well as most other transcriptional regulators associated with Th17 cells 8. Therefore, failure to activate or express STAT3 results in the loss of Th17 cells, which correlates with resistance to inflammation 6, 8, 9, 10. Furthermore, IL‐23 receptor signaling is important for the generation of pathogenic Th17 cells 11, and this is most likely driven through a combination of STAT3‐ and STAT4‐mediated signaling 12. STAT4 is, however, primarily associated with IL‐12 signaling 3, as it represents the STAT protein mostly associated with activated IL‐12 receptor 13. STAT4 is critical for lineage specification of Th1 cells by regulating major enhancer elements in differentiating CD4 T cells 14, while it synergizes with the transcription factor Tbet in inducing production of IFNγ 15.
IL‐17‐producing gamma delta (γδ) T cells (γδT17) are a major innate source of IL‐17 in the mouse and occupy mostly barrier surfaces such as the skin and mucosa as well as secondary lymphoid organs 16. Developmentally, although γδT17 cells originate in the embryonic thymus 17, we have recently demonstrated that they undergo a critical expansion and differentiation process during neonatal life [preprint: 18]. A number of transcription factors have been described to regulate the embryonic differentiation of γδT17 cells, including cMAF, Sox13, and RORγt 19, 20, while STAT5 is critical for neonatal development [preprint: 18].
In the adult skin, γδT17 cells are one of the primary resident innate lymphocytes and through the production of IL‐17 and IL‐22, they are important in clearing bacterial infections 21, 22 and in mediating imiquimod‐induced psoriasis‐like disease 23, 24, 25. In the mouse, the two major IL‐17‐producing γδ T‐cell subsets express either the TCR chains Vγ4 or Vγ6 (Vγ4−) (Vγ nomenclature according to Heilig & Tonegawa 26), both of which have been associated with tissue pathology during inflammation, particularly in the skin 27. Similar to Th17 cells, production of IL‐17 and IL‐22 by γδT17 cells can be induced by IL‐23R 28, 29, although it is not known whether this is STAT3 and/or STAT4 driven. In contrast, homeostatic expression of IL‐17 17 does not require IL‐23R‐STAT3 signaling 30, 31.
Herein, we investigated the roles of STAT3 and STAT4 in γδT17 cells during steady state and imiquimod(IMQ)‐induced psoriasis. We show that at steady‐state STAT3 is not required for the production of IL‐17A or IL‐17F by γδT17 cells but it is necessary for their response to in vitro IL‐23 and IL‐1β stimulation. Although, STAT3 was not important for sustaining γδT17 cells in the lymph node (LN), it regulated their numbers in the skin. During psoriasis‐like inflammation, γδT17 cells required STAT3 signals to expand, enhance production of IL‐17A, IL‐17F, and IL‐22 and to cause skin pathology. STAT4 did not regulate γδT17 numbers in either the skin or LNs and was not important for the production of IL‐17A or IL‐17F at steady state or the production of IL‐22 after IL‐23 stimulation. Although during psoriasis‐like inflammation, STAT4 signaling was not required for cellular expansion and did not contribute to skin pathology, the presence of STAT4 was critical for optimal IL‐17F induction. These data provide mechanistic insight into the signaling events that regulate cytokine production and activation of γδT17 cells during inflammation and establish critical roles for STAT3 and STAT4 in the regulation of these cells during health and disease.
Results and Discussion
STAT3 regulates skin γδT17 cell numbers
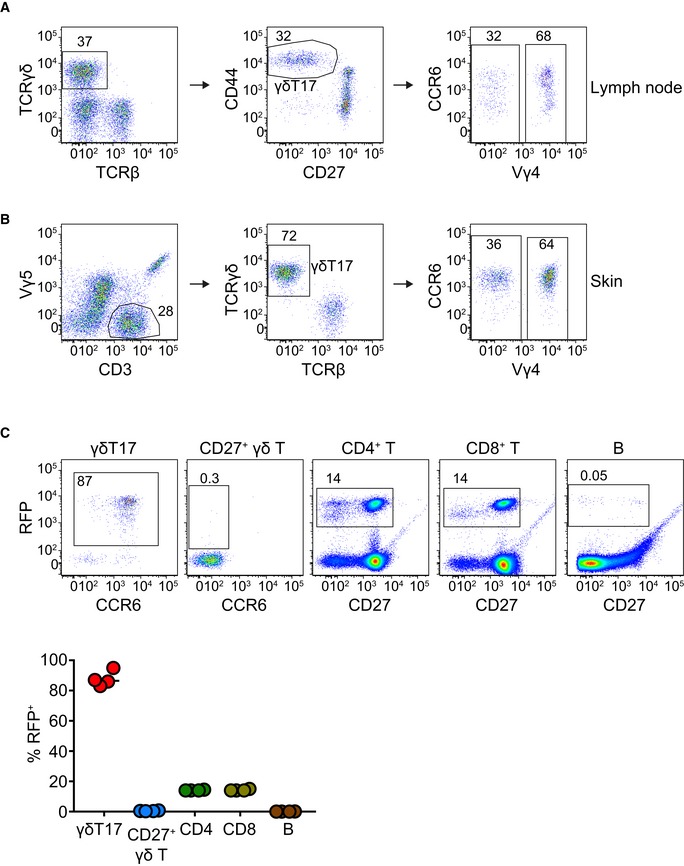
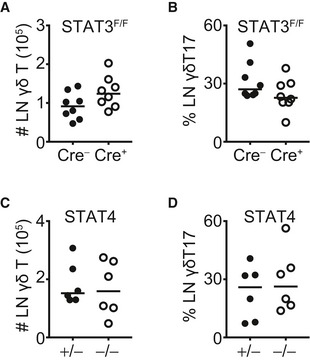
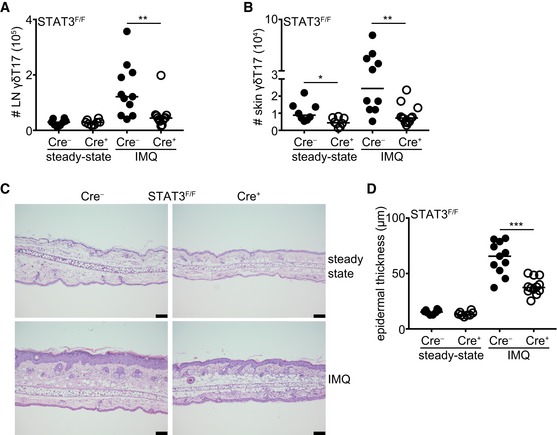
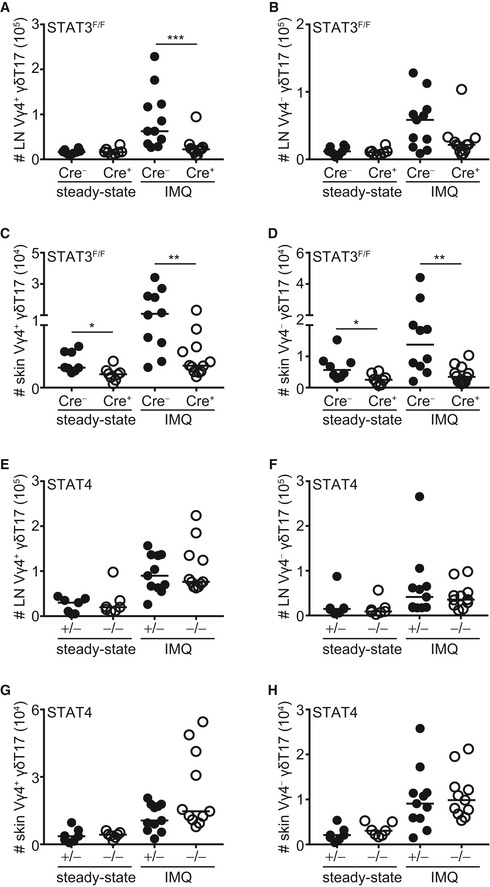
In order to better understand the role of STAT3 in γδT17 cells, we crossed mice that express the Cre recombinase under the control of the RORγt promoter 32 with STAT3 floxed mice 33. The resulting RORγtCRE‐STAT3F/F mice were viable and did not show any physical abnormalities. We identified γδT17 cells in the LN as TCRγδ+CD27−CD44Hi and in the skin as CD3LoTCRγδ+Vγ5− and in either organ both Vγ4+ and Vγ4− subsets expressed CCR6 (Fig EV1A and B) 34, 35. The activity of the RORγt‐driven Cre recombinase was assessed by crossing RORγtCRE with ROSA26‐STOPflox‐RFP (RORγtCRE‐RFPSTP‐F/F) mice, which showed over 80% reporter expression in TCRγδ+CD27− LN cells (Fig EV1C). Compared to littermate controls (Cre−), LNs of RORγtCRE‐STAT3F/F (Cre+) mice contained normal numbers of total γδ T cells (Fig EV2A) and γδT17 cell frequencies (Fig EV2B). Similarly, STAT3 did not impact on the numbers of LN γδT17 cells (Fig 1A) irrespective of whether they were Vγ4+ or Vγ4− (Fig EV3A and B). In contrast to the LN, there was a significant reduction in γδT17 cell numbers in the skin of RORγtCRE‐STAT3F/F mice compared to littermate controls (Figs 1B and EV3C and D), suggesting a role for STAT3 in sustaining cutaneous γδT17 cells.
Figure EV1. Gating strategy for the identification of γδT17 cells by flow cytometry in lymph nodes and ear skin and assessment of the RORγtCRE efficiency.
-
A, BGating strategy in the lymph node (A) and skin (B).
-
CRORγtCRE mice were crossed with ROSA26‐STOPflox‐RFP mice (RORγtCRE‐RFPSTP‐F/F), whereby the floxed STOP cassette in front of the red fluorescent protein (RFP) gene prevents its constitutive driven expression by the ROSA26 locus until Cre recombinase‐mediated excision. The graph summarizes data from 4 mice. Each color represents a cell population.
Figure EV2. STAT3 and STAT4 do not regulate γδ T and γδT17 cell numbers in the lymph nodes.
-
ANumbers of total γδ T cells in the LN of RORγtCRE‐STAT3F/F mice.
-
BFrequency of γδT17 cells (% of total γδ T) in the LN of RORγtCRE‐STAT3F/F mice.
-
CNumbers of total γδ T cells in the LN of STAT4−/− mice.
-
DFrequency of γδT17 cells (% of total γδ T) in the LN of STAT4−/− mice.
Figure 1. STAT3 regulates skin γδT17 cell homeostasis and their response and pathogenicity during imiquimod‐driven psoriasis.
-
A, BNumbers of γδT17 cells in the LN (A) and skin (B) before (steady state) and after IMQ‐induced psoriasis. Steady state: n = 8; 4 experiments, IMQ: n = 11–12; 4 experiments.
-
CRepresentative micrographs indicating ear skin sections stained with H&E before and after IMQ‐induced psoriasis (scale bar = 100 μm).
-
DQuantification of epidermal thickening from H&E‐stained sections. Steady‐state: n = 8; 4 experiments, IMQ: n = 11–12; 4 experiments. Each symbol is the average thickening from 5 micrographs measured in μm.
Figure EV3. Impact of STAT3 and STAT4 on Vγ4+ and Vγ4− γδT17 subsets in the lymph node and skin at steady state and during inflammation.
-
A–H(A, B and E, F) Numbers of Vγ4+ (A and E) and Vγ4− (B and F) γδT17 cells in the LN before (steady state) and after IMQ‐induced psoriasis in RORγtCRE‐STAT3F/F (A, B) or STAT4−/− (E, F) mice. Steady state: n = 7–8; 4 experiments, IMQ: n = 11–12; 4 experiments. (C, D and G, H) Numbers of Vγ4+ (C and G) and Vγ4− (D and H) γδT17 cells in the skin before (steady state) and after IMQ‐induced psoriasis in RORγtCRE‐STAT3F/F (C, D) or STAT4−/− (G, H) mice. Steady state: n = 7–8; 4 experiments, IMQ: n = 11–12; 4 experiments.
STAT3 but not STAT4 is required for inflammatory γδT17 cell responses and imiquimod‐driven psoriasis
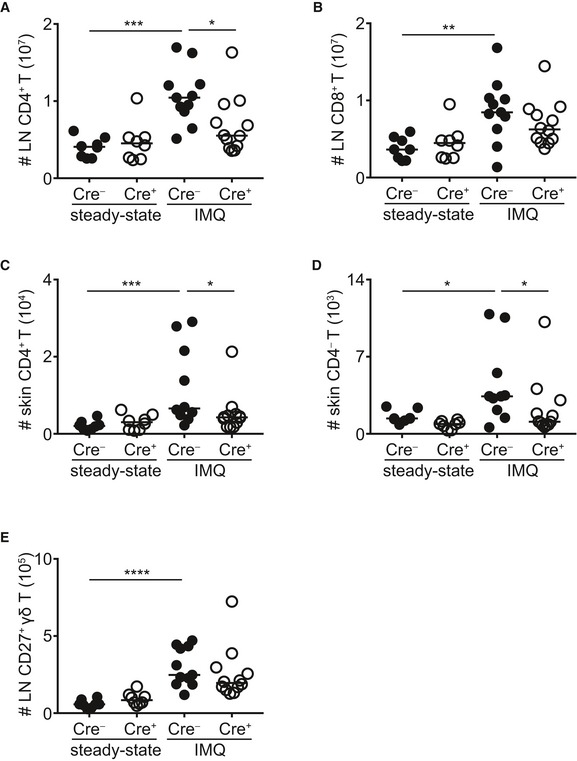
Next, we investigated whether STAT3‐deficient γδT17 cells could respond to an in vivo inflammatory stimulus and we used the imiquimod(IMQ)‐induced psoriasis model, which depends on functional γδT17 cells and the cytokines IL‐17A, IL‐17F, and IL‐22 23, 36, 37, 38. We found that γδT17 cells in RORγtCRE‐STAT3F/F mice failed to expand in response to IMQ‐induced inflammation in both skin and draining LNs (Figs 1A and B, and EV3A–D). STAT3 deficiency affected Vγ4+ and Vγ4− cells equally (Fig EV3A–D). Although we and others have shown before that conventional αβ T cells are dispensable for IMQ‐induced inflammation in the presence of functional γδT17 cells 25, 37, 38, we quantified CD4+, CD4− (CD8+), and CD27+ γδ T cells in RORγtCRE‐STAT3F/F mice (Fig EV4). We found that all 3 populations expanded after IMQ treatment (Fig EV4A–E); however, only CD4+ T cells in the LN (Fig EV4A) and CD4+ and CD4− T cells in the skin (Fig EV4C and D) were dependent on STAT3.
Figure EV4. Impact of STAT3 on non‐γδT17 cell populations.
-
A, BNumbers of LN CD4+ and CD8+ T cells before (steady state) and after IMQ treatment.
-
C, DNumbers of skin CD4+ and CD4− T cells before (steady state) and after IMQ treatment.
-
ENumbers of LN CD27+ γδ T cells before (steady state) and after IMQ treatment.
Compared to littermate controls, RORγtCRE‐STAT3F/F mice developed significantly reduced psoriasis‐like symptoms as measured by epidermal thickening (Fig 1C and D). Therefore, STAT3 is necessary to drive the γδT17 cell response during psoriatic inflammation and to establish full disease, which is in accordance with its important role in TH17 and other IL‐17‐producing lymphocytes.
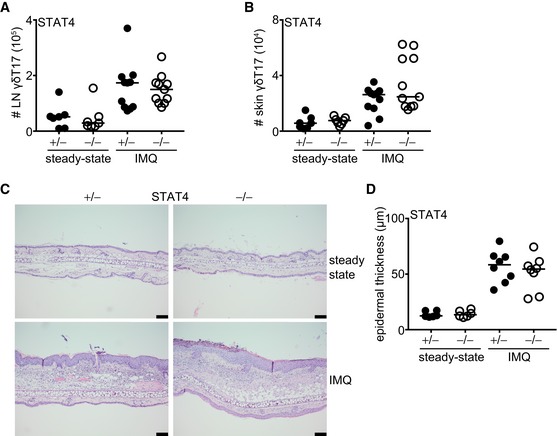
To test the importance of the related transcription factor STAT4, we used mice deficient in STAT4 (STAT4−/−) and compared them to littermate STAT4+/− heterozygous controls. Compared to controls, STAT4−/− mice had normal numbers of total γδ T cells (Fig EV2C) and γδT17 cell frequencies (Fig EV2D) in the LNs. Similarly, STAT4 deficiency did not affect the numbers of γδT17 cells in either the LNs or skin (Figs 2A and B, and EV3E–H), suggesting that unlike STAT3, STAT4 does not regulate the development or homeostasis of γδT17 cells. Furthermore, and in marked contrast to STAT3, STAT4 was not required for γδT17 cell expansion or establishment of psoriatic symptoms. Hence, in STAT4−/− mice, LN and skin γδT17 cells expanded comparably to controls (Figs 2A and B, and EV3E–H), while epidermal thickening was also unchanged (Fig 2C and D). Thus, unlike in TH17 cells, STAT4 does not regulate γδT17 responses or γδT17‐mediated inflammation suggesting a differential role among lymphocyte subsets.
Figure 2. STAT4 is not required for γδT17 cell homeostasis or their inflammatory response.
-
A, BNumbers of γδT17 cells in the LN and skin (staining as in Fig EV1) before (steady state) and after IMQ‐induced psoriasis. Steady state: n = 6; 3 experiments, IMQ: n = 11; 4 experiments.
-
CRepresentative micrographs indicating ear skin sections stained with H&E before and after IMQ‐induced psoriasis (scale bar = 100 μm).
-
DQuantification of epidermal thickening from H&E‐stained sections. Steady state: n = 6; 3 experiments, IMQ: n = 8; 3 experiments. Each symbol is the average thickening from 5 micrographs measured in μm.
A recent report concluded that STAT3 signaling in γδT17 cells is not required for IMQ‐induced psoriasis or Vγ6+ cell responses, which contradicts our data 39. However, the authors therein used a human CD2 transgene driven Cre (hCD2CRE) line to delete STAT3, which will impact a number of different lineages including all T cells, B cells, NKT cells, conventional and plasmacytoid dendritic cells 40, and which in turn may affect γδT17 cells indirectly, especially during inflammation. The RORγtCRE‐RFPSTP‐F/F mouse line showed over 80% reporter expression in γδT17 cells, 15% in conventional T cells, and no expression in B cells or CD27+ γδ T cells, demonstrating high efficiency and relative specificity by comparison to hCD2CRE (Fig EV1C). In addition, it is also possible that there are variations in the outcome of disease depending on the site of psoriasis induction, with Cai et al applying IMQ cream on the shaved back of mice 39, whereas we induced inflammation on the dorsal part of the ear. Despite these discrepancies, Cai et al found significantly impaired Vγ4 γδT17 cell responses in STAT3‐deficient animals, which agrees with our findings and suggests that STAT3 is a critical enhancer of pathogenic γδT17 cells.
STAT3 and STAT4 are required for cytokine production by γδT17 cells during inflammation but not steady state
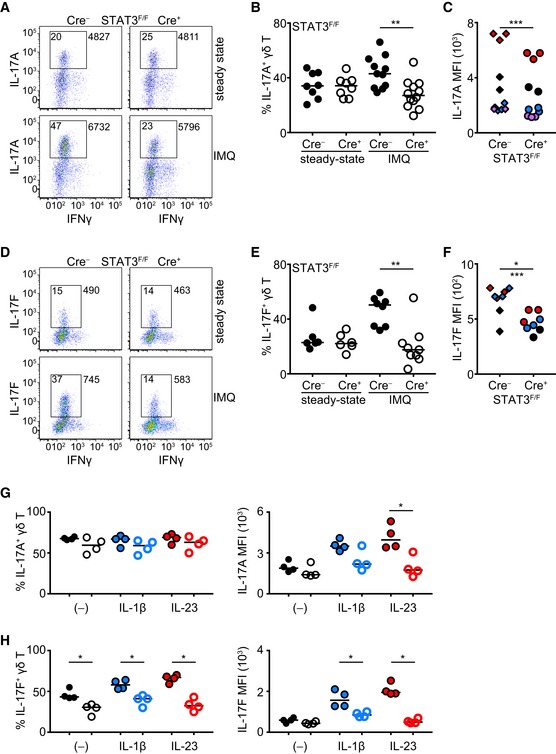
Since IL‐17A, IL‐17F, and IL‐22 production by activated γδT17 cells is critical to drive disease in the IMQ model of skin inflammation 38, we assessed the influence of STAT3 and STAT4 on the production of these cytokines. In the absence of inflammation, production of IL‐17A (Fig 3A–C) and IL‐17F (Fig 3D–F) was independent of STAT3. However, in IMQ‐treated RORγtCRE‐STAT3F/F animals, the frequency of IL‐17A‐ and IL‐17F‐producing γδT17 cells failed to increase and was significantly lower compared to controls (Fig 3A, B, D and E). Similar to in vivo inflammation, short‐term in vitro culture of γδT17 cells with IL‐1β or IL‐23 showed that STAT3 was required of the induction of IL‐17A and IL‐17F proteins, without, however, affecting the frequency of IL‐17A+ cells (Fig 3G and H). Although unresponsiveness to IL‐23 can be explained molecularly by the lack of STAT3, defective IL‐1β signaling most likely reflects compromised fitness of STAT3‐deficient cells or reduced capacity to activate the mTOR pathway 39.
Figure 3. Production of IL‐17A and IL‐17F is driven by STAT3 during inflammation but not at steady state.
-
A–F(A, D) Representative dot plots showing IL‐17A (A) or IL‐17F (D) and IFNγ production in γδ T cells before (steady state) and after IMQ‐induced psoriasis. Numbers in gate indicate % positive cells; numbers outside the gate indicate mean fluorescence intensity of IL‐17A or IL‐17F. (B, E) Frequency of IL‐17A+ (B) and IL‐17F+ (E) γδ T cells before (steady state) and after IMQ‐induced psoriasis. (C, F) Quantification of mean fluorescence intensity (MFI) of IL‐17A (C) and IL‐17F (F) staining in γδ T cells after IMQ‐induced psoriasis (each color represents a different experiment). In (A‐C) steady state: n = 8; 4 experiments, IMQ: n = 11–12; 4 experiments. In (D‐F) steady state: n = 6; 3 experiments, IMQ: n = 8; 3 experiments. In (C) ***P < 0.001 with 2‐way ANOVA, in (F) *P < 0.05 with Mann‐Whitney or ***P < 0.001 with 2‐way ANOVA.
-
G, HFrequency of IL‐17A+ (G) and IL‐17F+ γδ T (H) cells or IL‐17A (G) and IL‐17F (H) MFI following culture with IL‐1β, IL‐23, or nothing. Each symbol represents one experiment. Open circles = Cre+ (each color represents a different culture condition).
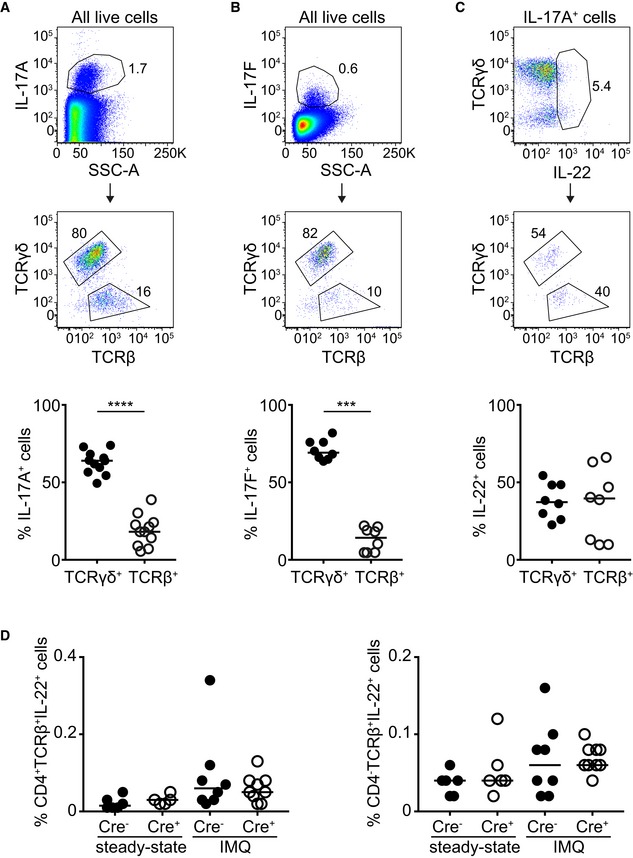
The lower frequency of IL‐17A/F+ cells that we observed in RORγtCRE‐STAT3F/F mice could be explained by the diminished expansion of STAT3‐deficient γδT17 cells (Fig 1A and B). Thus, we measured mean fluorescence intensity (MFI) of IL‐17A and IL‐17F as a means to express protein levels on a per cell basis. We found that both IL‐17A (Fig 3C) and IL‐17F (Fig 3F) were significantly reduced in the absence of STAT3, suggesting that while at steady‐state IL‐17A and IL‐17F secretion is independent of STAT3, γδT17 cells require STAT3 in order to increase IL‐17A/F production during inflammation. Because IL‐17A/F can be produced by cells other than γδT17, particularly αβ T cells, and because αβ T cells can respond to IMQ (Fig EV4A–C), we assessed the relative contribution of TCRγδ+ and TCRβ+ cells to IL‐17A/F production in IMQ‐treated mice. By pre‐gating on all IL‐17A+ or on all IL‐17F+ cells, we showed that the significant majority was of the γδ T‐cell lineage (Fig EV5A and B), further underpinning the important role of γδT17 cells in this model.
Figure EV5. Contribution of γδ and αβ T cells toward production of IL‐17A, IL‐17F, and IL‐22 during IMQ‐induced inflammation.
-
A, BFrequency of IL‐17A+ (A) or IL‐17F+ (B) cells that are either TCRγδ+ or TCRβ+ within the total IL‐17A‐ or IL‐17F‐producing population.
-
CFrequency of IL‐22+ cells that are either TCRγδ+ or TCRβ+ within the total IL‐17A‐producing population.
-
DFrequency of CD4+ and CD4− IL‐22+ T cells in RORγtCRE‐STAT3F/F (Cre+) and littermate control mice (Cre−) at steady state or after IMQ treatment.
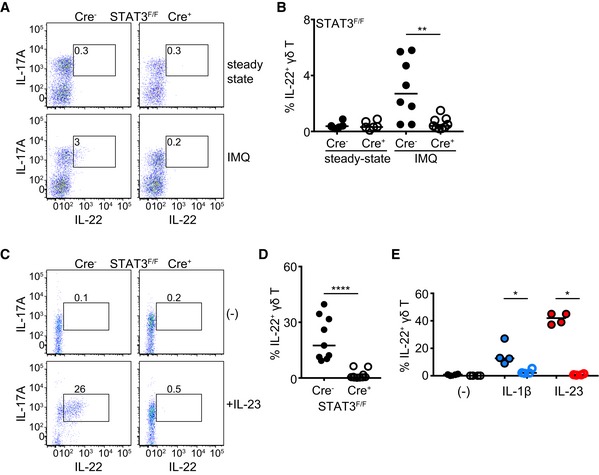
Although IL‐22 could not be detected at steady state by flow cytometry, its levels were measurable during IMQ‐induced inflammation. Deficiency in STAT3 resulted in no production of IL‐22 (Fig 4A and B). In contrast to IL‐17A/F, the contribution of TCRγδ+ and TCRβ+ cells during IMQ‐induced inflammation was comparable (Fig EV5C); however, we could not detect a difference in the frequency of CD4+IL‐22+TCRβ+ or CD4−IL‐22+TCRβ+ cells between RORγtCRE‐STAT3F/F and littermate control mice (Fig EV5D). Due to the scarcity of IL‐22+ cells, the mean fluorescence intensity of IL‐22 staining could not be reliably calculated as the technical variability of fluorescence signals obscured accurate assessment of biological differences. In addition to inflammation, IL‐22 could be induced ex vivo by IL‐23 and IL‐1β. However, STAT3‐deficient γδT17 cells failed to secrete IL‐22 in response to IL‐23 (Fig 4C and D), suggesting that in this lymphocytic population, IL‐23‐driven production of IL‐22 is STAT3‐dependent. IL‐1β‐mediated induction of IL‐22 was also partly dependent on intact STAT3 (Fig 4E).
Figure 4. STAT3 is necessary for IL‐22 production by γδT17 cells.
-
A, BRepresentative dot plots showing IL‐22 and IL‐17A production in γδ T cells (A) and frequency of IL‐22+ γδ T cells (B) before (steady state) and after IMQ‐induced psoriasis. Steady state: n = 6; 3 experiments, IMQ: n = 8–9; 3 experiments.
-
C, DRepresentative dot plots showing IL‐22 and IL‐17A production in γδ T cells (C) and frequency of IL‐22+ γδ T cells (D) following culture without (−) or with 40 ng/ml recombinant IL‐23 (n = 9–10, 3 experiments).
-
EFrequency of IL‐22+ γδ T cells following culture with IL‐1β, IL‐23, or nothing. Each symbol represents one experiment. Open circles = Cre+ (each color represents a different culture condition).
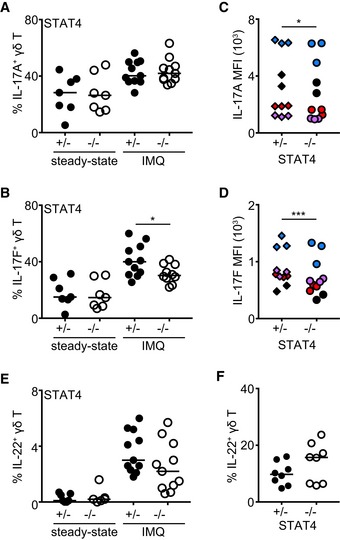
Similar to RORγtCRE‐STAT3F/F mice, γδT17 cells from STAT4−/− mice produced normal levels of IL‐17A/F at steady state (Fig 5A and B). Production of IL‐17A was not different between control and STAT4‐deficient γδT17 cells during inflammation (Fig 5A), although there was a small but statistically significant reduction in IL‐17A MFI in the absence of STAT4 (Fig 5C). As opposed to IL‐17A, both the frequency of IL‐17F+ γδT17 cells and their levels of IL‐17F protein depended on intact STAT4 signaling (Fig 5B and D), suggesting that γδT17‐associated production of IL‐17F is coregulated by STAT3 and STAT4. Secretion of IL‐22 by γδT17 cells during inflammation or following ex vivo IL‐23 stimulation was not affected by STAT4 deficiency (Fig 5E and F). These data suggest that although STAT4 is not required for γδT17‐induced inflammation, it is important for their ability to produce optimal levels of cytokines.
Figure 5. Regulation of cytokine production by STAT4.
-
AFrequency of IL‐17A+ (A) γδ T cells before (steady state) and after IMQ‐induced psoriasis.
-
BFrequency of IL‐17F+ γδ T cells before (steady state) and after IMQ‐induced psoriasis.
-
CQuantification of mean fluorescence intensity (MFI) of IL‐17A staining in γδ T cells after IMQ‐induced psoriasis.
-
DQuantification of mean fluorescence intensity (MFI) of IL‐17F staining in γδ T cells after IMQ‐induced psoriasis.
-
EFrequency of IL‐22+ γδ T cells before (steady state) and after IMQ‐induced psoriasis.
-
FFrequency of IL‐22+ γδ T cells following culture without (−) or with 40 ng/ml recombinant IL‐23.
The presence of innate IL‐17‐producing lymphocytes such as γδT17 or group 3 innate lymphoid cells in mice and humans 41, 42 during inflammation is well documented for many disease states. Although they share functional similarities with their adaptive T‐cell counterparts, innate lymphocytes do not require antigen‐driven lineage differentiation and are hardwired to express genes associated with effector function 43. STAT transcription factors integrate a plethora of cytokine and growth factor receptor signals and are thus involved in both lineage commitment and functional heterogeneity. Therefore, targeted regulation of JAK/STAT signaling can have significant therapeutic outcomes for inflammation, as shown by the presence of a number of small molecule inhibitors that target different JAK and STAT molecules and are FDA‐approved or in clinical trials 44. Our data demonstrate a dichotomy of the role that STAT3 and STAT4 have in γδT17 cells during inflammation. While STAT3 is essential for the activation and pathogenicity of γδT17 cells, STAT4 contributes only to their cytokine production with no impact on pathogenicity. This is suggestive that in a therapeutic setting, inhibition of STAT3 will target both γδT17 and TH17 cells, while STAT4 inhibition maybe selective to TH17. Collectively, our data reveal the importance of STAT3 in sustaining skin γδT17 cell homeostasis and in directing their pathogenicity and identify the role of STAT4 in γδT17 cells.
Materials and Methods
Mice
All animal breeding and experiments were performed in house and only after approval from the Danish Animal Experiments Inspectorate. RORγtCRE mice were provided by Gerard Eberl (Pasteur Institute, Paris, France) 32. STAT3F/F mice were purchased from the Jackson Laboratory and bred in house (Stock number: 016923). STAT4−/− mice were from the Jackson Laboratory (Stock number: 028526), were provided by Mathias Müller (University of Veterinary Medicine, Vienna, Austria), and bred as heterozygous to obtain homozygous and heterozygous littermate controls. ROSA26‐STOPflox‐RFP mice were from the Swiss Immunological Mouse Repository (SwImMR).
IMQ‐induced psoriasis and histology
To induce psoriasis, mice were anesthetized using isoflurane and 10 mg of 5% Aldara™ cream (MEDA) was applied daily for 7 days at the dorsal side of both ears. For histology, ear tissue was fixed in 10% formalin overnight and paraffin‐embedded sections were H&E‐stained.
Cell preparation and culture
Auricular and cervical LNs were dissected out, cleaned of fat, and crushed through a 70‐μm strainer. The resulting cell suspension was washed once, before being re‐suspended in culture media (RPMI containing 10% FBS, penicillin/streptomycin, 0.1% β‐ME, 20 mM HEPES, and l‐glutamine) (media and supplements from Thermo Fisher), and filtered through a 40‐μm strainer. Cells were then counted on a SYSMEX cell counter and re‐suspended at a density of 107/ml of which 2.5 × 10⁶ were used for subsequent flow cytometry experiments. To detect cytokines, 5 × 10⁶ cells per ml were cultured for 3.5 h with 50 ng/ml PMA, 750 ng/ml ionomycin, and 1 μl/ml GolgiStop™ (BD). In some cases, cells were cultured overnight with 40 ng/ml recombinant mouse IL‐23 (R&D Systems) or 20 ng/ml recombinant mouse IL‐1β (R&D Systems) before staining.
Skin lymphocytes were prepared from mouse ears by separating the dorsal from ventral sides and then they were cut into small pieces and digested in culture media with 0.25 mg/ml collagenase IV, 0.166 mg/ml hyaluronidase, and 0.1 mg/ml DNase I (all enzymes from Sigma‐Aldrich) for 1 h at 37°C while stirring at 700 rpm. Undigested tissue was crushed through a 70‐μm strainer, and the cell suspension was washed, re‐suspended in culture media, and filtered through a 40‐μm strainer.
Flow cytometry
Cells were stained in U‐bottom 96‐well plates in 75 μl PBS containing 3% FBS with combinations of the following antibodies: CD4‐FITC (RM4‐4), CD19‐FITC (6D5), CD8‐FITC (53‐6.7), TCRβ‐APCeF780 (H57‐597; eBioscience), TCRγδ‐BV421 (GL3), CD44‐V500 (IM7), CCR6‐AF647 (140706), Vγ4‐PerCPeF710 (UC3‐10A6), CD27‐PECy7 (LG.3A10), Vγ5‐FITC (536), CD3‐PE (145‐2C11; BioLegend), CD45‐V500 (30‐F11), IL‐17A‐BV786 (TC11‐18H10), IL‐17F‐PECF594 (O79‐289), IL‐22‐PE (1H8PWSR; eBioscience), IFNγ‐APC (XMG1.2; BioLegend), CD3‐PECF594 (145‐2C11), and CD4‐BUV395 (RM4‐5). Cells were stained for 30 min on ice, and all antibodies were used at a 2 × 10⁻² dilution. Prior to antibody staining, cells were incubated with 100 μl PBS containing 10−3 diluted fixable viability dye AF700 for 10 min on ice. Cells were washed in 150 μl PBS containing 3% FBS in‐between steps. For intracellular cytokine staining, the cells were fixed and permeabilized by incubation in BD Fix/Perm solution for 15 min at room temperature followed by washing once in BD Perm/Wash solution. Intracellular cytokines were stained in BD Perm/Wash for 15 min at room temperature. Unless specified all antibodies and staining reagents were purchased from BD Biosciences. Samples were acquired on a BD LSR Fortessa™ using BD FACSDiva software v8.0.2.
Data analysis and software
Flow cytometry data were analyzed using Flow Jo v9.8.3 or v10. H&E sections were photographed on an Olympus BX45 microscope at 10× magnification with an Olympus UC30 camera. Epidermal thickening was measured using Olympus cellSens Entry 2.1 software.
Statistical analysis
All graphs were generated, and statistical analyses were performed using Prism v8. We used unpaired non‐parametric Mann–Whitney U‐test and paired t‐test for all statistical analyses. To correct for the technical variations of MFI (mean fluorescent intensity) measurement between experiments, we used a 2‐way ANOVA test in R that was defined as such: lm(MFI ~ Var1 + Var2, data = data), where Var1 represents the experiment and Var2 represents the experimental condition as previously described 25. In graphs, only statistically significant differences are denoted.
Author contributions
VB conceived the study, performed experiments, and wrote the manuscript. RA and JR performed experiments and wrote the manuscript. MTV performed experiments.
Conflict of interest
The authors declare that they have no conflict of interest.
Supporting information
Expanded View Figures PDF
Review Process File
Acknowledgements
We would like to thank Mathias Müller (University of Veterinary Medicine, Vienna, Austria) and Gerard Eberl (Pasteur, Paris, France) for their generosity in providing us with mice and Jørgen S. Agerholm (Copenhagen University, Denmark) for assistance with microscopy. This work and VB were supported by the Lundbeck Foundation grant R163‐2013‐15201. J.R. and R.A. were supported by DTU PhD scholarships.
EMBO Reports (2019) 20: e48647
References
- 1. Kicinska A, Leluk J, Jarmuszkiewicz W (2014) Acanthamoeba castellanii STAT protein. PLoS ONE 9: e111345 [DOI] [PMC free article] [PubMed] [Google Scholar]
- 2. Gorissen M, de Vrieze E, Flik G, Huising MO (2011) STAT genes display differential evolutionary rates that correlate with their roles in the endocrine and immune system. J Endocrinol 209: 175–184 [DOI] [PubMed] [Google Scholar]
- 3. O'Shea JJ, Schwartz DM, Villarino AV, Gadina M, McInnes IB, Laurence A (2015) The JAK‐STAT pathway: impact on human disease and therapeutic intervention. Annu Rev Med 66: 311–328 [DOI] [PMC free article] [PubMed] [Google Scholar]
- 4. Bettelli E, Carrier Y, Gao W, Korn T, Strom TB, Oukka M, Weiner HL, Kuchroo VK (2006) Reciprocal developmental pathways for the generation of pathogenic effector TH17 and regulatory T cells. Nature 441: 235–238 [DOI] [PubMed] [Google Scholar]
- 5. McGeachy MJ, Chen Y, Tato CM, Laurence A, Joyce‐Shaikh B, Blumenschein WM, McClanahan TK, O'Shea JJ, Cua DJ (2009) The interleukin 23 receptor is essential for the terminal differentiation of interleukin 17‐producing effector T helper cells in vivo . Nat Immunol 10: 314–324 [DOI] [PMC free article] [PubMed] [Google Scholar]
- 6. Wei L, Laurence A, Elias KM, O'Shea JJ (2007) IL‐21 is produced by Th17 cells and drives IL‐17 production in a STAT3‐dependent manner. J Biol Chem 282: 34605–34610 [DOI] [PMC free article] [PubMed] [Google Scholar]
- 7. Laurence A, Tato CM, Davidson TS, Kanno Y, Chen Z, Yao Z, Blank RB, Meylan F, Siegel R, Hennighausen L et al (2007) Interleukin‐2 signaling via STAT5 constrains T helper 17 cell generation. Immunity 26: 371–381 [DOI] [PubMed] [Google Scholar]
- 8. Durant L, Watford WT, Ramos HL, Laurence A, Vahedi G, Wei L, Takahashi H, Sun HW, Kanno Y, Powrie F et al (2010) Diverse targets of the transcription factor STAT3 contribute to T cell pathogenicity and homeostasis. Immunity 32: 605–615 [DOI] [PMC free article] [PubMed] [Google Scholar]
- 9. Yang XO, Panopoulos AD, Nurieva R, Chang SH, Wang D, Watowich SS, Dong C (2007) STAT3 regulates cytokine‐mediated generation of inflammatory helper T cells. J Biol Chem 282: 9358–9363 [DOI] [PubMed] [Google Scholar]
- 10. Harris TJ, Grosso JF, Yen HR, Xin H, Kortylewski M, Albesiano E, Hipkiss EL, Getnet D, Goldberg MV, Maris CH et al (2007) Cutting edge: an in vivo requirement for STAT3 signaling in TH17 development and TH17‐dependent autoimmunity. J Immunol 179: 4313–4317 [DOI] [PubMed] [Google Scholar]
- 11. Ghoreschi K, Laurence A, Yang XP, Tato CM, McGeachy MJ, Konkel JE, Ramos HL, Wei L, Davidson TS, Bouladoux N et al (2010) Generation of pathogenic T(H)17 cells in the absence of TGF‐beta signalling. Nature 467: 967–971 [DOI] [PMC free article] [PubMed] [Google Scholar]
- 12. Lee PW, Smith AJ, Yang Y, Selhorst AJ, Liu Y, Racke MK, Lovett‐Racke AE (2017) IL‐23R‐activated STAT3/STAT4 is essential for Th1/Th17‐mediated CNS autoimmunity. JCI Insight 2: 91663 [DOI] [PMC free article] [PubMed] [Google Scholar]
- 13. Watford WT, Hissong BD, Bream JH, Kanno Y, Muul L, O'Shea JJ (2004) Signaling by IL‐12 and IL‐23 and the immunoregulatory roles of STAT4. Immunol Rev 202: 139–156 [DOI] [PubMed] [Google Scholar]
- 14. Vahedi G, Takahashi H, Nakayamada S, Sun HW, Sartorelli V, Kanno Y, O'Shea JJ (2012) STATs shape the active enhancer landscape of T cell populations. Cell 151: 981–993 [DOI] [PMC free article] [PubMed] [Google Scholar]
- 15. Zhu J, Jankovic D, Oler AJ, Wei G, Sharma S, Hu G, Guo L, Yagi R, Yamane H, Punkosdy G et al (2012) The transcription factor T‐bet is induced by multiple pathways and prevents an endogenous Th2 cell program during Th1 cell responses. Immunity 37: 660–673 [DOI] [PMC free article] [PubMed] [Google Scholar]
- 16. Papotto PH, Ribot JC, Silva‐Santos B (2017) IL‐17+ gammadelta T cells as kick‐starters of inflammation. Nat Immunol 18: 604–611 [DOI] [PubMed] [Google Scholar]
- 17. Haas JD, Ravens S, Duber S, Sandrock I, Oberdorfer L, Kashani E, Chennupati V, Fohse L, Naumann R, Weiss S et al (2012) Development of interleukin‐17‐producing gammadelta T cells is restricted to a functional embryonic wave. Immunity 37: 48–59 [DOI] [PubMed] [Google Scholar]
- 18. Kadekar D, Agerholm R, Rizk J, Neubauer H, Suske T, Maurer B, Torrellas VM, Comelli E, Taibi A, Moriggl R et al (2019) The neonatal microenvironment programs conventional and intestinal Tbet+ γδT17 cells through the transcription factor STAT5. bioRxiv, 10.1101/658542 [PREPRINT] [DOI] [PMC free article] [PubMed] [Google Scholar]
- 19. Malhotra N, Narayan K, Cho OH, Sylvia KE, Yin C, Melichar H, Rashighi M, Lefebvre V, Harris JE, Berg LJ et al (2013) A network of high‐mobility group box transcription factors programs innate interleukin‐17 production. Immunity 38: 681–693 [DOI] [PMC free article] [PubMed] [Google Scholar]
- 20. Zuberbuehler MK, Parker ME, Wheaton JD, Espinosa JR, Salzler HR, Park E, Ciofani M (2019) The transcription factor c‐Maf is essential for the commitment of IL‐17‐producing gammadelta T cells. Nat Immunol 20: 73–85 [DOI] [PMC free article] [PubMed] [Google Scholar]
- 21. Cho JS, Pietras EM, Garcia NC, Ramos RI, Farzam DM, Monroe HR, Magorien JE, Blauvelt A, Kolls JK, Cheung AL et al (2010) IL‐17 is essential for host defense against cutaneous Staphylococcus aureus infection in mice. J Clin Invest 120: 1762–1773 [DOI] [PMC free article] [PubMed] [Google Scholar]
- 22. Marchitto MC, Dillen CA, Liu H, Miller RJ, Archer NK, Ortines RV, Alphonse MP, Marusina AI, Merleev AA, Wang Y et al (2019) Clonal Vgamma6(+)Vdelta4(+) T cells promote IL‐17‐mediated immunity against Staphylococcus aureus skin infection. Proc Natl Acad Sci USA 116: 10917–10926 [DOI] [PMC free article] [PubMed] [Google Scholar]
- 23. Cai Y, Shen X, Ding C, Qi C, Li K, Li X, Jala VR, Zhang HG, Wang T, Zheng J et al (2011) Pivotal role of dermal IL‐17‐producing gammadelta T cells in skin inflammation. Immunity 35: 596–610 [DOI] [PMC free article] [PubMed] [Google Scholar]
- 24. Michel ML, Pang DJ, Haque SF, Potocnik AJ, Pennington DJ, Hayday AC (2012) Interleukin 7 (IL‐7) selectively promotes mouse and human IL‐17‐producing gammadelta cells. Proc Natl Acad Sci USA 109: 17549–17554 [DOI] [PMC free article] [PubMed] [Google Scholar]
- 25. Bekiaris V, Sedy JR, Macauley MG, Rhode‐Kurnow A, Ware CF (2013) The inhibitory receptor BTLA controls gammadelta T cell homeostasis and inflammatory responses. Immunity 39: 1082–1094 [DOI] [PMC free article] [PubMed] [Google Scholar]
- 26. Heilig JS, Tonegawa S (1986) Diversity of murine gamma genes and expression in fetal and adult T lymphocytes. Nature 322: 836–840 [DOI] [PubMed] [Google Scholar]
- 27. Cai Y, Xue F, Fleming C, Yang J, Ding C, Ma Y, Liu M, Zhang HG, Zheng J, Xiong N et al (2014) Differential developmental requirement and peripheral regulation for dermal Vgamma4 and Vgamma6T17 cells in health and inflammation. Nat Commun 5: 3986 [DOI] [PMC free article] [PubMed] [Google Scholar]
- 28. Sutton CE, Lalor SJ, Sweeney CM, Brereton CF, Lavelle EC, Mills KH (2009) Interleukin‐1 and IL‐23 induce innate IL‐17 production from gammadelta T cells, amplifying Th17 responses and autoimmunity. Immunity 31: 331–341 [DOI] [PubMed] [Google Scholar]
- 29. Petermann F, Rothhammer V, Claussen MC, Haas JD, Blanco LR, Heink S, Prinz I, Hemmer B, Kuchroo VK, Oukka M et al (2010) gammadelta T cells enhance autoimmunity by restraining regulatory T cell responses via an interleukin‐23‐dependent mechanism. Immunity 33: 351–363 [DOI] [PMC free article] [PubMed] [Google Scholar]
- 30. Riol‐Blanco L, Lazarevic V, Awasthi A, Mitsdoerffer M, Wilson BS, Croxford A, Waisman A, Kuchroo VK, Glimcher LH, Oukka M (2010) IL‐23 receptor regulates unconventional IL‐17‐producing T cells that control bacterial infections. J Immunol 184: 1710–1720 [DOI] [PMC free article] [PubMed] [Google Scholar]
- 31. Shibata K, Yamada H, Sato T, Dejima T, Nakamura M, Ikawa T, Hara H, Yamasaki S, Kageyama R, Iwakura Y et al (2011) Notch‐Hes1 pathway is required for the development of IL‐17‐producing gammadelta T cells. Blood 118: 586–593 [DOI] [PubMed] [Google Scholar]
- 32. Lochner M, Peduto L, Cherrier M, Sawa S, Langa F, Varona R, Riethmacher D, Si‐Tahar M, Di Santo JP, Eberl G (2008) In vivo equilibrium of proinflammatory IL‐17+ and regulatory IL‐10+ Foxp3+ RORgamma t+ T cells. J Exp Med 205: 1381–1393 [DOI] [PMC free article] [PubMed] [Google Scholar]
- 33. Moh A, Iwamoto Y, Chai GX, Zhang SS, Kano A, Yang DD, Zhang W, Wang J, Jacoby JJ, Gao B et al (2007) Role of STAT3 in liver regeneration: survival, DNA synthesis, inflammatory reaction and liver mass recovery. Lab Invest 87: 1018–1028 [DOI] [PubMed] [Google Scholar]
- 34. Haas JD, Gonzalez FH, Schmitz S, Chennupati V, Fohse L, Kremmer E, Forster R, Prinz I (2009) CCR34 and NK1.1 distinguish between IL‐17A and IFN‐gamma‐producing gammadelta effector T cells. Eur J Immunol 39: 3488–3497 [DOI] [PubMed] [Google Scholar]
- 35. Ribot JC, deBarros A, Pang DJ, Neves JF, Peperzak V, Roberts SJ, Girardi M, Borst J, Hayday AC, Pennington DJ et al (2009) CD27 is a thymic determinant of the balance between interferon‐gamma‐ and interleukin 17‐producing gammadelta T cell subsets. Nat Immunol 10: 427–436 [DOI] [PMC free article] [PubMed] [Google Scholar]
- 36. van der Fits L, Mourits S, Voerman JS, Kant M, Boon L, Laman JD, Cornelissen F, Mus AM, Florencia E, Prens EP et al (2009) Imiquimod‐induced psoriasis‐like skin inflammation in mice is mediated via the IL‐23/IL‐17 axis. J Immunol 182: 5836–5845 [DOI] [PubMed] [Google Scholar]
- 37. Sandrock I, Reinhardt A, Ravens S, Binz C, Wilharm A, Martins J, Oberdorfer L, Tan L, Lienenklaus S, Zhang B et al (2018) Genetic models reveal origin, persistence and non‐redundant functions of IL‐17‐producing gammadelta T cells. J Exp Med 215: 3006–3018 [DOI] [PMC free article] [PubMed] [Google Scholar]
- 38. Pantelyushin S, Haak S, Ingold B, Kulig P, Heppner FL, Navarini AA, Becher B (2012) Rorgammat+ innate lymphocytes and gammadelta T cells initiate psoriasiform plaque formation in mice. J Clin Invest 122: 2252–2256 [DOI] [PMC free article] [PubMed] [Google Scholar]
- 39. Cai Y, Xue F, Qin H, Chen X, Liu N, Fleming C, Hu X, Zhang HG, Chen F, Zheng J et al (2019) Differential roles of the mTOR‐STAT3 signaling in dermal gammadelta T cell effector function in skin inflammation. Cell Rep 27: 3034–3048 e3035 [DOI] [PMC free article] [PubMed] [Google Scholar]
- 40. Siegemund S, Shepherd J, Xiao C, Sauer K (2015) hCD2‐iCre and Vav‐iCre mediated gene recombination patterns in murine hematopoietic cells. PLoS ONE 10: e0124661 [DOI] [PMC free article] [PubMed] [Google Scholar]
- 41. Venken K, Jacques P, Mortier C, Labadia ME, Decruy T, Coudenys J, Hoyt K, Wayne AL, Hughes R, Turner M et al (2019) RORgammat inhibition selectively targets IL‐17 producing iNKT and gammadelta‐T cells enriched in Spondyloarthritis patients. Nat Commun 10: 9 [DOI] [PMC free article] [PubMed] [Google Scholar]
- 42. Cua DJ, Tato CM (2010) Innate IL‐17‐producing cells: the sentinels of the immune system. Nat Rev Immunol 10: 479–489 [DOI] [PubMed] [Google Scholar]
- 43. Shih HY, Sciume G, Mikami Y, Guo L, Sun HW, Brooks SR, Urban JF Jr, Davis FP, Kanno Y, O'Shea JJ (2016) Developmental acquisition of regulomes underlies innate lymphoid cell functionality. Cell 165: 1120–1133 [DOI] [PMC free article] [PubMed] [Google Scholar]
- 44. Schwartz DM, Kanno Y, Villarino A, Ward M, Gadina M, O'Shea JJ (2017) JAK inhibition as a therapeutic strategy for immune and inflammatory diseases. Nat Rev Drug Discovery 16: 843–862 [DOI] [PubMed] [Google Scholar]
Associated Data
This section collects any data citations, data availability statements, or supplementary materials included in this article.
Supplementary Materials
Expanded View Figures PDF
Review Process File


