

Abstract
Polo-like kinase 1 (PLK1), the most investigated member of the PLK family, plays a pivotal role both in the p53-mediated regulation of DNA damage repair and in mitosis, especially in the G2/M phase. However, the evidence on the clinical and prognostic relevance of PLK1 is limited to triple negative subtype among breast cancer (BC). We hypothesized that high expression of PLK1 is associated with TP53 inactivation, DNA repair deficiency, and worse prognosis in ER positive in BC in a large-scale cohort should clarify its clinical relevance for each BC subtype. Total of 3173 BC cases; 1025 from TCGA cohort, 1904 from METABRIC, and 244 from neoadjuvant chemotherapy (NAC) cohort from Gene Expression Omnibus dataset, GSE32603, were analyzed. PLK1 expressions were significantly higher in high Nottingham Grade and triple negative BC. High expression of PLK1 was significantly associated with TP53 mutation, high expression of TP53 mRNA as well as protein, and it significantly correlated with the homologous recombination deficiency score. High PLK1 expression significantly enriched cell cycle related gene sets (G2/M check point, E2F targets), MTORC1 signaling, and MYC target gene sets in the Gene Set Enrichment Analysis. High expression of PLK1 was significantly associated with tumor infiltrating lymphocytes and tumor associated macrophages (high levels of CD8+ T cells, M0 and M1 macrophage, and low levels of M2 macrophage), and high immune cytolytic activity. While high expression of PLK1 did not associate with pathological complete response after NAC, it was associated with poor prognosis in the whole cohort and in the ER-positive/HER2-negative subtype of TCGA. High expression of PLK1 is significantly associated with TP53 mutations, DNA repair deficiency and worse prognosis in BC particularly in HR+HER2- subtype. Using bioinformatics methods with large cohorts.
Keywords: PLK1, breast cancer subtypes, TP53, cell cycle, homologous recombination deficiency, worse prognosis
Introduction
Breast cancer (BC) is the most frequently occurring cancer in women representing 1.68 million new cases and a half million deaths worldwide annually [1]. The survival rate of women with BC has improved with the development of systemic treatments (endocrine therapy, chemotherapy, and targeted therapy) based on the BC subtypes: luminal A, luminal B, human epidermal growth factor receptor 2 (HER2)-enriched, and triple negative BC (TNBC) [2].
Polo-like kinase 1 (PLK1), the most investigated member of the PLK family, has emerged as crucial new player in both the regulation of DNA damage repair mediated by TP53, Rad51, and BRCA1 and in mitosis [3-8]. In particular, PLK1 has been demonstrated to be tightly regulated by TP53, an established tumor suppressor that controls cell proliferation through induction of DNA repair, cell cycle arrest, and apoptosis as part of the G2/M cell cycle checkpoint [9]. Given these critical roles, it is no surprise that high expression of PLK1 is observed in BC as well as a variety of other cancers [10-12]. A recent meta-analysis of BC cohorts revealed that tumors with high PLK1 expression were significantly associated with mutant and high expression of TP53, larger tumor size, lymph node metastasis, and higher pathological grades. The same meta-analysis demonstrated that PLK1-high BC was significantly associated with diminished disease free survival (DFS), disease specific survival, and overall survival (OS) [12]. These results suggest that high expression of PLK1 could represent a biomarker for aggressive progression and poor prognosis in BC. Furthermore, controlling the overexpression of PLK1, has been shown to inhibit the progression of cancer and restore drug susceptibility [13]. Indeed, multiple PLK inhibitors, such as BI 2536, a first-in-class prototype PLK1 inhibitor, and GSK461364, a selective thiophene amide inhibitor of PLK1, are in development as possible treatments for a variety of cancers [14].
Functional analysis of PLK1 and the development of PLK inhibitors are currently limited to TNBC because PLK1-high tumors were more closely associated with estrogen receptor (ER)-negative tumors and high-grade TNBC tumors than the other BC subtypes [12,15-17]. Most previous studies that have shown differences in the clinical role of PLK1 for each BC subtype have been demonstrated in a relatively small number of patient samples. Thus, in order to better illustrate the clinical relevance of PLK1 in each BC subtype, validation with larger clinical cohorts is needed. To address this limitation, we utilized The Cancer Genome Atlas (TCGA) and Molecular Taxonomy of Breast Cancer International Consortium (METABRIC), two of the largest collections of genomic cancer data, possessing both genetic and molecular information for over 1000 BC cases with full clinical profiles and survival data [18-21].
Materials and methods
Data acquisition
TCGA was supervised by the National Cancer Institute (NCI) and the National Human Genome Research Institute [22]. Gene expression levels (mRNA expression z-score from RNA-sequence), copy-number alteration data, mutation data, and protein expression levels (protein z-score from reverse phase protein array (RPPA)) from Genomic Identification of Significant Targets in Cancer for TCGA cohort were downloaded through cBioportal (TCGA provisional dataset, 2015) [18,19]. Out of 1098 BC patients, 1025 women with BC had both PLK1 mRNA expression from RNA sequence and OS data in the BC cohort of TCGA. The Nottingham Grade was calculated based on tubule formation, nuclear pleomorphism, and mitotic count, which were obtained from the TIE database containing pathology reports of TCGA BC cohort patients. The METABRIC cohort (2012 & 2016, n=1,904) was used to confirm the association between PLK1 mRNA expression and OS in TCGA [20,21]. A GEO dataset, GSE32603, was used to examine the association between PLK1 mRNA expression and response to anthracycline-based chemotherapy in patients treated with neoadjuvant chemotherapy (NAC) [23]. Microarray gene expression data in the GEO datasets was queried from sources at the National Center for Biotechnology Information (NCBI).
Gene set enrichment analyses (GSEA)
GSEA was performed comparing high and low PLK1 mRNA expressing tumors among hallmark gene sets using software provided by the Broad Institute (http://software.broadinstitute.org/gsea/index.jsp), as we described previously [24-26].
Homologous recombination deficiency (HRD) score
A previously developed scoring system to evaluate the HRD score was also utilized [27,28]. HRD score is a measure quantifying defects in homologous recombination that includes 3 separate metrics of genomic scarring: large (>15 Mb) non-arm-level regions with loss of heterozygosity, large-scale state transitions (breaks between adjacent segments of >10 Mb), and subtelomeric regions with allelic imbalance.
A CIBERSORT deconvolution algorithm
The CIBERSORT deconvolution algorithm was used to estimate the fraction of 22 immune cell types in each tumor tissue to evaluate intra-tumor immune cell composition [29]. These twenty-two cell fractions were calculated via the online calculator (https://cibersort.stanford.edu/) as previously shown [30].
The immune cytolytic activity (CYT) score
CYT was defined as the geometric mean of GZMA and PRF1 expression values in Transcripts Per Million (TPM). Gene expression data was obtained in RSEM format from the Genomic Data Common data and converted to TPM by a given gene’s estimated fraction of transcripts and multiplying with 10^6 [31,32]. CYT was calculated as previously described [30].
Statistical analysis
All statistical analyses were performed using R software (http:///www.r-project.org/) and Bioconductor (http://bioconductor.org/). The chi-square test or Fisher’s exact test or the nonparametric Mann-Whitney U test and contingency analysis were used to assess baseline differences between binary variables. Correlations were calculated using Spearman’s rank correlation coefficient. In the analysis of OS, the Kaplan-Meier method was used to estimate survival rates, and differences between survival curves were evaluated by the log-rank test. Cox’s proportional hazards model was used for the univariate and multivariate analysis of prognostic status. Two-sided P values <0.05 was considered as statistically significant for all tests. In GSEA, the significance of each pathway was classified by a threshold of normalized enrichment score (NES) >2 or <-2 and false discovery rate (FDR) q-value <0.01.
Results
Association of PLK1 mRNA expression with clinical features in two breast cancer cohorts
A total of 1025 women with BC in the TCGA cohort and a total of 1904 women with BC in the METABRIC cohort in which PLK1 mRNA expression was available were analyzed. The features of PLK1 mRNA expression in TCGA BC cohort is shown in Figure 1A. The median PLK1 mRNA expression z-scores were -0.18 in whole cohort. PLK1 mRNA expression was higher in TN and HER2+BC, compared with hormone receptor (HR)+HER2-BC. We examined the relationship between copy number and mRNA expression of PLK1. We defined the status of PLK1 copy number as amplification (≥2, n=3), gain (<2, ≥1, n=69), and normal (<1, n=953). However, we could not find the relationship among them.
Figure 1.

Analysis of PLK1 expression and relationship between PLK1 and TP53 in breast cancer. A. Box plots of PLK1 mRNA expression in whole cohort and subtype and the relationship between PLK1 mRNA expression and PLK1 copy number. B-D. Box plots of and PLK1 mRNA expression with mutation vs wild type of TP53; B. And TP53 mRNA expression; C. And protein; D. With high vs. low expression of PLK1 in whole cohort and subtype, the HR+HER2- group, the HER2+ group, and the TN group. High PLK1 mRNA expression was defined as ≥75th percentile of PLK1 mRNA expression. ****means P<0.0001 and ***means P<0.001. Abbreviations: HR, hormone receptor; HER2, human epidermal growth receptor 2, TN, triple negative; K-W, Kruskal-Wallis; NS, not significant; WT, wild type; MT, mutation.
We defined PLK1 mRNA expression of more than 75th percentile of as high PLK1 expression, which was the top 25.1% (257/1025) in TCGA cohort and 25% (476/1904) in METABRIC cohort. Our cut-off point was defined following another study which utilized TCGA [33]. Table 1 demonstrates the clinical and pathological features of high and low PLK1 mRNA expression in the two large BC cohorts, TCGA and METABRIC. In TCGA, high expression of PLK1 mRNA was significantly associated with elderly patients (P=0.037), African American ethnicity (P<0.0001), invasive ductal carcinoma (P<0.001), higher Nottingham Grade (P<0.0001), negative ER (P<0.0001), negative progesterone receptor (PR) (P<0.0001), and TN (P<0.0001). Interestingly, PLK1 mRNA expression was undetectable in Luminal A, which is known to be the least aggressive BC subtype. There was no significant relationship between PLK1 mRNA expression and menopausal state, tumor size, lymph node metastasis, clinical stage, or HER2 status. In the METABRIC BC cohort, high expression of PLK1 mRNA was significantly associated with young patients (P<0.0001), pre-menopausal state (P<0.0001), larger tumor size (P<0.0001), nodal metastasis (P=0.018), invasive ductal carcinoma (P<0.001), higher Nottingham Grade (P<0.0001), higher clinical stage (P=0.049), negative ER (P<0.0001), negative progesterone receptor (PR) (P<0.0001), positive HER2 (P<0.0001), and TN (P<0.0001). These results indicate that high expression of PLK1 was related with more aggressive clinical factors as previously reported [12,15-17].
Table 1.
Patients and clinical characteristics associated with PLK1 mRNA expression in breast cancer cohorts
| Variables | Number of Patients (%) | ||||||||
|---|---|---|---|---|---|---|---|---|---|
|
| |||||||||
| TCGA | METABRIC | ||||||||
|
|
|
||||||||
| PLK1 | P-value | PLK1 | P-value | ||||||
|
|
|
||||||||
| Total | High | Low | Total | High | Low | ||||
| (N=1025) | (N=257) | (N=768) | (N=1904) | (N=476) | (N=1428) | ||||
| Age | 50> | 749 | 175 (68.1) | 574 (74.7) | 0.037* | 411 | 133 (27.9) | 278 (19.5) | <0.0001* |
| 50≤ | 276 | 82 (31.9) | 194 (25.3) | 1493 | 343 (72.1) | 1150 (80.5) | |||
| Race | Caucasian American | 708 | 146 (56.8) | 562 (73.2) | <0.0001* | NA | |||
| African American | 171 | 70 (27.2) | 101 (13.2) | ||||||
| Asian | 59 | 23 (8.9) | 36 (4.7) | ||||||
| Unknown | 87 | 18 (7.0) | 69 (9.0) | ||||||
| Menopausal state | Pre | 214 | 52 (20.2) | 162 (21.1) | 0.92 | 411 | 133 (27.9) | 278 (19.5) | <0.0001* |
| Post | 668 | 160 (62.3) | 508 (66.1) | 1493 | 343 (72.1) | 1150 (80.5) | |||
| Unknown | 143 | 45 (17.5) | 98 (12.8) | 0 | 0 | 0 | |||
| Tumor size (cm) | 2> | 854 | 212 (82.5) | 642 (83.6) | 0.71 | 821 | 165 (34.7) | 656 (45.9) | <0.0001* |
| 2< | 168 | 44 (17.1) | 124 (16.1) | 1063 | 303 (63.7) | 760 (53.2) | |||
| Unknown | 3 | 1 (0.4) | 2 (0.3) | 20 | 8 (1.7) | 12 (0.8) | |||
| Lymph node | Negative | 484 | 121 (47.1) | 363 (47.3) | 0.86 | 993 | 226 (47.5) | 767 (53.7) | 0.018* |
| Positive | 522 | 133 (51.8) | 389 (50.7) | 911 | 250 (52.5) | 661 (46.3) | |||
| Unknown | 19 | 3 (1.2) | 16 (2.1) | 0 | 0 | 0 | |||
| Histopathology | Ductal | 730 | 217 (84.4) | 513 (66.8) | <0.0001* | 1454 | 416 (87.4) | 1038 (72.7) | <0.0001* |
| Lobular | 191 | 15 (5.8) | 176 (22.9) | 142 | 16 (3.4) | 126 (8.8) | |||
| Others/unknown | 104 | 25 (9.7) | 79 (10.3) | 308 | 44 (9.2) | 264 (18.5) | |||
| Nottingham Grade | 1/2 | 329 | 22 (8.6) | 307 (40) | <0.0001* | 905 | 93 (19.5) | 812 (68.3) | <0.0001* |
| 3 | 221 | 106 (41.2) | 115 (15) | 927 | 376 (79) | 551 (38.6) | |||
| Unknown | 475 | 129 (50.2) | 346 (45.1) | 72 | 7 (1.5) | 65 (4.6) | |||
| Clinical stage | I/II | 749 | 183 (71.2) | 566 (73.7) | 0.31 | 1279 | 300 (63) | 975 (68.3) | 0.049* |
| III/IV | 253 | 70 (27.2) | 183 (23.8) | 124 | 39 (8.2) | 85 (6) | |||
| Unknown | 23 | 4 (1.6) | 19 (2.5) | 501 | 137 (28.8) | 364 (25.5) | |||
| ER | Negative | 220 | 131 (51.0) | 89 (11.6) | <0.0001* | 445 | 260 (54.6) | 185 (13) | <0.0001* |
| Positive | 757 | 113 (44.0) | 644 (83.9) | 1459 | 216 (45.4) | 1243 (87) | |||
| Unknown | 48 | 13 (5.1) | 35 (4.6) | 0 | 0 | 0 | |||
| PR | Negative | 319 | 157 (61.1) | 162 (21.1) | <0.0001* | 895 | 355 (74.6) | 540 (37.8) | <0.0001* |
| Positive | 659 | 87 (33.9) | 572 (74.5) | 1009 | 121 (25.4) | 888 (62.2) | |||
| Unknown | 47 | 13 (5.1) | 34 (4.4) | 0 | 0 | 0 | |||
| HER2 | Negative | 720 | 177 (68.9) | 543 (70.7) | 0.9 | 1668 | 387 (81.3) | 1281 (89.7) | <0.0001* |
| Positive | 172 | 43 (16.7) | 129 (16.8) | 236 | 89 (18.7) | 147 (11.3) | |||
| Unknown | 133 | 37 (14.4) | 96 (12.5) | 0 | 0 | 0 | |||
| Subtype | aHR+HER2- | 562 | 71 (27.6) | 491 (63.9) | <0.0001* | 1355 | 187 (39.3) | 1168 (81.8) | <0.0001* |
| HER2+ | 171 | 42 (16.3) | 129 (16.8) | 236 | 89 (18.7) | 147 (10.3) | |||
| bTN | 158 | 106 (41.2) | 52 (6.8) | 313 | 200 (42) | 113 (7.9) | |||
| Unknown | 134 | 38 (14.8) | 96 (12.5) | 0 | 0 | 0 | |||
| PAM50 | Luminal A | 287 | 0 | 287 (37.4) | NA | NA | |||
| Luminal B | 235 | 58 (22.6) | 177 (23) | ||||||
| HER2 | 141 | 50 (19.5) | 91 (11.8) | ||||||
| Basal-like | 212 | 137 (53.3) | 75 (9.8) | ||||||
| Normal | 124 | 2 (0.8) | 122 (15.9) | ||||||
| Unknown | 26 | 10 (3.9) | 16 (2.1) | ||||||
Abbreviations: TCGA, The Cancer Genome Atlas; ER, estrogen receptor; PgR, progesterone receptor; HER2, human epidermal growth factor receptor 2; HR, hormone receptor; TN, triple; NA, not available.
HR+: ER-positive and/or PgR-positive.
TN: HR-negative and HER2-negative.
Factor showing statistical significance.
The chi-square test and Fisher’s extract test were used to assess baseline differences between binary variables. P<.05 is considered statistically significant.
The presence of TP53 mutation and high TP53 mRNA expression and protein were significantly associated with high PLK1 expressing tumors in the entire BC cohort and HR+HER2- subtypes
PLK1 is deeply involved in DNA repair, mainly homologous recombination repair, as one of the targets of TP53 [6-8]. Thus, it was of interest to investigate whether level of PLK1 mRNA expression correlated with TP53 expression in the TCGA cohort. Out of 1025 women with BC, all women had both PLK1 expression and TP53 gene status data, 974 women had both PLK1 expression and TP53 expression data by RNA-sequencing, and 779 women had both PLK1 expression and TP53 RPPA data in TCGA. In the whole BC cohort and the HR+HER2- subtype, high PLK1 expression was significantly associated with the presence of TP53 mutations, higher TP53 mRNA expression and a higher TP53 protein level (P<0.001). In the HER2+ subtype, tumors with TP53 mutations were significantly associated with higher TP53 expression (P=0.009). There was no significant association with other subtypes (Figure 1B-D).
Cell cycle related gene sets were enriched in high PLK1 expressing tumors in the GSEA
It has been reported that PLK1 plays a pivotal role in both the G2/M phase of the cell cycle as well as the regulation of DNA damage repair [3-7,34]. In order to investigate whether that mechanism is indeed occurring in BCs, we examined gene sets associated with high PLK1 expressing tumors using the GSEA (Figure 2A, 2B). In the whole cohort, cell cycle related gene sets (G2/M check point; NES=2.42, FDR q<0.001, E2F targets; NES=2.38, FDR q<0.001), mTOR complex 1(MTORC1) signaling (NES=2.29, FDR q=3.78e-04), and MYC target gene sets (v1; NES=2.33, FDR q<0.001, v2; NES=2.24, FDR q=0.0011) were enriched and the early estrogen response gene set (NES=-2.02, FDR q=0.018) was not enriched in high PLK1 expressing tumors. Interestingly, tumors with high PLK1 expression did not correlate with gene sets associated with DNA damage repair. No gene set was enriched among 50 hallmark gene sets with high PLK1 expressing tumors in either the HR+HER2- subtype or the HER2+ subtype. On the other hand, in the TN group cell cycle related gene sets (G2/M check point; NES=2.50, FDR q<0.001, E2F targets; NES=2.42, FDR q<0.001, mitotic spindle; NES=2.11, FDR q=8.85e-04) and MYC target gene sets (v1; NES=2.37, FDR q<0.001, v2; NES=2.19, FDR q<0.001) were enriched in high PLK1 expressing tumors, but not other gene sets including those involving DNA damage repair (Figure S1).
Figure 2.

Functional analysis of PLK1 expression. A, B. GSEA of whole breast cancer patients comparing high and low PLK1 mRNA expression. High PLK1 mRNA expression was defined as ≥75th percentile of PLK1 mRNA expression. Upregulated pathways included G2/M check point, E2F targets, MTORC1 signaling, and MYC target gene sets (v1 and v2); A. And downregulated pathways included early estrogen response; B. In high PLK1 mRNA expression compared with high low mRNA expression. The significance of each pathway was classified by a threshold of NES >2 or <-2 and FDR q-value <0.01. C-F. Correlation between PLK1 mRNA expression Z score and HRD score in whole cohort; C. The HR+HER2- group; D. The HER2+ group; E. And the TN group, F. Blue line shows linear regression line. Abbreviations: GESA, Gene Set Enrichment Analyses; NES, normalized enrichment score; FDR, false discovery rate, HRD, homologous recombination deficiency; HR, hormone receptor; HER2, human epidermal growth factor receptor 2; TN, triple negative.
High homologous recombination deficiency (HRD) was significantly associated with high PLK1 expressing tumors in the whole and the HR+HER2-subtypes
In DNA repair, PLK1 has been shown to play a pivotal role in both TP53-mediated homologous recombination repair [6-8] as well as the non-homologous end-joining repair [35]. Homologous recombination repair is a more accurate DNA repair mechanism, and is critical for the maintenance of genomic integrity. In order to clarify the relationship between expression of PLK1 and HRD, we utilized previously established HRD scores [27,28]. Correlation between PLK1 expressing breast tumors and HRD scores are shown in Figure 2C-F. There was a positive correlation between HRD score and PLK1 mRNA expression in the whole BC cohort (r=0.57; P<0.0001). In the HR+HER2- subtype, a statistically significant positive correlation was found between higher HRD score and high PLK1 expressing tumors (r=0.61; P<0.0001). However, only a weak correlation was found in other subtypes, (HER2+; r=0.42; P<0.0001, TN; r=0.29; P<0.0001).
It has been reported that HRD scores can predict the response to NAC agents that function by inducing double stranded DNA breaks in BC patients [36]. A positive correlation between high PLK1 mRNA expression and higher HRD score indicates that high PLK1 mRNA expression may be a predictive biomarker, which could be used to predict responses to therapy.
High PLK1 expressing breast tumors were associated with tumor-infiltrating lymphocytes (TILs), tumor associated macrophages (TAMs), and increased the immune cytolytic activity (CYT)
Recently, TILs have been demonstrated to correlate with response to NAC in BC patients [37]. In order to grasp the landscape of the tumor immune microenvironment of high PLK1 expression tumors, we analyzed the immune cell composition in the TCGA BC cohort utilizing CIBERSORT (Figure 3A-E). Tumors with high PLK1 mRNA expression were significantly associated with high levels of CD8+T cells (P<0.001), activated memory CD4+T cells (P<0.001), high levels of M0 and anti-cancer M1 macrophages (P<0.0001), and low levels of pro-cancer M2 macrophage (P<0.001).
Figure 3.

Analysis of the relationship between PLK1 expression and immune cells. Immune cell components (A-E) and CYT score (F) comparison between PLK1 high and low expressing tumors. In each figure, the whole and subtype (the HR+HER2- group, the HER2+ group, and the TN group) from the left to the right is shown. High PLK1 mRNA expression was defined as ≥75th percentile of PLK1 mRNA expression. High expression of PLK1 was positively related with CD8+ T cell; (A) activated memory CD4+ cell; (B) M0; (C) and M1 macrophage; (D) and negatively related with M2 macrophage; (E) Tumors with high PLK1 expression were also positively related with CYT score; (F) ****means P<0.001 and **means P<0.01. Abbreviations: NS, not significant; HR, hormone receptor; HER2, human epidermal growth receptor 2; TN, triple negative, CYT, immune cytolytic activity.
It has been well established that CYT scores represent anti-cancer immune activity and the ability of TILs to kill malignant cells and we have also recently reported its ability to act as a prognostic biomarker in colorectal cancer [30,31]. We found that high expression of PLK1 was significantly associated with high CYT in BC tumors (P<0.0001) (Figure 3F).
Pathologic complete response to NAC did not associated with PLK1 mRNA expression
We examined the possibility that high PLK1 mRNA expression can serve as a predictive biomarker for BC. A cohort of 244 women with BC who underwent anthracycline-based NAC was analyzed from the GEO database (GSE32603) to determine if there was an association between clinical response to chemotherapy and PLK1 expression. Although high PLK1 expressing breast tumors were associated with two predictors of high sensitivity to NAC, higher HRD score and high levels of anti-tumor TILs, there was no association between high PLK1 mRNA expression and response to NAC in either the whole cohort or any of the subtypes of BC (Figure S2).
High PLK1 expressing tumors have significantly worse OS
Finally, prognostic relevance of PLK1 mRNA expression was analyzed in two large BC cohorts, TCGA and METABRIC (Figure 4). A total of 124 (12.1%) of 1025 BC patients in TCGA and 1103 (57.9%) of 1904 BC patients in METABRIC died, which were regarded as events when analyzing OS. Patients with high PLK1 mRNA expression were significantly associated with worse OS (P=0.0034) in TCGA as well as worse OS (P=0.001) in METABRIC, which were tested by the Kaplan-Meier method and verified by the log-rank (Mantel-Cox) test. The OS Cox hazard analysis for PLK1 is shown in Table S1. The OS Cox hazard multivariate analysis was performed using parameters that were significant in univariate analysis in TCGA and METABRIC cohorts. These results show that high PLK1 mRNA expression proved to be a significant poor prognostic parameter (TCGA: univariate analysis; hazard ratio (HR): 1.46, 95% confidence interval (CI): 1.03-2.08, P=0.0035, multivariate analysis; HR: 1.59, 95% CI: 1.01-2.72, P=0.047, METABRIC: univariate analysis; HR: 1.24, 95% CI: 1.09-1.42, P=0.0015, multivariate analysis; HR: 1.22, 95% CI: 1.04-1.43, P=0.017). We further found there was a statistically significant association between high PLK1 mRNA expression and OS (P=0.048) in the HR+HER2- subtype within the TCGA as well as between high PLK1 mRNA expression and OS in the HR+HER2- subtype (P=0.008) and the TN subtype (P=0.045) within the METABRIC database (Figure 4E, 4F, 4H). Despite differences in mortality rates between the two databases, high expression of PLK1 was associated with poorer OS in the whole cohort as well as the HR+HER2- subtype. These data suggest the possibility that tumors with high PLK1 mRNA expression in the whole and the HR+HER2- subtype are significantly associated with higher TP53 mRNA expression and high HRD, which may contribute to poor prognosis.
Figure 4.
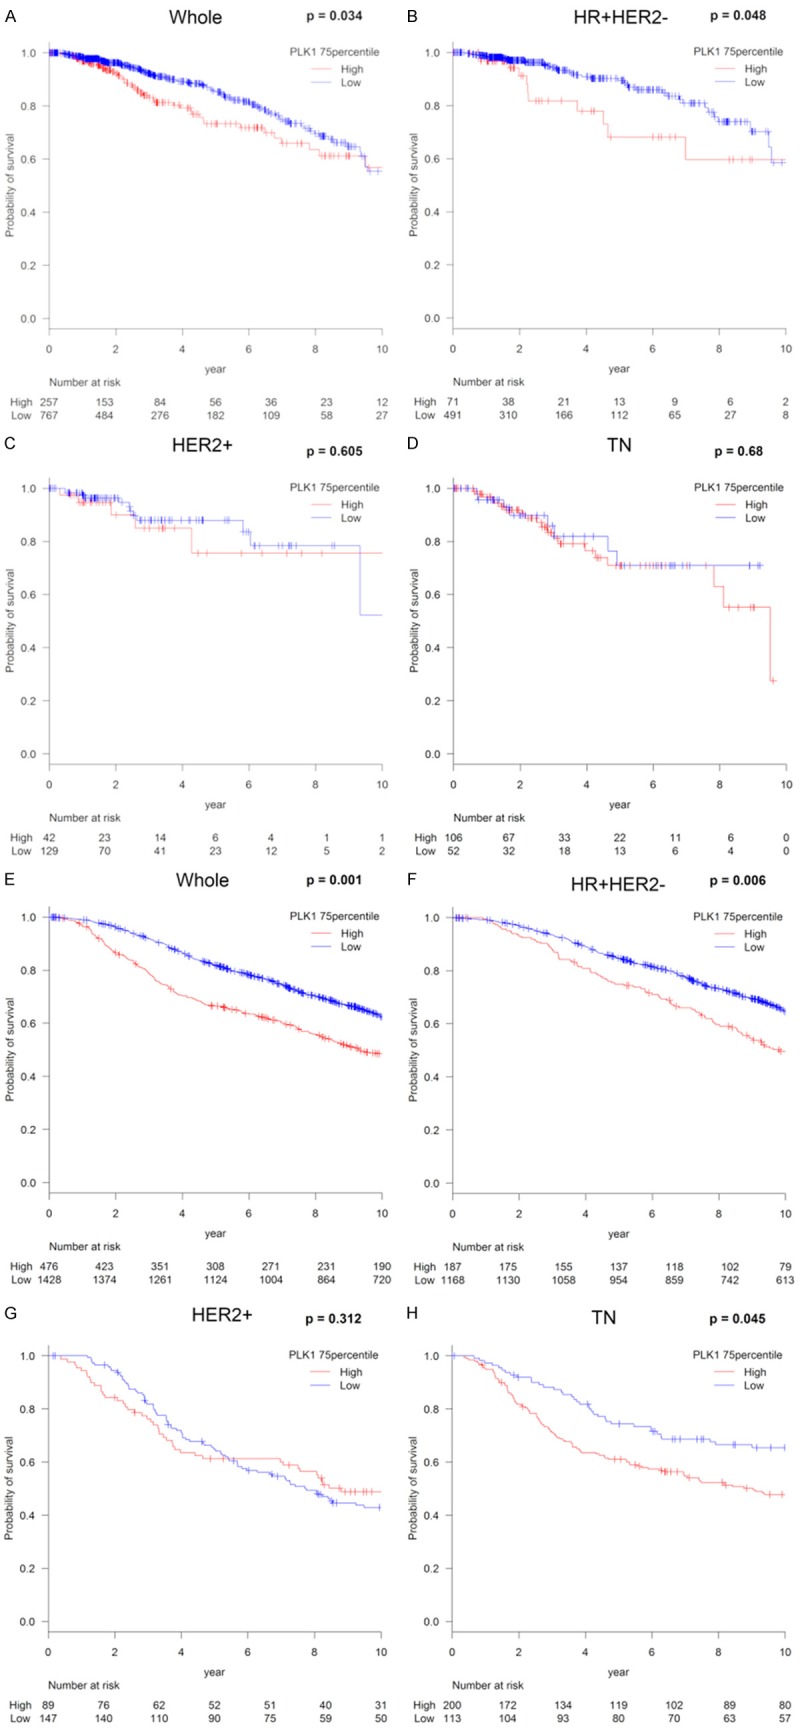
Analysis of the relationship between PLK1 expression and survival in breast cancer. Kaplan-Meier plots of the association of the presence of PLK1 mRNA expression with OS in TCGA (A-D) and METABRIC (E-H); the whole cohort; (A, E) the HR+HER2- group; (B, F) the HER2+ group; (C, G) and the TN group; (D, H) High PLK1 mRNA expression was defined as ≥75th percentile of PLK1 mRNA expression. Abbreviations: OS, overall survival; TCGA, The Cancer Genome Atlas; METABRIC, Molecular Taxonomy of Breast Cancer International Consortium; HR, hormone receptor; HER2, human epidermal growth factor receptor 2; TN, triple negative.
Discussion
PLK1 has been demonstrated as crucial new player in both the regulation of DNA damage repair and the cell cycle [3-8]. However, the functional analysis of PLK1 is currently limited to TNBC and has been evaluated in a relatively small number of patient samples [12,15]. In order to demonstrate the clinical association of PLK1 within each BC subtype, validation with larger clinical cohorts was needed. Therefore, we utilized computational biological analyses to investigate the biological features of high PLK1 expression BCs as well as clinical implications for each BC subtype utilizing two large BC cohorts, TCGA and METABRIC, where high expression level was defined following a previous publication.
Our study generated two novel results with clinical implications. Firstly, in the whole cohort, high expression of PLK1 was significantly associated with cell cycle related genes, TP53 inactivation, and HRD, but these relationships were not necessarily reflected in TNBC. As is customary, high PLK1 expressing tumors significantly enriched cell cycle related gene sets in the whole cohort and the TNBC group. We observed that high PLK1 expressing tumors also significantly enriched cell cycle related gene sets including (G2/M check point, E2F targets), MTORC1 signaling, as well as MYC target gene sets (v1 and v2) in GSEA, and low expression enriched early estrogen response gene sets (Figure 2A, 2B). In the TNBC cohort, high PLK1 expressing tumors were associated with cell cycle related gene sets (G2/M check point, E2F targets, and mitotic spindle) as well as MYC target gene sets (v1 and v2), concurrent with the whole cohort (Figure S1). These results are in agreement with previous reports demonstrating that PLK1 is associated with mitotic events, such as centrosome disjunction, activation of cyclin and cyclin dependent kinases, spindle assembly, and chromosomal separation [4,5,38-42]. However, unlike the characteristics of the whole BC cohort, TNBC with high PLK1 expression did not correlate with high TP53 expression (Figure 1B) or with higher HRD (Figure 2D). These results suggest that the interaction between PLK1 and multiple cell signaling pathways varies by subtype.
Second, unexpectedly, high PLK1 expression was not associated with survival in the TNBC group (Figure 4D), despite both HR negative and TN tumors demonstrating significantly higher PLK1 mRNA expressions compared with the other subtypes (Table 1). These results seem to be contrary to the previous reports that high PLK1 expression was a poor prognostic factor in TNBC [11,12,16,17]. Besides it being merely due to lack of statistical power (Figure 4H), it is conceivable that the reason why high PLK1 mRNA expression was strongly related to poor survival in HR+HER2- may be explained by the following three reasons. First, PLK1 may be deeply involved in DNA repair deficiency in the HR+HER2- group as well as the whole cohort. We used HRD score, which indicates the degree of homologous recombination deficiency, to explore underlying mechanisms associated with high PLK1 mRNA expression and poor prognosis in the HR+HER2-. There was a positive correlation between HRD score and PLK1 mRNA expression in the HR+HER2- group (r=0.61; P<0.0001) as well as in the whole cohort (r=0.57; P<0.0001), but a weak correlation noted in other subtypes (HER2+; r=0.42; P<0.0001, TN; r=0.29; P<0.0001) (Figure 2C-F). Previous studies have demonstrated that HRD contributes to breast carcinogenesis, genomic instability, and increased sensitivity to topoisomerase inhibitors, platinum salts, and PARP inhibitors, mainly, in TN BC [43]. In studies examining HRD within each BC subtype, the frequency of HRD in ER+ BC patients was as low as approximately 5%, with those patients largely possessing BRCA1 and BRCA2 genetic mutations which are known to be closely related to HRD [44]. Therefore, it was considered that the poorer prognosis in the HR+HER2- subtype was based on the interaction between HRD and PLK1 mRNA expression, which is clinically meaningful in patients with ER+ tumors as well. Second, PLK1 is deeply involved in dysfunction of TP53 in the HR+HER2- group as well as the whole cohort. This is based on the report that the significant association between elevated PLK1 and TP53 mutation in women with BC was significantly associated with worse prognosis [9]. In agreement with previous reports, we found the positive association between high PLK1 expression and the presence of TP53 mutations as well as higher TP53 expression and protein levels in HR+HER2- BC (Figure 1B). Third, PLK1 interacts with the ER and regulates the ER target gene in BC patients as reported previously [45]. They reported that ER-targeted genes regulated by PLK1 played an important role as tumor suppressors, suggesting a potential poor prognosis related to PLK1 independent ER target genes. Interestingly, high expression of PLK1 was significantly associated with high levels of CD8+T cells (P<0.001), activated memory CD4+T cells (P<0.001), high levels of M0 and anti-cancer M1 macrophages (P<0.0001), and low levels of pro-cancer M2 macrophage (P<0.001) (Figure 3). Given the fact that high expression of PLK1 was associated with poorer prognosis, high PLK1 expressing tumors most likely attract TILs into the tumor immune microenvironment. Our results indicate that the anti-cancer effects of immune cells were unable to overcome the aggressiveness of high PLK1 expression cancers.
Liquid biopsy is a non-invasively conducted genetic test using genes extracted from body fluids such as blood and urine and has been developed as a way of providing relevant predictive information related to tumor tissues [46-49]. The myriad of interactions between PLK1 and cell signaling pathways likely contributes to the progression of high PLK1 expressing cancers. If PLK1 can be monitored by liquid biopsy, it may be possible to use PLK1 expression as a prognostication tool and continue the development of PLK-targeted drugs for BC patients.
There are a few limitations to this study. First, this is a retrospective study utilizing publicly available datasets, thus prone to possible selection bias. Also, the number of HER2+ and TNBC patients are were noted to be small which may decrease the reliability of the results. This study is also based on the gene expression of primary tumors within the TCGA, METABRIC, and NAC cohorts and does not include any in vitro or in vivo experiments which limits our ability to assess underlying molecular mechanisms.
In conclusion, we determined that high PLK1 expressing tumors were associated with more aggressive clinical factors, the presence of TP53 mutations and higher TP53 expression and protein levels, higher HRD, cell cycle related genes, high levels of TILs, and poorer prognosis in the TCGA BC cohort. In the NAC cohort, high expression of PLK1 was not associated with response to treatment. However, high PLK1 expressing tumors were associated with poor prognosis in the HR+HER2- group. This was not true for the TN subtype of BC. Thus, PLK1 plays an important role in BC, and further studies should be performed to elucidate the role for targeted therapies against PLK1 in the management of BC.
Acknowledgements
This work was supported by NIH grant R01CA160688 to K.T, and National Cancer Institute (NCI) grant P30CA016056 involving the use of Roswell Park Cancer Institute’s Bioinformatics and Biostatistics Shared Resources.
Disclosure of conflict of interest
None.
Abbreviations
- BC
breast cancer
- HER2
human epidermal growth factor receptor 2
- TNBC
triple negative BC
- PLK1
Polo-like kinase 1
- DFS
disease free survival
- OS
overall survival
- ER
estrogen receptor
- TCGA
The Cancer Genome Atlas
- METABRIC
Molecular Taxonomy of Breast Cancer International Consortium
- GEO
Gene Expression Omnibus
- NAC
neoadjuvant chemotherapy
- NCI
the National Cancer Institute
- RPPA
reverse phase protein array
- NCBI
National Center for Biotechnology Information
- GSEA
Gene Set Enrichment Analyses
- HRD
Homologous recombination deficiency
- CYT
the immune cytolytic activity
- TPM
Transcripts Per Million
- NES
normalized enrichment score
- FDR
false discovery rate
- HR+
hormone receptor-positive
- PgR
progesterone receptor
- MTORC1
mTOR complex 1
- TILs
Tumor-Infiltrating Lymphocytes
- TAMs
Tumor Associated Macrophages
- HR
hazard ratio
- CI
confidence interval
Supporting Information
References
- 1.Siegel RL, Miller KD, Jemal A. Cancer statistics, 2017. CA Cancer J Clin. 2017;67:7–30. doi: 10.3322/caac.21387. [DOI] [PubMed] [Google Scholar]
- 2.Ponde NF, Zardavas D, Piccart M. Progress in adjuvant systemic therapy for breast cancer. Nat Rev Clin Oncol. 2019;16:27–44. doi: 10.1038/s41571-018-0089-9. [DOI] [PubMed] [Google Scholar]
- 3.Degenhardt Y, Lampkin T. Targeting polo-like kinase in cancer therapy. Clin Cancer Res. 2010;16:384–389. doi: 10.1158/1078-0432.CCR-09-1380. [DOI] [PubMed] [Google Scholar]
- 4.Barr FA, Sillje HH, Nigg EA. Polo-like kinases and the orchestration of cell division. Nat Rev Mol Cell Biol. 2004;5:429–440. doi: 10.1038/nrm1401. [DOI] [PubMed] [Google Scholar]
- 5.Lens SM, Voest EE, Medema RH. Shared and separate functions of polo-like kinases and aurora kinases in cancer. Nat Rev Cancer. 2010;10:825–841. doi: 10.1038/nrc2964. [DOI] [PubMed] [Google Scholar]
- 6.Hyun SY, Hwang HI, Jang YJ. Polo-like kinase-1 in DNA damage response. BMB Rep. 2014;47:249–255. doi: 10.5483/BMBRep.2014.47.5.061. [DOI] [PMC free article] [PubMed] [Google Scholar]
- 7.Yata K, Lloyd J, Maslen S, Bleuyard JY, Skehel M, Smerdon SJ, Esashi F. Plk1 and CK2 act in concert to regulate Rad51 during DNA double strand break repair. Mol Cell. 2012;45:371–383. doi: 10.1016/j.molcel.2011.12.028. [DOI] [PMC free article] [PubMed] [Google Scholar]
- 8.Chabalier-Taste C, Brichese L, Racca C, Canitrot Y, Calsou P, Larminat F. Polo-like kinase 1 mediates BRCA1 phosphorylation and recruitment at DNA double-strand breaks. Oncotarget. 2016;7:2269–2283. doi: 10.18632/oncotarget.6825. [DOI] [PMC free article] [PubMed] [Google Scholar]
- 9.King SI, Purdie CA, Bray SE, Quinlan PR, Jordan LB, Thompson AM, Meek DW. Immunohistochemical detection of Polo-like kinase-1 (PLK1) in primary breast cancer is associated with TP53 mutation and poor clinical outcom. Breast Cancer Res. 2012;14:R40. doi: 10.1186/bcr3136. [DOI] [PMC free article] [PubMed] [Google Scholar]
- 10.Donizy P, Halon A, Surowiak P, Kaczorowski M, Kozyra C, Matkowski R. Augmented expression of polo-like kinase 1 is a strong predictor of shorter cancer-specific overall survival in early stage breast cancer at 15-year follow-up. Oncol Lett. 2016;12:1667–1674. doi: 10.3892/ol.2016.4890. [DOI] [PMC free article] [PubMed] [Google Scholar]
- 11.Weichert W, Kristiansen G, Winzer KJ, Schmidt M, Gekeler V, Noske A, Muller BM, Niesporek S, Dietel M, Denkert C. Polo-like kinase isoforms in breast cancer: expression patterns and prognostic implications. Virchows Arch. 2005;446:442–450. doi: 10.1007/s00428-005-1212-8. [DOI] [PubMed] [Google Scholar]
- 12.Zhang Y, Wu Z, Liu D, Wang M, Xiao G, Wang P, Sun X, Ren H, Tang SC, Du N. Augmented expression of polo-like kinase 1 indicates poor clinical outcome for breast patients: a systematic review and meta-analysis. Oncotarget. 2017;8:57723–57732. doi: 10.18632/oncotarget.17301. [DOI] [PMC free article] [PubMed] [Google Scholar]
- 13.Gutteridge RE, Ndiaye MA, Liu X, Ahmad N. Plk1 inhibitors in cancer therapy: from laboratory to clinics. Mol Cancer Ther. 2016;15:1427–1435. doi: 10.1158/1535-7163.MCT-15-0897. [DOI] [PMC free article] [PubMed] [Google Scholar]
- 14.Schoffski P. Polo-like kinase (PLK) inhibitors in preclinical and early clinical development in oncology. Oncologist. 2009;14:559–570. doi: 10.1634/theoncologist.2009-0010. [DOI] [PubMed] [Google Scholar]
- 15.Loddo M, Kingsbury SR, Rashid M, Proctor I, Holt C, Young J, El-Sheikh S, Falzon M, Eward KL, Prevost T, Sainsbury R, Stoeber K, Williams GH. Cell-cycle-phase progression analysis identifies unique phenotypes of major prognostic and predictive significance in breast cancer. Br J Cancer. 2009;100:959–970. doi: 10.1038/sj.bjc.6604924. [DOI] [PMC free article] [PubMed] [Google Scholar]
- 16.Maire V, Nemati F, Richardson M, Vincent-Salomon A, Tesson B, Rigaill G, Gravier E, Marty-Prouvost B, De Koning L, Lang G, Gentien D, Dumont A, Barillot E, Marangoni E, Decaudin D, Roman-Roman S, Pierre A, Cruzalegui F, Depil S, Tucker GC, Dubois T. Polo-like kinase 1: a potential therapeutic option in combination with conventional chemotherapy for the management of patients with triple-negative breast cancer. Cancer Res. 2013;73:813–823. doi: 10.1158/0008-5472.CAN-12-2633. [DOI] [PubMed] [Google Scholar]
- 17.Ha GH, Kim DY, Breuer EK, Kim CK. Combination treatment of polo-like kinase 1 and tankyrase-1 inhibitors enhances anticancer effect in triple-negative breast cancer cells. Anticancer Res. 2018;38:1303–1310. doi: 10.21873/anticanres.12352. [DOI] [PubMed] [Google Scholar]
- 18.Cerami E, Gao J, Dogrusoz U, Gross BE, Sumer SO, Aksoy BA, Jacobsen A, Byrne CJ, Heuer ML, Larsson E, Antipin Y, Reva B, Goldberg AP, Sander C, Schultz N. The cBio cancer genomics portal: an open platform for exploring multidimensional cancer genomics data. Cancer Discov. 2012;2:401–404. doi: 10.1158/2159-8290.CD-12-0095. [DOI] [PMC free article] [PubMed] [Google Scholar]
- 19.Gao J, Aksoy BA, Dogrusoz U, Dresdner G, Gross B, Sumer SO, Sun Y, Jacobsen A, Sinha R, Larsson E, Cerami E, Sander C, Schultz N. Integrative analysis of complex cancer genomics and clinical profiles using the cBioPortal. Sci Signal. 2013;6:pl1. doi: 10.1126/scisignal.2004088. [DOI] [PMC free article] [PubMed] [Google Scholar]
- 20.Curtis C, Shah SP, Chin SF, Turashvili G, Rueda OM, Dunning MJ, Speed D, Lynch AG, Samarajiwa S, Yuan Y, Graf S, Ha G, Haffari G, Bashashati A, Russell R, McKinney S, Group M, Langerod A, Green A, Provenzano E, Wishart G, Pinder S, Watson P, Markowetz F, Murphy L, Ellis I, Purushotham A, Borresen-Dale AL, Brenton JD, Tavare S, Caldas C, Aparicio S. The genomic and transcriptomic architecture of 2,000 breast tumours reveals novel subgroups. Nature. 2012;486:346–352. doi: 10.1038/nature10983. [DOI] [PMC free article] [PubMed] [Google Scholar]
- 21.Pereira B, Chin SF, Rueda OM, Vollan HK, Provenzano E, Bardwell HA, Pugh M, Jones L, Russell R, Sammut SJ, Tsui DW, Liu B, Dawson SJ, Abraham J, Northen H, Peden JF, Mukherjee A, Turashvili G, Green AR, McKinney S, Oloumi A, Shah S, Rosenfeld N, Murphy L, Bentley DR, Ellis IO, Purushotham A, Pinder SE, Borresen-Dale AL, Earl HM, Pharoah PD, Ross MT, Aparicio S, Caldas C. The somatic mutation profiles of 2,433 breast cancers refines their genomic and transcriptomic landscapes. Nat Commun. 2016;7:11479. doi: 10.1038/ncomms11479. [DOI] [PMC free article] [PubMed] [Google Scholar]
- 22.Cancer Genome Atlas Network. Comprehensive molecular portraits of human breast tumours. Nature. 2012;490:61–70. doi: 10.1038/nature11412. [DOI] [PMC free article] [PubMed] [Google Scholar]
- 23.Magbanua MJ, Wolf DM, Yau C, Davis SE, Crothers J, Au A, Haqq CM, Livasy C, Rugo HS I-SPY 1 TRIAL Investigators. Esserman L, Park JW, van ‘t Veer LJ. Serial expression analysis of breast tumors during neoadjuvant chemotherapy reveals changes in cell cycle and immune pathways associated with recurrence and response. Breast Cancer Res. 2015;17:73. doi: 10.1186/s13058-015-0582-3. [DOI] [PMC free article] [PubMed] [Google Scholar]
- 24.Katsuta E, Yan L, Nagahashi M, Raza A, Sturgill JL, Lyon DE, Rashid OM, Hait NC, Takabe K. Doxorubicin effect is enhanced by sphingosine-1-phosphate signaling antagonist in breast cancer. J Surg Res. 2017;219:202–213. doi: 10.1016/j.jss.2017.05.101. [DOI] [PMC free article] [PubMed] [Google Scholar]
- 25.Young J, Kawaguchi T, Yan L, Qi Q, Liu S, Takabe K. Tamoxifen sensitivity-related microRNA-342 is a useful biomarker for breast cancer survival. Oncotarget. 2017;8:99978–99989. doi: 10.18632/oncotarget.21577. [DOI] [PMC free article] [PubMed] [Google Scholar]
- 26.Kawaguchi T, Yan L, Qi Q, Peng X, Gabriel EM, Young J, Liu S, Takabe K. Overexpression of suppressive microRNAs, miR-30a and miR-200c are associated with improved survival of breast cancer patients. Sci Rep. 2017;7:15945. doi: 10.1038/s41598-017-16112-y. [DOI] [PMC free article] [PubMed] [Google Scholar]
- 27.Knijnenburg TA, Wang L, Zimmermann MT, Chambwe N, Gao GF, Cherniack AD, Fan H, Shen H, Way GP, Greene CS, Liu Y, Akbani R, Feng B, Donehower LA, Miller C, Shen Y, Karimi M, Chen H, Kim P, Jia P, Shinbrot E, Zhang S, Liu J, Hu H, Bailey MH, Yau C, Wolf D, Zhao Z, Weinstein JN, Li L, Ding L, Mills GB, Laird PW, Wheeler DA, Shmulevich I Cancer Genome Atlas Research Network. Monnat RJ Jr, Xiao Y, Wang C. Genomic and molecular landscape of DNA damage repair deficiency across the cancer genome atlas. Cell Rep. 2018;23:239–254. e236. doi: 10.1016/j.celrep.2018.03.076. [DOI] [PMC free article] [PubMed] [Google Scholar]
- 28.Thorsson V, Gibbs DL, Brown SD, Wolf D, Bortone DS, Ou Yang TH, Porta-Pardo E, Gao GF, Plaisier CL, Eddy JA, Ziv E, Culhane AC, Paull EO, Sivakumar IKA, Gentles AJ, Malhotra R, Farshidfar F, Colaprico A, Parker JS, Mose LE, Vo NS, Liu J, Liu Y, Rader J, Dhankani V, Reynolds SM, Bowlby R, Califano A, Cherniack AD, Anastassiou D, Bedognetti D, Mokrab Y, Newman AM, Rao A, Chen K, Krasnitz A, Hu H, Malta TM, Noushmehr H, Pedamallu CS, Bullman S, Ojesina AI, Lamb A, Zhou W, Shen H, Choueiri TK, Weinstein JN, Guinney J, Saltz J, Holt RA, Rabkin CS Cancer Genome Atlas Research Network. Lazar AJ, Serody JS, Demicco EG, Disis ML, Vincent BG, Shmulevich I. The immune landscape of cancer. Immunity. 2018;48:812–830. e814. doi: 10.1016/j.immuni.2018.03.023. [DOI] [PMC free article] [PubMed] [Google Scholar]
- 29.Newman AM, Liu CL, Green MR, Gentles AJ, Feng W, Xu Y, Hoang CD, Diehn M, Alizadeh AA. Robust enumeration of cell subsets from tissue expression profiles. Nat Methods. 2015;12:453–457. doi: 10.1038/nmeth.3337. [DOI] [PMC free article] [PubMed] [Google Scholar]
- 30.Narayanan S, Kawaguchi T, Yan L, Peng X, Qi Q, Takabe K. Cytolytic activity score to assess anticancer immunity in colorectal cancer. Ann Surg Oncol. 2018;25:2323–2331. doi: 10.1245/s10434-018-6506-6. [DOI] [PMC free article] [PubMed] [Google Scholar]
- 31.Rooney MS, Shukla SA, Wu CJ, Getz G, Hacohen N. Molecular and genetic properties of tumors associated with local immune cytolytic activity. Cell. 2015;160:48–61. doi: 10.1016/j.cell.2014.12.033. [DOI] [PMC free article] [PubMed] [Google Scholar]
- 32.Balli D, Rech AJ, Stanger BZ, Vonderheide RH. Immune cytolytic activity stratifies molecular subsets of human pancreatic cancer. Clin Cancer Res. 2017;23:3129–3138. doi: 10.1158/1078-0432.CCR-16-2128. [DOI] [PMC free article] [PubMed] [Google Scholar]
- 33.Liu Z, Sun Q, Wang X. PLK1, a potential target for cancer therapy. Transl Oncol. 2017;10:22–32. doi: 10.1016/j.tranon.2016.10.003. [DOI] [PMC free article] [PubMed] [Google Scholar]
- 34.Shaltiel IA, Krenning L, Bruinsma W, Medema RH. The same, only different-DNA damage checkpoints and their reversal throughout the cell cycle. J Cell Sci. 2015;128:607–620. doi: 10.1242/jcs.163766. [DOI] [PubMed] [Google Scholar]
- 35.Benada J, Burdova K, Lidak T, von Morgen P, Macurek L. Polo-like kinase 1 inhibits DNA damage response during mitosis. Cell Cycle. 2015;14:219–231. doi: 10.4161/15384101.2014.977067. [DOI] [PMC free article] [PubMed] [Google Scholar]
- 36.Telli ML, Timms KM, Reid J, Hennessy B, Mills GB, Jensen KC, Szallasi Z, Barry WT, Winer EP, Tung NM, Isakoff SJ, Ryan PD, Greene-Colozzi A, Gutin A, Sangale Z, Iliev D, Neff C, Abkevich V, Jones JT, Lanchbury JS, Hartman AR, Garber JE, Ford JM, Silver DP, Richardson AL. Homologous recombination deficiency (HRD) score predicts response to platinum-containing neoadjuvant chemotherapy in patients with triple-negative breast cancer. Clin Cancer Res. 2016;22:3764–3773. doi: 10.1158/1078-0432.CCR-15-2477. [DOI] [PMC free article] [PubMed] [Google Scholar]
- 37.Ono M, Tsuda H, Shimizu C, Yamamoto S, Shibata T, Yamamoto H, Hirata T, Yonemori K, Ando M, Tamura K, Katsumata N, Kinoshita T, Takiguchi Y, Tanzawa H, Fujiwara Y. Tumor-infiltrating lymphocytes are correlated with response to neoadjuvant chemotherapy in triple-negative breast cancer. Breast Cancer Res Treat. 2012;132:793–805. doi: 10.1007/s10549-011-1554-7. [DOI] [PubMed] [Google Scholar]
- 38.Glover DM, Hagan IM, Tavares AA. Polo-like kinases: a team that plays throughout mitosis. Genes Dev. 1998;12:3777–3787. doi: 10.1101/gad.12.24.3777. [DOI] [PubMed] [Google Scholar]
- 39.Nigg EA. Polo-like kinases: positive regulators of cell division from start to finish. Curr Opin Cell Biol. 1998;10:776–783. doi: 10.1016/s0955-0674(98)80121-x. [DOI] [PubMed] [Google Scholar]
- 40.Ruf S, Heberle AM, Langelaar-Makkinje M, Gelino S, Wilkinson D, Gerbeth C, Schwarz JJ, Holzwarth B, Warscheid B, Meisinger C, van Vugt MA, Baumeister R, Hansen M, Thedieck K. PLK1 (polo like kinase 1) inhibits MTOR complex 1 and promotes autophagy. Autophagy. 2017;13:486–505. doi: 10.1080/15548627.2016.1263781. [DOI] [PMC free article] [PubMed] [Google Scholar]
- 41.Xiao D, Yue M, Su H, Ren P, Jiang J, Li F, Hu Y, Du H, Liu H, Qing G. Polo-like kinase-1 regulates myc stabilization and activates a feedforward circuit promoting tumor cell survival. Mol Cell. 2016;64:493–506. doi: 10.1016/j.molcel.2016.09.016. [DOI] [PubMed] [Google Scholar]
- 42.Tan J, Li Z, Lee PL, Guan P, Aau MY, Lee ST, Feng M, Lim CZ, Lee EY, Wee ZN, Lim YC, Karuturi RK, Yu Q. PDK1 signaling toward PLK1-MYC activation confers oncogenic transformation, tumor-initiating cell activation, and resistance to mTOR-targeted therapy. Cancer Discov. 2013;3:1156–1171. doi: 10.1158/2159-8290.CD-12-0595. [DOI] [PubMed] [Google Scholar]
- 43.Denkert C, Liedtke C, Tutt A, von Minckwitz G. Molecular alterations in triple-negative breast cancer-the road to new treatment strategies. Lancet. 2017;389:2430–2442. doi: 10.1016/S0140-6736(16)32454-0. [DOI] [PubMed] [Google Scholar]
- 44.Manie E, Popova T, Battistella A, Tarabeux J, Caux-Moncoutier V, Golmard L, Smith NK, Mueller CR, Mariani O, Sigal-Zafrani B, Dubois T, Vincent-Salomon A, Houdayer C, Stoppa-Lyonnet D, Stern MH. Genomic hallmarks of homologous recombination deficiency in invasive breast carcinomas. Int J Cancer. 2016;138:891–900. doi: 10.1002/ijc.29829. [DOI] [PubMed] [Google Scholar]
- 45.Wierer M, Verde G, Pisano P, Molina H, Font-Mateu J, Di Croce L, Beato M. PLK1 signaling in breast cancer cells cooperates with estrogen receptor-dependent gene transcription. Cell Rep. 2013;3:2021–2032. doi: 10.1016/j.celrep.2013.05.024. [DOI] [PubMed] [Google Scholar]
- 46.Takeshita T, Yamamoto Y, Yamamoto-Ibusuki M, Inao T, Sueta A, Fujiwara S, Omoto Y, Iwase H. Prognostic role of PIK3CA mutations of cell-free DNA in early-stage triple negative breast cancer. Cancer Sci. 2015;106:1582–9. doi: 10.1111/cas.12813. [DOI] [PMC free article] [PubMed] [Google Scholar]
- 47.Takeshita T, Yamamoto Y, Yamamoto-Ibusuki M, Inao T, Sueta A, Fujiwara S, Omoto Y, Iwase H. Clinical significance of monitoring ESR1 mutations in circulating cell-free DNA in estrogen receptor positive breast cancer patients. Oncotarget. 2016;7:32504–32518. doi: 10.18632/oncotarget.8839. [DOI] [PMC free article] [PubMed] [Google Scholar]
- 48.Takeshita T, Yamamoto Y, Yamamoto-Ibusuki M, Tomiguchi M, Sueta A, Murakami K, Omoto Y, Iwase H. Analysis of ESR1 and PIK3CA mutations in plasma cell-free DNA from ER-positive breast cancer patients. Oncotarget. 2017;8:52142–52155. doi: 10.18632/oncotarget.18479. [DOI] [PMC free article] [PubMed] [Google Scholar]
- 49.Takeshita T, Yamamoto Y, Yamamoto-Ibusuki M, Tomiguchi M, Sueta A, Murakami K, Iwase H. Clinical significance of plasma cell-free DNA mutations in PIK3CA, AKT1, and ESR1 gene according to treatment lines in ER-positive breast cancer. Mol Cancer. 2018;17:67. doi: 10.1186/s12943-018-0808-y. [DOI] [PMC free article] [PubMed] [Google Scholar]
Associated Data
This section collects any data citations, data availability statements, or supplementary materials included in this article.