

Abstract
Aims
Biomarkers of kidney tubule injury, inflammation and fibrosis have been studied extensively and established as risk markers of adverse kidney and cardiovascular disease (CVD) outcomes. However, associations of markers of kidney tubular function with adverse clinical events have not been well studied, especially in persons with chronic kidney disease (CKD).
Methods and results
Using a sample of 2377 persons with CKD at the baseline Systolic Blood Pressure Intervention Trial (SPRINT) visit, we evaluated the association of three urine tubular function markers, alpha-1 microglobulin (α1m), beta-2 microglobulin (β2m), and uromodulin, with a composite CVD endpoint (myocardial infarction, acute coronary syndrome, stroke, acute decompensated heart failure, or death from cardiovascular causes) and mortality using Cox proportional hazards regression, adjusted for baseline estimated glomerular filtration rate (eGFR), albuminuria, and CVD risk factors. In unadjusted analysis, over a median follow-up of 3.8 years, α1m and β2m had positive associations with composite CVD events and mortality, whereas uromodulin had an inverse association with risk for both outcomes. In multivariable analysis including eGFR and albuminuria, a two-fold higher baseline concentration of α1m was associated with higher risk of CVD [hazard ratio (HR) 1.25; 95% confidence interval (CI): 1.10–1.45] and mortality (HR 1.25; 95% CI: 1.10–1.46), whereas β2m had no association with either outcome. A two-fold higher uromodulin concentration was associated with lower CVD risk (HR 0.79; 95% CI: 0.68–0.90) but not mortality (HR 0.86; 95% CI: 0.73–1.01) after adjusting for similar confounders.
Conclusion
Among non-diabetic persons with CKD, biomarkers of tubular function are associated with CVD events and mortality independent of glomerular function and albuminuria.
Keywords: Tubular function, Biomarkers, Cardiovascular disease, Chronic kidney disease, Alpha-1 microglobulin, Beta-2 microglobulin, Uromodulin
Introduction
Persons with chronic kidney disease (CKD) are at increased risk of cardiovascular disease (CVD).1 Along with established clinical diagnostic tests of kidney health, estimated glomerular filtration rate (eGFR), and albumin–creatinine ratio (ACR), several novel markers of tubular injury, inflammation, and fibrosis have been associated with risk of CVD events.2–4 However, these biomarkers do not assess tubular function. The tubules have a myriad of functions including nutrient reabsorption, injury prevention, toxin secretion, acid-base homeostasis, and endocrine actions. Emerging biomarkers allow assessment of components of tubule function, providing a multi-dimensional picture of kidney health that moves beyond markers of glomerular filtration and injury.
Alpha-1 microglobulin (α1m)5 and beta-2 microglobulin (β2m) are low-molecular-weight proteins that are freely filtered at the glomerulus and almost entirely reabsorbed (>99%) by proximal tubular cells. Lower levels of these proteins in urine therefore signify preserved tubular re-absorptive capacity. Studies have shown that tenofovir disoproxil fumarate, an antiretroviral medication with known proximal tubule toxicity, leads to high α1m and β2m levels, and these levels are associated with greater interstitial fibrosis on kidney biopsy6 and with kidney function decline.7 The relationship of these proximal tubule function markers with risk of CVD is an emerging area of study.8,9 Uromodulin, also known as Tamm–Horsfall protein, is a 95-kDa glycoprotein synthesized exclusively by kidney tubules, both in the thick ascending limb of the loop of Henle and early distal convoluted tubule, and is the most common protein in the urine of healthy adults.10,11 Higher uromodulin levels are associated with larger kidneys and higher eGFR, and may serve as a surrogate for kidney tubular reserve.12 In older adults, higher uromodulin levels have been associated with reduced risk of mortality and urinary tract infections.13,14 Thus, these three urine biomarkers may serve as important indicators of underlying tubular function.7
Studies evaluating kidney tubule functions have been performed in older adults,15 kidney transplant recipients,9 and persons infected with HIV.7 Whether a panel of biomarkers reflecting tubular function is associated with future risk of CVD events in persons with established CKD has not been rigorously evaluated. Persons with CKD are at a higher risk for CVD events16 than the general population and novel biomarkers may help identify persons at particularly high risk of these events. We evaluated our hypothesis that better tubular function would be associated with lower risk of CVD events and mortality by measuring these three biomarkers at the baseline visit of the Systolic Blood Pressure Intervention Trial (SPRINT) among participants with prevalent CKD.
Methods
The design and primary results of the SPRINT trial have been previously reported.17,18 Briefly, SPRINT was an open-label clinical trial in which participants with systolic blood pressure (SBP) >130 mmHg and high risk for CVD events were randomized to an ‘intensive’ SBP target of <120 mmHg or ‘standard’ target of <140 mmHg. Inclusion criteria was age ≥50 years, SBP of 130–180 mmHg, and increased risk for CVD events (prior clinical or subclinical CVD other than stroke, 10-year risk of CVD of 15% or greater based on the Framingham risk score, CKD defined as eGFR 20–59 mL/min/1.73 m2, or age ≥75 years). Major exclusion criteria included diabetes mellitus, proteinuria >1 g/day, polycystic kidney disease, prior stroke or transient ischaemic attack, symptomatic heart failure (HF), or a left ventricular ejection fraction <35%.
Population
Overall, 9361 participants were enrolled between November 2010 and March 2013. All participants provided written informed consent. Institutional Review Boards of all participating institutions approved the study. We identified a subset of 2514 participants with eGFR <60 mL/min/1.73 m2 as defined by the Chronic Kidney Disease Epidemiology Collaboration (CKD-EPI) creatinine and cystatin C equation.19 Of these, we excluded 78 who were missing values for the three biomarkers of interest and an additional eight among whom the biomarker levels were invalid. We further excluded 51 who were missing other covariates [statin use, body mass index (BMI), urine creatinine, urine albumin, or smoking status] resulting in a final analysis sample of 2377 participants.
Exposures
Urinary specimens from the baseline SPRINT visit were stored at −80°C until thawing for kidney tubule biomarker measurements. All three urine biomarkers of tubule function were measured in duplicate and the results averaged, at the University of Vermont. Urine α1m was measured using a Siemens nephelometric assay with a detectable range from 5 to 480 mg/L and interassay coefficients of variation ranging from 3.5% to 8.8% across the analytic range. A multiplex assay was used to measure β2m and uromodulin, the analytic ranges for which were 1.2–5020 ng/mL (β2m) and 0.6–2510 ng/mL (uromodulin), respectively, and the interassay CVs were 13–16% (β2m) and 11–19% (uromodulin). Urine creatinine was measured using an enzymatic procedure (Roche, Indianapolis, IN, USA) and urine albumin using a nephelometric method (Siemens, Tarrytown, NY, USA).20
Outcomes
A composite CVD endpoint was the primary outcome of both the SPRINT trial and this analysis. This included myocardial infarction, acute coronary syndrome (ACS) not resulting in myocardial infarction, stroke, acute decompensated HF, or death from cardiovascular causes. Secondary outcomes included all-cause mortality, and the individual components of the primary composite outcome. Clinical events occurring during follow-up were ascertained primarily through surveillance of self-reported events obtained via structured interviews every 3 months, and through laboratory and ECG data collected by the study, and were adjudicated by members of the Morbidity and Mortality subcommittee masked to treatment assignment.17
Covariates
Demographic, clinical, and laboratory data obtained at baseline were used in this analysis. Adjustment variables for statistical models were selected based on prior knowledge of factors that could potentially confound the associations. Established CVD risk factors at baseline included age, gender, race (non-Hispanic white, non-Hispanic black, Hispanic/other), BMI, smoking (current/former/never), systolic and diastolic blood pressures, number of anti-hypertensive medications, statin use, and history of CVD or HF. We also adjusted for baseline laboratory measures including urine creatinine, eGFR, urine albumin, total cholesterol, HDL cholesterol, triglycerides, and finally the other two tubular function biomarkers.
Statistical analysis
We described the distribution of baseline participant characteristics across quartiles tubular function markers using summary statistics. For the continuous analyses, biomarker values were log base-2 transformed to allow interpretation as ‘per two-fold higher’ as their distributions were skewed. We used Spearman’s coefficients to evaluate the correlations of biomarkers indexed to creatinine with eGFR and urine albumin-to-creatinine ratio.
We evaluated the association between each tubular function marker and each of our outcomes using Cox proportional hazards regression. The biomarkers were modelled both as continuous and categorical (quartile) variables. For each outcome, we fit a series of sequential models. In Model 1, we adjusted for age, sex, race, randomization arm, and baseline urine creatinine. In Model 2, we further adjusted for baseline eGFR, log urine albumin, smoking (current/former/never), BMI (linear spline with a knot at 25 to account for increased risk of outcomes at both high and low BMIs), systolic and diastolic blood pressure, number of anti-hypertensive medications, history of CVD or HF, HDL cholesterol, total cholesterol, triglycerides, and statin use. A final Model 3 further adjusted for each of the other two kidney tubular function biomarkers. We reported hazard ratios (HRs) and the corresponding 95% confidence intervals. In sensitivity analyses, we evaluated death as a competing risk for each of the secondary outcomes. We tested for an interaction by randomization treatment arm, and by the presence or absence of prevalent CVD at baseline, using the likelihood ratio test. We evaluated whether addition of individual or all biomarkers to a base CVD risk model improved area under the curve for the model to the discriminate CVD risk.
All analyses were conducted using Stata/MP Version 15.1 (StataCorp LLC, College Station, TX, USA) and estimates with two-sided P-values <0.05 were considered significant for all analyses including interaction terms.
Results
Baseline characteristics
The mean age of the 2377 SPRINT participants with CKD was 73 ± 9 (SD) years, 40% were women, and 26% were black. The mean eGFR ± SD was 46 ± 11 mL/min per 1.73 m2, and median urine ACR was 14 [interquartile range (IQR), 6.9–45.5] mg/g. The median follow-up time for the composite CVD outcome was 3.8 years (IQR, 3.2–4.4 years).
Table 1 shows the baseline participant characteristics stratified by urine α1m quartiles. Compared to participants in the lowest quartile of α1m, those in the highest quartile were less likely to be female, had greater prevalence of CVD and its risk factors including smoking, lower eGFR, and higher systolic and diastolic blood pressures. Similar patterns were seen when participants were stratified based on β2m quartiles (Supplementary material online, Table S1). In contrast, higher uromodulin quartiles were characterized by fewer smokers, lower prevalent CVD, lower SBP, lower ACR, and higher eGFR (Supplementary material online, Table S2).
Table 1.
Baseline characteristics of participants with chronic kidney disease by quartiles of alpha-1 microglobulin in SPRINT
| Quartile 1: <7.09 mg/L (N = 592) | Quartile 2: 7.09–13.3 mg/L (N = 605) | Quartile 3: 13.4–24.9 mg/L (N = 594) | Quartile 4: 25.0–283 mg/L (N = 586) | |
|---|---|---|---|---|
| Age (years) | 72.8 (8.9) | 72.8 (8.5) | 73.9 (9.3) | 72.9 (9.7) |
| Female | 350 (59.1) | 287 (47.4) | 182 (30.6) | 140 (23.9) |
| Race | ||||
| NH white | 390 (65.9) | 394 (65.1) | 401 (67.5) | 381 (65.0) |
| NH black | 155 (26.2) | 162 (26.8) | 139 (23.4) | 154 (26.3) |
| Hispanic and other | 47 (7.9) | 49 (8.1) | 54 (9.1) | 51 (8.7) |
| BMI (kg/m2) | 30.8 (6.3) | 29.7 (5.8) | 28.9 (5.7) | 28.7 (5.5) |
| Intensive BP arm | 317 (53.5) | 309 (51.1) | 312 (52.5) | 284 (48.5) |
| History of CVD or HF | 132 (22.3) | 144 (23.8) | 144 (24.2) | 179 (30.5) |
| Smoking status | ||||
| Never smoker | 278 (47.0) | 294 (48.6) | 260 (43.8) | 239 (40.8) |
| Former smoker | 273 (46.1) | 266 (44.0) | 284 (47.8) | 272 (46.4) |
| Current smoker | 41 (6.9) | 45 (7.4) | 50 (8.4) | 75 (12.8) |
| Urine creatinine (mg/dL) | 87.1 (58.2) | 119.8 (66.2) | 131.3 (76.17) | 159.3 (77.26) |
| eGFR (ml/min/1.73 m2) | 50.6 (43.0–55.6) | 50.0 (41.3–55.7) | 48.1 (39.1–54.6) | 42.7 (33.1–51.1) |
| Urine albumin | 7.0 (4.0–15.0) | 12.0 (7.0–27.0) | 19.0 (9.0–71.0) | 48.0 (19.0–150.0) |
| Systolic BP (mmHg) | 137.1 (16.6) | 139.4 (16.6) | 140.2 (15.4) | 141.4 (16.7) |
| Diastolic BP (mmHg) | 73.0 (11.3) | 74.0 (12.3) | 74.4 (12.4) | 75.7 (12.8) |
| Anti-hypertensive medications | 2.2 (0.9) | 2.1 (0.9) | 2.1 (1.0) | 2.2 (1.0) |
| Total cholesterol (mg/dL) | 188.5 (39.0) | 186.1 (41.0) | 181.1 (41.9) | 179.6 (41.0) |
| LDL cholesterol (mg/dL) | 109.4 (34.4) | 107.7 (34.6) | 103.9 (34.25) | 102.7 (34.1) |
| HDL cholesterol (mg/dL) | 53.2 (13.7) | 53.0 (14.0) | 52.2 (14.5) | 50.7 (15.3) |
| Triglycerides (mg/dL) | 115.5 (85.0–156.5) | 110.0 (81.0–151.0) | 107.5 (77.0–149.0) | 113.0 (83.0–153.0) |
| Statin use | 291 (49.2) | 312 (51.6) | 326 (54.9) | 310 (52.9) |
All values are represented as mean (SD) or n (%) or median (IQR).
After indexing to urine creatinine, both α1m and β2m were moderately and positively correlated with each other (r = 0.57) but very weakly with uromodulin (r = <0.01–0.16) (Supplementary material online, Table S3). Both α1m and β2m were also weakly and inversely correlated with eGFR (r = −0.33 and −0.15, respectively) and directly with urine albuminuria (r = 0.48 and 0.29, respectively). Uromodulin was weakly and directly correlated with eGFR (r = 0.25) and inversely with albuminuria (r = −0.09).
Primary outcomes
There were 305 composite CVD events in our study sample, with an incidence rate of 3.59/100 person-years. There was a strong and incremental increase in the incidence of composite CVD events across increasing quartiles of α1m, and a weaker increase across β2m quartiles (Figure 1). A two-fold higher α1m concentration was associated with a 26% greater risk for the composite CVD events endpoint, after adjusting for multiple confounders including eGFR, albuminuria, β2m, and uromodulin (Table 2). Participants in the fourth quartile of α1m were at 80% greater risk for the composite CVD endpoint compared to the first quartile. While higher β2m levels were associated with the composite CVD outcome in univariate models, there was no association after adjusting for confounding variables.
Figure 1.

Unadjusted incidence rates of composite cardiovascular disease events and mortality across quartiles of tubular function biomarkers. Each point in the figure depicts the unadjusted incidence rates for composite cardiovascular disease events per quartile of biomarker. The lines on either side of the points represent the standard error bars for the incident rate.
Table 2.
Association of tubular function biomarkers with cardiovascular events among SPRINT participants with chronic kidney disease
| Alpha-1 microglobulin |
|||||
|---|---|---|---|---|---|
| Per two-fold higher | Quartile 1: LOD–7.08 mg/L | Quartile 2: 7.09–13.3 mg/L | Quartile 3: 13.4–24.9 mg/L | Quartile 4: 25.0–283 mg/L | |
| Events/N | 305/2377 | 51/592 | 67/605 | 74/594 | 113/586 |
| Model 1 | 1.40 (1.26–1.56) | 1 (ref) | 1.35 (0.93–1.96) | 1.50 (1.04–2.18) | 2.61 (1.82–3.75) |
| Model 2 | 1.22 (1.08–1.38) | 1 (ref) | 1.22 (0.84–1.78) | 1.21 (0.82–1.79) | 1.69 (1.12–2.54) |
| Model 3 | 1.26 (1.10–1.45) | 1 (ref) | 1.25 (0.85–1.84) | 1.24 (0.82–1.88) | 1.79 (1.14–2.81) |
|
| |||||
| Beta-2 microglobulin |
|||||
| Per two-fold higher | Quartile 1: LOD–33.9 ng/mL | Quartile 2: 34.0–96.7 ng/mL | Quartile 3: 96.8–318.8 ng/mL | Quartile 4: 319.1–9667.4 ng/mL | |
|
| |||||
| Events/N | 305/2377 | 65/593 | 68/601 | 75/595 | 97/588 |
| Model 1 | 1.06 (1.02–1.11) | 1 (ref) | 0.93 (0.66–1.31) | 1.09 (0.78–1.52) | 1.40 (1.02–1.93) |
| Model 2 | 1.03 (0.98–1.07) | 1 (ref) | 1.00 (0.71–1.40) | 1.13 (0.81–1.59) | 1.12 (0.80–1.56) |
| Model 3 | 1.00 (0.95–1.05) | 1 (ref) | 0.99 (0.70–1.40) | 1.08 (0.76–1.53) | 0.95 (0.66–1.37) |
|
| |||||
| Uromodulin |
|||||
| Per two-fold higher | Quartile 1: 0.24–4.28 μg/mL | Quartile 2: 4.29–6.54 μg/mL | Quartile 3: 6.55–9.93 μg/mL | Quartile 4: 9.94–127.2 μg/mL | |
|
| |||||
| Events/N | 305/2377 | 94/592 | 84/595 | 72/595 | 55/595 |
| Model 1 | 0.74 (0.65–0.83) | 1 (ref) | 0.82 (0.60–1.11) | 0.69 (0.50–0.96) | 0.55 (0.38–0.80) |
| Model 2 | 0.81 (0.71–0.93) | 1 (ref) | 0.97 (0.70–1.32) | 0.92 (0.65–1.30) | 0.78 (0.53–1.15) |
| Model 3 | 0.79 (0.68–0.90) | 1 (ref) | 0.93 (0.67–1.28) | 0.89 (0.62–1.25) | 0.73 (0.49–1.09) |
Model 1: age, sex, race, intervention arm, and urine creatinine. Model 2: Model 1 + eGFR, log urine albumin, smoking, body mass index, systolic blood pressure, diastolic blood pressure, number of anti-hypertensive medications at baseline, history of cardiovascular disease, heart failure, HDL cholesterol, total cholesterol, triglycerides, and statin use. Model 3: Model 2 + other two tubular function biomarkers. LOD, level of detection.
The unadjusted incidence rate of composite CVD events declined across increasing quartiles of uromodulin (Figure 1). In continuous models, a two-fold higher urine uromodulin concentration was associated with a 21% lower risk of the composite CVD endpoint after multivariable adjustment (Table 2). The highest quartile of uromodulin was associated with statistically significant 45% lower risk of composite CVD in a model adjusted for age, sex, race, intervention arm, and urine creatinine when compared with the first quartile. However, this association failed to meet statistical significance after further adjusting for composite CVD risk factors and other tubular biomarkers.
Secondary outcomes
There were 233 deaths in our study sample over the follow-up period. There was a more than doubling in the incidence of all-cause mortality across increasing quartiles of α1m (Figure 1). Per two-fold higher baseline level, α1m was associated with a 30% higher risk of all-cause mortality after multivariate adjustment (Table 3). The highest quartile of α1m was associated with statistically significant 1.7 times higher risk of death in a model adjusted for age, sex, race, intervention arm, urine creatinine, but this association failed to meet statistical significance after further adjusting for CVD risk factors and other tubular biomarkers. Levels of β2m were not associated with all-cause mortality. In continuous models, each two-fold higher uromodulin was associated with ∼15% lower risk mortality, which approached but did not reach statistical significance.
Table 3.
Association of tubular function biomarkers with all-cause mortality among SPRINT participants with chronic kidney disease
| Alpha-1 microglobulin |
|||||
|---|---|---|---|---|---|
| Per two-fold higher | Quartile 1: LOD–7.08 mg/L | Quartile 2: 7.09–13.3 mg/L | Quartile 3: 13.4–24.9 mg/L | Quartile 4: 25.0–283 mg/L | |
| Events/N | 233/2377 | 33/592 | 43/605 | 70/594 | 87/586 |
| Model 1 | 1.52 (1.35–1.71) | 1 (ref) | 1.32 (0.83–2.08) | 2.08 (1.35–3.20) | 2.78 (1.80–4.29) |
| Model 2 | 1.17 (1.02–1.34) | 1 (ref) | 1.08 (0.68–1.72) | 1.33 (0.85–2.09) | 1.25 (0.77–2.02) |
| Model 3 | 1.25 (1.06–1.46) | 1 (ref) | 1.12 (0.70–1.80) | 1.42 (0.88–2.29) | 1.43 (0.84–2.42) |
|
| |||||
| Beta-2 microglobulin |
|||||
| Per two-fold higher | Quartile 1: LOD–33.9 ng/mL | Quartile 2: 34.0–96.7 ng/mL | Quartile 3: 96.8–318.8 ng/mL | Quartile 4: 319.1–9667.4 ng/mL | |
|
| |||||
| Events/N | 233/2377 | 50/593 | 51/601 | 59/595 | 73/588 |
| Model 1 | 1.05 (1.00–1.10) | 1 (ref) | 0.88 (0.60–1.30) | 1.09 (0.74–1.59) | 1.28 (0.89–1.85) |
| Model 2 | 1.00 (0.95–1.04) | 1 (ref) | 0.96 (0.65–1.42) | 1.12 (0.77–1.65) | 0.87 (0.60–1.27) |
| Model 3 | 0.97 (0.92–1.02) | 1 (ref) | 0.97 (0.65–1.44) | 1.07 (0.72–1.59) | 0.79 (0.52–1.19) |
|
| |||||
| Uromodulin |
|||||
| Per two-fold higher | Quartile 1: 0.24–4.28 μg/mL | Quartile 2: 4.29–6.54 μg/mL | Quartile 3: 6.55–9.93 μg/mL | Quartile 4: 9.94–127.2 μg/mL | |
|
| |||||
| Events/N | 233/2377 | 75/592 | 67/595 | 43/595 | 48/595 |
| Model 1 | 0.74 (0.64–0.84) | 1 (ref) | 0.78 (0.55–1.09) | 0.50 (0.33–0.74) | 0.58 (0.38–0.86) |
| Model 2 | 0.87 (0.75–1.03) | 1 (ref) | 0.98 (0.69–1.40) | 0.76 (0.50–1.15) | 1.00 (0.65–1.56) |
| Model 3 | 0.86 (0.73–1.01) | 1 (ref) | 0.95 (0.66–1.37) | 0.75 (0.49–1.14) | 0.97 (0.62–1.52) |
Model 1: age, sex, race, intervention arm, and urine creatinine. Model 2: Model 1 + eGFR, log urine albumin, smoking, body mass index, systolic blood pressure, diastolic blood pressure, number of anti-hypertensive medications at baseline, history of cardiovascular disease, heart failure, HDL cholesterol, total cholesterol, triglycerides, and statin use. Model 3: Model 2 + other two tubular function biomarkers.
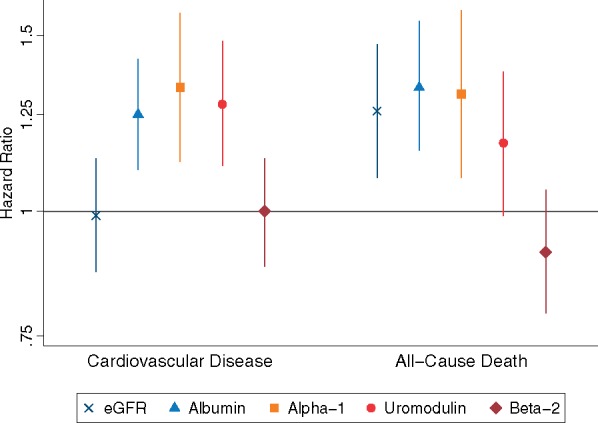
The Take home figure compares the HR of composite CVD and all-cause mortality per 1 SD change in each of the three tubular function biomarkers levels, and per 1 SD change in eGFR and albuminuria at baseline among SPRINT participants with CKD. The magnitude of effects of α1m and uromodulin for the composite CVD endpoint were slightly stronger than that of urine albumin. The magnitude of association of α1m with all-cause mortality was similar to eGFR and urine albumin.
Take home figure.
Comparison of the association of between estimated glomerular filtration rate, albumin–creatinine ratio, and tubular function biomarkers with composite cardiovascular disease events and all-cause mortality. The figure compares the HRs of composite cardiovascular disease and all-cause mortality per 1 SD change in each of the three tubular function biomarkers levels, estimated glomerular filtration rate, and albuminuria in baseline SPRINT participants with CKD. Uromodulin and estimated glomerular filtration rate are plotted as per 1 SD lower, while alpha-1 microglobulin, beta-2 microglobulin, and urine albumin are per 1 SD higher. All tubular function biomarkers, estimated glomerular filtration rate, and albuminuria are included in the same model and adjusted for all the variables listed in Model 3 in the preceding tables and text.
Table 4 depicts the associations of all three tubular function markers as continuous variables with the individual components of the composite primary endpoint. Higher α1m was significantly associated with a 60% and 85% greater risk of CVD death and ACS. Higher uromodulin levels were independently associated with lower risk of HF and CVD death after adjustment for similar confounders. There was no association between β2m and any of the secondary outcomes. Results of the competing risk analysis did not change the association of each of the tubular function biomarkers with any of the secondary outcomes (Supplementary material online, Table S4).
Table 4.
Association of tubular function biomarkers with secondary cardiovascular disease outcomes after multivariable adjustmenta
| Heart failure | CVD death | MI | ACS | Stroke | |
|---|---|---|---|---|---|
| Events | 123 | 67 | 108 | 27 | 72 |
| Incidence Rate/100PY | 1.40 (1.18–1.68) | 0.75 (0.59–0.95) | 1.24 (1.02–1.49) | 0.31 (0.21–0.45) | 0.82 (0.65–1.04) |
| Alpha-1 microglobulinb | 0.97 (0.77–1.22) | 1.61 (1.18–2.21) | 1.12 (0.89–1.41) | 1.85 (1.15–2.99) | 1.30 (0.97–1.73) |
| Beta-2 microglobulinb | 1.05 (0.97–1.13) | 0.99 (0.90–1.10) | 1.04 (0.96–1.13) | 0.90 (0.78–1.05) | 0.97 (0.88–1.06) |
| Uromodulinb | 0.70 (0.56–0.87) | 0.69 (0.50–0.93) | 0.92 (0.73–1.16) | 0.84 (0.95–1.06) | 0.83 (0.63–1.10) |
ACS, acute coronary syndrome; CVD, cardiovascular disease; MI, myocardial infarction.
Adjusted for age, sex, race, intervention arm, urine creatinine, eGFR, log urine albumin, smoking, body mass index, systolic blood pressure, diastolic blood pressure, number of anti-hypertensive medications at baseline, history of cardiovascular disease, heart failure, HDL cholesterol, total cholesterol, triglycerides, statin use, and other two tubular function biomarkers.
Per two-fold higher.
There were no significant interactions between prevalent CVD with any of the tubule function biomarkers for the primary outcome, although the observed biomarker associations were qualitatively stronger in participants without a history of CVD (all P-for-interaction > 0.05, Supplementary material online, Table S5). There were also no interactions between randomization arm with any of the tubule function biomarkers for the primary outcome (all P-for-interaction > 0.3, Supplementary material online, Table S6).
Adding α1m to the multivariable model (Model 2) significantly improved the c-statistic from 0.702 to 0.713 (P = 0.010). The c-statistic was somewhat higher with the addition of all three biomarkers, 0.721 (P = 0.003 compared with Model 2).
Discussion
Persons with CKD have substantially elevated risk for atherosclerotic CVD and HF, which are largely responsible for the reduced life expectancy in CKD patients. In this study, which evaluated the association between a panel of three kidney tubule function biomarkers and clinical outcomes, we demonstrate that higher urine α1m and lower urine uromodulin concentrations are significantly associated with the composite CVD outcome in a large cohort of persons with non-diabetic CKD. These relationships were independent of ‘glomerular’ markers of kidney health (eGFR and albuminuria) and other CVD risk factors. The strengths of associations for α1m and uromodulin with composite CVD were stronger than those of eGFR and comparable to albuminuria despite the fact that the biomarkers were adjusted for these variables in these comparisons. These findings demonstrate the importance of kidney tubule health as a determinant of CVD risk and survival in patients with CKD, and support a larger role for kidney tubule function assessment in the diagnosis and staging of CKD.
Glomerular filtration and albuminuria primarily assess glomerular function and injury, respectively. The kidney has many other important functions that are carried out by tubule cells including reabsorption of filtered nutrients, hormone production, acid-base regulation, maintenance of host defence, and the secretion of endogenous toxins and medications. None of these functions can be assessed by measuring eGFR or ACR alone, and eGFR is only moderately correlated with the various indicators of kidney tubular health.21 Tubulointerstitial fibrosis and atrophy are common in nearly all forms of kidney disease21–23 and their severity has consistently proven to be among the most reliable features on biopsy to predict progression to ESRD.22–24
Alpha-1 microglobulin is a 26-kD protein that is produced by the liver and partially bound to IgA and found in various connective tissues and blood.5 The unbound protein is freely filtered and nearly completely reabsorbed in the proximal tubule through active transport, thus allowing it to be evaluated as a marker of proximal tubule function.6 Data in persons with relatively well-preserved kidney function including HIV-infected women,7 elders,15 and participants enrolled in the Framingham Heart Study25 have reported that elevated urinary levels of α1m are associated with risk of all-cause mortality. Among prevalent kidney transplant recipients, each doubling of urine α1m was associated with a 40% higher risk of CVD and 50% higher risk of all-cause mortality.9 Our results, which are similar in direction but slightly weaker in magnitude; further, validate these associations in persons with CKD who have not received a kidney transplant.
The relationship of uromodulin with non-renal outcomes has been varied. In the Cardiovascular Health Study (CHS), each 1 SD higher uromodulin level was associated with a 10% lower risk of mortality, but urine concentrations were not associated with CVD events or HF.13 Participants in CHS differ by having an eGFR nearly 30 mL/min higher than the current study. Our findings in persons with CKD add to this growing body of evidence demonstrating that markers of tubular function are associated with CVD, HF and mortality risk, arguably the most important outcomes in the CKD population. Consistently, these associations appear to be robust to adjustment for eGFR and albuminuria.
The mechanisms underlying the association of better tubular function with lower composite CVD events and mortality remain unclear. In persons with drug-induced interstitial nephritis and those with kidney transplants, urine α1m levels correlate with the severity of interstitial fibrosis and tubular atrophy on kidney biopsy.26,27 Similarly, levels of serum uromodulin (which correlate strongly with urinary levels) were significantly lower early in the development of tubular atrophy, even before changes in GFR were noted.28 It is possible that higher α1m and lower uromodulin levels are surrogates for worse tubular function, such as erythropoietin production and maintenance of acid–base and mineral metabolism homoeostasis. In the case of uromodulin, which is exclusively produced by the thick ascending limb of the loop of Henle and the collecting ducts, it has been proposed that lower urinary levels reflect lower number of functioning tubules and/or reserve which may exacerbate progression of kidney disease. A prior study has demonstrated that higher levels of serum uromodulin are associated with lower levels of tubular atrophy and fibrosis.29 We hypothesize that both biomarkers capture the broad homeostatic functions of the kidney, which underlie its important role in both CVD and overall prognosis. While it is possible that there are direct mechanisms linking each of these urinary markers with CVD events, we believe that hypothesis is less likely.
Similar to α1m, β2M is filtered by the glomerulus and nearly completely reabsorbed and is reported to be able to differentiate albuminuria and non-albumin proteinuria.30 Elevated urinary levels of β2M may be indicative of early tubular damage due to cadmium31,32 or tenofovir33 toxicity. To our knowledge, this is the first study evaluating the association of β2M with CVD and mortality, and we found no associations. Thus, the biology captured by ɑ1M and β2M are similar, and it is of interest that we observed strong associations with CVD with ɑ1M but not β2M. Recent studies have questioned the value of β2M for detection of tubular dysfunction noting that changes in urinary β2M correlated more closely with glomerular damage leading to increased protein filtration rather than tubular function loss leading to lower reabsorption.34,35 Another possible reasons may be poor stability of β2M in urine as compared to α1m. Data show that β2M is unstable in urine when the pH is <7 and grossly so below a urine pH of 6.36,37
This study has important limitations. First, SPRINT excluded persons with diabetes and high-grade proteinuria but included participants with Stage 3–4 CKD. In the main SPRINT study, the intensive BP lowering intervention had similar benefit in those with CKD as in the remainder of the study sample. There is controversy over the optimal BP targets. Based on the SPRINT findings, the 2017 AHA hypertension guidelines have recommended that persons with hypertension and CKD should be treated to a BP of <130/80 mmHg.38 On the other hand, the 2018 European Society of Cardiology and European Society of Hypertension (ESC/ESH) suggest that in CKD, blood pressure should be lowered to <140/90 mmHg and towards 130/80 mmHg, additionally noting an increased risk of mortality with SBP <120 mmHg.39 We had hoped that the tubule function biomarkers might identify subsets who would benefit from more or less intensive BP lowering within SPRINT, but did not find interactions to support such findings. As such, the data provided here do not meaningfully influence the debate on appropriate BP targets. Therefore future studies are required to determine if results observed here generalize to other settings.13,40 Second, 24-h specimens were not available in SPRINT, so we used spot urine samples.7,13,41 Third, we evaluated biomarkers measured at baseline. It remains to be determined if changes in these markers provides information on CVD risk beyond baseline values. Finally, due to the lack data on urine pH, we are unable to evaluate if the lack of association of β2M with outcomes is due to issues with its stability in acidic pH.
This study also has a number of strengths. To our knowledge, this is the largest study evaluating a panel of tubular functional markers in persons with CKD. The concurrent assessment allowed us to demonstrate the correlations of these three distinct markers, and evaluate the degree to which associations with CVD are independent of the other tubule function markers. All tubule function markers were measured in duplicate, thereby improving precision. This study population comprised participants enrolled in a clinical trial with robust adjudication of composite CVD as the primary endpoint, the main outcome of this study.
In this large study of non-diabetic persons with CKD, worse kidney tubule function, defined by higher urinary α1m and lower uromodulin levels, was associated with higher risk of CVD events and mortality independent of eGFR, ACR, and other risk factors. Neither the intensity of blood pressure control nor presence of CVD at baseline impacted the results. If replicated in other settings, kidney tubule function merits consideration as an additional axis of CKD diagnosis and staging, given the strong associations with CVD events independent of ‘glomerular’ kidney measures, and that CVD is the most common cause of death and morbidity in CKD patients.
Supplementary Material
Acknowledgements
We acknowledge the support from the following CTSAs funded by NCATS: CWRU: UL1TR000439, OSU: UL1RR025755, U Penn: UL1RR024134 and UL1TR000003, Boston: UL1RR025771, Stanford: UL1TR000093, Tufts: UL1RR025752, UL1TR000073, and UL1TR001064, University of Illinois: UL1TR000050, University of Pittsburgh: UL1TR000005, UT Southwestern: 9U54TR000017-06, University of Utah: UL1TR000105-05, Vanderbilt University: UL1 TR000445, George Washington University: UL1TR000075, University of CA, Davis: UL1 TR000002, University of Florida: UL1 TR000064, University of Michigan: UL1TR000433, Tulane University: P30GM103337 COBRE Award NIGMS, and Wake Forest University: UL1TR001420.
Funding
This work was supported by the NIH and the National Research Service Award (NRSA) through the National Institutes of Diabetes and Digestive and Kidney Diseases (NIDDK grant K23 DK114556 to P.G., R01DK098234 and K24DK110427 to J.H.I.), and the American Heart Association (14EIA18560026 to J.H.I.). The Systolic Blood Pressure Intervention Trial is funded with Federal funds from the National Institutes of Health (NIH), including the National Heart, Lung, and Blood Institute (NHLBI), the National Institute of Diabetes and Digestive and Kidney Diseases (NIDDK), the National Institute on Aging (NIA), and the National Institute of Neurological Disorders and Stroke (NINDS), under Contract Numbers HHSN268200900040C, HHSN268200900046C, HHSN268200900047C, HHSN268200900048C, HHSN268200900049C, and Inter-Agency Agreement Number A-HL-13-002-001. It was also supported in part with resources and use of facilities through the Department of Veterans Affairs. The SPRINT investigators acknowledge the contribution of study medications (azilsartan and azilsartan combined with chlorthalidone) from Takeda Pharmaceuticals International, Inc. All components of the SPRINT study protocol were designed and implemented by the investigators. The investigative team collected, analysed, and interpreted the data. All aspects of manuscript writing and revision were carried out by the co-authors. The content is solely the responsibility of the authors and does not necessarily represent the official views of the NIH, the U.S. Department of Veterans Affairs, or the United States Government. For a full list of contributors to SPRINT, please see the supplementary acknowledgement list: https://www.sprinttrial.org/public/dspScience.cfm.
Conflict of interest: M.G.S. has worked as a consultant for the University of Washington as well as has equity in TAI Diagnostics and Cricket Health, Inc. All the other authors have no other relevant conflict of interest.
See page 3494 for the editorial comment on this article (doi: 10.1093/eurheartj/ehz489)
References
- 1. Sarnak MJ, Levey AS, Schoolwerth AC, Coresh J, Culleton B, Hamm LL, McCullough PA, Kasiske BL, Kelepouris E, Klag MJ, Parfrey P, Pfeffer M, Raij L, Spinosa DJ, Wilson PW; American Heart Association Councils on Kidney in Cardiovascular Disease HBPRCC, Epidemiology, Prevention. Kidney disease as a risk factor for development of cardiovascular disease: a statement from the American Heart Association Councils on Kidney in Cardiovascular Disease, High Blood Pressure Research, Clinical Cardiology, and Epidemiology and Prevention. Circulation 2003;108:2154–2169. [DOI] [PubMed] [Google Scholar]
- 2. Driver TH, Katz R, Ix JH, Magnani JW, Peralta CA, Parikh CR, Fried L, Newman AB, Kritchevsky SB, Sarnak MJ, Shlipak MG; on behalf of the Health ABC Study. Urinary kidney injury molecule 1 (KIM-1) and interleukin 18 (IL-18) as risk markers for heart failure in older adults: the Health, Aging, and Body Composition (Health ABC) Study. Am J Kidney Dis 2014;64:49–56. [DOI] [PMC free article] [PubMed] [Google Scholar]
- 3. Park M, Hsu CY, Go AS, Feldman HI, Xie D, Zhang X, Mifflin T, Waikar SS, Sabbisetti VS, Bonventre JV, Coresh J, Nelson RG, Kimmel PL, Kusek JW, Rahman M, Schelling JR, Vasan RS, Liu KD; Chronic Renal Insufficiency Cohort (CRIC) Study Investigators; CKD Biomarkers Consortium. Urine kidney injury biomarkers and risks of cardiovascular disease events and all-cause death: the CRIC study. Clin J Am Soc Nephrol 2017;12:761–771. [DOI] [PMC free article] [PubMed] [Google Scholar]
- 4. Liu KD, Yang W, Go AS, Anderson AH, Feldman HI, Fischer MJ, He J, Kallem RR, Kusek JW, Master SR, Miller ER, Rosas SE, Steigerwalt S, Tao K, Weir MR, Hsu CY, Investigators CS.. Urine neutrophil gelatinase-associated lipocalin and risk of cardiovascular disease and death in CKD: results from the Chronic Renal Insufficiency Cohort (CRIC) Study. Am J Kidney Dis 2015;65:267–274. [DOI] [PMC free article] [PubMed] [Google Scholar]
- 5. Akerstrom B, Logdberg L, Berggard T, Osmark P, Lindqvist A.. alpha(1)-microglobulin: a yellow-brown lipocalin. Biochim Biophys Acta 2000;1482:172–184. [DOI] [PubMed] [Google Scholar]
- 6. Weber MH, Verwiebe R.. Alpha 1-microglobulin (protein HC): features of a promising indicator of proximal tubular dysfunction. Eur J Clin Chem Clin Biochem 1992;30:683–691. [PubMed] [Google Scholar]
- 7. Jotwani V, Scherzer R, Abraham A, Estrella MM, Bennett M, Cohen MH, Nowicki M, Sharma A, Young M, Tien PC, Ix JH, Sarnak MJ, Parikh CR, Shlipak MG.. Association of urine alpha1-microglobulin with kidney function decline and mortality in HIV-infected women. Clin J Am Soc Nephrol 2015;10:63–73. [DOI] [PMC free article] [PubMed] [Google Scholar]
- 8. Foster MC, Weiner DE, Bostom AG, Carpenter MA, Inker LA, Jarolim P, Joseph AA, Kusek JW, Pesavento T, Pfeffer MA, Rao M, Solomon SD, Levey AS.. Filtration markers, cardiovascular disease, mortality, and kidney outcomes in stable kidney transplant recipients: the FAVORIT trial. Am J Transplant 2017;17:2390–2399. [DOI] [PMC free article] [PubMed] [Google Scholar]
- 9. Park M, Katz R, Shlipak MG, Weiner D, Tracy R, Jotwani V, Hughes-Austin J, Gabbai F, Hsu CY, Pfeffer M, Bansal N, Bostom A, Gutierrez O, Sarnak M, Levey A, Ix JH.. Urinary markers of fibrosis and risk of cardiovascular events and death in kidney transplant recipients: the FAVORIT trial. Am J Transplant 2017;17:2640–2649. [DOI] [PMC free article] [PubMed] [Google Scholar]
- 10. Tamm I, Horsfall FL Jr.. A mucoprotein derived from human urine which reacts with influenza, mumps, and Newcastle disease viruses. J Exp Med 1951;95:71–97. [DOI] [PMC free article] [PubMed] [Google Scholar]
- 11. Tamm I, Horsfall FL Jr.. Characterization and separation of an inhibitor of viral hemagglutination present in urine. Proc Soc Exp Biol Med 1950;74:106–108. [PubMed] [Google Scholar]
- 12. Bleyer AJ, Kmoch S.. Tamm Horsfall glycoprotein and uromodulin: it is all about the tubules! Clin J Am Soc Nephrol 2016;11:6–8. [DOI] [PMC free article] [PubMed] [Google Scholar]
- 13. Garimella PS, Biggs ML, Katz R, Ix JH, Bennett MR, Devarajan P, Kestenbaum BR, Siscovick DS, Jensen MK, Shlipak MG, Chaves PH, Sarnak MJ.. Urinary uromodulin, kidney function, and cardiovascular disease in elderly adults. Kidney Int 2015;88:1126–1134. [DOI] [PMC free article] [PubMed] [Google Scholar]
- 14. Garimella PS, Bartz TM, Ix JH, Chonchol M, Shlipak MG, Devarajan P, Bennett MR, Sarnak MJ.. Urinary uromodulin and risk for urinary tract infection: the Cardiovascular Health Study. Am J Kid Dis 2017;69:744–751. [DOI] [PMC free article] [PubMed] [Google Scholar]
- 15. Jotwani V, Katz R, Ix JH, Gutierrez OM, Bennett M, Parikh CR, Cummings SR, Sarnak MJ, Shlipak MG.. Urinary biomarkers of kidney tubular damage and risk of cardiovascular disease and mortality in elders. Am J Kidney Dis 2018;72:205–213. [DOI] [PMC free article] [PubMed] [Google Scholar]
- 16. Sarnak MJ, Levey AS, Schoolwerth AC, Coresh J, Culleton B, Hamm LL, McCullough PA, Kasiske BL, Kelepouris E, Klag MJ, Parfrey P, Pfeffer M, Raij L, Spinosa DJ, Wilson PW.. Kidney disease as a risk factor for development of cardiovascular disease: a statement from the American Heart Association Councils on Kidney in Cardiovascular Disease, High Blood Pressure Research, Clinical Cardiology, and Epidemiology and Prevention. Hypertension 2003;42:1050–1065. [DOI] [PubMed] [Google Scholar]
- 17. Wright JT Jr, Whelton PK, Reboussin DM.. A randomized trial of intensive versus standard blood-pressure control. N Engl J Med 2016;374:2294. [DOI] [PubMed] [Google Scholar]
- 18. Ambrosius WT, Sink KM, Foy CG, Berlowitz DR, Cheung AK, Cushman WC, Fine LJ, Goff DC Jr, Johnson KC, Killeen AA, Lewis CE, Oparil S, Reboussin DM, Rocco MV, Snyder JK, Williamson JD, Wright JT Jr, Whelton PK; SPRINT Study Research Group. The design and rationale of a multicenter clinical trial comparing two strategies for control of systolic blood pressure: the Systolic Blood Pressure Intervention Trial (SPRINT). Clin Trials 2014;11:532–546. [DOI] [PMC free article] [PubMed] [Google Scholar]
- 19. Inker LA, Schmid CH, Tighiouart H, Eckfeldt JH, Feldman HI, Greene T, Kusek JW, Manzi J, Van Lente F, Zhang YL, Coresh J, Levey AS.. Estimating glomerular filtration rate from serum creatinine and cystatin C. N Engl J Med 2012;367:20–29. [DOI] [PMC free article] [PubMed] [Google Scholar]
- 20. Cheung AK, Rahman M, Reboussin DM, Craven TE, Greene T, Kimmel PL, Cushman WC, Hawfield AT, Johnson KC, Lewis CE, Oparil S, Rocco MV, Sink KM, Whelton PK, Wright JT Jr, Basile J, Beddhu S, Bhatt U, Chang TI, Chertow GM, Chonchol M, Freedman BI, Haley W, Ix JH, Katz LA, Killeen AA, Papademetriou V, Ricardo AC, Servilla K, Wall B, Wolfgram D, Yee J; SPRINT Study Research Group. Effects of intensive BP control in CKD. J Am Soc Nephrol 2017;28:2812–2823. [DOI] [PMC free article] [PubMed] [Google Scholar]
- 21. Rule AD, Amer H, Cornell LD, Taler SJ, Cosio FG, Kremers WK, Textor SC, Stegall MD.. The association between age and nephrosclerosis on renal biopsy among healthy adults. Ann Intern Med 2010;152:561–567. [DOI] [PMC free article] [PubMed] [Google Scholar]
- 22. Nath KA. Tubulointerstitial changes as a major determinant in the progression of renal damage. Am J Kidney Dis 1992;20:1–17. [DOI] [PubMed] [Google Scholar]
- 23. Ong AC, Fine LG.. Loss of glomerular function and tubulointerstitial fibrosis: cause or effect? Kidney Int 1994;45:345–351. [DOI] [PubMed] [Google Scholar]
- 24. Howie AJ, Ferreira MA, Adu D.. Prognostic value of simple measurement of chronic damage in renal biopsy specimens. Nephrol Dial Transplant 2001;16:1163–1169. [DOI] [PubMed] [Google Scholar]
- 25. O'Seaghdha CM, Hwang SJ, Larson MG, Meigs JB, Vasan RS, Fox CS.. Analysis of a urinary biomarker panel for incident kidney disease and clinical outcomes. J Am Soc Nephrol 2013;24:1880–1888. [DOI] [PMC free article] [PubMed] [Google Scholar]
- 26. Amer H, Lieske JC, Rule AD, Kremers WK, Larson TS, Franco Palacios CR, Stegall MD, Cosio FG.. Urine high and low molecular weight proteins one-year post-kidney transplant: relationship to histology and graft survival. Am J Transplant 2013;13:676–684. [DOI] [PMC free article] [PubMed] [Google Scholar]
- 27. Wu Y, Yang L, Su T, Wang C, Liu G, Li XM.. Pathological significance of a panel of urinary biomarkers in patients with drug-induced tubulointerstitial nephritis. Clin J Am Soc Nephrol 2010;5:1954–1959. [DOI] [PMC free article] [PubMed] [Google Scholar]
- 28. Khasun M, Kayukov I, Beresneva O, Parastaeva M, Galkina O, Sipovskii V, Smirnov A.. MP309 serum uromodulin is early biomarker of interstitial fibrosis/tubular atrophy in patients with glomerlopathies. Nephrol Dial Transplant 2017;32:iii539. [DOI] [PubMed] [Google Scholar]
- 29. Prajczer S, Heidenreich U, Pfaller W, Kotanko P, Lhotta K, Jennings P.. Evidence for a role of uromodulin in chronic kidney disease progression. Nephrol Dial Transplant 2010;25:1896–1903. [DOI] [PubMed] [Google Scholar]
- 30. Peterson PA, Evrin PE, Berggard I.. Differentiation of glomerular, tubular, and normal proteinuria: determinations of urinary excretion of beta-2-macroglobulin, albumin, and total protein. J Clin Invest 1969;48:1189–1198. [DOI] [PMC free article] [PubMed] [Google Scholar]
- 31. Stewart M, Hughes EG.. Urinary beta 2 microglobulin in the biological monitoring of cadmium workers. Br J Ind Med 1981;38:170–174. [DOI] [PMC free article] [PubMed] [Google Scholar]
- 32. Tsuchiya K, Iwao S, Sugita M, Sakurai H.. Increased urinary beta 2-microglobulin in cadmium exposure: dose-effect relationship and biological significance of beta 2-microglobulin. Environ Health Perspect 1979;28:147–153. [DOI] [PMC free article] [PubMed] [Google Scholar]
- 33. Gatanaga H, Tachikawa N, Kikuchi Y, Teruya K, Genka I, Honda M, Tanuma J, Yazaki H, Ueda A, Kimura S, Oka S.. Urinary beta2-microglobulin as a possible sensitive marker for renal injury caused by tenofovir disoproxil fumarate. AIDS Res Hum Retroviruses 2006;22:744–748. [DOI] [PubMed] [Google Scholar]
- 34. Vlasakova K, Erdos Z, Troth SP, McNulty K, Chapeau-Campredon V, Mokrzycki N, Muniappa N, Gu YZ, Holder D, Bailey WJ, Sistare FD, Glaab WE.. Evaluation of the relative performance of 12 urinary biomarkers for renal safety across 22 rat sensitivity and specificity studies. Toxicol Sci 2014;138:3–20. [DOI] [PubMed] [Google Scholar]
- 35. Choe JY, Park SH, Kim SK.. Urine beta2-microglobulin is associated with clinical disease activity and renal involvement in female patients with systemic lupus erythematosus. Lupus 2014;23:1486–1493. [DOI] [PubMed] [Google Scholar]
- 36. Donaldson MD, Chambers RE, Woolridge MW, Whicher JT.. Stability of alpha 1-microglobulin, beta 2-microglobulin and retinol binding protein in urine. Clin Chim Acta 1989;179:73–77. [DOI] [PubMed] [Google Scholar]
- 37. Bernard AM, Vyskocil AA, Mahieu P, Lauwerys RR.. Assessment of urinary retinol-binding protein as an index of proximal tubular injury. Clin Chem 1987;33:775–779. [PubMed] [Google Scholar]
- 38. Whelton PK, Carey RM, Aronow WS, Casey DE Jr, Collins KJ, Dennison Himmelfarb C, DePalma SM, Gidding S, Jamerson KA, Jones DW, MacLaughlin EJ, Muntner P, Ovbiagele B, Smith SC Jr, Spencer CC, Stafford RS, Taler SJ, Thomas RJ, Williams KA Sr, Williamson JD, Wright JT Jr.. 2017 ACC/AHA/AAPA/ABC/ACPM/AGS/APhA/ASH/ASPC/NMA/PCNA guideline for the prevention, detection, evaluation, and management of high blood pressure in adults: executive summary: a report of the American College of Cardiology/American Heart Association Task Force on Clinical Practice Guidelines. Hypertension 2018;71:1269–1324. [DOI] [PubMed] [Google Scholar]
- 39. Williams B, Mancia G, Spiering W, Agabiti Rosei E, Azizi M, Burnier M, Clement DL, Coca A, de Simone G, Dominiczak A, Kahan T, Mahfoud F, Redon J, Ruilope L, Zanchetti A, Kerins M, Kjeldsen SE, Kreutz R, Laurent S, Lip GYH, McManus R, Narkiewicz K, Ruschitzka F, Schmieder RE, Shlyakhto E, Tsioufis C, Aboyans V, Desormais I; ESC Scientific Document Group. 2018 ESC/ESH Guidelines for the management of arterial hypertension. Eur Heart J 2018;39:3021–3104. [DOI] [PubMed] [Google Scholar]
- 40. Garimella PS, Katz R, Ix JH, Fried LF, Kritchevsky SB, Devarajan P, Bennett MR, Parikh CR, Shlipak MG, Harris TB, Gutierrez OM, Sarnak MJ.. Association of urinary uromodulin with kidney function decline and mortality: the health ABC study. Clin Nephrol 2017;87:278–286. [DOI] [PMC free article] [PubMed] [Google Scholar]
- 41. Ix JH, Katz R, Bansal N, Foster M, Weiner DE, Tracy R, Jotwani V, Hughes-Austin J, McKay D, Gabbai F, Hsu CY, Bostom A, Levey AS, Shlipak MG.. Urine fibrosis markers and risk of allograft failure in kidney transplant recipients: a case-cohort ancillary study of the FAVORIT Trial. Am J Kidney Dis 2017;69:410–419. [DOI] [PMC free article] [PubMed] [Google Scholar]
Associated Data
This section collects any data citations, data availability statements, or supplementary materials included in this article.