Abstract
Covalent coupling between a surface exposed cysteine residue and maleimide groups was used to immobilize variants of Myriococcum thermophilum cellobiose dehydrogenase (MtCDH) at multiwall carbon nanotube electrodes. By introducing individual cysteine residues at particular places on the surface of the flavodehydrogenase domain of the flavocytochrome we are able to immobilize the different variants in different orientations. Our results show that direct electron transfer (DET) occurs exclusively through the haem b cofactor and that the redox potential of the haem is unaffected by the orientation of the enzyme. Electron transfer between the haem and the electrode is fast in all cases and at high glucose concentrations the catalytic currents are limited by the rate of inter-domain electron transfer (IET) between the FAD and the haem. Using ferrocene carboxylic acid as a mediator we find that the total amount of immobilized enzyme is 4 to 5 times greater than the amount of enzyme that participates in DET. The role of IET in the overall DET catalysed oxidation was also demonstrated by the effects of changing Ca2+ concentration and by proteolytic cleavage of the cytochrome domain on the DET and MET currents.
Keywords: cellobiose dehydrogenase, enzyme immobilization, maleimide, direct electron transfer, inter-domain electron transfer
Introduction
Cellobiose dehydrogenase (CDH, cellobiose: acceptor 1-oxidoreductase, EC 1.1.99.18) is an extracellular enzyme, secreted by many wood-degrading fungi [1]. It is a monomeric flavocytochrome between 85 and 101 kDa in mass (depending on the degree of glycosylation) comprising one domain containing an FAD and another domain containing a haem b redox centre. The two domains are joined by a flexible linker of around 20 amino acids that allows the two to come in close contact for internal electron transfer (IET) [1d]. The crystal structure of the enzyme is known [2] and there are no surface cysteines in the wild type enzyme.
CDH is involved in the degradation process of cellulose. The enzyme can efficiently oxidise cellobiose and cello-oligosaccharides, but also many other sugars including disaccharides, such as lactose, and monosaccharides, such as glucose. Current interest in the enzyme derives from its possible application both in biosensors and biofuel cells [1c]. CDH displays the properties of a typical dehydrogenase in that it catalyses the oxidation at the C1 position of a saccharide, converting it to a lactone by removal of two electrons and two protons [1a]. All the evidence in the literature indicates that the oxidation of carbohydrates is carried out by the FAD cofactor, which takes up the two electrons to be fully reduced to FADH2 [1a]. FADH2 is then oxidised back to FAD by donating electrons to one- or two-electron acceptors in a typical ping-pong type mechanism. Commonly used electron acceptors with a high calatytic efficiency include quinones, Fe(III) and Os(III) complexes; molecular oxygen is a poor acceptor. In the absence of external acceptors, the FADH2 or the partially reduced FADH• semiquinone can transfer the electrons to the haem b in the cytochrome domain through an internal electron transfer (IET) and then the cytochrome b can, in turn, donate electrons to large soluble one-electron acceptors, such as lytic polysaccharide monooxygenase, cytochrome c, or to an electrode surface in a direct electron transfer (DET) process [1c]. All of the published work indicates that the cytochrome domain is responsible for DET at electrode surfaces in CDHs such as MtCDH used here. The growing interest in this enzyme derives from its ability to participate in DET at electrode surfaces, thanks to its haem cofactor that acts as an “internal mediator” shuttling electrons from the catalytic-site to the electrode. Thus CDH has been used to construct biosensors for the detection of different carbohydrates such as glucose and lactose [3], as well as for ATP [4], catecholamines [5] and phenolic pollutants [6]. In biofuel cells it has used as an anodic biocatalyst in glucose, lactose or cellobiose biofuel cells [7]. Electrochemical communication between CDH and electrodes has made use of direct electron transfer [8] or mediated electron transfer using different redox mediators [9] or redox polymers [10] and, in recent years, various nanostructured electrodes have been used to increase the efficiency of DET [3b, 3c, 7c, 10a].
CDH has been covalently immobilized on electrodes using glutaraldehyde cross-linking at gold electrodes modified with SAMs [3d, 8c] or at carbon electrodes modified with diazonium salts [7c]. Covalent immobilization of CDH has also been achieved by coupling between glutamic or aspartic acid residues on the enzyme surface to amino-modified ITO electrodes [7d]. However, although these methods may improve the stability of the enzyme at the surface, they do not allow control over the orientation of the immobilization. In this work, we used site-specific immobilization of CDH, employing maleimide-modified electrodes to react with MtCDH variants genetically engineered to bear a single free cysteine residue on the surface of the flavodehydrogenase domain. Contrary to previous work, the numbering of the engineered amino acid positions engineered to introduce a cysteine follows the numbering of the crystal structure of MtCDH (PDB code: 4QI6) [2]. The previously published numbering was based on the amino acid sequence including the signal peptide [11]. The positions can be compared by subtracting the 21 amino acids of the signal peptide which is cleaved off during maturation of the protein.
In designing the attachment of the engineered enzyme to the electrode surface several factors are important to consider. First, the surface coverage of the attachment site should be dilute in order that they do not block each other. Second, the attachment site should be on a flexible linker of sufficient length that it is accessible to the cysteine residue on the enzyme surface. Third, since the enzyme will be in held close proximity to the rest of the electrode surface around the attachment site, it is appropriate to consider the chemistry of this surface. In this work we adopt a modular approach [11] based on electrografting of primary amines at the carbon surface and solid phase synthesis methodology that allows us to control the surface attachment. We show that this leads to very stable functional attachment of MtCDH to the electrode surface and that we are able to interrogate the direct electron transfer (DET) and mediated electron transfer (MET) for four different MtCDH variants immobilized in different orientations at the electrode surface.
Results and Discussion
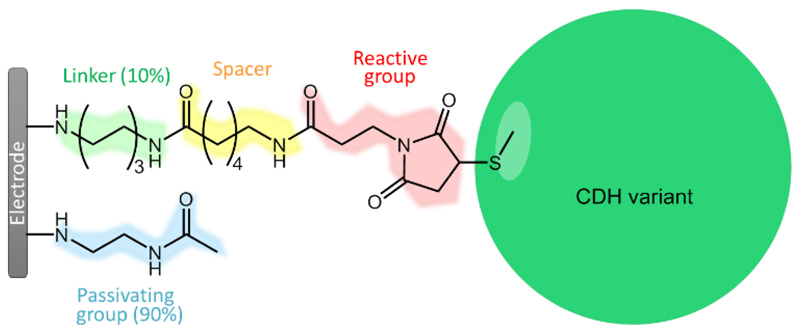
The cysteine-modified Myriococcum thermophilum cellobiose dehydrogenase (MtCDH) variants were immobilized on glassy carbon electrodes coated with multi-walled carbon nanotubes (GC/MWCNT) as described in our previous work [11]. The GC/MWCNT electrodes provide a high surface area with low double layer charging current and are a stable platform for enzyme immobilization [11–12]. The enzymes were immobilized by a covalent reaction between the thiol of the cysteine residue selectively introduced onto the surface of the enzyme and maleimide groups on the electrode surface. The reaction between the thiol and maleimide occurs spontaneously at neutral pH, without the need for added reagents, to give a stable linkage [11] making this a very efficient way to immobilize the enzyme variants. To ensure efficient coupling, the surface modification was designed to have about 10% coverage of the maleimide groups and about 90% passivating groups, with the maleimide groups linked to the surface by a 6-carbon-long spacer, to ensure that the groups could access the cysteine residues on the enzyme surface via the approximately 3 nm long tether [13], Figure 1. This was achieved using the combination of electrochemical grafting and solid-phase synthesis methodology developed in our earlier work [11, 13]. This approach has the advantage of considerable flexibility in the design of the surface modification. In the present case the linker (N-Boc-1,6-hexanediamine) and the passivating group (N-(2-aminoethyl)acetamide) were electrochemically grafted to the electrode surface and then the Boc-protecting group was removed. Subsequent coupling of N-Boc-6-aminohexanoic acid onto the resulting surface amine, followed by removal of the second Boc-protecting group and coupling of N-maleoyl-β-alanine, gives the maleimide-modified GC/MWCNT electrode. The MtCDH variants were coupled to the maleimide modified electrodes by drop casting a small volume (3 μL) of the enzyme in pH 7.0 buffer solution and leaving covered at 4 °C overnight.
Figure 1.
Chemical structure of the whole electrode modification used in this work to immobilize MtCDH variants with a single surface exposed cysteine, with the different components in different colours.
Direct electron transfer of immobilized MtCDH
Non-catalytic voltammetry
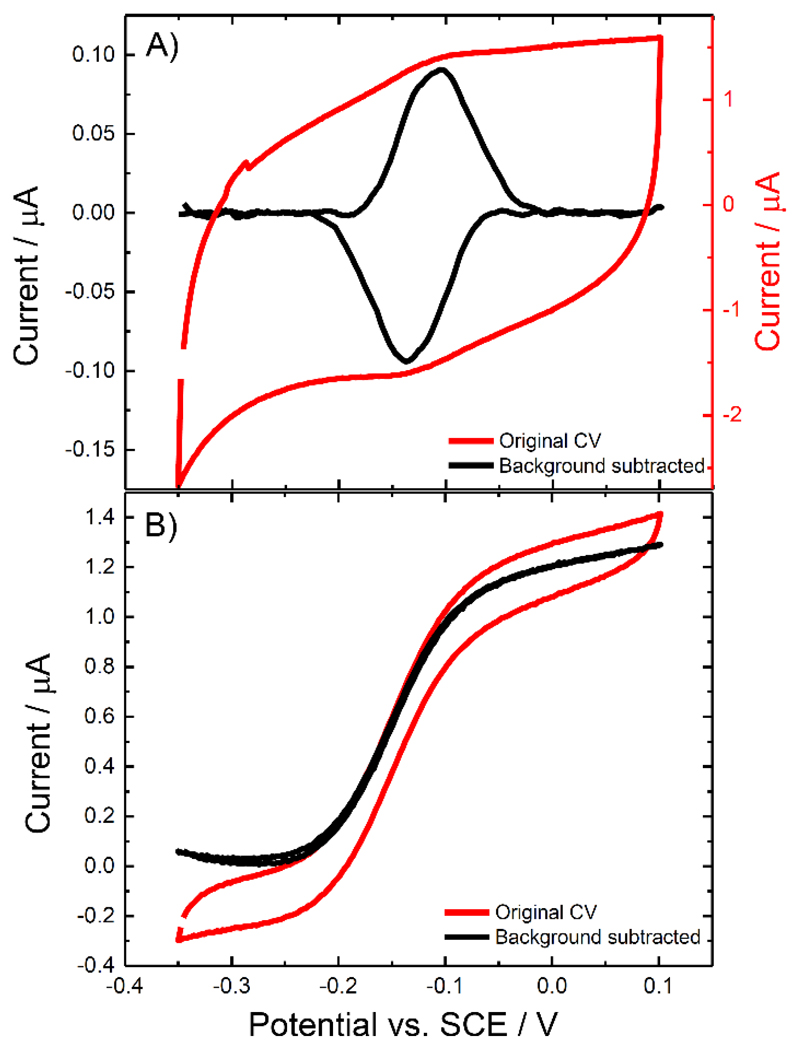
Figure 2A shows the voltammetry of the immobilized MtCDH (variant E501C) at pH 5.5 in the absence of substrate. Note that in these and subsequent experiments Ca2+ was added to the electrolyte solution as this is known to enhance the rate of inter-domain electron transfer (IET) [14]. We return to discuss the effects of added Ca2+ below. A pair of redox peaks due to direct electron transfer (DET) between the electrode and one of the redox centres of the enzyme can be seen. After subtracting the capacitive background current (details in Experimental), the resulting faradaic voltammogram (Figure 2A, black line) can be integrated to find the absolute amount of electroactive enzyme on the surface, menz, using Faraday’s law and assuming that the number of electrons transferred is 1. For the voltammogram shown in Figure 2A, menz was found to be ~8 pmol. Based on the method described by Peigney [15] for 9.5 nm MWCNTs with 7-9 walls, we estimate that the area of the GC/MWCNT electrodes is ~14 cm2 so that the estimated coverage of electroactive enzyme is ~0.6 pmol cm-2. Given the dimensions of MtCDH, the average area of the enzyme occupied on the electrode surface would be ~40 nm2 for the deglycosylated enzyme or ~60 nm2 for the glycosylated enzyme, which corresponds to 19.3 mm2 and 28.9 mm2 enzyme covered area per cm2 electrode surface or a ~20% or ~30% coverage, respectively, if a monolayer is assumed.
Figure 2.
Cyclic voltammograms for CDH variant E501C modified GC/MWCNT electrode, in the (A) absence and (B) presence of 70 mM glucose. CVs were recorded in argon-saturated 50 mM acetate buffer (pH 5.5), containing 30 mM CaCl2, scanning the potential at (A) 10 mV/s and (B) 1 mV/s. A) The original voltammogram (red) and the background subtracted voltammogram (black) are shown. B) Voltammogram with glucose present (red) and the corresponding background subtracted voltammogram (black) obtained by subtracting the current measured before addition of glucose.
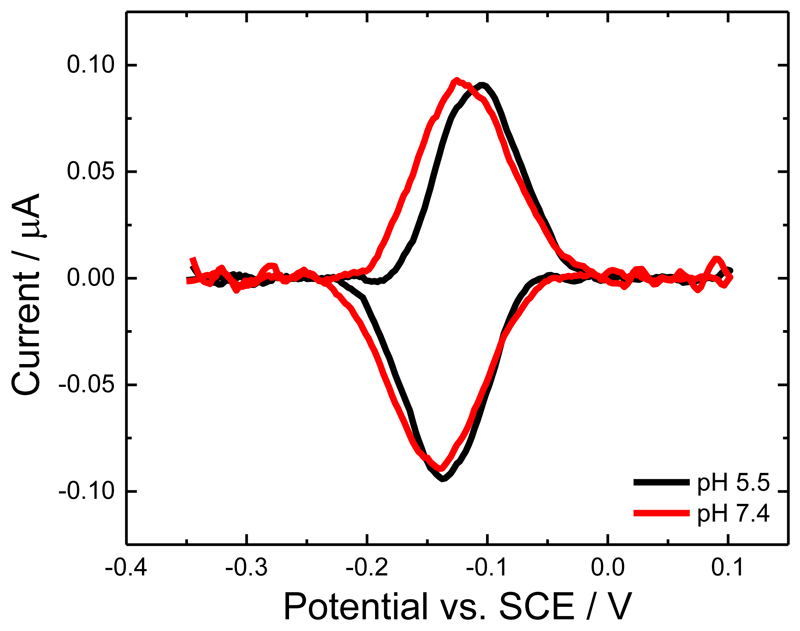
The surface bound redox couple seen in Figure 2A has a redox potential (E1/2) of about -0.12 V vs. SCE. In principle this could correspond to either one-electron oxidation and reduction of the haem b or two-electron oxidation and reduction of the FAD in the MtCDH. The fact that the redox peaks observed in Figure 2A are due to the haem b was confirmed by performing the same experiment at pH 7.4 (Figure 3). From the figure it is clear that there is only a small shift in the redox potential, around 10 mV, on going from pH 5.5 to pH 7.4. This small change with pH can be accounted for by changes in the ionization states of the amino acid residues surrounding the haem b [16]. The shift is much smaller than the 59 mV per pH unit shift observed for the 2H+/2e- redox process (between pH 4 and pH 7) of the FAD [17]. Further experiments, see below, confirm that the haem b, not the FAD, is responsible for the DET of MtCDH.
Figure 3.
Background subtracted cyclic voltammograms for CDH variant E501C modified GC/MWCNT electrodes recorded in argon-saturated 50 mM acetate buffer, pH 5.5 (black) and 50 mM Tris buffer, pH 7.4 (red), both containing 30 mM CaCl2, scan rate 10 mV/s.
Steady-state catalysis
Figure 2B shows a voltammogram recorded for the same MtCDH-modified GC/MWCNT electrode in a solution containing the substrate, D-glucose. In this case a slower scan rate (1 mV/s) was used to ensure steady state behaviour. The resulting voltammogram is a direct “read-out” of the rate of biocatalysis as a function of the electrode potential (driving force). At an applied potential higher than the MtCDH equilibrium potential, electrons flow from the glucose to the electrode via the FAD and haem active centres. The resulting oxidation current is directly proportional to the rate of glucose oxidation at that concentration of substrate (the currents here are much less that the mass transport limited currents for glucose oxidation so concentration polarization of glucose is negligible). By subtraction of the background current using the corresponding voltammogram recorded in the absence of glucose, we obtain the sigmoidal curve (black line) that reaches a plateau of about 1.3 μA.
Looking closer at the voltammogram in Figure 2B, we can see that the oxidation process starts at about -0.2 V vs. SCE. According to studies by Gorton et al. [8d], this corresponds to the redox potential of the haem b; the FAD should be oxidised at more negative potentials [17b, 17c]. This is consistent with our assignment of the redox process to that of the haem b and not the FAD cofactor. The potential dependence of the catalytic response can be analysed using the following modified form of the Nernst equation
| (1) |
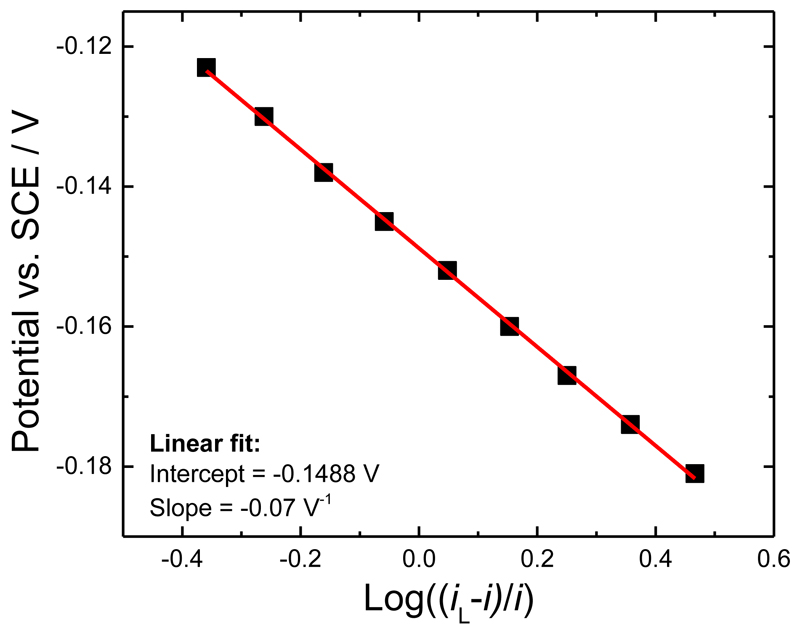
where E’ is the formal potential, n is the number of electrons exchanged and iL the limiting current. Applying this equation to the background subtracted catalytic current, Figure 4, gives a linear plot from which we obtain a more precise value of E’ for the haem cofactor from the intercept. In addition, from the slope of the linear fit we obtain an estimate of the number of electrons transferred (n). From the figure we find E’ of -0.15 V vs. SCE and a value for n of 0.85. These results are again consistent with DET for the immobilized one-electron donor haem b, rather than two-electron donor FAD, of the MtCDH. The good agreement of the results with Equation (1) implies that the electron transfer between the haem and the electrode is fast (i.e. electrochemically reversible).
Figure 4.
Determination of the haem cofactor E’ from the background subtracted catalytic current (from Figure 2B) according to Equation (1).
Michaelis-Menten catalytic behaviour
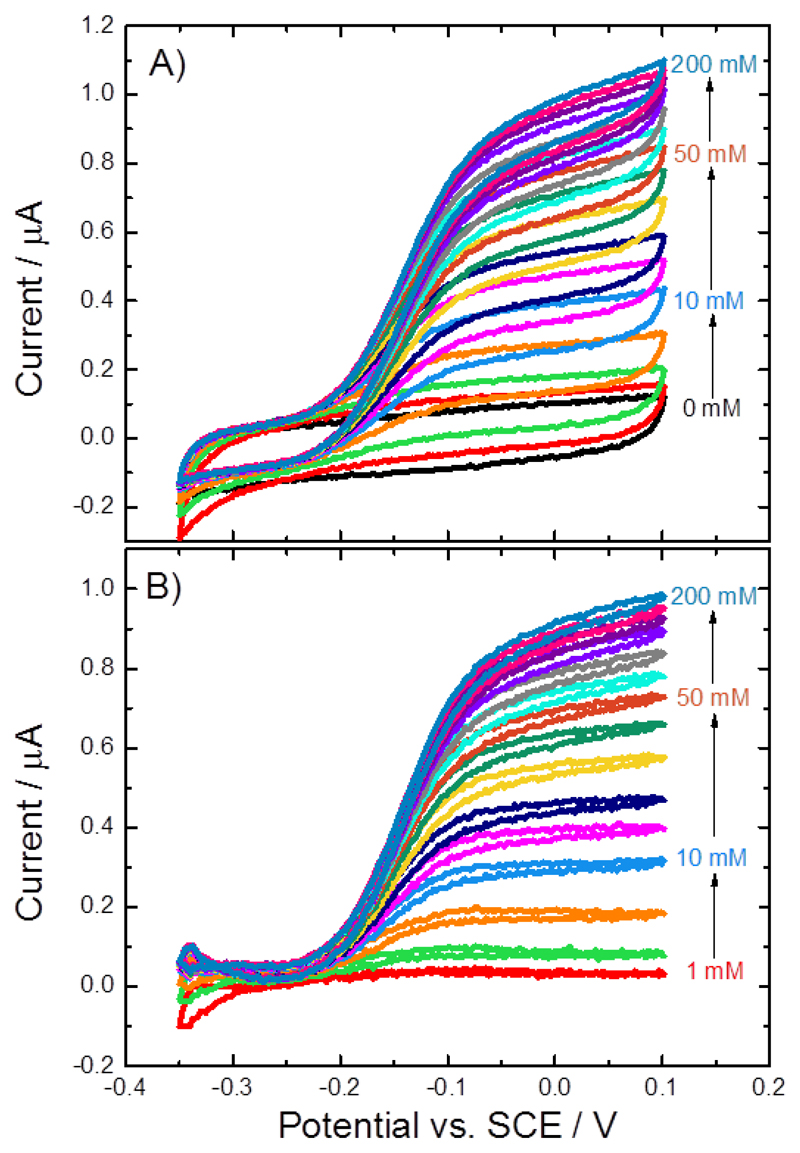
A GC/MWCNT electrode modified with the MtCDH variant E501C was tested for DET at increasing concentrations of D-glucose. As shown in Figure 5, increasing the concentration of substrate in solution leads to an increase in the catalytic current. The original voltammograms (Figure 5A) were background corrected by subtraction of the corresponding current recorded in the absence of glucose (black curve in Figure 5A), to obtain the corrected voltammograms shown in Figure 5B.
Figure 5.
A) Cyclic voltammograms for a CDH variant E501C modified GC/MWCNT electrode, recorded in argon-saturated 50 mM acetate buffer (pH 5.5), containing 30 mM CaCl2 and different concentrations of D-glucose from 0 to 200 mM, scan rate 1 mV/s. B) Background corrected currents obtained by subtraction of the current in the absence of glucose.
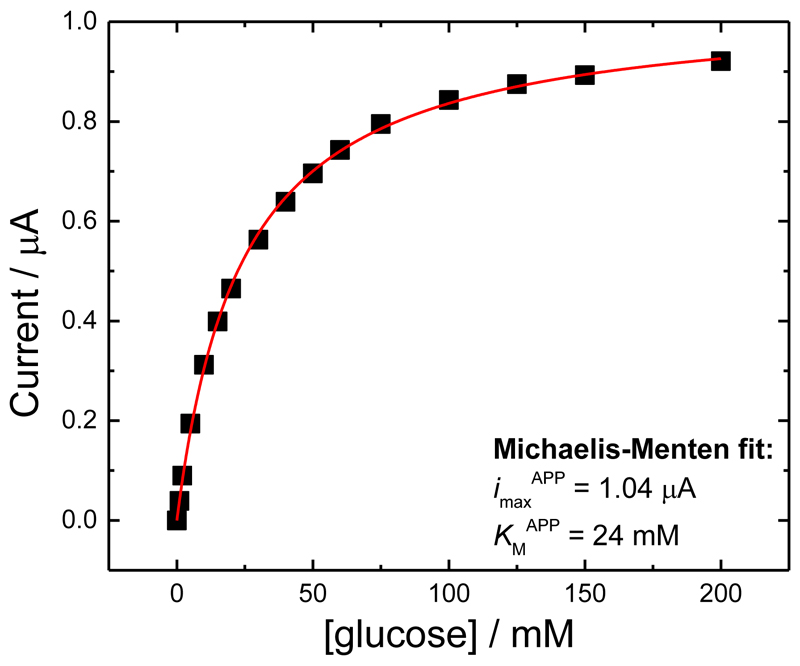
The limiting currents taken at 0.0 V vs. SCE in the voltammograms of Figure 5B can be analysed using the Michaelis-Menten equation
| (2) |
where [S] is the substrate concentration, KMAPP is the apparent Michaelis-Menten constant (in this case for glucose oxidation) and imaxAPP is the current on the plateau. Here imaxAPP is given by
| (3) |
where n is the number of electrons transferred (2 for the oxidation of glucose), menz is the amount of active immobilized enzyme, and kcat APP is the apparent catalytic rate constant. The fit of the data to Equation (3), see Figure 6, is excellent.
Figure 6.
Values of the current for MtCDH variant E501C taken at 0.0 V vs. SCE from Figure 5B, plotted as a function of glucose concentration. The red curve is the best fit to Equation (2).
In principle there are a number of different kinetic steps that could be rate limiting for DET at high glucose concentrations. However we can exclude the electron transfer from the haem to the electrode since we have already shown that this is fast and we can exclude effects of the mass transport of glucose since the currents are much less than the glucose mass transport limited current. Therefore there are two remaining possibilities: the rate limiting step even at high glucose concentrations could be the oxidation of glucose by FAD in the enzyme substrate complex, or it could be the IET from the flavodehydrogenase domain to the cytochrome domain.
Taking our earlier estimate for the enzyme loading, menz, of 8 pmol, the observed value of imaxAPP of 1.04 μA corresponds to a value of kcatAPP of 0.7 s-1 from Equation (3). The determined kcat of MtCDH for glucose in 50 mM acetate buffer, pH 4.5 (the pH optimum for the soluble two electron acceptor 2,6-dichloroindophenol), is 4.8±0.3 s-1 [1c]. In addition the value of KMAPP obtained from the fit in Figure 6 is 24 mM. This is much lower than the value obtained in solution with 2,6-dichloroindophenol, 387±12 mM [1c]. This suggests that the reaction of the enzyme with glucose is not the rate limiting step at high glucose concentration and that the rate limiting step is the IET. This is supported by stopped-flow experiments for MtCDH at pH 5.5, which showed a low first order reduction rate of the haem (kobs = 0.15 s-1) which corresponds with the IET [14].
DET for the different MtCDH variants
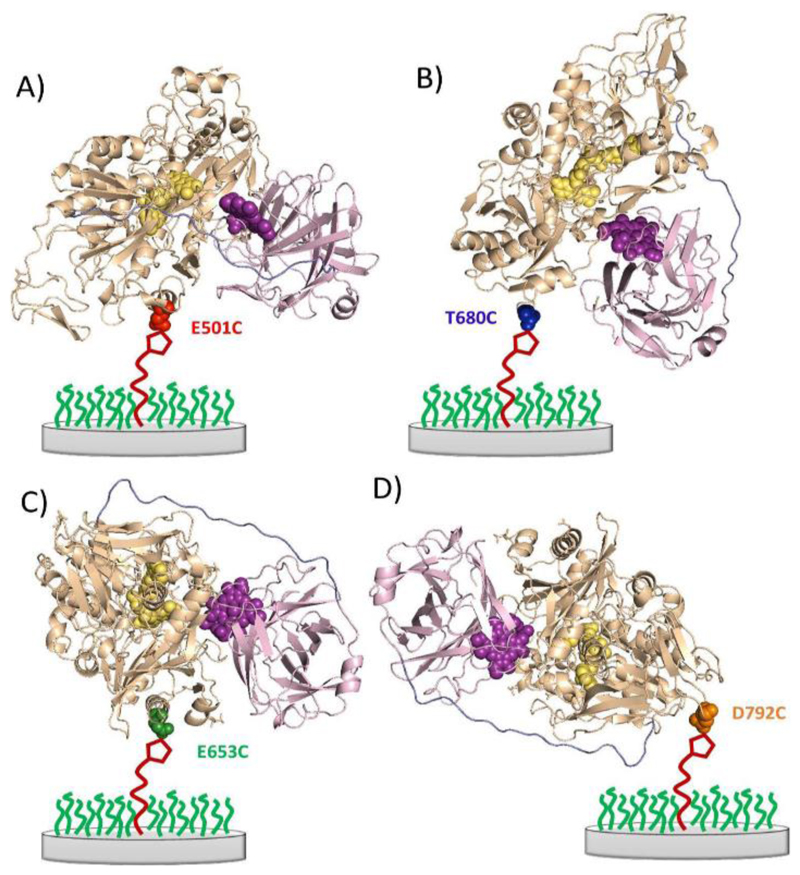
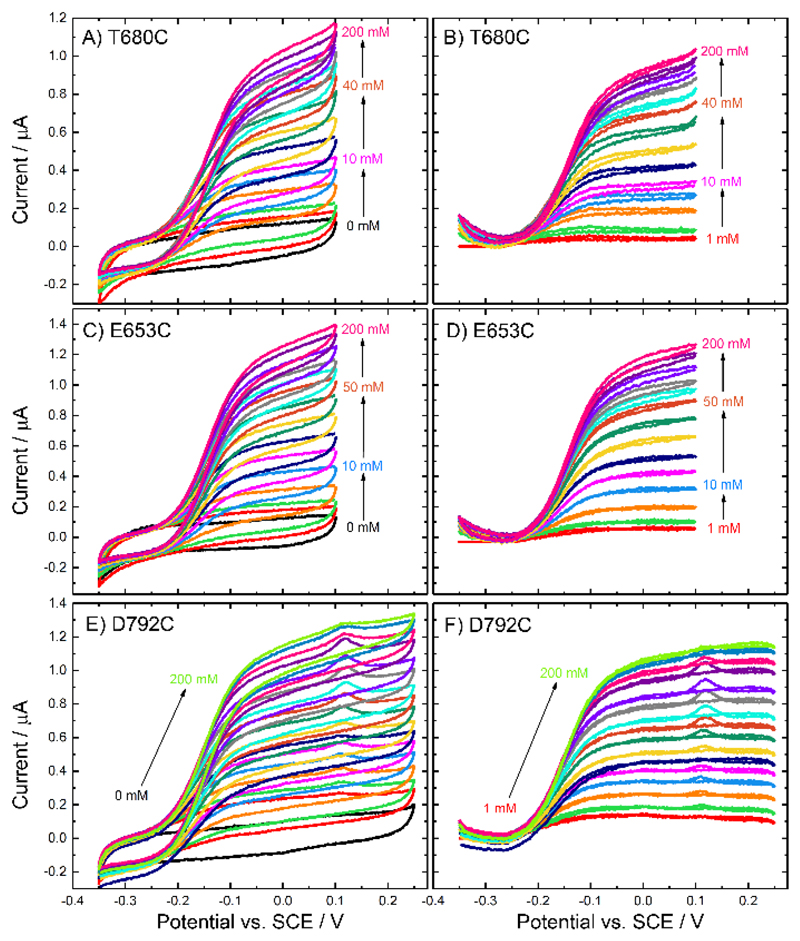
In this work we have used four different MtCDH variants genetically engineered with a surface exposed, free cysteine in different positions on the surface of the flavodehydrogenase domain. Reaction of the engineered cysteine with the maleimide immobilized on the electrode surface gives different orientations of the enzyme at the electrode surface, Figure 7. All four variants show similar voltammetry in the absence of added glucose with very similar surface coverages of DET active enzyme. The responses of the different immobilized MtCDH variants to added glucose at pH 5.5 in the presence of Ca2+ are shown in Figure 8. In the presence of glucose the catalytic response starts at around -0.2 V vs. SCE rising to a steady state plateau at higher potentials in exactly the same way that we see for the E501C variant in Figure 5. Cleary all four variants show direct electron transfer between the enzyme and the electrode, and catalytic oxidation of glucose.
Figure 7.
Cartoon representations of the secondary structure of the four different MtCDH variants attached to the electrode surface in different orientations through the cysteine-maleimide bond. A) E501C, substrate channel close to electrode (front on); B) T680C, top of enzyme facing electrode (top on); C) E653C, right side of substrate channel facing electrode (right side on); and D) D792C, C-terminus close to electrode (bottom on).
Figure 8.
(A, C, E) Original and (B, D, F) background subtracted voltammograms recorded at CDH variant (A-B) T680C, (C-D) E653C and (E-F) D792C modified GC/MWCNT electrodes, in argon-saturated 50 mM acetate buffer (pH 5.5), containing 30 mM CaCl2 and different concentrations of D-glucose from 0 to 200 mM, scan rate 1 mV/s.
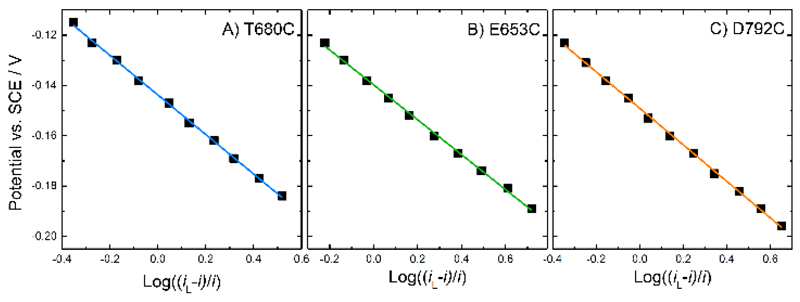
Analysis of the steady-state catalytic currents using the modified Nernst equation, Equation (1), again shows that the reaction is electrochemically fast, with a value for n close to 1, in agreement with the earlier results for E501C, Figure 9. This analysis shows that, in all cases, it is the haem that participates in DET, that electron transfer to the haem is fast and that the E’ for the haem group in all four variants is essentially the same, around -0.145 V vs. SCE.
Figure 9.
Analysis of the background corrected catalytic currents from Figure 8B, D and F for each MtCDH variant (for 100 mM glucose), plotted against log((iL-i)/i) (see Equation (1)). Data were fitted with linear fits.
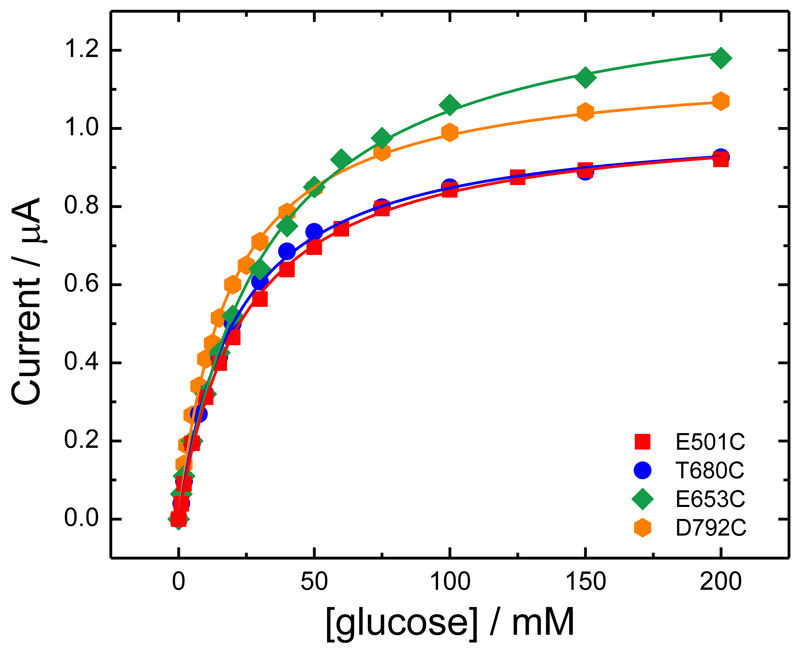
Figure 10 shows a plot of the background corrected limiting currents against the glucose concentration. The lines are the least mean squares fits to the Michaelis-Menten equation (Equation (2)). In all cases the fits to Equation (2) are excellent. From the figure we can see that for E501C and T680C (the red and blue plots in Figure 10) the results are very similar. The corresponding values for imaxAPP and KMAPP for all four variants are given in Table 2: there are slight differences between the four variants, with the KMAPP varying between 19 and 32 mM and imaxAPP between 1.02 and 1.39 μA. These differences can be attributed to differences in the kinetics for the four MtCDH variants, presumably due to the different orientations of the enzymes at the electrode surface. Nevertheless we can see that all four variants can transfer electrons to the electrode with similar efficiency at pH 5.5 in the presence of Ca2+. Note that, although differences in imaxAPP could be attributed to differences in enzyme loading (see Equation (3)), this cannot explain differences in KMAPP. The results in Figure 10 and Table 2 suggest that variants E653C and D792C (green and orange plots) have the fastest kinetics and, therefore, better orientations. Since we know from above that the electron transfer between the electrode and the haem b is fast in all cases, this suggests that the difference is due to differences in the IET rate. Looking at the cartoon representations of the four MtCDH variants immobilized on the electrode surface (Figure 7), we can see that the fastest rate occurs for the variant D792C attached through a site close to the root of the flexible peptide chain, linking the cytochrome and flavodehydrogenase domains, on the opposite side from the active-site entrance and possibly giving the highest freedom of mobility of the flavodehydrogenase domain (Figure 7D).
Figure 10.
Background corrected catalytic currents at 0.0 V vs. SCE for the four MtCDH variants from Figure 5B and Figure 8B, D and F plotted as a function of the glucose concentration. The curves are the best fits to Equation (2).
Table 2. Values of KMAPP and imaxAPP for the four MtCDH variants extracted by fitting the DET and MET data in Figures 10 and 12, respectively, with Equation (2).
| CDH variant | DET | MET | ||||
|---|---|---|---|---|---|---|
| imaxAPP (µA) | KMAPP (mM) | imaxAPP/KMAPP (µA/mM) | imaxAPP (µA) | KMAPP (mM) | imaxAPP/KMAPP (µA/mM) | |
| E501C | 1.037 ± 0.007 | 24.0 ± 0.5 | 0.043 ± 0.001 | 13.5 ± 0.3 | 75 ± 4 | 0.180 ± 0.014 |
| E653C | 1.39 ± 0.02 | 33 ± 1 | 0.042 ± 0.002 | 20.1 ± 0.3 | 101 ± 3 | 0.199 ± 0.009 |
| T680C | 1.025 ± 0.007 | 21.0 ± 0.4 | 0.049 ± 0.001 | 14.2 ± 0.6 | 80 ± 7 | 0.178 ± 0.023 |
| D792C | 1.17 ± 0.01 | 18.7 ± 0.5 | 0.063 ± 0.002 | 13.8 ± 0.5 | 85 ± 7 | 0.162 ± 0.019 |
Mediated electron transfer of immobilized MtCDH
An additional way to interrogate the immobilized enzyme is to use a soluble mediator since this should react with all the enzyme molecules present at the electrode surface indiscriminately. Ferrocene derivatives are frequently used as mediators for glucose oxidase, another FAD containing enzyme that oxidises glucose [18], but are less commonly used as mediators for cellobiose dehydrogenase. The redox potential of ferrocenecarboxylic acid, ca. +0.3 V vs. SCE, is significantly positive of the FAD potential in MtCDH [17c] and so there is a strong driving force for mediated oxidation of the FAD by the ferricenium ion. Kracher et al. have reported that the current produced by ferrocene does not depend on IET, but that the one-electron acceptor is reduced directly by the FAD [14].
For these experiments exactly the same electrodes as used for the DET studies above were employed. This is possible because of the excellent stability of the immobilized MtCDH when attached to the electrode via the maleimide linker. Assuming that the mediator can react with all the enzyme molecules on the surface of the electrode, the mediated electron transfer can be used to relate the current observed for the DET of each variant to the total amount of MtCDH on the electrode surface.
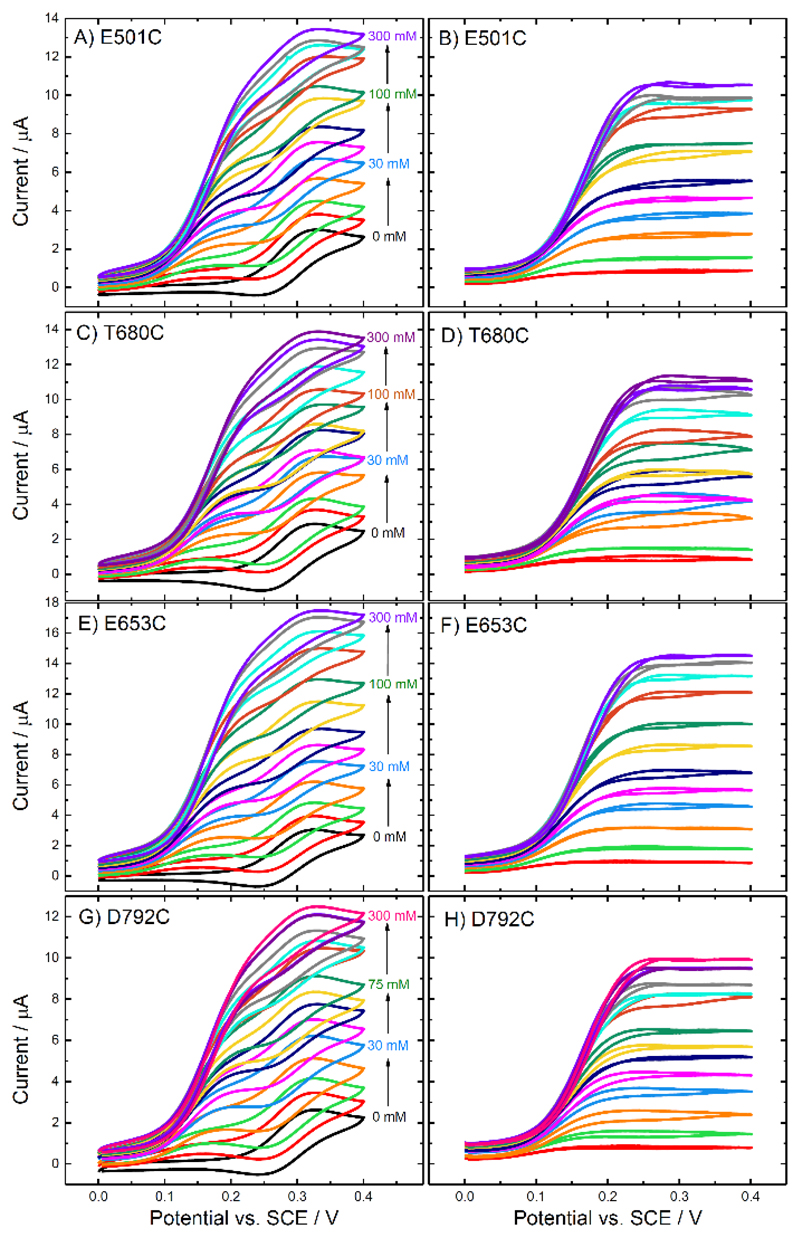
Figure 11 shows the voltammograms recorded for the electrodes modified with the four different MtCDH variants: the original voltammograms are shown in Figure 11A, C, E and G, and the background subtracted voltammograms are shown in Figure 11B, D, F and H. In all cases 1 mM ferrocenecarboxylic acid was used and the scan rate was 2 mV/s in order to record the steady-state catalytic currents. In the absence of added glucose (black curves in each case) we can see the voltammetry for the ferrocene monocarboxylic acid at around 0.3 V vs. SCE. However, when glucose is added in the solution, the catalytic current starts to increase much earlier, at around 0.1 V vs. SCE, and then at more positive potential we can see the superimposed current for the ferrocene, again at around 0.3 V.
Figure 11.
(Left) Original and (right) background subtracted voltammograms recorded at CDH variant (A-B) E501C, (C-D) T680C, (E-F) E653C and (G-H) D792C modified GC/MWCNT electrodes, in argon-saturated 50 mM acetate buffer (pH 5.5), containing 30 mM CaCl2, 1 mM ferrocenecarboxylic acid and different concentrations of D-glucose from 0 to 300 mM. The potential was swept at 2 mV/s.
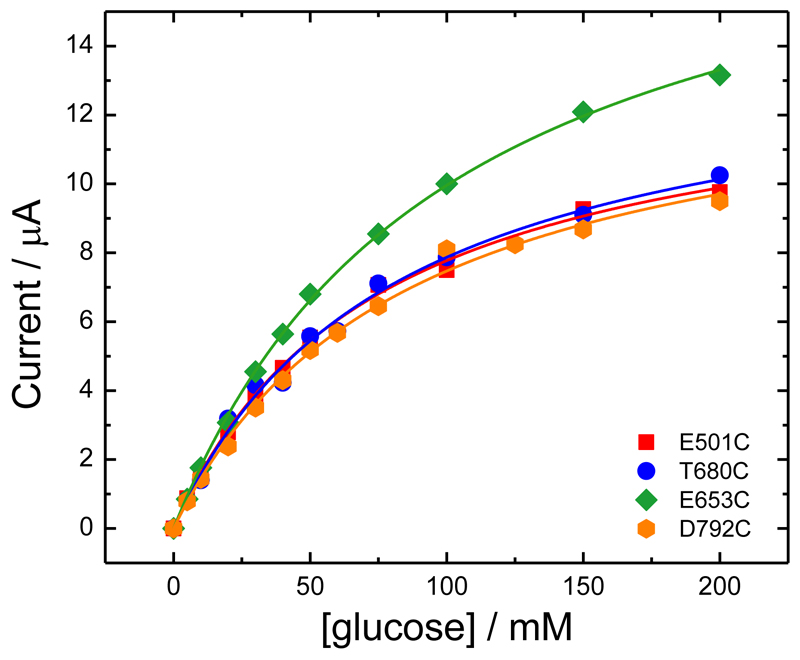
Upon subtracting the background current for zero glucose (Figure 11B, D, F and H) the peaks due to the ferrocene disappear, as expected, leaving only the sigmoidal catalytic waves for glucose oxidation. These reach a limiting current plateau around 0.20-0.25 V vs. SCE. The reason for the early onset of the catalytic current, well before the redox potential of the mediator, will be discussed below. First we concentrate on the catalytic currents for glucose oxidation. The plateau currents for glucose oxidation at 0.4 V vs. SCE are plotted in Figure 12 as a function of glucose concentration. It is clear that three of the MtCDH variants (E501C, T680C and D792C) give the same catalytic currents, while for E653C the catalytic current is slightly higher, presumably because of a slightly higher enzyme loading. Assuming that the mediator reacts with all the enzyme molecules present on the electrode surface, the magnitudes of the mediated catalytic currents at high glucose concentration should be proportional to the total amount of MtCDH on the electrode (see Equation (3)). Thus the MET results show that the amount of MtCDH on each electrode, menz, was essentially the same for the E501C, T680C and D792C variants and about 30% higher for the E653C variant. This could be due to a higher density of enzyme on the surface or to a higher loading of MWCNTs on the electrode leading to a higher total surface area. The apparent Michaelis-Menten constants from fitting of the MET data in Figure 12 are given in Table 2.
Figure 12.
Values of the current taken at 0.4 V from the voltammograms in Figure 11B, D, F and H (for the four MtCDH variants) plotted as a function of the glucose concentration. The lines are the best fits to Equation (2).
Comparison between DET and MET results
Comparing the results for DET and MET in Table 2 we can see that, as expected, the imaxAPP values for DET are much lower than those for MET. This indicates that either the current at high glucose concentration is limited by a different kinetic step in the two cases (IET in the DET case; kcat for the flavin/glucose reaction or reaction of the flavin/ferrocene in the MET case) or that different amounts of immobilized enzyme participate in the two reactions. Looking at the KMAPP values in Table 1, we can see that for DET three of the MtCDH variants have similar values close to 20 mM, while that for E653C is larger (33 mM). This is also seen in the case of MET; three variants have values close to 80 mM, while that for E653C is again larger (101 mM). The KMAPP values do not depend on the amount of enzyme thus this result strongly suggests that, while the currents are determined by the same rate of reaction with glucose at low glucose concentration, the rate limiting step at high glucose concentration is different in the case of DET and MET. If we divide the plateau current imaxAPP by KMAPP we obtain the initial slope of the response at low glucose. The fact that the values of imaxAPP/KMAPP are clearly different for DET and MET suggests that the amounts of immobilized enzyme involved in DET are around 20-30% of that involved in MET, even though all the measurements for DET and MET were made on the same electrodes.
Table 1. Results of fitting the DET catalytic currents to Equation (1) for the four variants. The data are from Figures 6 and 9.
| CDH variant | Intercept / V vs. SCE | Slope / V-1 | n |
|---|---|---|---|
| E501C | -0.149 | -0.070 | 0.84 |
| E653C | -0.140 | -0.069 | 0.85 |
| T680C | -0.144 | -0.079 | 0.75 |
| D792C | -0.149 | -0.073 | 0.81 |
Potential dependence of the MET catalytic current
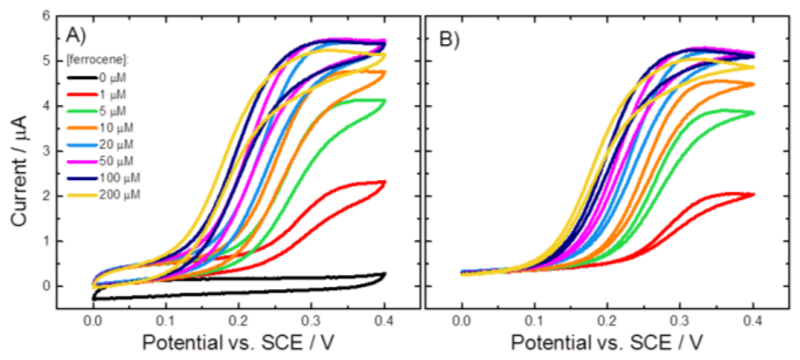
As pointed out above, the MET catalytic current starts increasing at a potential around 200 mV negative of the ferrocene redox potential. To investigate this, we recorded cyclic voltammograms at a CDH variant E501C modified GC/MWCNT electrode, at constant glucose concentration (50 mM), with increasing concentrations of mediator, Figure 13. It is clear that with increasing mediator concentration the onset of the catalytic wave shifts to more cathodic potentials; only at the lowest ferrocene concentration (1 μM) does the potential of the catalytic wave correspond to the ferrocene oxidation potential (about 0.3 V vs. SCE for the ferrocenecarboxylic acid). In addition, it is clear that even a very small concentration of ferrocene is sufficient to support a significant MET catalytic current, indicating that the rate constant for the reaction of the reduced FAD in MtCDH with the ferricenium ion is very much higher, for example, than the corresponding rate of reaction of ferrocene with the FAD in glucose oxidase, where a 1000 times higher ferricenium ion concentration is required for effective mediation.[18a]
Figure 13.
(A) Original and (B) background subtracted cyclic voltammograms for a CDH variant E501C modified GC/MWCNT electrode in argon-saturated 50 mM acetate buffer (pH 5.5), containing 30 mM CaCl2, 50 mM glucose and increasing concentrations of ferrocenecarboxylic acid. The potential was swept at 2 mV/s.
Since the ferrocene monocarboxylic acid redox couple is reversible, the concentration of ferricenium ion, [Fc+], is related to the concentration of ferrocene, [Fc], and the applied potential, E, by the Nernst equation so that at 298 K
| (4) |
where E’ is the formal potential of the redox couple Fc+/Fc in our experimental conditions. From our experiments E’ is 0.28 V vs. SCE. Rearranging Equation (4) gives
| (5) |
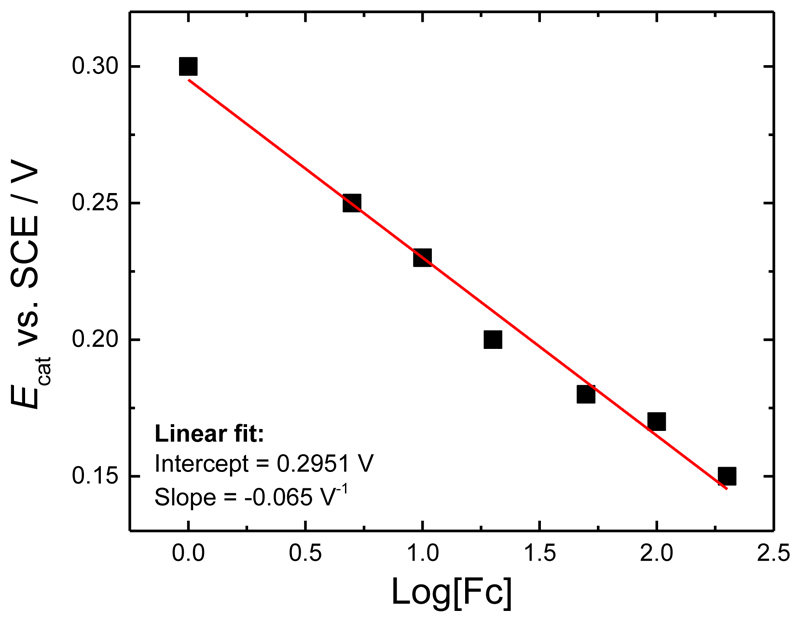
If we assume that a fixed concentration of ferricenium ion is required to sustain a particular catalytic current, [Fc+]cat, we should find that the potential at which that catalytic current is reached, Ecat, is related to the concentration of mediator by Equation (5). Figure 14 shows the corresponding plot, based on the data from Figure 13. From the plot and Equation (5) we find that the catalytic concentration of ferricenium ion in this case is only 1.8 μM.
Figure 14.
A plot of Ecat against log[Fc] for the data in Figure 13 and for a catalytic current of 1.5 μA. Data were fitted with a linear fit.
The effect of calcium
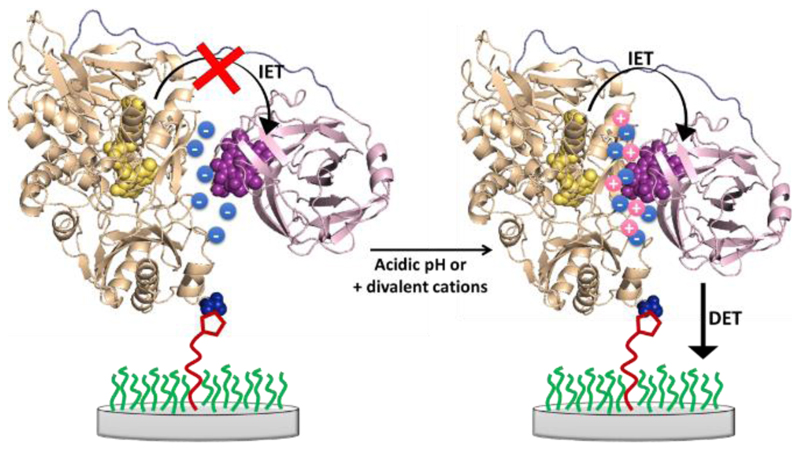
So far all the experiments have been carried out in buffered solutions containing Ca2+. Work by Gorton, Ludwig and colleagues [14, 19] has shown that in the presence of calcium, and other divalent alkali earth metal cations, the catalytic current generated by MtCDH is increased. This increase is attributed to the adoption of a closer conformation between the flavodehydrogenase and cytochrome domains through electrostatic bridging by the Ca2+, see Figure 15. The effect of Ca2+ is more significant at neutral pH because the amino acid residues located in the interfacial region between the domains are predominantly negatively charged at pH 7 but become protonated at pH 5. As a consequence, the rate of inter-domain electron transfer (IET) depends on the pH and Ca2+ concentration so that for the DET, in the absence of divalent cations, MtCDH gives higher currents between pH 5.0 and 5.5 [1c, 1d, 20], even though the optimum pH for the catalytic reaction at the FAD is pH 8 [14].
Figure 15.
Schematic representation of the effect of acidic pH or addition of divalent cations: before the two MtCDH domains are far from each other because of electrostatic repulsion due to the negatively charged amino acid residues.
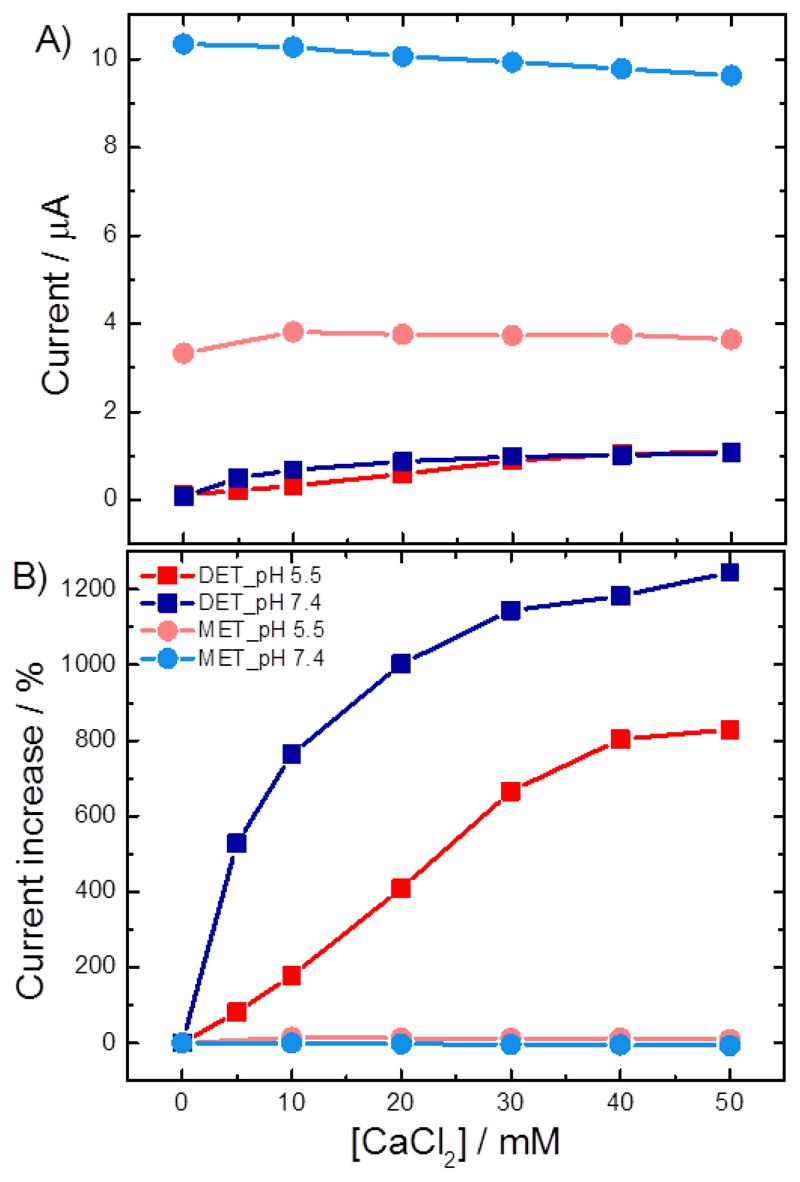
Based on these effects we expect addition of Ca2+ to affect the catalytic DET current, because IET is involved, but not the catalytic MET current, since in the MET case the ferrocene carboxylic acid reacts directly with FAD, excluding the haem b (and the IET) from the catalytic pathway. This is supported by stopped-flow experiments of MtCDH at pH 5.5, which showed an enhancement of the FAD to haem b IET in presence of 30 mM CaCl2 (from 0.15 s-1 to 1.1 s-1) [14].
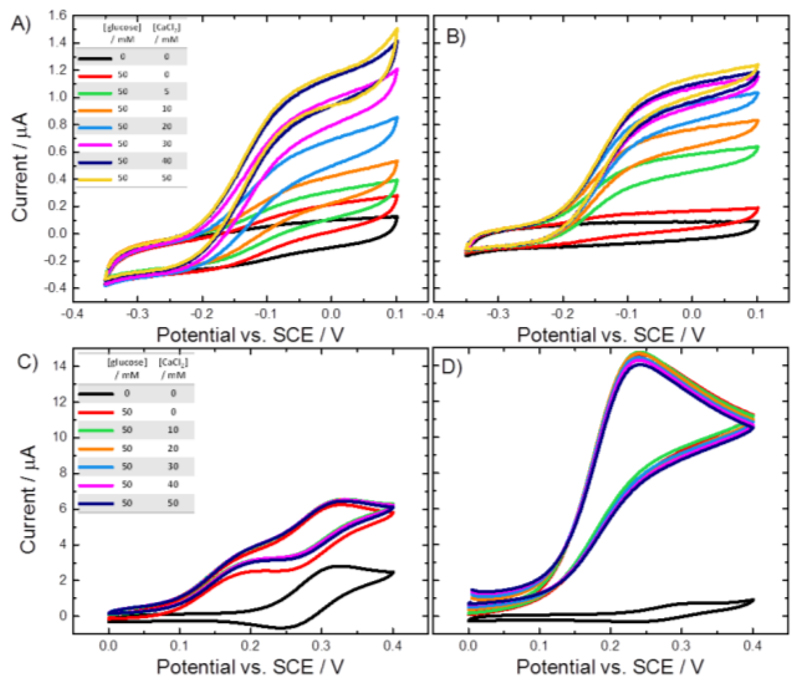
Figure 16 shows the cyclic voltammograms recorded at GC/MWCNT electrodes modified with the variant E501C: A and B show the DET experiments, C and D the MET experiments. The voltammograms in A and C were recorded in acetate buffer at pH 5.5, the ones in B and D in Tris buffer at pH 7.4. Note that it is inappropriate to directly compare these 4 sets of voltammograms because they have been recorded using different electrodes prepared at different times, and the two experiments for the MET case (C and D) were performed using different concentrations of mediator. In addition, it is not appropriate to directly compare the catalytic currents at different pH since the rate of the catalytic reaction is known to be pH dependent [14]. Rather we focus on the relative change in the catalytic current in each case on addition of Ca2+. The continuous increase of the DET current with the increasing Ca2+ concentration at pH 5.5 (Figure 16A) shows that the repulsion between the dehydrogenase domain and the cytochrome domain is low at pH 5.5, whereas the steep increase upon addition of Ca2+ at pH 7.4 (Figure 16B) shows a strong repulsion of the two domains by negative charges which needs the bivalent cation to allow the formation of the IET competent closed-state. The achievable maximum current at pH 7.4 is about 10% lower than at pH 5.5. As expected, no effect of Ca2+ on MET was observed, which verifies that (i) ferricinium interacts with the FAD and is not affected by IET, and (ii) that the ferricinium ion can enter the active site at any time, either in the open- or the closed-state by a channel that was proposed by Tan et al. [2].
Figure 16.
Cyclic voltammograms for the (A,B) DET and (C,D) MET of CDH variant E501C modified GC/MWCNT electrodes recorded in argon-saturated (A,C) 50 mM acetate buffer pH 5.5 and (B,D) 50 mM Tris buffer pH 7.4, at increasing concentrations of glucose and CaCl2 (as shown in the inset tables).
Voltammograms for the MET were recorded with (C) 1 mM and (D) 0.2 mM ferrocene. Scan rate (A,B) 1 mV/s and (C,D) 2 mV/s. Figure 17 shows a plot of the background corrected catalytic currents and the relative catalytic currents for DET and MET at pH 5.5 and 7.4 as a function of the Ca2+ concentration. From the figure it is immediately clear that in the MET case addition of CaCl2 has no significant effect at either pH. This is consistent with direct reaction of the ferrocene carboxylic acid with the FAD and the exclusion of the haem b, and IET, from the process. In contrast, in the DET case the addition of Ca2+ has a very significant effect on the catalytic current at pH 7.4 and a lesser, although not insignificant effect at pH 5.5. This is wholly consistent with the direct involvement of the IET step in the DET reaction and further demonstrates that under these conditions it is rate limiting in the catalytic cycle.
Figure 17.
(A) Current and (B) percentages of current increase for the DET (squares) and MET (circles) of CDH variant E501C modified GC/CNT electrodes, measured at pH 5.5 (red) and pH 7.4 (blue). The data for the current were taken from Figure 16, at 0.0 V for the DET and 0.4 V for the MET, after background subtraction. The percentages of current increase were calculated for each data set in relation to its current value for 0 mM CaCl2.
Control experiment with papain
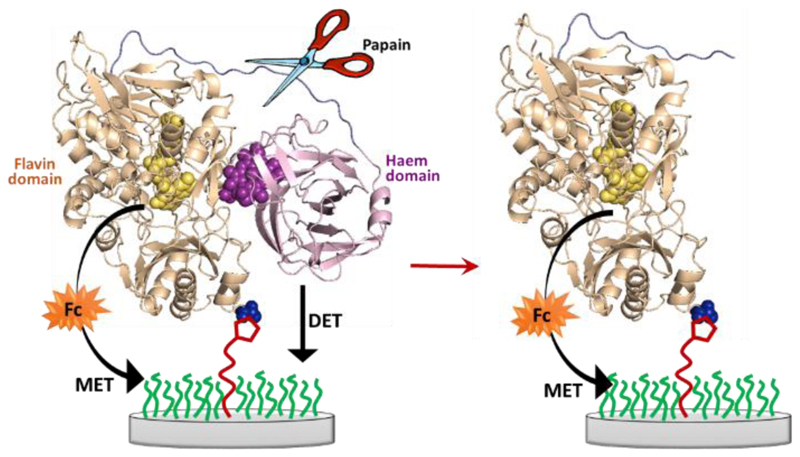
In a final experiment we used papain [21], a protease, to cut the peptide chain connecting the flavodehydrogenase and cytochrome domains, Figure 18. Papain has been used with MtCDH in solution to separate the two enzymatic domains as the preferential site of cleavage is the linking peptide chain [22].
Figure 18.
Schematic representation of the action of papain (scissor) toward MtCDH immobilized at the electrode surface through maleimide/cysteine bond.
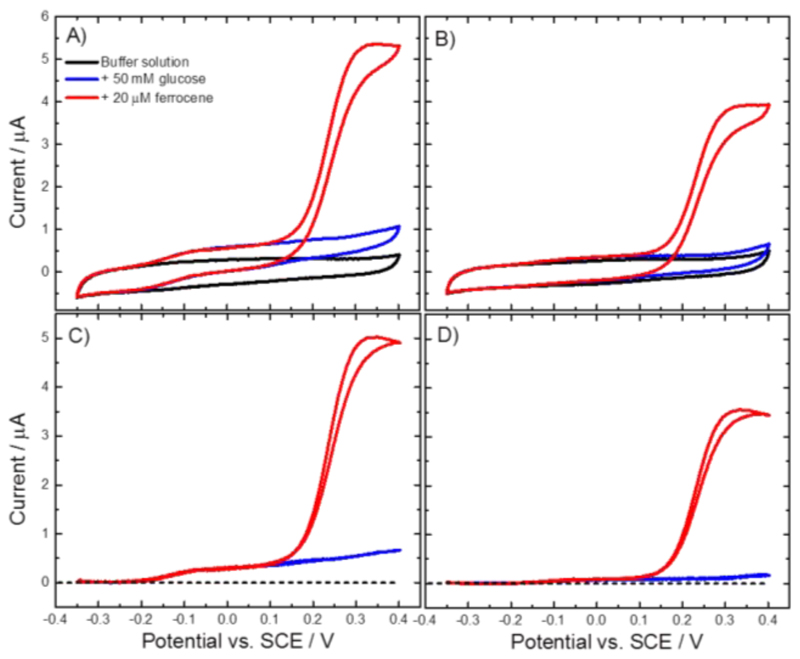
The experiment was carried out with a MtCDH-modified GC/MWCNT electrode that was prepared about two months before, stored in the fridge at 4 °C and tested at regular times during this period. Cyclic voltammograms for the DET and MET were recorded before and after the papain treatment (Figure 19A and B) using a wide potential range in order to include both the DET and MET currents in the same voltammogram. The black curves show the background current before addition of glucose and are essentially featureless. On addition of 50 mM glucose (blue curves) the DET current is obvious around -0.1 V vs. SCE before papain treatment (Figure 19A) but is insignificant after papain treatment (Figure 19B). Upon addition of 20 μM ferrocene (red curves) the MET current is high both before and after papain treatment at around +0.2 V. Comparing the background correct current (Figure 19C and D), it is clear that the treatment with papain has a very significant effect on DET and only a slight effect, possibly due to some non-specific hydrolysis of the enzyme, on MET. These results fully support our model for the DET and MET processes described above and the fact that DET only occurs through the cytochrome domain at our electrodes.
Figure 19.
(A-B) Original and (C-D) background subtracted CVs recorded at a CDH variant E501C modified GC/MWCNT electrode in argon-saturated 50 mM acetate buffer (pH 5.5), containing 30 mM CaCl2 (black), after the addition of 50 mM glucose (blue) and the addition of 20 μM ferrocene (red). The CVs were recorded (A-C) before and (B-D) after the papain treatment, sweeping the potential at 2 mV/s.
Conclusions
In this work we have confirmed that immobilization of MtCDH at multiwall carbon nanotube electrodes through covalent coupling of a cysteine residue at the enzyme surface to covalently attached maleimide on the electrode produces a very stable, enzymatically active system that is well suited to detailed studies of the immobilized enzyme kinetics as a function of substrate concentration, solution pH, Ca2+ concentration, etc.
Our results have shown that direct electron transfer of the immobilized CDH with the electrode occurs through the cytochrome domain, with no evidence for any direct communication between the FAD and the electrode. We find that the redox potential of the haem is unaffected by the site of attachment, or the orientation, of the variant on the electrode surface and that electron transfer between the haem and the electrode is fast (reversible) for all four variants irrespective of orientation. Voltammetry for the enzyme shows that the surface coverage of DET active enzyme is very similar for all four variants and that at high glucose concentrations the catalytic current for glucose oxidation is limited by the rate of IET between the FAD and the haem b. The effect of the orientation of immobilization of the CDH on the rate of this IET reaction is subtle under our conditions (pH 5.5 in the presence of Ca2+) but can be observed, with the D792C variant, in which the enzyme is attached to the electrode at a point opposite the active-site entrance giving the fastest kinetics.
We find that ferrocene carboxylic acid acts as a very effective mediator for the immobilized MtCDH at pH 5.0 and that the rate of electron transfer between the FADH2 and ferricenium ion is very fast, so that only μM concentrations of ferricenium ion are necessary to support the catalytic oxidation of glucose. Using MET we find that similar total concentrations of enzyme are present on the electrode surface for all four variants but, significantly, that the total amount of enzyme present is a factor of 4 to 5 times greater than the amount of enzyme that participates in DET.
The rate limiting role of the IET in the overall DET catalysed oxidation of glucose was further demonstrated by showing that whilst the addition of Ca2+ significantly affects the currents for glucose oxidation at pH 5.0 for DET it has no significant effects on the currents for glucose oxidation by MET when using ferrocene carboxylic acid as the mediator. Finally, the differences between the DET and MET pathways were highlighted by comparing the effects of cutting the linkage that tethers the cytochrome domain to the immobilized flavodehydrogenase domain using papain: although this extinguishes the DET current it has only a small effect on the MET current.
Experimental Section
Chemicals
N-Boc-1,6-hexanediamine, N-(2-aminoethyl)acetamide, N-Boc-6-aminohexanoic acid, tetrabutylammonium tetrafluoroborate (TBATFB), N-hydroxysuccinimide (NHS), and N-(3-dimethylaminopropyl)-N’-ethylcarbodiimide (EDC) were purchased from Sigma-Aldrich. N-maleoyl-β-alanine was synthesized as described previously and characterised by NMR before use [11]. Acetonitrile (HPLC grade), 1,4-dioxane (laboratory grade) and dimethylformamide (DMF, laboratory grade) were purchased from Fisher Chemical. Buffer solutions were prepared with Tris base and monobasic sodium phosphate (Sigma-Aldrich), acetic acid glacial (BDH), calcium chloride (Fisher Scientific) and titrated with hydrochloric acid (37%, BDH) and sodium hydroxide (laboratory grade, Fisher Chemical). D-glucose was purchased from BDH, ferrocenecarboxylic acid (used as mediator) was from Fluka, papain crude was from Sigma-Aldrich.
MtCDH variants
Myriococcum thermophilum cellobiose dehydrogenase variants (MtCDH) were recombinantly expressed in Pichia pastoris. The plasmid pMt1 [11] was used as the template for the amplification of MtCDH cDNA. Variants of MtCDH harbouring a single mutation E501C, T680C, E653C or D792C were introduced using PCR with the primes
E501CFw1: GAGGACCAATTGTGTGTCGTTGCCGCTTCTGAGAAGG;
E501Rv1: CAATTGGTCCTCTGGTCCA;
T680CFw1: TTCCCAAACTCTTGTATTACCCCACGTGAGTATGTCG;
T680Rv1: AGAGTTTGGGAACAACCAGGTC
E653CFw1: CCAAACGACAAATGTGCCGTGATTCAAGGTATTATCAAC
E653CRv1: TTTGTCGTTTGGGTCTTTAAGG
D792CFw1: CTTTCGTTTGCGCATGTGGTTCTACCTGTGAATACCA
D792CRv1: TGCGCAAACGAAAGATCCAGTC
Linearized plasmids were transformed into electrocompetent Pichia pastoris X-33 cells and transformants were selected on YPD zeocin plates (100 mg L-1). The best P. pastoris clones were screened by deep-well-plate microfermentation following Sygmund et al.[23]. Production of the MtCDH variants was performed in a Sixfors bioreactor (Infors HT, Bottmingen, Switzerland) as previously described [11]. The MtCDH variants were purified to homogeneity by hydrophobic interaction chromatography and anion exchange chromatography according to a published procedure [14]. MtCDH variants were stored in 50 mM sodium acetate buffer (pH 5.5) at -30 °C.
Instrumentation
All solutions for electrochemistry were prepared with reagent grade water (18 MΩ cm) from a Purite purification system. Solutions were purged with Pureshield argon (BOC) to remove dissolved oxygen. Electrochemical measurements were performed in glass cells using a standard three-electrode arrangement, with either an mAutolab type III or an Autolab PGSTAT 302 (Ecochemie, Netherlands). A platinum gauze was used as the counter electrode with a home-made saturated calomel electrode (SCE) reference electrode. Glassy carbon (GC) working electrodes (0.071 cm2) were fabricated from 3 mm diameter glassy carbon rod (HTW Hochtemperatur – Werkstoffe GMBH, Germany) sealed in glass and contacted by copper wire using melted indium (Aldrich). Prior to modification, the glassy carbon electrodes were polished using silicon carbide polishing paper (grade 1200) and alumina slurries (1.0 and 0.3 μm, Buehler) on polishing cloths (Buehler), and then sonicated for 5 min in deionized water and ethanol. Multi-walled carbon nanotubes (MWCNT, > 8% carboxylic acid functionalized avg., 9.5 nm diameter, 1.5 mm length, Sigma-Aldrich) were deposited onto the GC electrodes from a 1 g L-1 dispersion. 5 μL of the dispersion were placed onto the clean surface of each GC electrode, using a plastic mask of the same dimension as the GC disc to restrict the spread of the dispersion, and left to dry at room temperature for 2 d.
Electrode modification
Modification of the electrodes was extensively described in our earlier work [11]. Briefly, electrografting of the amines onto GC/MWCNT electrodes was carried out holding the potential at +2 V vs. SCE for 180 s in an acetonitrile solution containing N-Boc-1,6-hexanediamine (2 mM), N-(2-aminoethyl)acetamide (18 mM) and TBATFB (0.1 M). The solution was purged with argon for 20 min before use to remove dissolved oxygen. After the electrografting of the amines onto the surface, the electrode was then washed with acetonitrile and the Boc-protecting group was removed in 4 M HCl in dioxane (45 min) under gently stirring. The 6C-spacer was then coupled to the deprotected amine from a solution containing N-Boc-6-amino-hexanoic acid (10 mM) as the spacer, NHS (60 mM) and EDC (0.1 M) in DMF with stirring for 16 h. Electrodes were then washed with acetonitrile and water to remove any non-covalently bound material, and dried. The Boc-protecting group was removed from the 6C-spacer in 4 M HCl in dioxane (45 min) under gently stirring before coupling of the maleimide to the deprotected amine from a solution containing N-maleoyl-β-alanine (25 mM), NHS (60 mM) and EDC (0.1 M) in DMF with stirring for 16 h. Electrodes were then washed with acetonitrile and water and dried.
Enzyme immobilization
The storage buffer of the enzyme variants was exchanged from pH 5.5 acetate (50 mM) to a pH 7.0 phosphate buffer (50 mM) using mini-dialysis devices provided with a PES membrane (Fisher Scientific) with 10 kDa cut off. After dialysis coupling of the MtCDH variant was carried out by drop casting 3 μL of MtCDH solution (at pH 7.0) on the electrode and leaving it at 4 °C overnight.
Electrochemical measurements
Cyclic voltammetry measurements of MtCDH-modified electrodes were carried out in 50 mM acetate buffer (pH 5.5) or 50 mM Tris buffer (pH 7.4), both containing 30 mM CaCl2 unless otherwise stated. All solutions were purged with argon for 30 min before measurements to remove dissolved oxygen, and for a few minutes after every addition of glucose from a 1 M stock solution (in the same buffer used for the measurement). MET measurements were carried out with 1 mM ferrocenecarboxylic acid dissolved in the buffer solution. CVs were carried out using the Nova 1.10 software and data were exported in Origin 9 to be analysed. When required, the capacitive, or background, current was subtracted using the “subtract baseline” mode in the “peak analyser” function in Origin 9. The baseline for the capacitive current was created by selecting an adequately large number of points (generally around 100) on the curve, avoiding the potential range where the peaks are located (between -0.2 and 0.0 V for the forward scan and between -0.05 and -0.22 V for the backward scan). The points were interpolated using the “BSpline” function to produce the baseline.
Papain cleavage experiment
A MtCDH-modified GC/MWCNT electrode was placed in the electrochemical cell filled with 10 mL of 50 mM acetate buffer (pH 5.5), containing 30 mM CaCl2. The cell was deoxygenated by bubbling argon before and during the experiment: this was useful also to mix the solution in the cell during the chronoamperometry. A constant potential of +0.2 V vs. SCE was applied at the working electrode for about 10 hours, recording the current every 20 s. The potential for the chronoamperometry was chosen according to the typical cyclic voltammograms for CDH-modified electrodes. Starting with only the acetate/CaCl2 buffer, some aliquots were added in the cell at different times during the chronoamperometry: first 50 mM glucose, then 0.1 g L-1 papain, followed by other 0.1 and 0.3 g L-1 papain aliquots, making the final concentration of papain in the cell of 0.5 g L-1. CVs in the same acetate/CaCl2 buffer (pH 5.5) were recorded before and after the chronoamperometry with papain.
Acknowledgements
This work has received funding from the European Union’s Seventh Framework Programme for research, technological development and demonstration under grant agreement no. 607793 (BIOENERGY) and from the European Union’s Horizon 2020 research and innovation programme (ERC Consolidator Grant OXIDISE) under grant agreement no. 726396. FAA acknowledges financial support from the Ministry of Higher Education and Scientific Research of Iraq. PNB gratefully acknowledges receipt of a Wolfson Research Merit Award.
References
- [1].a) Henriksson G, J G, Pettersson G. J Biotechnol. 2000;78:93–113. doi: 10.1016/s0168-1656(00)00206-6. [DOI] [PubMed] [Google Scholar]; b) Zamocky M, Ludwig R, Peterbauer C, Hallberg B, Divne C, Nicholls P, Haltrich D. Curr Protein Pept Sci. 2006;7:255–280. doi: 10.2174/138920306777452367. [DOI] [PubMed] [Google Scholar]; c) Ludwig R, Harreither W, Tasca F, Gorton L. ChemPhysChem. 2010;11:2674–2697. doi: 10.1002/cphc.201000216. [DOI] [PubMed] [Google Scholar]; d) Ludwig R, Ortiz R, Schulz C, Harreither W, Sygmund C, Gorton L. Anal Bioanal Chem. 2013;405:3637–3658. doi: 10.1007/s00216-012-6627-x. [DOI] [PMC free article] [PubMed] [Google Scholar]
- [2].Tan TC, Kracher D, Gandini R, Sygmund C, Kittl R, Haltrich D, Hallberg BM, Ludwig R, Divne C. Nat Commun. 2015;6:7542. doi: 10.1038/ncomms8542. [DOI] [PMC free article] [PubMed] [Google Scholar]
- [3].a) Safina G, Ludwig R, Gorton L. Electrochim Acta. 2010;55:7690–7695. [Google Scholar]; b) Tasca F, Zafar MN, Harreither W, Noll G, Ludwig R, Gorton L. Analyst. 2011;136:2033–2036. doi: 10.1039/c0an00311e. [DOI] [PubMed] [Google Scholar]; c) Zafar MN, Safina G, Ludwig R, Gorton L. Anal Biochem. 2012;425:36–42. doi: 10.1016/j.ab.2012.02.026. [DOI] [PubMed] [Google Scholar]; d) Bollella P, Gorton L, Ludwig R, Antiochia R. Sensors. 2017;17 doi: 10.3390/s17081912. 1912. [DOI] [PMC free article] [PubMed] [Google Scholar]; e) Kanso H, González García BM, Ma S, Ludwig R, Fanjul Bolado P, Hernández Santos D. Electroanalysis. 2017;29:87–92. [Google Scholar]; f) Lopez F, Ma S, Ludwig R, Schuhmann W, Ruff A. Electroanalysis. 2017;29:154–161. [Google Scholar]
- [4].Yarman A, Schulz C, Sygmund C, Ludwig R, Gorton L, Wollenberger U, Scheller FW. Electroanalysis. 2014;26:2043–2048. [Google Scholar]
- [5].Stoica L, Lindgren-Sjolander A, Ruzgas T, Gorton L. Anal Chem. 2004;76:4690–4696. doi: 10.1021/ac049582j. [DOI] [PubMed] [Google Scholar]
- [6].Lindgren A, Stoica L, Ruzgas T, Ciucu A, Gorton L. Analyst. 1999;124:527–532. [Google Scholar]
- [7].a) Tasca F, Gorton L, Harreither W, Haltrich D, Ludwig R, Noll G. J Phys Chem C. 2008;112:13668–13673. [Google Scholar]; b) Coman V, Ludwig R, Harreither W, Haltrich D, Gorton L, Ruzgas T, Shleev S. Fuel Cells. 2010;10:9–16. doi: 10.1039/b808859d. [DOI] [PubMed] [Google Scholar]; c) Ortiz R, Ludwig R, Gorton L. ChemElectroChem. 2014;1:1948–1956. [Google Scholar]; d) Gonzalez-Arribas E, Bobrowski T, Di Bari C, Sliozberg K, Ludwig R, Toscano MD, De Lacey AL, Pita M, Schuhmann W, Shleev S. Biosens Bioelectron. 2017;97:46–52. doi: 10.1016/j.bios.2017.05.040. [DOI] [PubMed] [Google Scholar]; e) Bollella P, Fusco G, Stevar D, Gorton L, Ludwig R, Ma S, Boer H, Koivula A, Tortolini C, Favero G, Antiochia R, et al. Sens Actuators B-Chem. 2018;256:921–930. [Google Scholar]
- [8].a) Lindgren A, Gorton L, Ruzgas T, Baminger U, Haltrich D, Schulein M. J Electroanal Chem. 2001;496:76–81. [Google Scholar]; b) Stoica L, Dimcheva N, Haltrich D, Ruzgas T, Gorton L. Biosens Bioelectron. 2005;20:2010–2018. doi: 10.1016/j.bios.2004.09.018. [DOI] [PubMed] [Google Scholar]; c) Matsumura H, Ortiz R, Ludwig R, Igarashi K, Samejima M, Gorton L. Langmuir. 2012;28:10925–10933. doi: 10.1021/la3018858. [DOI] [PubMed] [Google Scholar]; d) Lindgren A, Larsson T, Ruzgas T, Gorton L. J Electroanal Chem. 2000;494:105–113. [Google Scholar]
- [9].Sarauli D, Ludwig R, Haltrich D, Gorton L, Lisdat F. Bioelectrochem. 2012;87:9–14. doi: 10.1016/j.bioelechem.2011.07.003. [DOI] [PubMed] [Google Scholar]
- [10].a) Salaj-Kosla U, Scanlon MD, Baumeister T, Zahma K, Ludwig R, P OC, MacAodha D, Leech D, Magner E. Anal Bioanal Chem. 2013;405:3823–3830. doi: 10.1007/s00216-012-6657-4. [DOI] [PubMed] [Google Scholar]; b) Shao M, Guschin DA, Kawah Z, Beyl Y, Stoica L, Ludwig R, Schuhmann W, Chen X. Electrochim Acta. 2014;128:318–325. [Google Scholar]
- [11].Al-Lolage FA, Meneghello M, Ma S, Ludwig R, Bartlett PN. ChemElectroChem. 2017;4:1528–1534. doi: 10.1002/celc.201801503. [DOI] [PMC free article] [PubMed] [Google Scholar]
- [12].Bartlett P, Al-Lolage FA. J Electroanal Chem. 2018;819:26–37. [Google Scholar]
- [13].Wright EJ, Sosna M, Bloodworth S, Kilburn JD, Bartlett PN. Chem Eur J. 2014;20:5550–5554. doi: 10.1002/chem.201400246. [DOI] [PubMed] [Google Scholar]
- [14].Kracher D, Zahma K, Schulz C, Sygmund C, Gorton L, Ludwig R. FEBS J. 2015;282:3136–3149. doi: 10.1111/febs.13310. [DOI] [PMC free article] [PubMed] [Google Scholar]
- [15].Peigney A, Laurent C, Flahaut E, Bacsa RR, Rousset A. Carbon. 2001;39:507–514. [Google Scholar]
- [16].a) Mao J, Hauser K, Gunner MR. Biochemistry. 2003;42:9829–9840. doi: 10.1021/bi027288k. [DOI] [PubMed] [Google Scholar]; b) Hauser K, Mao J, Gunner MR. Biopolymers. 2004;74:51–54. doi: 10.1002/bip.20042. [DOI] [PubMed] [Google Scholar]
- [17].a) Lowe HJ, Mansfield Clark W. J Biol Chem. 1956;221:983–992. [PubMed] [Google Scholar]; b) Vogt S, Schneider M, Schafer-Eberwein H, Noll G. Anal Chem. 2014;86:7530–7535. doi: 10.1021/ac501289x. [DOI] [PubMed] [Google Scholar]; c) Schulz C, Kittl R, Ludwig R, Gorton L. ACS Catal. 2016;6:555–563. [Google Scholar]
- [18].a) Bartlett PN, Pratt KFE. J Electroanal Chem. 1995;397:53–60. [Google Scholar]; b) Cass AEG, Davis G, Francis GD, Hill HAO, Aston WJ, Higgins IJ, Plotkin EV, Scott LDL, Turner APF. Anal Chem. 1984;56:667–671. doi: 10.1021/ac00268a018. [DOI] [PubMed] [Google Scholar]; c) Forrow NJ, Sanghera GS, Walters SJ. Dalton Trans. 2002;16:3187–3194. [Google Scholar]
- [19].a) Schulz C, Ludwig R, Micheelsen PO, Silow M, Toscano MD, Gorton L. Electrochem Comm. 2012;17:71–74. [Google Scholar]; b) Schulz C, Ludwig R, Gorton L. Anal Chem. 2014;86:4256–4263. doi: 10.1021/ac403957t. [DOI] [PubMed] [Google Scholar]; c) Kadek A, Kavan D, Felice AK, Ludwig R, Halada P, Man P. FEBS Lett. 2015;589:1194–1199. doi: 10.1016/j.febslet.2015.03.029. [DOI] [PubMed] [Google Scholar]
- [20].Harreither W, Coman V, Ludwig R, Haltrich D, Gorton L. Electroanalysis. 2007;19:172–180. [Google Scholar]
- [21].Amri E, Mamboya F. Am J Biochem Biotechnol. 2012;8:99–104. [Google Scholar]
- [22].a) Canevascini G, Borer P, Dreyer JL. Eur J Biochem. 1991;198:43–52. doi: 10.1111/j.1432-1033.1991.tb15984.x. [DOI] [PubMed] [Google Scholar]; b) Henriksson G, Pettersson G, Johansson G, Ruiz A, Uzcategui E. Eur J Biochem. 1991;16:101–106. doi: 10.1111/j.1432-1033.1991.tb15791.x. [DOI] [PubMed] [Google Scholar]; c) Cohen JD, Bao W, Renganathan V, Sai Subramaniam S, Loehr TM. Arch Biochem Biophys. 1997;341:321–328. doi: 10.1006/abbi.1997.9987. [DOI] [PubMed] [Google Scholar]
- [23].Sygmund C, Kracher D, Schelblbrandmer S, Zahma K, Felice AKG, Harreither W, Ludwig R. Appl Environ Microbiol. 2012;78:6161–6171. doi: 10.1128/AEM.01503-12. [DOI] [PMC free article] [PubMed] [Google Scholar]


