Summary
The commonest causes of chronic liver disease are excess alcohol intake, viral hepatitis or non-alcoholic fatty liver disease, with the clinical spectrum ranging in severity from hepatic inflammation through cirrhosis to liver failure or hepatocellular carcinoma. The hepatocellular carcinoma genome exhibits diverse mutational signatures, resulting in recurrent mutations across >20-30 cancer genes1–7. Stem cells from normal livers have low mutation burden and limited diversity of signatures8, suggesting that the complexity of hepatocellular carcinoma arises during progression to chronic liver disease and subsequent malignant transformation. We sequenced whole genomes of 482 microdissections of 100-500 hepatocytes from 5 normal and 9 cirrhotic livers. Compared to normal liver, cirrhotic liver had higher mutation burden. Although rare in normal hepatocytes, structural variants, including chromothripsis, were prominent in cirrhosis. Driver mutations, both point mutations and structural variants, affected 1-5% clones. Clonal expansions millimetres in diameter occurred in cirrhosis, sequestered by bands of fibrosis engirdling regenerative nodules. Some mutational signatures were universal and equally active in both non-malignant hepatocytes and HCC; some were substantially more active in HCC than chronic liver disease; and others, arising from exogenous exposures, were present in a subset of patients. Up to 10-fold within-patient variation in activity of exogenous signatures existed between adjacent cirrhotic nodules, arising from clone-specific and microenvironmental forces. Synchronous hepatocellular carcinomas exhibited the same mutational signatures as background cirrhotic liver, but with higher burden. Somatic mutations chronicle the exposures, toxicity, regeneration and clonal structure of liver tissue as it progresses from health to disease.
Identifying somatic mutations in non-malignant tissue requires approaches to overcome its polyclonality, such as single cell sequencing9, cultures of single cells8,10 or microbiopsy sequencing11. The latter relies on local cell division with limited migration leading to a clonal patchwork, a known property of hepatocytes12. We generated whole genome sequences from 482 laser-capture microdissections of 100-500 hepatocytes (Extended Figure 1A) across 14 patients: 5 normal controls; 4 with cirrhosis from alcohol-related liver disease (ARLD) and 5 with cirrhosis from non-alcoholic fatty liver disease (NAFLD) (Supplementary Tables 1-2, Extended Figures 4-6). Samples of normal liver were acquired from hepatic resections of colorectal cancer metastases; samples of cirrhotic liver from patients transplanted for synchronous but distant hepatocellular carcinoma (HCC).
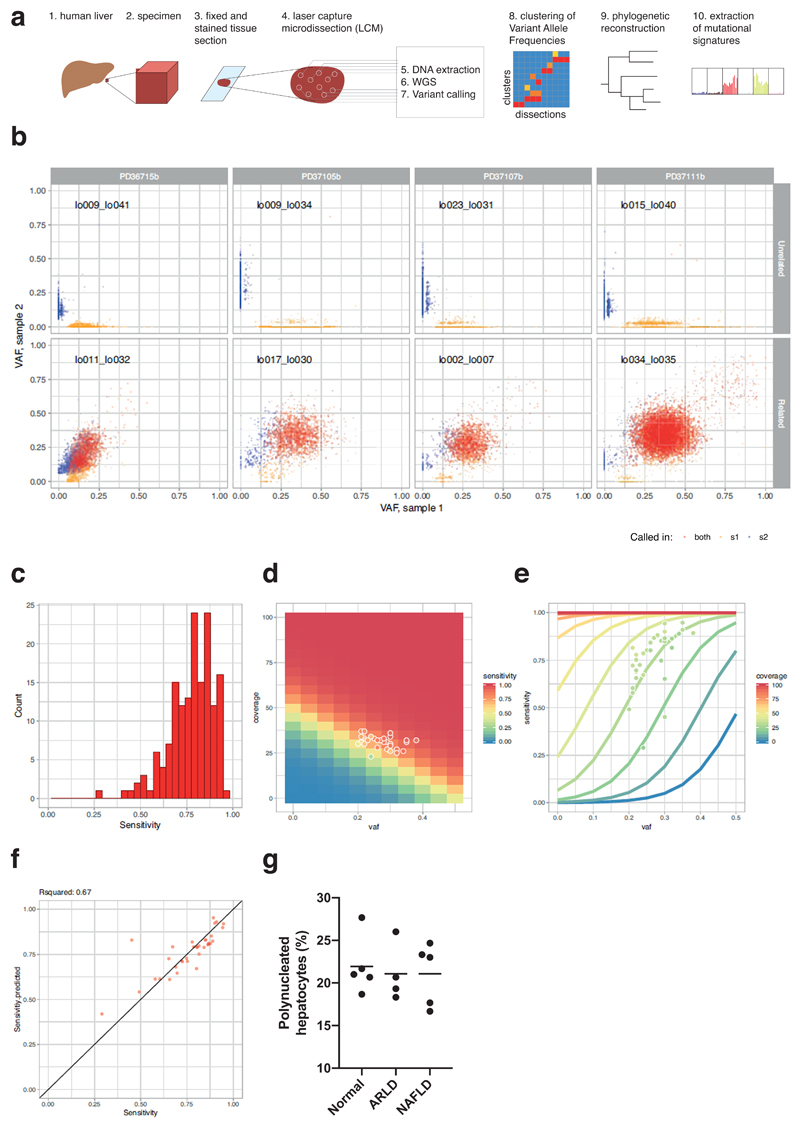
To evaluate sensitivity and specificity, we generated independent libraries and sequencing data from different sections of the same biopsy, microdissecting the same x,y-region from adjacent z-stacks, separated by ~20μm. Concordance was high between variants called in adjacent sections, but not distant pairs, suggesting that specificity of mutation calls was high (Extended Figure 1B), and sensitivity across patients was 50-95%, dependent on coverage and clonality (Extended Figure 1C-F). As a further check on specificity, deep targeted sequencing of cancer genes in the same library as 96 whole-genome samples confirmed 16 of 17 mutations originally called. In keeping with polyploidy as a late differentiation stage in liver13, 20-25% of mature hepatocytes in microdissected samples were multinuclear (Extended Figure 1G). We therefore deployed copy number algorithms with expected ploidy of 4, and report mutation burdens per diploid genome, rather than per cell.
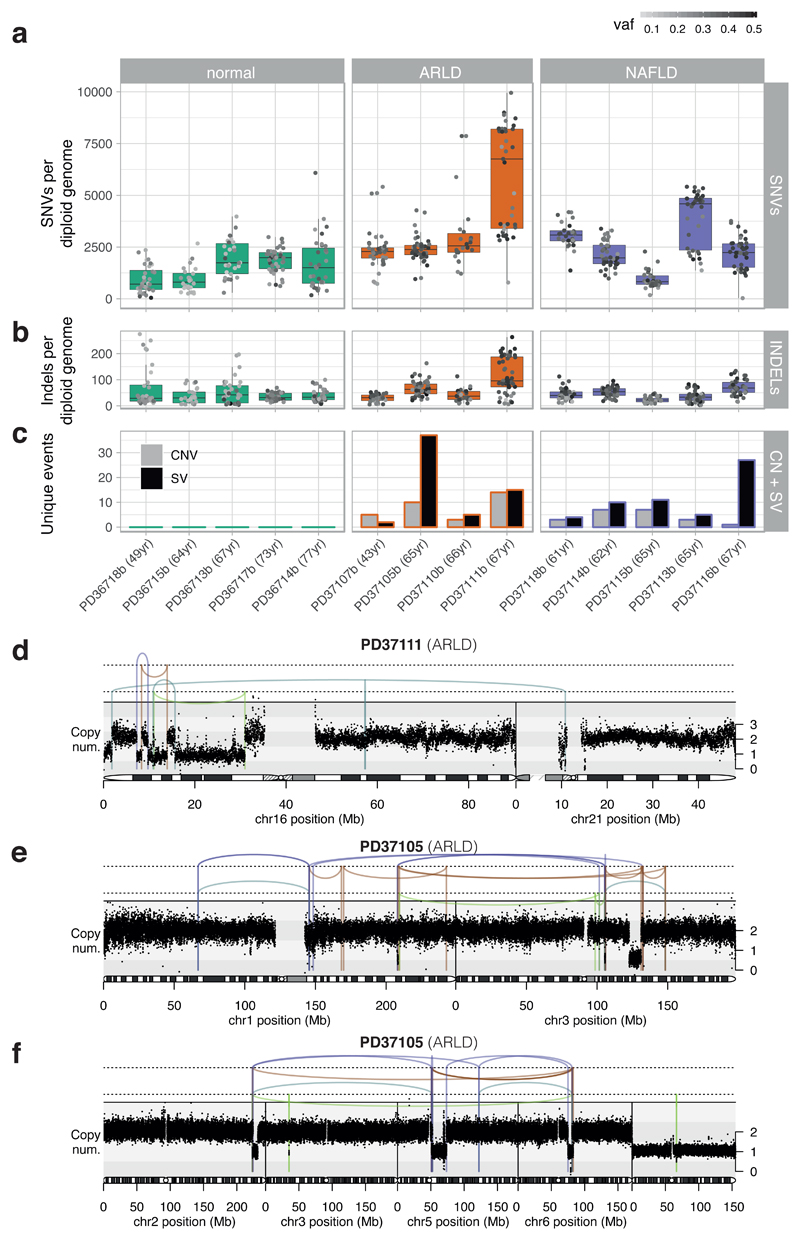
We observed considerable heterogeneity in burden of somatic substitutions both between and within patients (Figure 1A; Supplementary Tables 3-4). Using mixed effects models, microdissections from cirrhotic livers had, on average, 1251 (CI95% 233-2268; p=0.02) extra substitutions per diploid genome compared to normal livers, independent of age. In accordance with published values8, the estimated rate of mutation accumulation was 33/year/diploid genome, albeit with wide confidence intervals (CI95% -17–84; p=0.18) and moderate variation between individuals (estimated between-individual SD, 13/year). Indels showed the same heterogeneity between and within individuals as substitutions (Figure 1B).
Figure 1. Mutational burden observed in non-cancerous hepatocytes.
(A) Burden of SNVs corrected by sensitivity of mutation detection. Each boxplot represents a patient (n=14 patients; 482 microdissections), each dot represents one laser-capture microdissected sample. The grey-to-black intensity of the points reflects the median variant allele fraction (vaf) of mutations in each microdissection. Boxes in the box-and-whisker plots indicate median and interquartile range; whiskers denote range.
(B) Burden of insertion-deletion (INDEL) variants (n=14 patients; 482 microdissections).
(C) Burden of copy number variants (CNVs) and structural variants (SVs), represented as number of unique events per patient.
(D) Chromothripsis involving chromosomes 16 and 21 observed in patient PD37111. Black points represent corrected read-depth along the chromosome. Lines and arcs represent structural variants, coloured by orientation of joined ends (purple, tail-to-tail inverted; orange, head-to-head inverted; pale blue, tandem duplication-type orientation; pale green, deletion-type orientation).
(E) Chromothripsis involving chromosomes 1 and 3 observed in patient PD37105.
(F) Chromothripsis involving chromosomes 2, 5 and 6 observed in patient PD37105 (in a separate clone to panel E).
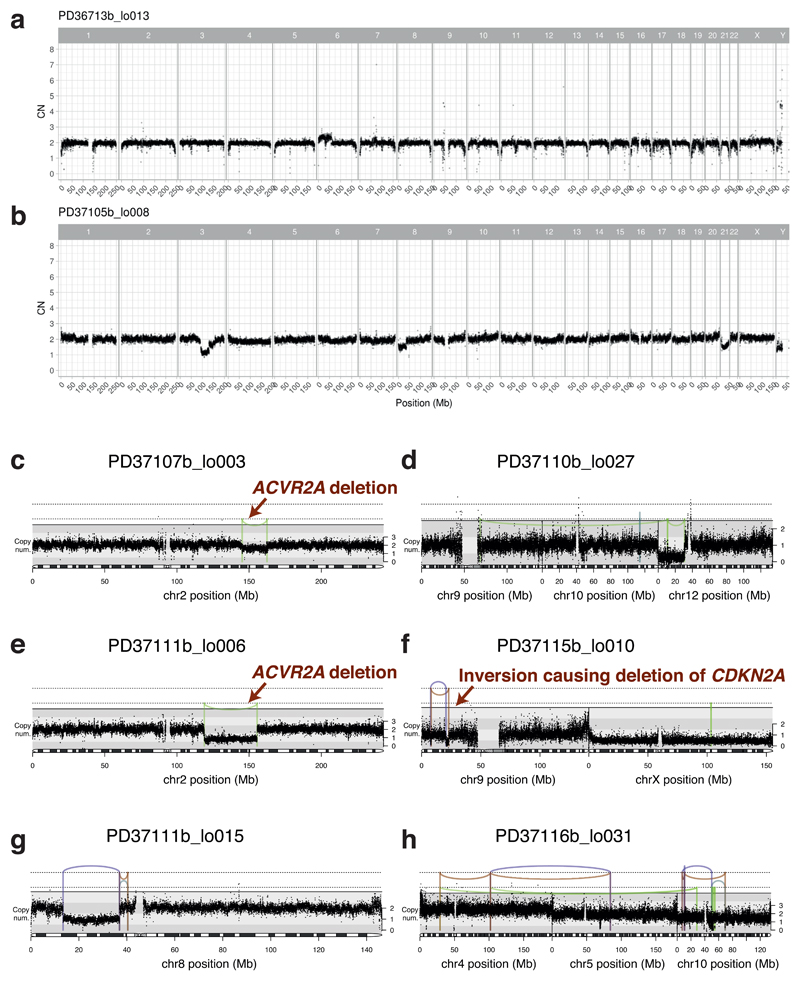
Structural variants and copy number alterations occurred in moderate numbers across all 9 patients with liver cirrhosis, despite being rare in normal liver (Figure 1C, Extended Figure 2, Supplementary Tables 3-4). Occasional whole chromosome or arm-level aneuploidy occurred, as well as focal events, including deletions, tandem duplications and unbalanced translocations (Extended Figure 2). We found 5 separate clusters of SVs, across 3 patients, with patterns indicative of chromothripsis14 (Figures 1D-F, Extended Figure 2). Chromothripsis, in which multiple rearrangements occur in a single catastrophic mitosis14, is a major mutational process in cancers, occurring in ~5% of HCCs15, but is rare in normal somatic cells. To see 1-2% of clones in chronic liver disease with chromothripsis suggests that sustained toxicity and regeneration substantially increases mitotic stress in hepatocytes.
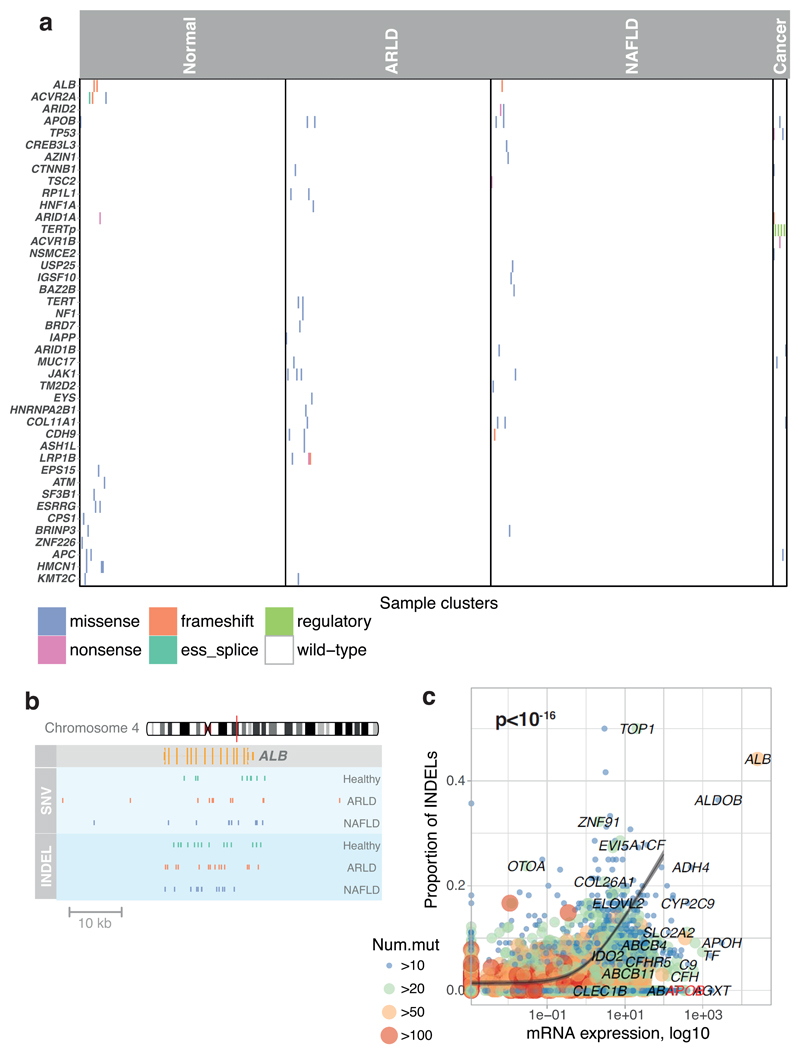
We screened for driver mutations among coding regions, 5’-UTRs, 3’-UTRs and promoters (Supplementary Tables 5-8). No elements were significant after genome-wide multiple hypothesis correction, so we focused on the 30 most prevalent HCC genes1–5. These carried 22 non-synonymous variants, seen in both normal and cirrhotic samples, including inactivating mutations in the tumour suppressor genes ACVR2A, ARID2, ARID1A and TSC2 (Extended Figure 3A). With hypothesis testing restricted to these 30 genes, ALB (q=0.001) and ACVR2A (q=0.001) were significant. Recurrence in ALB (albumin) likely reflects a mutational process in which indels preferentially occur in highly expressed genes, as reported in HCCs5,16 (Extended Figure 3B-C). Assuming no negative selection, we can use the ratio of non-synonymous to synonymous substitutions for the 30 HCC genes to estimate the number of driver substitutions among them17 – this gives a 95% confidence interval of 0.0–13.2 drivers in total across 482 microdissections (<3%). Among copy number aberrations of potential significance1,2,18 (Supplementary Table 9), we found instances of chromosome 22 loss, 8q gain and 8p loss. Two focal deletions in different patients spanned ACVR2A (Extended Figure 2C,E). We also found a reciprocal inversion that deleted CDKN2A (Extended Figure 2F), the most common focal deletion in HCC, and a deletion affecting ARID5A.
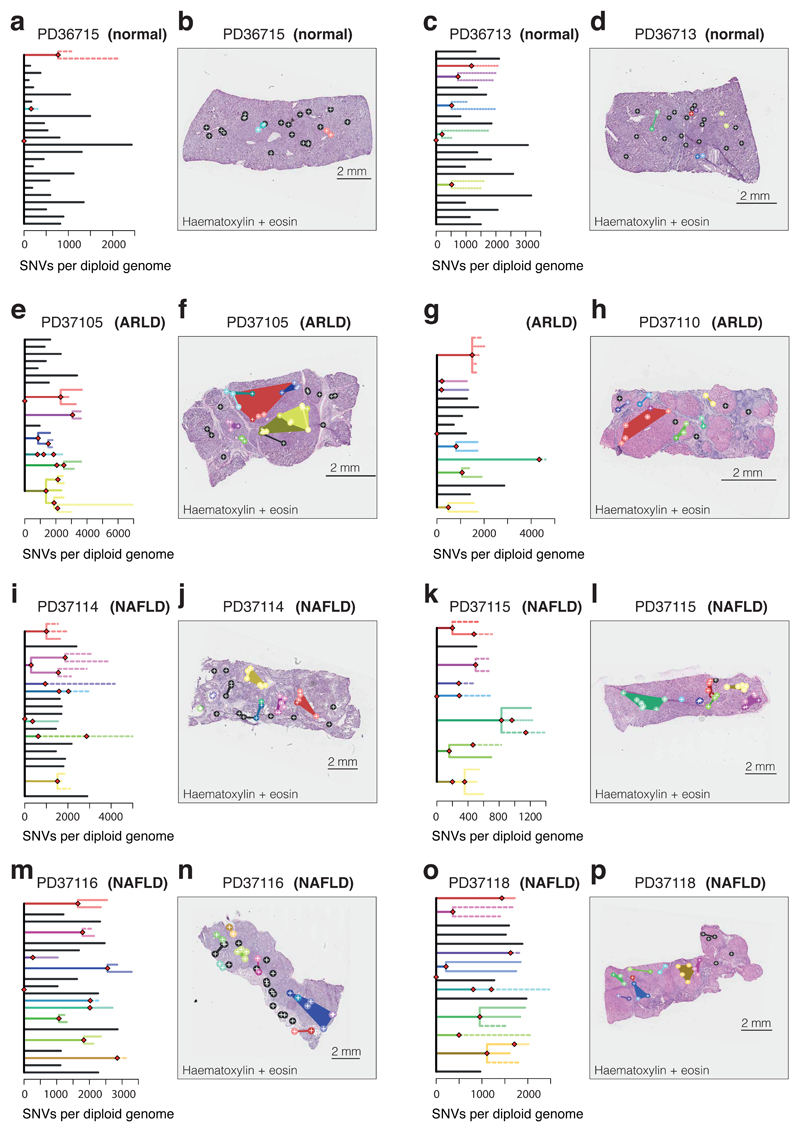
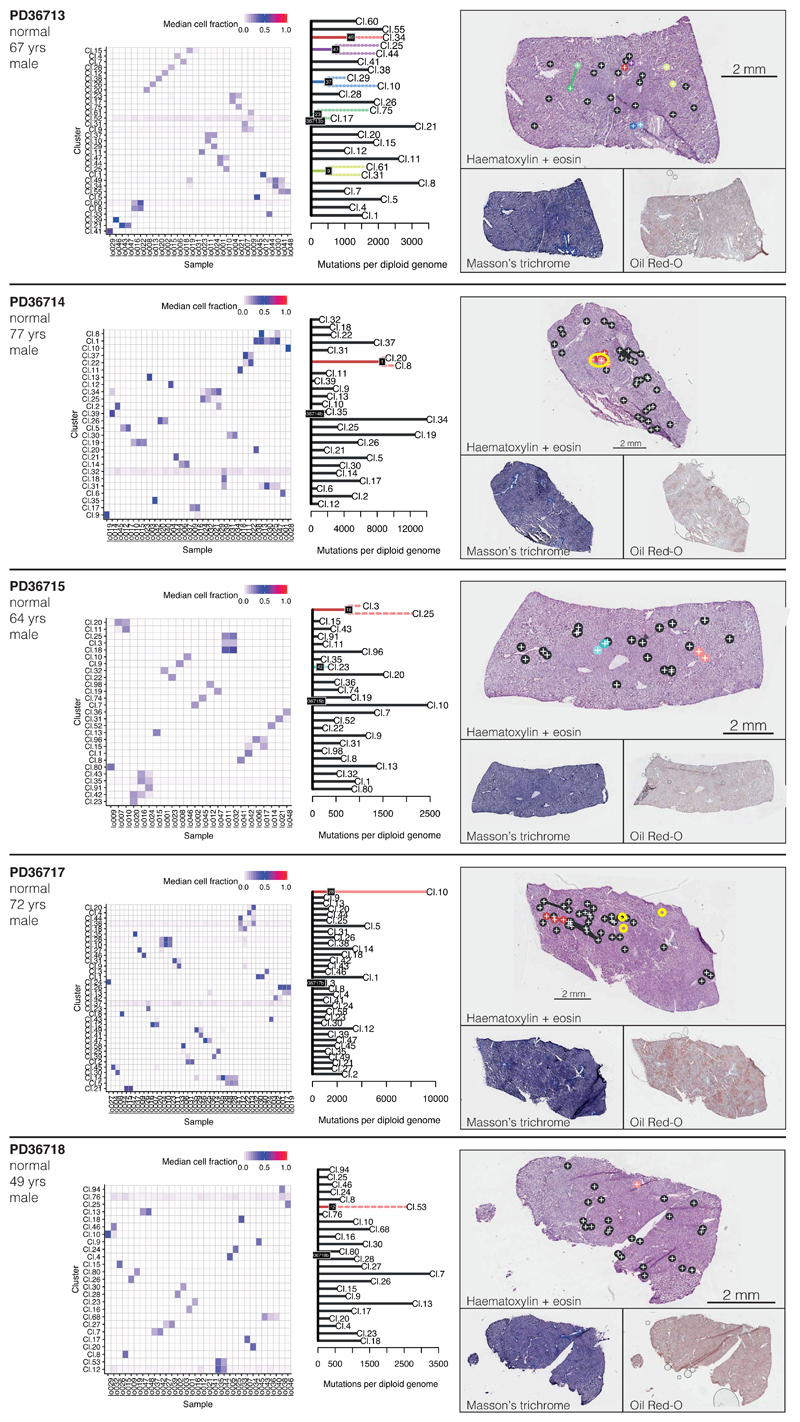
We reconstructed phylogenetic trees19, layering them onto the specimen’s histology. Samples from the healthy controls showed the highly polyclonal nature of normal liver, with little genetic relatedness among even closely located microdissections (Figure 2A-D, Extended Figure 4). Samples from patients with chronic liver disease showed more complex clonal structure, from which three general inferences can be drawn (Figure 2E-P, Extended Figures 5-6). First, we found no sharing of mutations between adjacent liver nodules separated by fibrotic bands. This suggests that the connective tissue laid down during cycles of damage and regeneration sequesters clones from early stages of the disease process. Second, some cirrhotic nodules were monoclonally derived (Figure 2J,N, for example), while others were oligoclonal (Figure 2F), with shared mutations often extending across microdissections millimetres apart. Third, branching structures in phylogenies point to subclonal diversification within nodules. Within such a clone, the proportion of shared, clonal mutations on the trunk relative to those on the subclonal branches gives an estimate in molecular time of when the most recent common ancestor of the clone emerged. In some patients (for example, Figure 2I-J), the common ancestor of individual nodules emerged relatively early in molecular time, while in others (Figure 2M-N), the common ancestor appeared much more recently. Since the majority of liver cells do not have driver mutations, the size and rapidity of clonal expansions observed here evince the considerable in-built capacity of hepatocytes to regenerate in response to liver damage.
Figure 2. Phylogenetic reconstruction of hepatocyte clones.
(A) Phylogenetic tree constructed from clustering of mutations across microdissected samples in a normal patient (PD36715). Lengths of branches (x axis) indicate numbers of mutations assigned to that branch. Solid lines: nesting is in accordance with the pigeon-hole principle. Dashed lines: nesting is in accordance with the pigeon-hole principle assuming hepatocytes represent 70% of cells. Dotted lines: nesting is only based on clustering, assigning a clone as nested if variant allele fractions of constituent microdissections are lower than those in the parental clone.
(B) Representation of branches from the phylogenetic tree in panel A according to their physical coordinates, overlaid onto an H+E stained section. Black points represent branches of the tree sharing no mutations with any other samples; coloured points represent branches with shared clonal relationships (n=26 microdissections).
(C, D) A second normal liver sample (PD36713; n=30 microdissections).
(E, F) Patient with ARLD (PD37105; n=31 microdissections)
(G, H) Patient with ARLD (PD37110; n=22 microdissections)
(I, J) Patient with NAFLD (PD37114; n=41 microdissections)
(K, L) Patient with NAFLD (PD37115; n=34 microdissections)
(M, N) Patient with NAFLD (PD37116; 43 microdissections)
(O, P) Patient with NAFLD (PD37118; 26 micordissections)
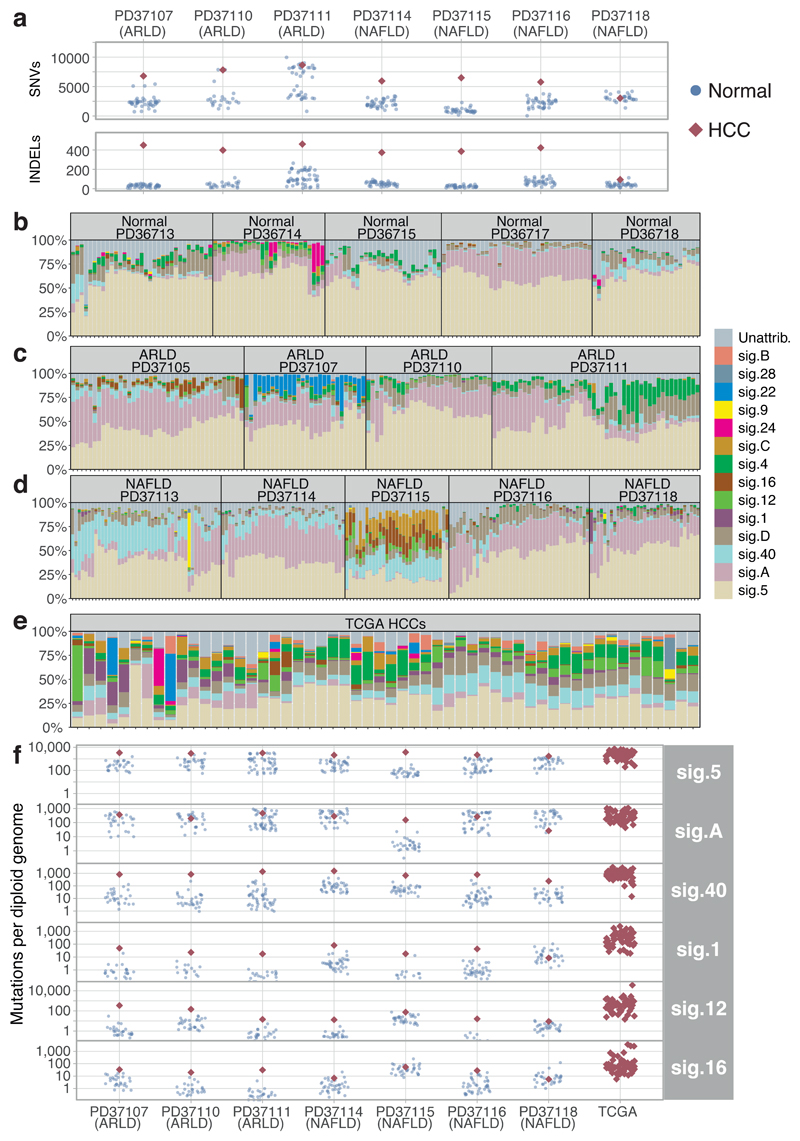
A major debate in modelling cancer development is whether cancers need higher mutation rates in order to acquire sufficient drivers. We compared mutation burden in cirrhotic liver to synchronous, clonally unrelated HCCs from 7 patients. Synchronous HCCs carried, on average, 4600 more mutations than matched cirrhotic liver (CI95% 3600-5500; p<10-18 LME models; Figure 3A). This argues that mutation rates increase during malignant transformation, either through cancer-specific mutational processes or through greater activity in cancers of widespread mutational processes.
Figure 3. Mutational signatures in normal liver, cirrhotic liver and HCC.
(A) Number of somatic substitutions (SNVs; sensitivity-corrected for non-cancerous samples) and insertion-deletion events (INDELs) in each non-cancer microdissection sample (blue points) and associated synchronous HCC (red diamonds).
(B) Stacked bar blot showing estimated proportional contributions of each mutational signature to each phylogenetically defined cluster of somatic substitutions. Data generated using a Bayesian hierarchical Dirichlet process.
(C) Stacked bar blot showing proportional contributions of signatures in patients with ARLD.
(D) Stacked bar blot showing estimated proportional contributions of signatures in patients with NAFLD.
(E) Stacked bar blot showing estimated proportional contributions of signatures to 54 cases of HCC from TCGA1.
(F) Number of SNVs attributed to prevalent mutation signatures in each non-cancer microdissection sample (blue circles) and synchronous HCCs (red diamonds). Contributions for the TCGA samples are shown on the right. The y-axis is on a logarithmic scale.
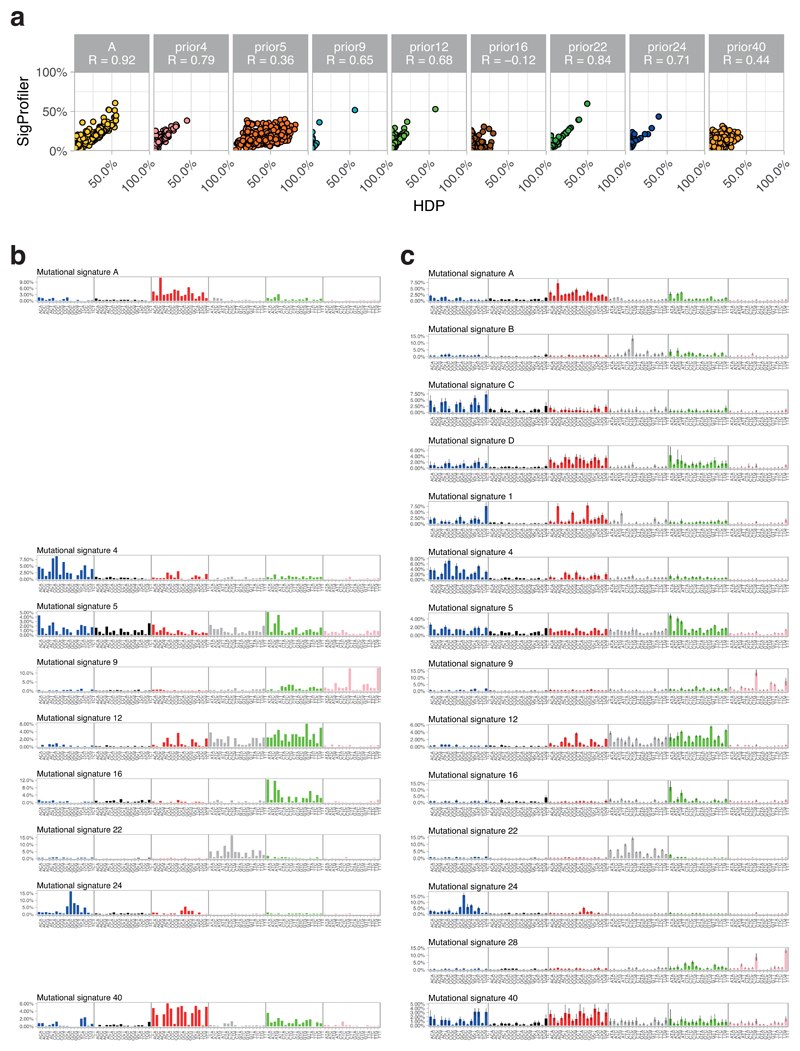
To assess what mutational processes are active in cirrhosis, we extracted mutational signatures across our 482 microdissections, the 7 synchronous HCCs and 54 HCC genomes from TCGA1, using two independent algorithms (Figure 3B-E, Extended Figures 7-8). Three major groups of mutational signatures emerged: those ubiquitous and similarly active across cirrhosis and HCC; those quiet in cirrhosis but universally more active in HCC; and those contributing to some patients but not others, including signatures arising from exogenous exposures.
In normal and cirrhotic liver, ubiquitous mutational signatures (5 and Sig.A) were prevalent across clones, typically accounting for >75% of mutations in combination. Signature 5 is widespread across cancers, including HCCs2,4,20, and accumulates linearly with age, suggesting it arises from endogenous mutational processes. Sig.A is the dominant cause of mutations in normal blood stem cells10,21 and leukaemias21, suggesting it too arises endogenously. In HCCs, although Sig.A accounted for a lower proportion of mutations than in normal or cirrhotic liver, the absolute numbers of mutations attributed to Sig.A were comparable (Difference between cancer and non-cancer, 60 mutations; CI95% -80-200; p=0.4; Figure 3F, Supplementary Table 10). This suggests that it is active in hepatocytes throughout life, but is outstripped in HCC by mutational processes emerging during malignant transformation.
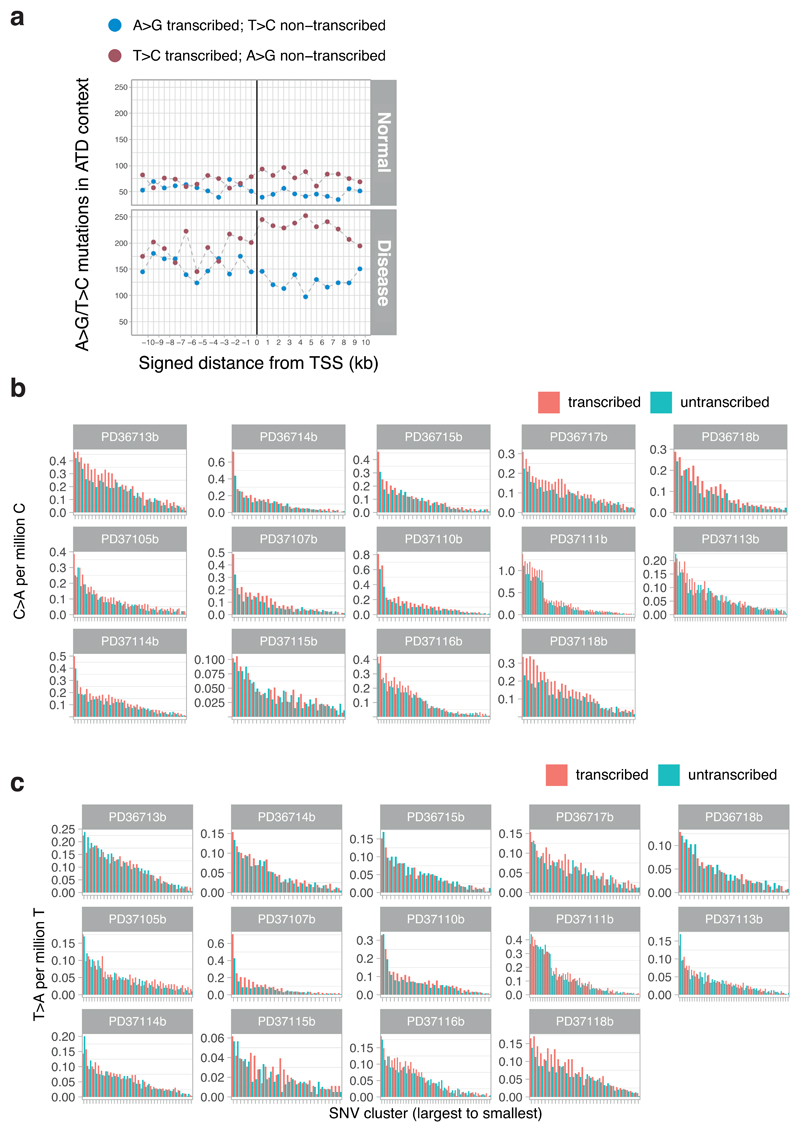
A second group of mutational signatures comprises processes that are relatively quiet in cirrhotic liver but universally more active in HCC (signatures 1, 12, 16, 40 and a novel signature, D; Supplementary Table 10). One of these, signature 16, consists of T>C mutations in ApT context and has a known transcriptional strand bias, with both preferential repair of damaged adenines on transcribed strands and increased damage on non-transcribed strands22. Although this signature is more active in HCCs, we do see its characteristic transcriptional strand bias in cirrhotic liver (Extended Figure 9A). Signature 1, caused by spontaneous deamination of methylated cytosine to thymine, is also much more active in HCC than non-malignant liver. The acceleration and universality of these signatures in HCC suggests they reflect inbuilt DNA damage and repair processes in hepatocytes that are unmasked during malignant transformation.
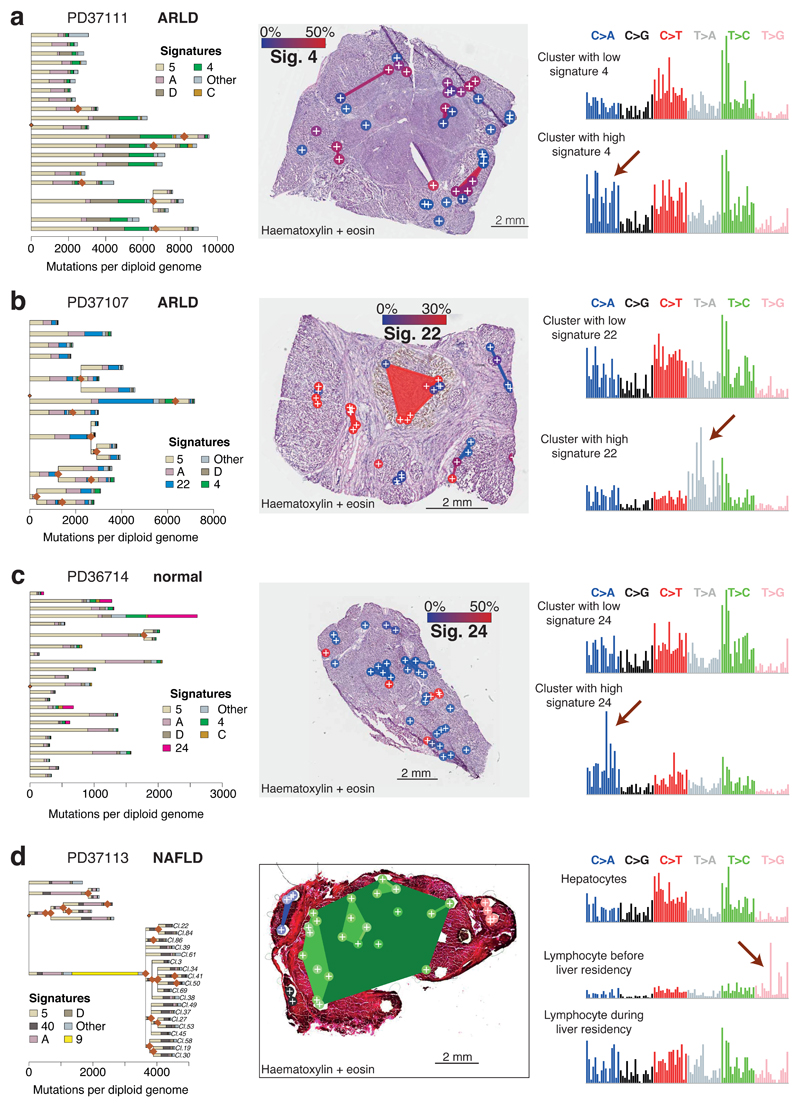
The third group of mutational processes represents signatures seen sporadically across the cohort, many of which are due to exogenous exposures. One, signature 4, is found in lung cancers from smokers20 and also HCCs, albeit with a less clear-cut relationship to tobacco2. Of our 14 patients, 4 had >10% of microdissections with >5% of mutations attributed to signature 4, showing the expected transcriptional strand bias on guanines (Extended Figure 9B). Not only did signature 4 show considerable patient-to-patient heterogeneity, there was also unexpectedly high clone-to-clone and nodule-to-nodule variability within individual livers. In one patient, for example, about half the clones we sequenced had 2000-4000 mutations, whereas the other half had 8000-12000, driven by presence or absence of signature 4 (Figure 4A).
Figure 4. The liver as a witness for mutagenic insults occurring throughout life.
(A) Left panel: Phylogenetic tree of clones in patient PD37111, with each branch coloured by the proportion of mutations in that branch assigned to the different mutational signatures.
Middle panel: Overlay of the clones represented in (A) onto an H+E stained liver section of patient PD37111 (n=39 microdissections). Colouring of clones is according to the proportion of mutations attributed to Sig. 4, linked to tobacco exposure (blue: low activity of Sig. 4, red: high activity of Sig. 4).
Right panel: Representative mutation spectrum for samples with low (top) or high (bottom) burden of Sig. 4. The six substitution types are labelled across the top. Within each substitution type, the contribution from the trinucleotide context are shown as 16 bars. The 16 bars are divided into four sets of four bars, grouped by whether an A, C, G or T respectively is 5’ to the mutated base, and within each group of four by whether A, C, G or T is 3’ to the mutated base.
(B) Overlay of mutational signatures onto phylogenetic tree of clones in patient PD37107 (n=41 microdissections). Colouring of clones in the middle panel is according to Sig. 22, linked to the aristolochic acid carcinogen.
(C) Overlay of mutational signatures onto phylogenetic tree of clones in patient PD36714 (n=35 microdissections). Colouring of clones in middle panel is according to Sig. 24, linked to the carcinogen aflatoxin-B1.
(D) Overlay of mutational signatures onto phylogenetic tree of clones in patient PD37113 (n=37 microdissections). Cluster 10 has many mutations attributed to Sig. 9, linked to the somatic hypermutation process in B lymphocytes.
This within-patient regional variability extended to other exogenous exposures. In one patient, 20-35% of mutations derived from signature 22 (Figure 4B; Extended Figure 9C), characteristic of exposure to aristolochic acid23. This patient grew up in Poland, holidaying in Balkan states where aristolochic acid exposure is pervasive24. In a different patient, a subset of microdissections had 10-20% mutations attributable to signature 24 (Figure 4C), associated with aflatoxin-B1 exposure5. Biomarkers of exposure to aflatoxin-B1, produced by Aspergillus moulds contaminating crops, are prevalent in arable farmers25, the occupation of our patient. In both patients, these carcinogens showed striking variability in mutational activity over short distances, generating few mutations in some clones and hundreds to thousands in others – such striking regional variation in activity of exogenous signatures is both unexpected and unexplained.
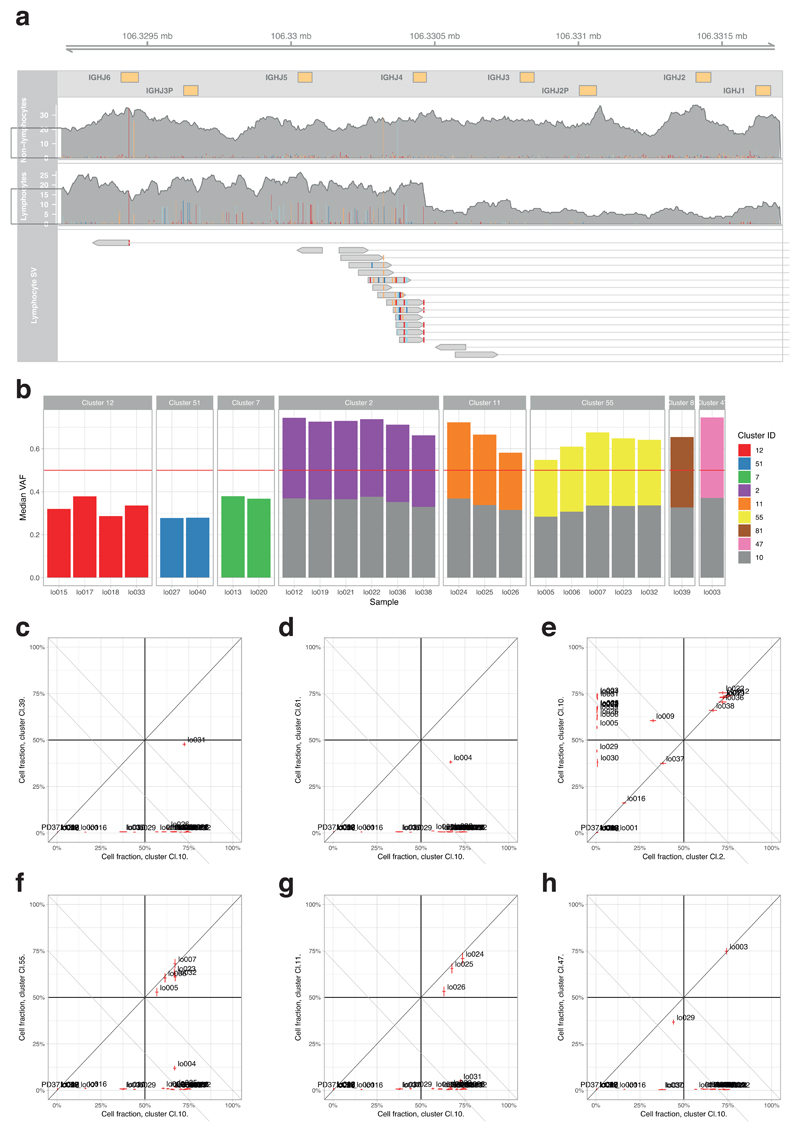
In one patient, we found a large clone that carried >2000 mutations attributed to signature 9 (Figure 4D), caused by off-target somatic hypermutation in B lymphocytes20. A clonotypic IGH rearrangement was evident, consistent with a single B lymphocyte subclonally diversifying as it expanded in the liver (Extended Figure 10). Signature 9 was only present on the ancestral trunk, whereas signatures in the subclones, acquired in the liver, distributed similarly to hepatocytes, suggesting the hepatic microenvironment shaped the on-going mutational processes in the lymphocytes.
In conclusion, then, non-malignant liver has considerably lower proportions of clones (<5%) with driver point mutations or structural variants than oesophagus or skin11,26,27, and those present were seen in both normal and cirrhotic liver. They did not drive large clonal expansions, being restricted by fibrosis, and were not shared with the distant synchronous HCCs, suggesting that the increased cancer risk seen in chronic liver disease arises from a myriad of clones competing independently to acquire sufficient driver mutations. TERT promoter mutations are likely to be key events in this progression as they are seen in dysplastic hepatic nodules18,28, but we did not identify any in cirrhotic or normal liver. The low proportion of clones with drivers observed here and in exome studies performed elsewhere29,30 means that much larger sample sizes will be needed to comprehensively map how driver mutations accumulate in the progression from normal liver through regenerative and dysplastic nodules to HCC.
These data reveal the genomic consequences of chronic liver disease – increased mutation rates; complex structural variation including chromothripsis; aneuploidies; low burden of mutations targeting known HCC genes. Genomically, one middle-aged, healthy liver looks much like any other: a community of small, tightly packed clones, each comprising a few hundred cells, containing ~1000-1500 mutations, painted from a limited palette of signatures. Unhealthy livers diverge from this norm: large dynasties of clones, sequestered by impassable bands of fibrosis, their palette of signatures more variable, more vigorous, more regionally variegated.
Methods
Samples And Sequencing
Samples
Patients recruited at Addenbrooke’s Hospital, Cambridge gave written informed consent with approval of the Local Research Ethics Committee (16/NI/0196).
Normal liver samples were obtained from patients with liver metastases from colorectal carcinoma (CRC). The liver specimens were obtained from resected liver distal to the metastases, that were confirmed on histology. None of the patients had undergone neo-adjuvant systemic therapy; one patient had undergone pre-operative portal vein embolisation (PD36718) to the ipsilateral liver lobe. Liver tissue from patients with chronic liver disease (CLD) was derived from explanted diseased livers at the time of transplantation. All of the patients were identified as having ARLD or NAFLD by clinical history to the transplant hepatology and addiction psychiatry teams, as well as explanted liver histology. None of the patients had undergone trans-arterial chemo-embolisation (TACE) or other locoregional therapy on the transplant waiting list, except PD37118 who underwent a single treatment to their HCC with TACE. All of the CLD patients, except one (PD37105), demonstrated significant pre-operative impairment of liver function as evidenced by a UKELD of >50.
The explant liver histology was reviewed by a specialist liver histopathologist (SED), blinded to the sequencing results. The normal liver specimens had no fibrosis and no evidence of chronic liver disease; the explanted diseased livers uniformly demonstrated cirrhosis and HCC. The background liver histology was scored according to the Kleiner system31 on FFPE samples away from the HCC and the fresh frozen block used for the sequencing analysis. The Kleiner score assesses the presence of steatosis, lobular inflammation and hepatocyte ballooning to generate a cumulative NAS score. The presence or absence of cellular or nodular dysplasia was globally assessed in clinical FFPE samples (Supplementary table 1), as well as specifically assessed in the fresh-frozen block used for the laser capture microdissection and sequencing (Supplementary table 1). Serial H&E-stained sections from the frozen block did not demonstrate dysplasia in any of the cases (Supplementary table 1). Further, there was no evidence of CRC or HCC on histological review of the fresh-frozen block used for sequencing.
All tissue samples were snap-frozen in liquid nitrogen and stored at -80°C in the Human Research Tissue Bank of the Cambridge University Hospitals NHS Foundation Trust.
Preparation of tissue sections
Tissue biopsies were embedded in Optimal Cooling Temperature (OCT, ThermoFisher) medium at -25°C. Sections were cut at a thickness of 20µm using a Leica Cryotome and transferred onto PEN membrane slides (ThermoFisher). For fixation, slides were treated with 70% ethanol at room-temperature for 2min. Slides were washed twice in 10% phosphate buffered saline (PBS) at room-temperature for 10s. For staining, slides were incubated in haematoxylin for 10s and rinsed twice in water. Slides were then incubated in eosin for 5s and rinsed once in water. Slides were washed twice with 70% ethanol for 5s, twice with 100% ethanol for 5s, and in xylene for 5s. Storage was at -20°C. Additional sections were stained for H&E, Masson’s Trichrome and Oil Red O by standard laboratory techniques. All slides were scanned on a Leica AT2 at ×20 magnification and a resolution of 0.5μm per pixel.
Laser Capture Microdissection (LCM)
Microdissection was performed using a LCM (Leica Microsystems LMD 7000). For each biopsy, 48 microdissections were cut with a target size of 20,000µm2, corresponding to about 400 hepatocyte cells. Images were taken before and after LCM.
Sample lysis and DNA preparation
LCM biopsies were lysed using the Arcturus PicoPure DNA Extraction Kit (ThermoFisher) following the manufacturer’s instructions. DNA libraries for Illumina sequencing were prepared using a protocol optimized for low input amounts of DNA, as described32.
Whole-genome sequencing
Paired-end sequencing reads (150bp) were generated using the Illumina X10 platform for 400 samples, resulting in a target coverage of 30x-70x per sample. To avoid the known index-hopping artefact, we chose to avoid multiplexing samples and instead sequenced one sample per flow cell lane. To increase coverage for a subset of 96 samples, we used multiplexing and achieved 70x coverage. In addition to the LCM samples we also sequenced a bulk sample for each biopsy and (where available) associated hepatocellular carcinoma (HCC).
The healthy liver samples came from wide resections of hepatic metastases of colorectal cancer. In each case, we sequenced the metastasis – this did not reveal any mutations shared between the colorectal cancer and liver, nor any variants shared by all liver samples absent from the colorectal cancer (beyond regions of loss-of-heterozygosity in the cancer). Likewise, for the cirrhotic liver samples, we sequenced the matched HCC, not revealing sharing of mutations. In one case, we sequenced microdissections of the fibrotic tissue, and here also did not find mutations restricted to all liver cells.
Sequencing data were mapped to the human genome, GRCh37d5, using the BWA-Mem algorithm.
Variant Calling
SNV calling
Substitution variants were called using the Cancer Variants through Expectation Maximisation (CaVEMan) algorithm33, using the bulk sample of the liver biopsy as the matched normal. As part of the algorithm, the variants were annotated using VAGrENT34. Variant calls for bulk sequencing data of the cancer samples were not further filtered. For sequencing of LCMs, post-filtering was performed in three steps:
1. Removal of duplicate counts: we noticed instances where variant bases were counted twice due to the overlap of paired-end sequencing reads. We removed such double counting and re-evaluated variant calls after taking double counts into account.
2. Removal of variants introduced during library preparation: we noticed the presence of variants introduced due to incorrect processing of cruciform DNA. Erroneous variants were often present in inverted repeats and frequently accompanied by another proximal (~ 1-30bp distance). These inverted repeats can form cruciform DNA prior to DNA isolation or during library preparation. The library preparation protocol employed can incorrectly process these secondary DNA structures and inadvertently introduce one or more erroneous variants. For every variant the standard deviation (SD) and median absolute deviation (MAD) of the variant position within the read was separately calculated for positive and negative strand reads.
In the case that the variant was supported by a low number of reads for a particular strand, the filtering was based on the statistics determined from the reads derived from the other strand. It was required that either:
≤ 90% of supporting reads report the variant within the first 15% of the read as calculated from the alignment start.
Or, that the MAD > 0 and SD > 4.
In the case that sufficient reads supporting the variant were available for both strands it was required for both strands separately that either:
≤ 90% of supporting reads report the variant within the first 15% of the read as calculated from the alignment start.
Or, that the MAD > 2 and SD > 2.
Or, that at least one strand has fulfills the criteria MAD > 1 and SD > 10.
3. Comparison with an independent panel: to remove variant calls at badly-mapping sites, we compared variant calls in the sequenced samples of each donor biopsy with samples from all unrelated donors in our cohort. For each variant site we expected the reference base to be dominant and conversely expected badly-mapping sites to contain frequent non-reference base counts. Thus, we counted the numbers of A, C, G, T, insertion and deletion calls at each variant site across all unrelated samples, resulting in a large “pileup” table. The dominance of the reference base was evaluated at each variant site using the entropy purity metric E:
where x is the count of base i and the P(xi) are the fractions of base calls. Values of E close to 0 indicate that almost all reads in the independent panel contain a single base. Higher values of E indicate a mix of base calls at the site. To identify an optimal threshold of E for the filtering of variant sites, we evaluated the entropy metric against a labelled dataset of variant calls. Specifically, during the clustering of variants using the Bayesian Dirichlet process (described below), we identified clusters that had variants with low allele frequency present in all dissections from the same donor. Manual inspection showed that such variants occurred at badly-mapping sites. Thus, we labelled variant sites in those clusters as “badly-mapping” and were able to use the Area-Under-the-Receiver-Operator-Curve to identify a threshold value EThr of 0.16 that allowed to separate the two labelled variant groups with an AUC of 0.99.
Bayesian Dirichlet process for clustering VAFs across multiple samples
We extend the model previously developed for clustering variant allele fractions (VAFs) of mutations called in a single sample19 to mutation data across multiple samples from the same individual. In normal somatic cells, the vast majority of the genome retains its normal, diploid copy number, which means that we can cluster the VAFs directly (excluding mutations on the X and Y chromosomes in males) – this has the considerable advantage that the Dirichlet Process model we build can rely directly on conjugate prior distributions. The model includes a potential split-merge step at each cycle of the Gibbs sampler, following a previously described Metropolis-Hastings proposal for conjugate distributions35. The algorithm could be extended to include a correction for different copy number states in given samples for a particular mutation through, for example, a Metropolis-Hastings update, but at considerable computational cost. The full mathematical development of the model is detailed in the Supplementary Methods.
We ran the Gibbs sampler for 15,000 iterations, dropping the first 10,000 as a burn-in. We used the ECR algorithm36, implemented in the R package label.switching, to resolve the label switching problem associated with mixture models. We dropped clusters containing <100 variant sites.
Phylogenetic tree construction
Phylogenetic trees were constructed manually using the pigeonhole principle as described previously19. In short, each cluster identified using the Bayesian Dirichlet process represented a branch of the phylogenetic tree. Nesting of trees was identified with three different levels of certainty, illustrated on a pair of branches A and B:
In case the median VAFs of A and B exceeded 100%, the pigeonhole principle defines that A and B are nested.
We can assume that non-hepatocyte cells constitute a sizeable fraction of each LCM sample. Assuming a non-hepatocyte fraction of 30% we nested branches when VAFs of A and B exceeded 70%. This non-hepatocyte fraction was chosen as a conservative estimate of the fraction of cells intermixed in our microdissections that are not derived from the hepatocyte clone, based on observed VAF peaks in our data together with single-cell RNA sequencing data from liver tissue.
If identical LCMs are members of both A and B, it is highly likely that A and B are nested, rather than independent branches. Thus, we also nested branches where the LCMs in one branch were a subset of the LCMs in the other (parental) branch.
In each nesting scenario, we defined the parental branch to be the one with the higher median VAF in the contained LCMs. We highlighted the evidence level for nesting in each representation of phylogenetic trees, marking branches with evidence level 1 with a solid line, level 2 with a dashed line and level 3 with a dotted line.
Analysis of driver variants
We curated a list of genes that have been found to be significantly mutated in liver cancers in a selection of published studies1–4,6,7,37–39, as represented in Supplementary Table 5. Using the VAGrENT annotations34, we counted any regulatory, missense, nonsense, frameshift or essential splice variant as a potential driver variant. To systematically identify genes under mutagenic selection, we used the dN/dS method17 that screens for genes with an excess of non-synonymous mutations compared to that expected from the synonymous mutation rate.
Sensitivity correction
We identified 138 pairs of LCMs with a midpoint-to-midpoint distance of < 500µm and at least one shared cluster according to the Bayesian Dirichlet process. These LCMs we assumed to represent the same clone, thus providing an opportunity to calculate the sensitivity of calling a variant present in one LCM in the other. If we assume the sensitivity is the same in both samples, then the maximum likelihood estimate for the sensitivity, when mutations not called in either sample are unobserved, is given by:
where n2 is the number of variants called in both LCMs in each pair and n1 is the number of variants called only in one of the two LCMs. To evaluate the relationship of sensitivity with depth-of-coverage and VAF, we performed a logistic regression of sensitivity against these two predictors using the lm() function of the R programming language. The model fit was then used to calculate sensitivity for any LCM sample, given the coverage and VAF of the sample.
Mutation burden analysis
We used a linear mixed effects model to fit the number of variants per LCM sample against each individual’s disease aetiology (normal or cirrhotic) and age. We defined the individual’s ID as a random effect. The slope of the age coefficient was allowed to vary with the random effect. To facilitate the analysis, we used the lmer() function available from the lme4 package of the R programming language. To determine the significance of the aetiology and age coefficients, we used ANOVA analysis to perform a X2 test comparing our model with models omitting the aetiology and age coefficients, respectively.
Deep targeted sequence validation of mutation calls
For 96 of the microdissections sequenced by whole genome sequencing, we performed a deep targeted sequencing validation using an Agilent RNA bait-set covering 350 recurrently mutated cancer genes. Among these genes, a total of 17 mutations were identified in the whole genome sequencing data from the 96 samples – of these, 16 (94%) were validated, at comparable variant allele fractions, in the targeted deep sequencing data.
INDEL calling
INDELs were called using cgpPindel40. Variant calls for bulk sequencing data of the cancer samples were not further filtered. To remove artefactual calls from the LCM-derived data, we performed two post-filtering steps:
1) Assignment to SNV-based clusters: we evaluated how well the VAF distribution of each INDEL across the LCMs from the same donor compared with the VAF distribution of each SNV-based cluster as identified by the Bayesian Dirichlet process. Given an INDEL in one LCM sample, we thus counted its occurrence in all related LCMs and assigned the resulting VAF profile to the SNV clusters’ VAF profiles using a Bayes’ classifier. We noticed that many INDELs were assigned to SNV clusters with <100 variants, which we had previously removed from the SNV analysis. On closer inspection we noticed that those INDELs had low VAF and occurred frequently in badly-mapping regions. We thus discarded INDELs assigned to those clusters.
2) Filtering based on beta-binomial overdispersion parameter: we noticed that many INDELs occurred with low VAF in a large number of LCMs from the same donor and were, thus, likely to be artefactual. To systematically identify such INDELs, we fitted the beta-binomial distribution to the variant counts of each INDEL across the LCMs from the same donor. Fitted parameter ρ, the overdispersion parameter, was used to filter INDEL calls. A high value for parameter ρ (overdispersion) occurs when some LCMs have many variant read counts and others few or none. Conversely, a low value occurs when all LCMs have a similar number of variant counts (no overdispersion). Based on manual inspection, we removed variant calls with ρ < 0.02.
Copy number calling
CNs were called using the ASCAT algorithm41, assuming an expected ploidy of 4 (to allow for physiologically polyploid hepatocytes) and 60% non-hepatocyte cell contamination for all samples. Robustness testing around these starting points (different expected ploidy or purity values) found that the specific values used did not materially affect the output. Variant calls for bulk sequencing data of the cancer samples were not further filtered. To remove artefactual variants from the LCM-derived data, we employed the SNV-based phylogenetic information. The genome was segmented into 500bp bins and the ASCAT-based copy number of each bin was calculated. Using the binned CN data we calculated the median CN in each LCM sample and ASCAT event. For each ASCAT event and LCM sample we assigned its absolute deviation from the diploid state. We compared each ASCAT event’s CN profile across the LCM samples with the VAF profile of each SNV cluster using cosine similarity (described below) to identify the most similar SNV cluster. Within each SNV cluster we proceeded to merge overlapping ASCAT events. Using manual inspection, we decided to keep ASCAT events if they 1) had a cosine similarity of < 0.1 to an SNV cluster and 2) if their assigned SNV cluster was not removed during SNV analysis due to having < 100 assigned SNVs.
Structural variant calling
SVs were called using the BRASS algorithm42 (https://github.com/cancerit/BRASS). Variant calls for bulk sequencing data of the cancer samples were not further filtered. To remove artefactual variants from the LCM-derived data, we employed post-processing filters. Manual inspection of the sequencing reads identified for each SV showed that many reads were identical except for frame-shifts at repetitive sites. We decided that such reads represented duplicates and designed a filter to systematically remove these. We removed SVs supported by <2 reads after duplicate removal. Each remaining SV call was manually inspected.
Clone size calculation
We determined the midpoint coordinates of each LCM manually from the microscopy images collected during dissection. For each LCM belonging to a clone as determined by the Bayesian Dirichlet process, we used the function chull of the R programming language to identify the coordinates of the convex hull that included all LCMs. We identified the midpoint of each polygon as the average coordinate of all convex hull vertices. The size of the clone was then assigned to be the Euclidean distance between each convex hull vertex and the polygon’s midpoint. For clones that only consisted of a single LCM, we assigned the minimum clone size discovered across all clones.
Extraction of mutational signatures from SNV contexts using HDP
Mutational signatures were extracted using the HDP package (https://github.com/nicolaroberts/hdp) relying on the hierarchical Bayesian Dirichlet process. The units of signature extraction were mutations assigned to individual branches of the phylogenetic tree, grouped per patient, from the LCM data. In addition, to provide a comparison against signatures extracted in HCCs, we added catalogues of somatic substitutions from 54 whole genomes sequenced by the TGCA, analysed using the same core algorithms as used for the LCM data. The tool was used without defining prior signatures. As hyperparameters we set alpha and beta to 6 for the alpha clustering parameter. Extraction was started with 40 data clusters (parameter ‘initcc’). The Gibbs sampler was run with 10,000 burn-in iterations (parameter ‘burnin’). With a spacing of 50 iterations (parameter ‘space’), 50 iterations were collected (parameter ‘n’). After each Gibbs sampling iteration, 3 iterations of concentration parameter sampling were performed (parameter ‘cpiter’). Resulting signatures were compared to published signatures20,43 using the cosine similarity metric described below. Extracted signatures with cosine similarity >0.9 compared to a known signature from either the COSMIC20 or PCAWG43 catalogue of signatures were assigned the name of the known signature with the highest similarity. Extracted signatures with cosine similarity <0.9 to any of the known signatures were assigned new names, indexed with letters A, B, and C.
Extraction of mutational signatures from SNV contexts using SigProfiler
We used SigProfiler to extract mutational signatures, relying on the non-negative matrix factorization (NNMF) method44. In particular, we report the “Decomposed Solution” output by the package.
Cosine similarity calculation
To compare two vectors A and B, cosine similarity was calculated as follows:
Analysis of INDEL proportion and gene expression
A list of transcribed regions was retrieved from ENSEMBL using the BioMaRt package45. We identified the subset of INDEL and SNV variants that overlapped with the transcribed regions. The proportion of INDELs in comparison to the total number of INDELs and SNVs per gene was calculated. Gene expression was assigned using the “liver” dataset from the Genotype-Tissue Expression project46. To test for the relationship of gene expression on INDEL proportion, we fit a Poisson regression using the glm function of the R programming language. We modelled the number of INDELs per gene against an offset of the total number of variants per gene and the gene’s expression.
Analysis of T>C transcription strand bias at transcription start sites
We performed this analysis analogously to a published approach22. In short, we retrieved the genomic coordinates of transcription start sites of the all overexpressed genes in the liver (GTEx46). We tiled the 10 kilobases up- and downstream of the transcription start site into 1,000bp bins. We overlapped all T>C (transcribed) and A>G (untranscribed) variant calls with the tiled regions and summed the number of variants in each tile across all included genes. We also extracted the number of T and A bases in each tile. To test whether strand bias was significant only in transcribed regions, we fit a Poisson regression for the number of variant calls against the following predictors: strand (transcribed / untranscribed), distance from TSS (0 for upstream, 1 for downstream), aetiology (cirrhosis, no cirrhosis) and used the number of T and A bases in each tile as the offset variable.
Analysis of C>A and T>A transcription strand bias
We used the MutationalPatterns package47 to assign the transcription state for each C>A variant. We retrieved the genomic coordinates of all transcribed regions from ENSEMBL using the BioMaRt package45 and extracted the frequencies of C and G nucleotides in these regions. To test for significance of transcription strand bias, we performed a Poisson regression for the number of C>A variants in each sample and transcription strand against factor variables for the transcription strand, the patient ID and an interaction term for the two factors. We used the C, G nucleotide frequency as an offset variable. To test for significance of transcription strand bias for a given donor, we coded the patient ID in a binary fashion: “1” for the target donor, “0” otherwise. We proceeded analogously to test for transcription strand bias of T>A variants, using A and T nucleotide frequencies as the offset.
Extended Data
Extended Data Figure 1. Sensitivity analysis of SNV calls.
(A) Overview schematic of the experimental and analytical approach.
(B) Examples of the variant allele fractions (VAFs) of variants from unrelated (top) and related (bottom) microdissection sample pairs from four donors (left to right). X-axis represents the VAF of sample 1 from each pair; Y-axis represents the VAF of sample 2. Each dot represents one variant. Red: variants called in both samples, yellow: variants called in sample 1, blue: variants called in sample 2.
(C) Histogram of sensitivities calculated for each sample pair.
(D) Heatmap of modelled sensitivity at different values of VAF and coverage. Overlaid dots represent sample pairs used to fit model.
(E) Relationship of VAF, sensitivity and coverage according to fitted model of sensitivity. Overlaid dots represent sample pairs used to fit model.
(F) Comparison of calculated (x-axis) and fitted (y-axis) sensitivity for each sample pair (n=34 pairs of samples). The R2 value quoted is a Pearson’s correlation coefficient.
(G) Proportion of hepatocytes that are multinucleated in samples analysed here, estimated by counting 500 cells in each H&E section (n=14 patients). Each point represents the proportion of a patient in the study. The horizontal bars represent the mean for that aetiological group.
Extended Data Figure 2. Copy number and structural variants in chronic liver disease.
(A, B) Genome-wide copy number profiles for two samples. Black points represent read-depth of discrete windows along the chromosome, corrected to show overall copy number. Arm-level and whole chromosome gains and losses are evident.
(C-H) Focal copy number changes and structural variants. Black points represent read-depth of discrete windows along the chromosome, corrected to show overall copy number. Lines and arcs represent individual structural variants, coloured by the orientation of the joined ends (purple, tail-to-tail inverted; orange, head-to-head inverted; pale blue, tandem duplication-type orientation; pale green, deletion-type orientation). Events affecting known HCC genes are marked with labelled arrows (panels C, E, F).
Extended Data Figure 3. Events affecting known HCC genes in cohort.
(A) Distribution of somatic point mutations in individual microdissections (x axis) affecting known HCC genes (y axis). The inset to the left shows the frequency of events in individual genes. The inset to the bottom shows the aetiology attributed to the sample, and whether the sample was drawn from non-cancerous hepatocytes (left) or HCC (right).
(B) Genomic position of single nucleotide substitutions (SNVs; light blue strip, top) and insertion-deletions (INDELs; dark blue strip, bottom) detected in ALB, the gene encoding albumin.
(C) Relationship of gene expression in liver tissue (x axis) and proportion of indels as a fraction of all point mutations (y axis). The grey line represents a Poisson regression model with a significant (two-sided likelihood ratio test; p < 10-16) coefficient for gene expression as a predictor for the ratio of indels (n=5458 genes included in model). The grey ribbon represents the 99% confidence interval of the parameter estimates.
Extended Data Figure 4. Phylogenetic reconstruction of hepatocyte clones in non-cirrhotic liver samples.
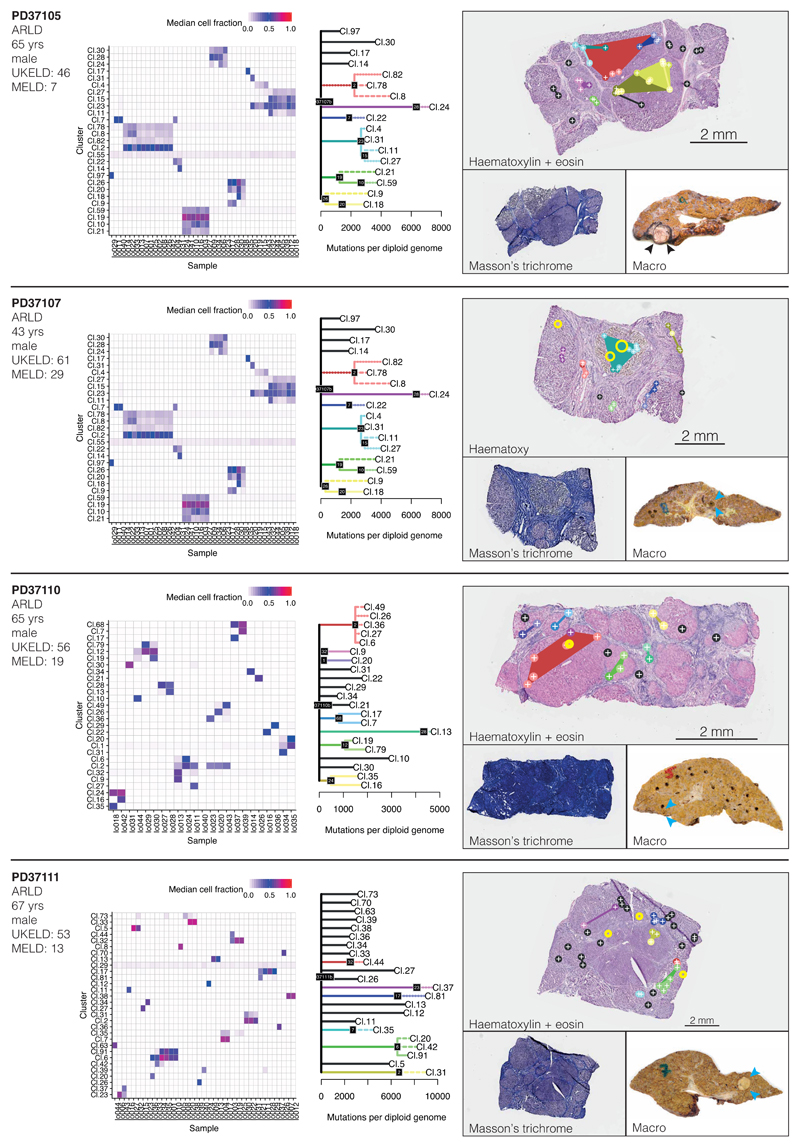
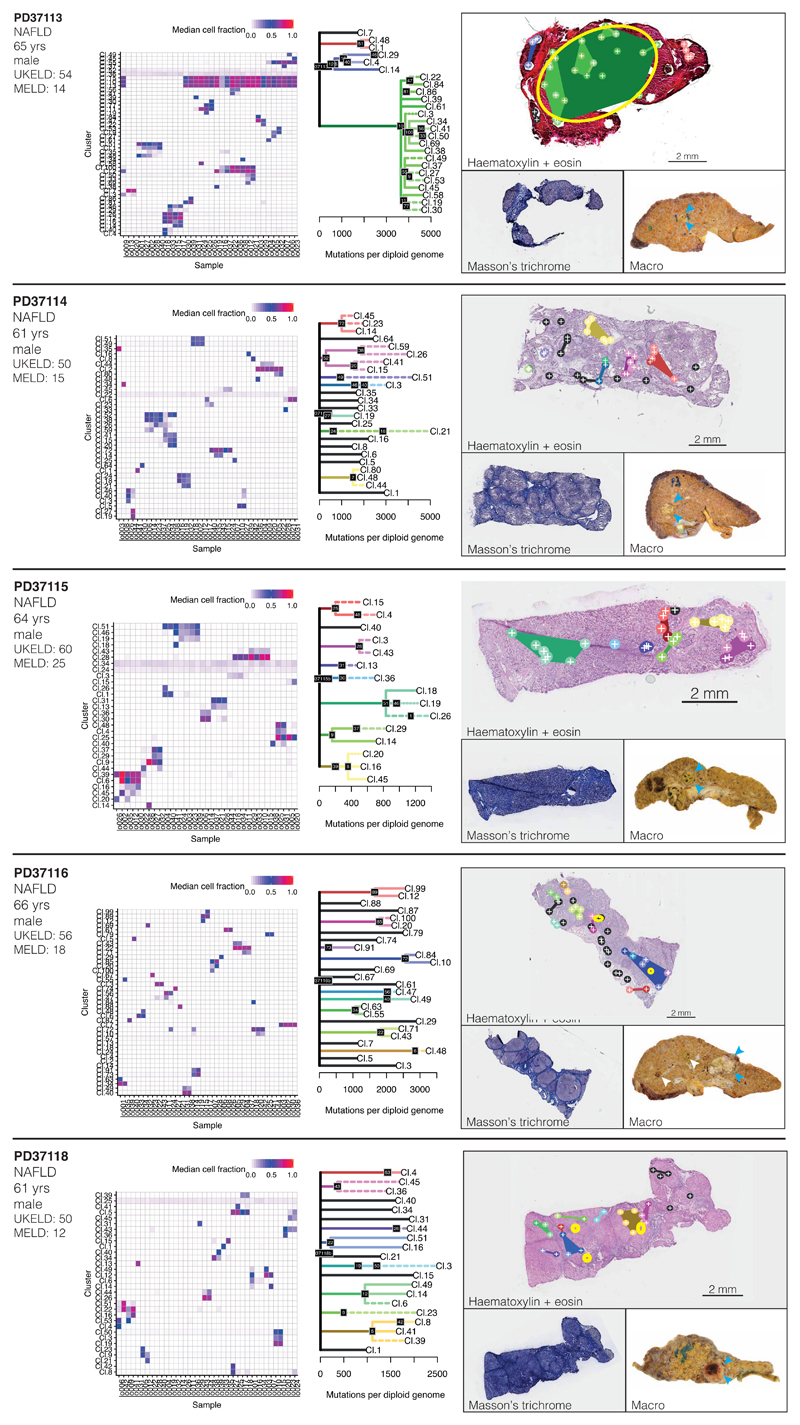
Left column: Heatmap representing the clustering of the variants observed in each microdissection sample (x-axis) of the non-cirrhotic livers. Each cluster (y-axis) contains mutations for which variant allele fractions across samples are very similar. The colour scale of the boxes represents the estimated mean variant allele fraction for that cluster in that sample.
Middle column: Phylogenetic trees constructed from the clustering information. Solid lines: nesting is in accordance with the pigeon-hole principle. Dashed lines: nesting is in accordance with the pigeon-hole principle assuming the pool of hepatocytes to be 70% of cells. Dotted lines: nesting is only based on clustering, assigning a clone as nested if its constituent LCMs are a subset of LCMs in the parental clone. Details given in Supplementary Methods.
Right column: Representation of clones according to the physical coordinates of the LCM samples, overlaid onto H&E stained sections (top), with Masson’s trichrome and Oil Red-O sections also shown (bottom). Locations of immune/inflammatory cell infiltrates are marked with yellow rings. Sample sizes were for PD36713, n=30 microdissections; PD36714, n=35 microdissections; PD36715, n=26 microdissections; PD36717, n=42 microdissections; PD36718, n=32 microdissections.
Extended Data Figure 5. Phylogenetic reconstruction of hepatocyte clones in alcohol-related cirrhosis.
Analogous to Extended Figure 4, representing the cirrhotic livers of donors PD37105, PD37107, PD37110 and PD37111. The pictures in the right column are of H&E stains on the top, with Masson’s trichrome and a macroscopic photograph of the liver on the bottom, with HCCs indicated by arrows. Locations of immune/inflammatory cell infiltrates are marked with yellow rings. Sample sizes were for PD37105, n=31 microdissections; PD37107, n=41 microdissections; PD37110, n=22 microdissections; PD37111, n=39 microdissections.
Extended Data Figure 6. Phylogenetic reconstruction of hepatocyte clones in non-alcoholic fatty liver disease with cirrhosis.
Analogous to Extended Figure 4, representing the cirrhotic livers of donors PD37113, PD37114, PD37115, PD37116 and PD37118. The pictures in the right column are of H&E stains on the top, with Masson’s trichrome and a macroscopic photograph of the liver on the bottom, with HCCs indicated by arrows. Locations of immune/inflammatory cell infiltrates are marked with yellow rings. Sample sizes were for PD37113, n=37 microdissections; PD37114, n=41 microdissections; PD37115, n=34 microdissections; PD37116, n=43 microdissections; PD37118, n=26 microdissections.
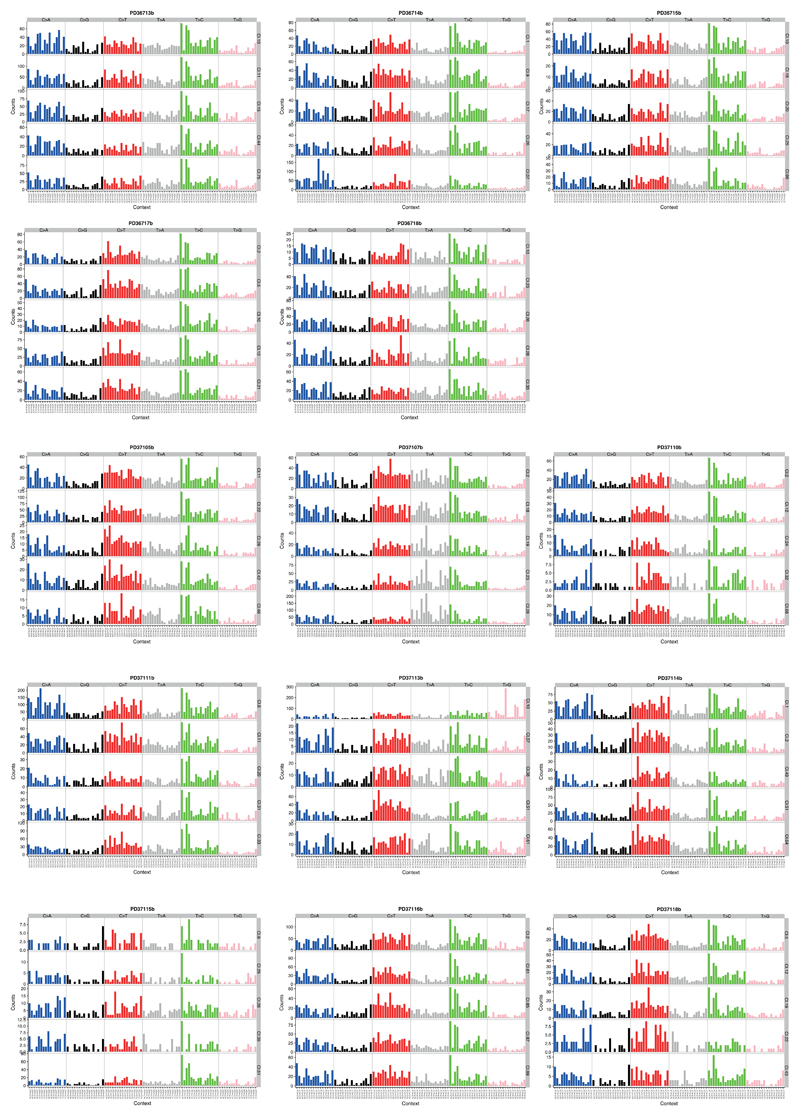
Extended Data Figure 7. Mutation spectrum of individual microdissections.
From each donor, we chose 5 clones to represented the heterogeneity in trinucleotide context mutation spectra. The six substitution types are shown in the panel across the top of each clone’s data. Within each panel, the contribution from the trinucleotide context (bases immediately 5’ and 3’ of the mutated base) are shown.
Extended Data Figure 8. Details of mutational signature extractions.
(A) Dot plots showing the concordance for signature attributions between the two signature algorithms (n=479 microdissections). Mutational signatures on the y axis were extracted using non-negative matrix factorisation and on the x axis using a Bayesian hierarchical Dirichlet process. Quoted R values are Pearson’s correlation coefficients.
(B) Signatures extracted by non-negative matrix factorisation. The six substitution types are shown in the panel across the top of each clone’s data. Within each panel, the contribution from the trinucleotide context (bases immediately 5’ and 3’ of the mutated base) are shown.
(C) Signatures extracted by the Bayesian hierarchical Dirichlet process, as for panel B. Where a signature matches one from panel B, it is shown on the same row.
Extended Data Figure 9. Transcription strand bias in mutational patterns.
(A) Transcription strand bias of T>C mutations at A[T]D context before and after transcription start sites of highly expressed liver genes.
(B) Bar plots representing the numbers of C>A variants on the transcribed and non-transcribed strand. Each hepatocyte clone is represented individually (x-axis). Note the strand bias in the highly mutated clones of PD37111, where the tobacco signature is most active – the strand bias indicates the damaged base is the guanine, as expected for polycyclic aromatic hydrocarbons.
(C) Bar plots representing the numbers of T>A variants on the transcribed and non-transcribed strand. Each hepatocyte clone is represented individually (x-axis). Note the strand bias in the highly mutated clones of PD37107, where the aristolochic acid signature is most active – the strand bias indicates the damaged base is the adenine, as expected for polycyclic aromatic hydrocarbons.
Extended Data Figure 10. Mutations in a B lymphocyte clone in a cirrhotic liver.
(A) Illustration of a portion of the B-cell receptor (IGH) region on chromosome 14. Shown are the coverage tracks of an LCM sample that does not belong to the lymphocyte lineage (top) and a sample that belongs to the lymphocyte lineage (middle). In the center of the displayed region there is a drop of copy number in the lymphocyte track, indicating a structural rearrangement. The bottom track shows the paired-end reads that contribute to a rearrangement event in the lymphocyte sample, co-localised with the drop in copy number.
(B) Application of the pigeonhole principle – if two clusters of heterozygous mutations in regions of diploid copy number are in different cells, then their median variant allele fractions must sum to ≤0.5 (if they sum to >0.5, equivalent to a combined cellular fraction of >1, there must be some cells that carry both sets of mutations – hence one cluster would have a subclonal relationship with the other). Cluster 10 is the cluster with the unique VDJ rearrangement of IGH shown in panel A and the large number of mutations attributed to signature 9. Clearly, samples from clusters 2, 11 and 55 etc have VAFs which, when combined with cluster 10, sum to >0.5. Therefore, they must be subclonal to cluster 10, even though they do show signature 9.
(C-H) Representative pairwise decision graphs for clusters of mutations. Median cellular fraction is shown for pairs of clusters across every sample from the patient. Where at least one sample falls above / to the right of the x+y=1 diagonal line, those two clusters must share a nested clonal-subclonal relationship.
Supplementary Material
Acknowledgements
This work was supported by a the Wellcome Trust and a Cancer Research UK Grand Challenge Award [C98/A24032]. PJC is a Wellcome Trust Senior Clinical Fellow (WT088340MA). SFB was supported by the Swiss National Science Foundation (P2SKP3-171753 and P400PB-180790). MAS is supported by a Rubicon fellowship from NWO (019.153LW.038). The Cambridge Human Research Tissue Bank is supported by the NIHR Cambridge Biomedical Research Centre. MH is supported by a CRUK Clinician Scientist Fellowship (C52489/A19924).
Footnotes
Data Availability
Whole genome sequencing data in the form of BAM files across samples reported in this study have been deposited in the European Genome-Phenome Archive (https://www.ebi.ac.uk/ega/home) with accession number EGAD00001004578. Substitution and indel calls have been deposited on Mendeley Data (‘Somatic mutations and clonal dynamics in healthy and cirrhotic human liver’: http://dx.doi.org/10.17632/ktx7jp8sch.1).
Code Availability
Single-nucleotide substitutions were called using the CaVEMan (cancer variants through expectation maximization) algorithm, version 1.11.2 (https://github.com/cancerit/CaVEMan). Small insertions and deletions were called using the Pindel algorithm, version 2.2.2 (https://github.com/genome/pindel). Rearrangements were called using the BRASS (breakpoint via assembly) algorithm version 5.4.1 (https://github.com/cancerit/BRASS). Miscellaneous scripts for downstream analysis are available on Github (https://github.com/sfbrunner/liver-pub-repo). Mutational signatures analysis performed using the HDP hierarchical Dirichlet Process package version 0.1.5, available on Github (https://github.com/nicolaroberts/hdp).
Author Contributions
P.J.C., M.H. and S.F.B. designed the experiments. S.F.B. performed the laser-capture microdissection, data curation and statistical analysis, with L.A.W., M.A.S., F.A. and I.M. providing assistance and advice. M.H., S.J.A. and S.E.D. collated and analysed the clinical and histological data from the patients. N.D.R. developed the hierarchical Dirichlet process for extracting mutational signatures. L.M. and P.E. developed the laser-capture microdissection, DNA extraction and library production protocol used. C.A. and Y.H. assisted with sample preparation, processing and tracking. P.J.C., I.M. and M.R.S. oversaw the analysis of mutational signatures and selection analyses. P.J.C., M.H. and S.F.B. wrote the manuscript, with contributions from all authors.
Competing Interests
The authors declare no competing interests.
References
- 1.The Cancer Genome Atlas Research Network. Comprehensive and Integrative Genomic Characterization of Hepatocellular Carcinoma. Cell. 2017;169:1327–1341. doi: 10.1016/j.cell.2017.05.046. [DOI] [PMC free article] [PubMed] [Google Scholar]
- 2.Schulze K, et al. Exome sequencing of hepatocellular carcinomas identifies new mutational signatures and potential therapeutic targets. Nat Genet. 2015;47:505–511. doi: 10.1038/ng.3252. [DOI] [PMC free article] [PubMed] [Google Scholar]
- 3.Totoki Y, et al. Trans-ancestry mutational landscape of hepatocellular carcinoma genomes. Nat Genet. 2014;46:1267–73. doi: 10.1038/ng.3126. [DOI] [PubMed] [Google Scholar]
- 4.Fujimoto A, et al. Whole-genome sequencing of liver cancers identifies etiological influences on mutation patterns and recurrent mutations in chromatin regulators. Nat Genet. 2012;44:760–4. doi: 10.1038/ng.2291. [DOI] [PubMed] [Google Scholar]
- 5.Letouzé E, et al. Mutational signatures reveal the dynamic interplay of risk factors and cellular processes during liver tumorigenesis. Nat Commun. 2017;8 doi: 10.1038/s41467-017-01358-x. [DOI] [PMC free article] [PubMed] [Google Scholar]
- 6.Kan Z, et al. Whole-genome sequencing identifies recurrent mutations in hepatocellular carcinoma. Genome Res. 2013;23:1422–1433. doi: 10.1101/gr.154492.113. [DOI] [PMC free article] [PubMed] [Google Scholar]
- 7.Guichard C, et al. Integrated analysis of somatic mutations and focal copy-number changes identifies key genes and pathways in hepatocellular carcinoma. Nat Genet. 2012;44:694–8. doi: 10.1038/ng.2256. [DOI] [PMC free article] [PubMed] [Google Scholar]
- 8.Blokzijl F, et al. Tissue-specific mutation accumulation in human adult stem cells during life. Nature. 2016;538:260–264. doi: 10.1038/nature19768. [DOI] [PMC free article] [PubMed] [Google Scholar]
- 9.Lodato MA, et al. Aging and neurodegeneration are associated with increased mutations in single human neurons. Science (80-.) 2017;559:1–8. doi: 10.1126/science.aao4426. [DOI] [PMC free article] [PubMed] [Google Scholar]
- 10.Lee-Six H, et al. Population dynamics of normal human blood inferred from somatic mutations. Nature. 2018;561:473–478. doi: 10.1038/s41586-018-0497-0. [DOI] [PMC free article] [PubMed] [Google Scholar]
- 11.Martincorena I, et al. High burden and pervasive positive selection of somatic mutations in normal human skin. Science (80-.) 2015;348:880–886. doi: 10.1126/science.aaa6806. [DOI] [PMC free article] [PubMed] [Google Scholar]
- 12.Fellous TG, et al. Locating the stem cell niche and tracing hepatocyte lineages in human liver. Hepatology. 2009;49:1655–63. doi: 10.1002/hep.22791. [DOI] [PubMed] [Google Scholar]
- 13.Sigal SH, et al. Partial hepatectomy-induced polyploidy attenuates hepatocyte replication and activates cell aging events. Am J Physiol. 1999;276:G1260–72. doi: 10.1152/ajpgi.1999.276.5.G1260. [DOI] [PubMed] [Google Scholar]
- 14.Stephens PJ, et al. Massive genomic rearrangement acquired in a single catastrophic event during cancer development. Cell. 2011;144:27–40. doi: 10.1016/j.cell.2010.11.055. [DOI] [PMC free article] [PubMed] [Google Scholar]
- 15.Fernandez-Banet J, et al. Decoding complex patterns of genomic rearrangement in hepatocellular carcinoma. Genomics. 2014;103:189–203. doi: 10.1016/j.ygeno.2014.01.003. [DOI] [PubMed] [Google Scholar]
- 16.Imielinski M, Guo G, Meyerson M. Insertions and Deletions Target Lineage-Defining Genes in Human Cancers. Cell. 2017;168:460–472.e14. doi: 10.1016/j.cell.2016.12.025. [DOI] [PMC free article] [PubMed] [Google Scholar]
- 17.Martincorena I, et al. Universal Patterns of Selection in Cancer and Somatic Tissues. Cell. 2017;171:1029–1041. doi: 10.1016/j.cell.2017.09.042. [DOI] [PMC free article] [PubMed] [Google Scholar]
- 18.Torrecilla S, et al. Trunk mutational events present minimal intra- and inter-tumoral heterogeneity in hepatocellular carcinoma. J Hepatol. 2017;67:1222–1231. doi: 10.1016/j.jhep.2017.08.013. [DOI] [PubMed] [Google Scholar]
- 19.Nik-Zainal S, et al. The life history of 21 breast cancers. Cell. 2012;149:994–1007. doi: 10.1016/j.cell.2012.04.023. [DOI] [PMC free article] [PubMed] [Google Scholar]
- 20.Alexandrov LB, et al. Signatures of mutational processes in human cancer. Nature. 2013;500:415–421. doi: 10.1038/nature12477. [DOI] [PMC free article] [PubMed] [Google Scholar]
- 21.Osorio FG, et al. Somatic Mutations Reveal Lineage Relationships and Age-Related Mutagenesis in Human Hematopoiesis. Cell Rep. 2018;25:2308–2316.e4. doi: 10.1016/j.celrep.2018.11.014. [DOI] [PMC free article] [PubMed] [Google Scholar]
- 22.Haradhvala NJ, et al. Mutational Strand Asymmetries in Cancer Genomes Reveal Mechanisms of DNA Damage and Repair. Cell. 2016;164:538–549. doi: 10.1016/j.cell.2015.12.050. [DOI] [PMC free article] [PubMed] [Google Scholar]
- 23.Poon SL, et al. Genome-wide mutational signatures of aristolochic acid and its application as a screening tool. Sci Transl Med. 2013;5:197ra101. doi: 10.1126/scitranslmed.3006086. [DOI] [PubMed] [Google Scholar]
- 24.Scelo G, et al. Variation in genomic landscape of clear cell renal cell carcinoma across Europe. Nat Commun. 2014;5:5135. doi: 10.1038/ncomms6135. [DOI] [PubMed] [Google Scholar]
- 25.Rushing BR, Selim MI. Aflatoxin B1: A review on metabolism, toxicity, occurrence in food, occupational exposure, and detoxification methods. Food Chem Toxicol. 2018;124:81–100. doi: 10.1016/j.fct.2018.11.047. [DOI] [PubMed] [Google Scholar]
- 26.Martincorena I, et al. Somatic mutant clones colonize the human esophagus with age. Science (80-.) 2018;917:911–917. doi: 10.1126/science.aau3879. [DOI] [PMC free article] [PubMed] [Google Scholar]
- 27.Yokoyama A, et al. Age-related remodelling of oesophageal epithelia by mutated cancer drivers. Nature. 2019;1 doi: 10.1038/s41586-018-0811-x. [DOI] [PubMed] [Google Scholar]
- 28.Nault JC, et al. Telomerase reverse transcriptase promoter mutation is an early somatic genetic alteration in the transformation of premalignant nodules in hepatocellular carcinoma on cirrhosis. Hepatology. 2014;60:1983–92. doi: 10.1002/hep.27372. [DOI] [PubMed] [Google Scholar]
- 29.Kim SK, et al. Comprehensive analysis of genetic aberrations linked to tumorigenesis in regenerative nodules of liver cirrhosis. J Gastroenterol. 2019 doi: 10.1007/s00535-019-01555-z. [DOI] [PubMed] [Google Scholar]
- 30.Zhu M, et al. Somatic Mutations Increase Hepatic Clonal Fitness and Regeneration in Chronic Liver Disease. Cell. 2019:1–14. doi: 10.1016/j.cell.2019.03.026. [DOI] [PMC free article] [PubMed] [Google Scholar]
- 31.Kleiner DE, et al. Design and validation of a histological scoring system for nonalcoholic fatty liver disease. Hepatology. 2005;41:1313–1321. doi: 10.1002/hep.20701. [DOI] [PubMed] [Google Scholar]
- 32.Lee-Six H, et al. The landscape of somatic mutation in normal colorectal epithelial cells. bioRxiv. 2018 doi: 10.1101/416800. 416800. [DOI] [PubMed] [Google Scholar]
- 33.Jones D, et al. Current Protocols in Bioinformatics. John Wiley & Sons, Inc; 2016. cgpCaVEManWrapper: Simple Execution of CaVEMan in Order to Detect Somatic Single Nucleotide Variants in NGS Data; pp. 15.10.1–15.10.18. 2016. [DOI] [PMC free article] [PubMed] [Google Scholar]
- 34.Menzies A, et al. VAGrENT: Variation Annotation Generator. Curr Protoc Bioinformatics. 2015;52:15.8.1–15.8.11. doi: 10.1002/0471250953.bi1508s52. [DOI] [PMC free article] [PubMed] [Google Scholar]
- 35.Dahl DB. An improved merge-split sampler for conjugate Dirichlet process mixture models. Univ Wisconsin-Madison Tech Rep. 2003;1086:1–32. [Google Scholar]
- 36.Papastamoulis P. label.switching: An R Package for Dealing with the Label Switching Problem in MCMC Outputs. J Stat Softw. 2015;69 Code Snippet 1. [Google Scholar]
- 37.Fujimoto A, et al. Whole-genome mutational landscape of liver cancers displaying biliary phenotype reveals hepatitis impact and molecular diversity. Nat Commun. 2015;6:1–8. doi: 10.1038/ncomms7120. [DOI] [PubMed] [Google Scholar]
- 38.Cleary SP, et al. Identification of driver genes in hepatocellular carcinoma by exome sequencing. Hepatology. 2013;58:1693–702. doi: 10.1002/hep.26540. [DOI] [PMC free article] [PubMed] [Google Scholar]
- 39.Ahn S-M, et al. Genomic portrait of resectable hepatocellular carcinomas: implications of RB1 and FGF19 aberrations for patient stratification. Hepatology. 2014;60:1972–82. doi: 10.1002/hep.27198. [DOI] [PubMed] [Google Scholar]
- 40.Raine KM, et al. cgpPindel: Identifying Somatically Acquired Insertion and Deletion Events from Paired End Sequencing. Curr Protoc Bioinformatics. 2015;52:15.7.1–15.7.12. doi: 10.1002/0471250953.bi1507s52. [DOI] [PMC free article] [PubMed] [Google Scholar]
- 41.Raine KM, et al. Current Protocols in Bioinformatics. John Wiley & Sons, Inc; 2016. ascatNgs: Identifying Somatically Acquired Copy-Number Alterations from Whole-Genome Sequencing Data; pp. 15.9.1–15.9.17. 2016. [DOI] [PMC free article] [PubMed] [Google Scholar]
- 42.Campbell PJ, et al. Identification of somatically acquired rearrangements in cancer using genome-wide massively parallel paired-end sequencing. Nat Genet. 2008;40:722–9. doi: 10.1038/ng.128. [DOI] [PMC free article] [PubMed] [Google Scholar]
- 43.Alexandrov L, et al. The Repertoire of Mutational Signatures in Human Cancer. bioRxiv. 2018 doi: 10.1101/322859. 322859. [DOI] [Google Scholar]
- 44.Alexandrov LB, Nik-Zainal S, Wedge DC, Campbell PJ, Stratton MR. Deciphering Signatures of Mutational Processes Operative in Human Cancer. Cell Rep. 2013;3:246–259. doi: 10.1016/j.celrep.2012.12.008. [DOI] [PMC free article] [PubMed] [Google Scholar]
- 45.Durinck S, Spellman PT, Birney E, Huber W. Mapping identifiers for the integration of genomic datasets with the R/Bioconductor package biomaRt. Nat Protoc. 2009;4:1184–91. doi: 10.1038/nprot.2009.97. [DOI] [PMC free article] [PubMed] [Google Scholar]
- 46.GTEx Consortium. Genetic effects on gene expression across human tissues. Nature. 2017;550:204–213. doi: 10.1038/nature24277. [DOI] [PMC free article] [PubMed] [Google Scholar]
- 47.Blokzijl F, Janssen R, van Boxtel R, Cuppen E. MutationalPatterns: comprehensive genome-wide analysis of mutational processes. Genome Med. 2018;10:33. doi: 10.1186/s13073-018-0539-0. [DOI] [PMC free article] [PubMed] [Google Scholar]
Associated Data
This section collects any data citations, data availability statements, or supplementary materials included in this article.


