Abstract
Understanding cell transport and adhesion dynamics under flow is important for many biotransport problems. We investigated the influence of cell size, ligand coating density, micropost size, and intercellular collisions on circulating tumor cell adhesion and transport in microfluidic devices. The cells were modeled as coarse-grained cell membranes and the adhesion was modeled as pairwise interacting potentials, while the fluid was solved using the lattice Boltzmann method. The coupling between the cell and the fluid was achieved through the immersed boundary method. The cell showed transient rolling adhesion in high shear regions and firm adhesion in low shear regions. The adhesive force for rolling cells on a micropost was increasing before the cell reached the crest of the post and then decreasing afterward. The adhesive strength for cells increases with ligand coating density. Cell trajectories in a microfluidic device with a shifted post design were studied as well. At low concentrations, the majority of the cells follow streamlines closely. However, the intercellular collision and collision from red blood cells impacted the cell trajectories. An norm of was defined to characterize the difference between the cell trajectories and the associated streamlines. It was shown that increases with micropost sizes and cell concentrations.
I. INTRODUCTION
Cancer cells detached from the primary tumor and entering in the circulation system are named circulating tumor cells (CTCs), which can lead to metastasis that accounts for 90% of the deaths in cancer patients.1–3 Thus, detecting CTCs at an earlier stage is important for diagnostics. However, detecting CTCs is very challenging, as CTCs are rare, e.g., there are only a few CTCs in a 1 ml blood sample that contains billions of blood cells. One of the promising CTC detection techniques is to use microfluidic devices where blood samples with CTCs can be loaded and detected successfully. Based on the actuation mechanism, these microfluidic devices can be grouped into two categories: active ones and passive ones. Active microfluidic devices used external assistance such as magnetic field,4–6 electric field,7,8 optical forces,9,10 and acoustic fields11,12 to enrich CTCs. Among these methods, they either require sophisticated cell preparations, complex microfluidic designs, or external fields. On the other hand, passive devices utilize the hydrodynamics and physical properties of CTCs such as size, deformability, and specific binding between receptors expressed on cell membrane and ligands coated on microfluidic surfaces to separate CTCs from other cells.13–18 In general, many microposts were fabricated on these passive microfluidic devices to bend the streamlines in order to increase the contact frequencies between CTCs and microposts. Passive microfluidic devices are also label free and easy for fabrication and operation.19
One important performance indicator for microfluidic devices is the CTC capture efficiency (), defined as the percentage of the captured cells over the total CTCs. Many factors influence the capture efficiency, such as pressure gradient (), micropost size (), shape, gap between microposts (), CTC size (), fluid viscosity (), ligand coating density (), ligand receptor adhesive strength(]), and cell membrane deformability (e.g., shear modulus ). CTCs with a larger size and abundant expression of adhesive molecules showed strong metastasis.20–22 The receptor density on the cancer cell surface is related to the subtypes of cancers.23–25 Different micropost sizes, separation distances, and layouts have been proposed to separate CTCs from blood samples. Recently, microfluidic devices with a hyperuniform spatial design showed potential in capture and differentiation of subpopulations in CTCs.26 Meanwhile, theoretical analysis and numerical simulations were performed to improve the design of the devices: e.g., numerical simulations were performed to minimize the biosensor response time for a vascular microfluidic device under different physiological shear rates.27 A unified theoretical framework was proposed to infer the trajectories of particles in the whole device on the basis of trajectories in the unit cell.28 The effect of post shift distance and deformability of blood cells on cell trajectories were also studied,29 showing that it is possible to separate cells through label-free methods. In Ref. 30 it was shown that cells can be separated based on their deformability through a combined diffuser and semicylindrical obstacle design. Collision rates for rare cell capture in periodic obstacle arrays were found to strongly depend on the density of cell suspensions and micropost radius.31,32 Recent work from Ref. 33 also demonstrated the capability of using holographic screening to enumerate CTCs in a label-free and high-throughput fashion.
Despite these efforts, the complex transport and adhesion phenomena of CTCs in blood cell suspensions is currently not fully understood, e.g., what is the adhesive behavior for cells in flow on the microposts considering the difference in sizes and adhesive molecule density? How do RBCs influence the CTC trajectories? In the current work, several numerical CTC detection simulations were performed to evaluate the binding behavior of CTCs under the influence of different cell sizes and coating densities. The adhesive forces and adhesion locations were characterized. Meanwhile, the cellular trajectories in a microfluidic device with the shifted design considering different micropost sizes, intercellular collisions, and blood cell collisions were studied. The numerical results were also compared with microfluidic experiments. The paper is organized as follows. Section II gives a brief description on the numerical methods. The details of the convergence study and experimental methods are provided in the supplementary material. Next, results of cell adhesion and trajectories under the influence of different cell sizes, ligand densities, microfluidic designs, and cell collisions are presented in Sec. III. The conclusion and future work are given in the end.
II. METHODS
Modeling the CTC transport in microfluidics at the cellular resolution is a challenging task. First, it is a multiphysics problem, as the cell deformation will influence the flow and the flow will deform the cell as well. Second, the cell membrane mechanics are nonlinear and the cells will undergo large deformation. Finally, the simulation is computationally expensive as thousands of surface nodes will be needed to resolve a CTC deformation in detail, and high performance computing is necessary as hundreds of blood cells will be modeled. Previously, our group has successfully developed a massively parallel fluid solid coupling simulation software to address these challenges.34 Specifically, the fluid flow with complex geometry was solved by the lattice Boltzmann method (LBM), chosen because of its efficient parallel performance,35,36 the ability to model flows with complex geometries,37–40 and multiphase and compressible flows.41–43 In the lattice Boltzmann method, the evolution of discretized density distribution along the direction of microscale discretized velocity is as follows:
| (1) |
where and are spatial and time variables, is the discretized velocity vector, is the equilibrium distribution, is the dimensionless relaxation parameter, and is the term used for external forces. The equilibrium distribution is given by
| (2) |
where are the weight coefficients and is the speed of sound. The density and velocity can be calculated as
| (3) |
where is the external force density vector (force per volume) that is related to as
| (4) |
See Ref. 44 for more details on force terms. The external force includes the fluid solid interaction forces which will be discussed later in cell models. A D3Q19 lattice structure was used to solve the fluid flow.
Both blood cells and cancer cells were modeled as a thin membrane using a coarse-grained molecular dynamics method, where membrane stretching and bending were considered.39,45–48 The potential energy for a cell membrane is given by
| (5) |
where the stretching energy is used to represent the cytoskeleton’s resistance to deformation. The bending energy represents the rigidity of the membrane bilayer imparted to the cytoskeleton. The last two terms are the constraints for maintaining a constant membrane surface area and cell volume. The stretching potential is given by
| (6) |
where is the maximum bond length and the th bond length ratio is . was set to be 2 times the equilibrium bond length. is the number of springs, is the persistence length, is the Boltzmann constant, is the temperature, and is the repulsive potential constant. Once is specified, can be found using the value of at the equilibrium, where the net force is zero. The parameters used in the coarse-grained membrane model can be related to membrane properties used in the continuum model,47,49 e.g., the shear modulus, , which is given by
| (7) |
where and is the bond length at equilibrium. Equation (7) holds assuming that the membrane surface area is preserved during simulation, thus the contribution from can be safely ignored. Interested readers can refer to Refs. 47 and 49 for details.
The bending energy is defined as
| (8) |
where is the bending constant and is the instantaneous angle formed by the two outward surface norms of two adjacent triangular meshes that share the same edge . is the corresponding equilibrium angle.
Constraints for constant membrane surface area and cell volume are imposed through area/volume dependent harmonic potentials,
| (9) |
| (10) |
where and are the global and local area constraint constants, is the number of triangular surfaces, and are the instantaneous and spontaneous total surface area of the cell membrane, respectively are the instantaneous and spontaneous surface area for the th triangle surface, respectively, is the volume constraint constant, and and are the instantaneous and the equilibrium cell volume, respectively.
The two way coupling between the fluid and cell was modeled by the immersed boundary method (IBM). IBM has been widely used for studying blood flow in the heart,50,51 cell separation in microfluidic flows,29,52 and esophageal transport.53 In IBM, an Euler grid was used for fluid flow and a Lagrangian mesh was used to model the cell deformation. The nonslip boundary conditions and stress balance over the interface were imposed through an interpolation function. Specifically, for an immersed solid with position , the velocity is interpolated from the local fluid velocity , while the solid force, , calculated from Eq. (5) is spread out into the local fluid grid points as a force density used in Eq. (4),
| (11) |
| (12) |
where is the delta function. In a typical numerical implementation in three dimensions, is constructed as the product of one-dimensional functions, i.e., with defined as
| (13) |
where is the distance between solid particles and fluid nodes. Different choices of the interpolation function influence the coupling accuracy, the influence range of the solid particles on the fluid, and the computational cost.54,55 More details on IBM can be found in Refs. 56–58.
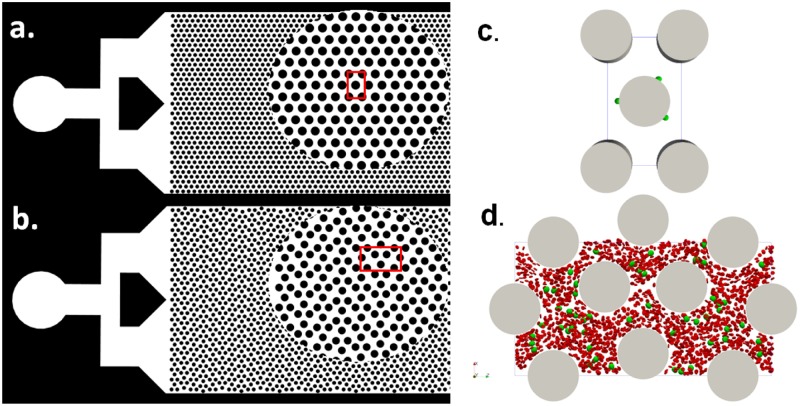
The computational model was verified extensively with our previous publications including ellipsoid periodic rotation under shear flow, RBC stretch testing, effective blood viscosity in small tubes,34 and cancer cell translocation through a micropore.48 The details of the implementation of the model and algorithm can be found in Ref. 34. One limitation of the current model is that the cytoplasm viscosity and blood plasma viscosity was treated the same, which is different from the fact the cytoplasm is about 5 times more viscous than the blood plasma. It is possible but nontrivial to track the internal and external fluid nodes through sophisticated algorithms,59–63 which will be deferred as future work. In the present work, two different types of numerical simulations were performed. First, cell adhesion in flow on a single micropost was characterized in a simple geometry, as cell adhesion happens between the cell-wall interface, which is a small scale physics. The simple geometry was created based on the widely used microfluidic design with a diameter of 50 as shown in Fig. 1(a). Second, cell trajectories in a microfluidic device with the shifted design were studied considering the microcylinders’ sizes and collisions from blood cells. A relatively larger fluid domain was required to study the effect of micropost layout on cell trajectories. The shifted design consists of microcylinders with equal diameters but with a shifted 50 distance every 3 columns of microcylinders in the vertical direction, see Fig. 1(b). Because of the periodicity of the devices, only a representative unit was created in the simulation for each device, as shown in Figs. 1(c) and 1(d), respectively.
FIG. 1.
Two designs of the microfluidics for cancer cell detection. (a) A regular design of microcylinders with their circular centers forming equilateral triangles. (b) A shifted design of microcylinders. The circular view shows the zoom in view. The red boxes show a representative unit for each device. (c) A representative unit of the microfluidic device with the regular design for the cell adhesion study. (d) A representative unit of the microfluidic device with the shifted design for the collective cell trajectory study. Blood cells are shown in red, and cancer cells are shown in green.
PC-3 cell (a prostate cancer) is a typical CTC cell line that overexpresses EpCAM antigen on its surface and has been widely used for CTC research. Anti-EpCAM antibodies were coated on the micropost surface to study the cell adhesion and transport in microfluidics. For the capture of other types of CTC cell line such as SKBR3, anti-HER2 antibody can be used. Young’s modulus of PC-3 is ,64 which can be related to Young’s modulus for a 2D membrane model by multiplying the thickness of the membrane (about 10 nm).65 The Poisson ratio of an isotropic triangular mesh is ,66 thus, the shear modulus , which is used to set the elasticity of the membrane. The bending stiffness is set to be 35 , where is the Boltzmann constant and is the room temperature (300 K). The mechanical parameters for red blood cells can be found from Ref. 34.
The adhesion between cells and microposts was modeled using a Morse potential,
| (14) |
where is the energy scale, controls the width of the potential, is the distance between particles on the cell membrane and the particles on the micropost surface, is the equilibrium distance, and is the cutoff distance. The rolling-adhesive binding force for a CTC cell with EpCAM and anti-EpCAM interaction was reported to be 4.5 pN.67 Considering there are thousands of interactive pairs on the cell membrane, the force magnitude would be estimated on the order of femtonewtons. In our simulation, the maximum attractive force based on the Morse potential at the cut off distance was set as 3.3 fN, which is consistent with the experimental data. It should be pointed out that a different set of parameters should be tuned for another type of CTCs or ligand receptor pairs.
For cell adhesion studies, a finer mesh with 10 242 nodes was used in order to resolve the lubrication flow between the cell membrane and the micropost surface. For cell trajectory studies, a coarse mesh with 2562 nodes per cell was used, because only the center of mass information was needed. Convergence results showed that 2562 surface nodes can capture the cell deformation with a reasonable accuracy, as shown in the supplementary material. The parameters used for the simulation were verified in our previous publications34,48,68 and are listed in Table I.
TABLE I.
Simulation parameters used for the cancer cell adhesion and transport in microfluidic devices.
| Adhesion dynamics | Trajectory studies | Comments | |
|---|---|---|---|
| Fluid | |||
| Δx | 4 × 10⁻⁷ m | 5 × 10⁻⁷ m | Lattice size |
| Δt | 2.67 × 10⁻⁸ s | 4.16 × 10⁻⁸ s | Time step |
| Δm | 6.4 × 10⁻¹⁷ kg | 1.25 × 10⁻¹⁶ kg | Mass |
| τ | 1 | 1 | Relaxation parameter |
| Cancer cells | |||
| Nodes | 10 242 | 2562 | |
| μ0 | 5 μN/m | 5 μN/m | Shear modulus |
| kBT/p | 0.157 pN | 0.314 pN | Stretching constant |
| kb/kBT | 35 | 35 | Bending stiffness |
| Red blood cells | |||
| Nodes | 642 | ||
| μ0 | 6 μN/m | Shear modulus | |
| kBT/p | 1.43 pN | Stretching constant | |
| kb/kBT | 56 | Bending stiffness | |
| Morse potential | |||
| D0 | 3 × 10⁻²⁰ J | 3 × 10⁻²⁰ J | Interaction energy |
| β | 0.1 | 0.1 | |
| r0 | 4 × 10⁻⁷ m | 4 × 10⁻⁷ m | Equilibrium distance |
| rc | 2 × 10⁻⁶ m | 2 × 10⁻⁶ m | Cutoff distance |
III. RESULTS AND DISCUSSIONS
A. Cell adhesion locations on a micropost
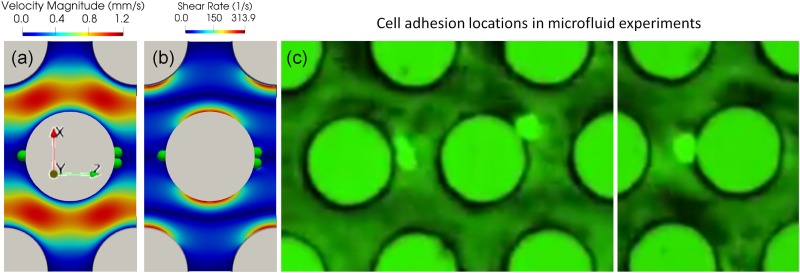
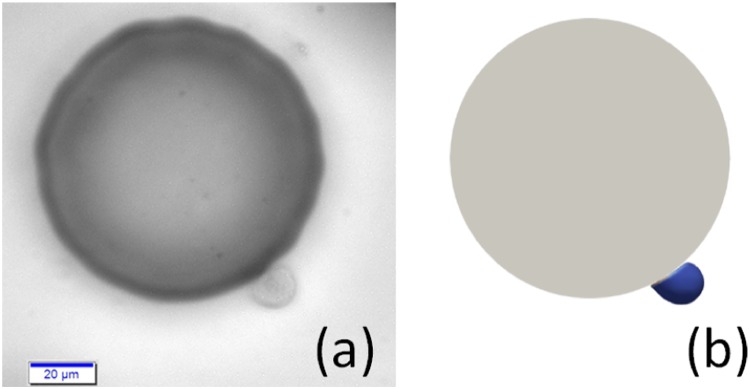
A characteristic unit of the regular microfluidic device was created, and 3 cells were initiated on the midplane in the y direction in the vicinity of the micropost. The fluid domain size the in x, y, and z directions was . The cell diameter was 12 discretized into 10 242 nodes. A body force of (in dimensionless LB units, the converted physical acceleration was =7.54 ) in the positive z direction was applied to drive the fluid flow, resulting in a fluid with Reynold’s number defined using the cell diameter and the maximum fluid velocity. The fluid lattice size is 0.4 with a relaxation parameter of such that the viscosity is . Nonslip boundary conditions were applied on the micropost walls and walls in the y direction. Periodic boundary conditions were applied on both x and z directions. Particles on the cell membrane will interact with these walls once the cell is within the influencing range of the Morse potential, as shown in Table I. The fluid flow within the unit is shown in Fig. 2(a). Cancer cells showed preferred adhesion locations on the surface of posts. The cells tend to settle down on the micropost surface where the shear stress is low, as indicated in the blue region in Fig. 2(b). These preferred adhesion sites correspond to the front and rear stagnant points of the flow. Simulation results showed that the front stagnant adhesion is not stable due to the divergent flow field, whereas the rear stagnant point is more stable because of the convergent flow field. Microfluidic experimental results performed under the same order of shear rates also confirmed that the cells prefer adhering to those low shear stress regions, see Fig. 2(c). Figure 2(b) also shows the varying shear rate on the cylinder surface, which will induce a transient rolling adhesion for cells. A cell rolling on the microposts was also captured in microfluidic experiments, see Fig. 3(a). The cell deformation profile agreed very well with numerical simulations, see Fig. 3(b). The transient rolling adhesion on the high shear rate and firm adhesion in the low shear rate is consistent with the conclusion shown in the cell adhesion state diagram69 and a recent theoretical analysis paper.70
FIG. 2.
Cells showed preferred adhesive locations on the micropost surface where the shear stress is low. The fluid flow field (a) and shear rate distribution (b) in the simulation with a regular design. (c) Cancer cell adhesion on the microfluidic device with the regular design.
FIG. 3.
Snapshots of cell rolling on a micropost: (a) experiments, (b) simulation. The scale bar indicates 20 .
B. Cell size and ligand coating density on cell adhesion on a micropost
Cancer cell size is not uniform. Previous research showed that large CTC cells correlated significantly with the prognosis of cancer.20 To understand the size effect on cell adhesion, three different cell diameters were considered here: 8 , 12 , and 16 , respectively. The ligand density was assumed to be the same among all the cells. Other parameters were kept the same as Sec. III A. All the cells showed similar deformation profile in the flow, as shown in Fig. 4(a). The contact areas with the micropost were calculated as [56.5, 116.4, 225.9] when cells reached the crest of the cylinder where the shear rate was the highest. It showed that the adhesive contact area was proportional to the square of the cell diameter. The adhesive force for the whole cell was calculated based on Eq. (14) by the summation of all the adhesive forces on the contact nodes and was shown in Fig. 4(b). The adhesive forces increase as the cells roll to the crest of the cylinder, about [0.0132, 0.0285, 0.0432] pN, and then decrease as the cells roll down to the other side of the cylinder, about [0.0080, 0.0115, 0.0152] pN for [8, 12, 16] cells, respectively. Because of the low Reynold’s number (), the inertial effect was ignored, and the adhesive force on the whole cell would be balanced with the drag force. Thus, the cells experienced much larger drag forces at the crest of the cylinder and much lower drag on the stagnant point on the rear side of the cylinder. This conclusion is also consistent with the shear rate distribution shown in Fig. 2(b). The normalized adhesive contact area and drag force for different cell sizes was shown in Fig. 4(c). A line of slope of 2 was shown as well for comparison. It showed that, for the same type of cells (e.g., same membrane shear modulus) and the same flow conditions, both the drag force and adhesive force were proportional to the square of cell sizes. Because of the lower drag force for smaller cells, their residence time during rolling on micropost was longer than bigger cells, e.g., the time required for a 8 cell to reach the crest of the micropost from the front stagnation point was 0.0054 s, while the time required for 16 cells was about 0.0025 s. The long residence time for smaller cells also favors the adhesive bond formation. Thus, softer and smaller cells have advantages of forming strong adhesion after initiating the contact with the micropost surfaces.
FIG. 4.
(a) Cell profile with different diameters when cells experienced largest shear stress at the crest of the micropost. (b) The cell adhesive force on the microprost from initial contact (upwind stagnant point), rolling, and forming firm adhesion on the other side (downwind stagnant point) of the micropost. The left inset shows the position where the cell experiences the largest drag. The right inset shows the cell position with firm adhesion. (c) The comparison of contact area and drag force for cells with different sizes under flow. A line of slope 2 is shown for reference.
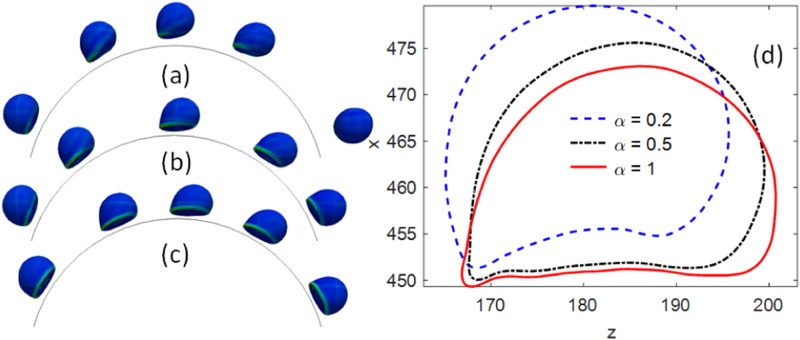
The ligand density on the cancer cell surface is related to the subtypes of cancers. For example, as cancer cells undergoing epithelial–mesenchymal transition (EMT), cells will lose the expression of EpCAM and express more mesenchymal markers. As shown in recent studies, the microfluidic device was developed to track the dynamics of CTC phenotypes using nanoparticle-mediated magnetic ranking to mimic the strength of the antigen-antibody interaction.23–25 The different adhesive strength was modeled by changing the ligand density on the wall surfaces. Three different normalized ligand densities were coated on the cylinder, where corresponds to about 6 adhesion sites per square micrometer. When the coating density was low, , the contact area and adhesive strength were smaller, which was not enough to establish a firm adhesion. Thus, the cell was detached from the micropost under flow, see Fig. 5(a). However, as the coating density increased to and 1, both cells can develop firm adhesion on the microposts, as shown in Figs. 5(b) and 5(c). The cell profiles are also shown in Fig. 5(d) when the cells were experiencing the largest shear stress in flow near the microposts. It was shown that the contact area changes with the ligand coating density as well.
FIG. 5.
Cancer cell adhesion on microposts with three different coating densities . The sequence of cell rolling and adhesion on the micropost with coating density (a) , (b) , (c) . (d) The cell profile when it was past the crest of the micropost boundary and experienced the largest shear stress.
C. Micropost size and cell volume fraction effect on cancer cell trajectories in a shifted microfluidic device
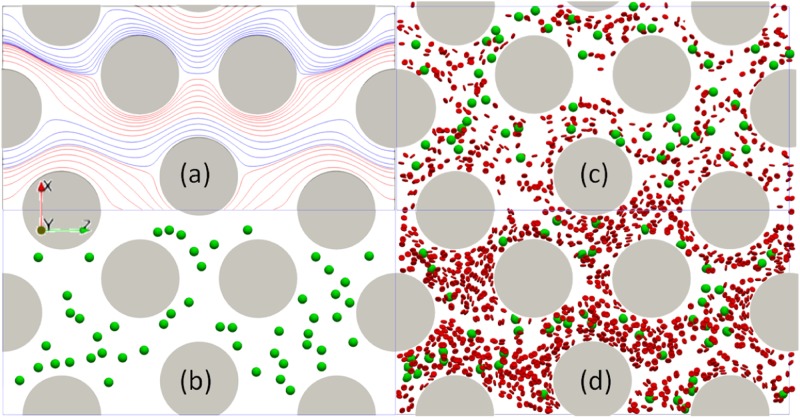
A cell has to initiate a contact with the micropost before it can establish a firm adhesion. The contact opportunities highly depend on the cell trajectory. Thus, the cell trajectory in the microfluidic device with the shifted design was investigated. The domain size of the simulation unit was in the x, y, and z directions, as shown in Fig. 6(a). The mesh size was 0.5 . 50 cancer cells with a diameter of 12 were randomly positioned in microfluidic devices. A dimensionless body force of and periodic boundary conditions in x and z directions were applied. The Reynold’s number . Other parameters are shown in the second column in Table I. The effects of micropost diameter and cell volume fraction (volume ratio of both blood cells and cancer cells to the whole volume of blood sample) on cell trajectories were characterized. Three different cylinder radii [45, 50, 55] and two different cell volume fractions (5% and 10%) were considered separately in the simulation. The simulation domain and some snapshots are shown in Fig. 6. Streamlines were used to characterize the flow field. However, because of the cells, the streamlines were unsteady. Thus, only the streamlines for the steady state fluid without considering any cells are shown in Fig. 6(a). It shows the laminar flow pattern in the device can be divided into different layers where the streamlines within each layer were colored by red and blue alternatively.
FIG. 6.
Steady state streamlines and simulation snapshots for the shifted design with a simulation domain size of in x, y, z directions. The diameter of microposts shown here is 50 . (a) The streamlines at the steady state without any cells in the shifted microfluidic device. Simulation snapshots for three different cases: (b) Only 50 cancer cells without any blood cells. (c) Mixture of cancer cells and blood cells with a volume fraction of 5%. (d) Mixture of cancer cells and blood cells with a volume fraction of 10%. The cancer cells are shown in green, and the blood cells are shown in red.
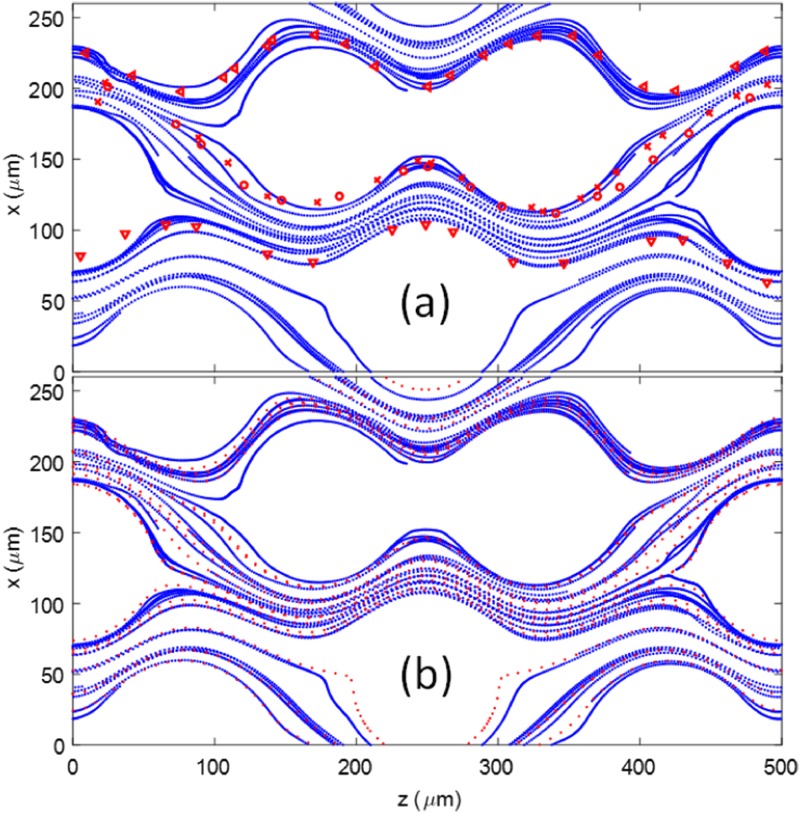
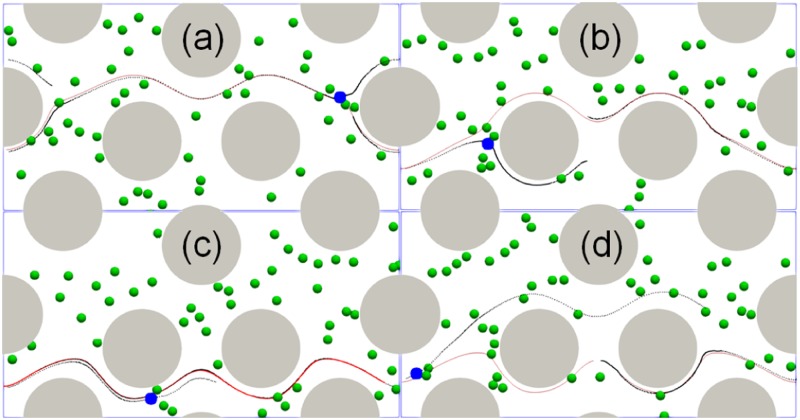
The center of mass of the cells in the microfluidic device with a radius of 50 for the cylinder were recorded and plotted in Fig. 7(a). The same cell position was also analyzed based on the particle tracking technique for the microfluidic experimental images and plotted as different markers in Fig. 7(a) as a comparison. It showed that numerical cell trajectories were very similar to experimental data. The cell trajectory resembles the streamlines of the flow. Thus, the cell trajectories were also compared with the streamlines of the flow at steady state without considering any cells, see Fig. 7(b). The streamlines were seeded based on the initial positions of the cells. The cell trajectories followed closely with the steady state streamlines in the microfluidic device. As expected, when the cell size was smaller than the gap between microposts and the cell concentration was low, the influence of cell deformation on fluid flow was negligible. Thus, most of the cells stayed within the same layer where they started, as shown by the separated layers formed by red and blue lines in Fig. 6(a). However, the intercellular collision did impact the trajectory of the cells. The collision led to further deviations from the initial streamlines. In particular, when the cell position was close to the separation boundary between the two layers, the cell motion may migrate from one layer to another layer of the flow, depending on which side the collision came from. Figure 8 shows four representative cases where the cell trajectory was changed from one layer to another due to the collision from neighboring cells. The position of the target cell (color in blue) and other flowing cells (color in green) at the moment of the collision were shown in Fig. 8, where the red solid line was the streamline based on the initial position of the target cell and the dark dotted line was the actual path line of the cell. Depending on the relative collision direction, the target cell may bounce upward [Figs. 8(a) and 8(d)] or downward [Figs. 8(b) and 8(c)].
FIG. 7.
(a) Comparison of the cell trajectories between simulation (blue lines) and experiments (various red markers). (b) Comparison of the cell trajectories from simulation (blue lines) to the steady state streamlines (red doted lines) from the microfluidic device without considering cells.
FIG. 8.
The influence of intercellular collision on cell trajectories. Four representative cell trajectories [(a)–(d)] were plotted in the figure as dark dotted lines, while the streamlines were plotted in red solid lines. The snapshot was taken when the collision occurred between the target cell (blue) and its neighbor cells.
To quantify the difference between the cell trajectory and the corresponding streamline, a normalized norm is used to quantify the deviation from the streamline,
| (15) |
where is the drifting difference between the cell trajectory and the streamline in the direction which is perpendicular to the flow direction in , which characterizes the deviation induced by cell deformation, intercellular collision, and the effect from cylinder size and layout. The normalized histogram of for all the cancer cells for different micropost sizes are shown in Fig. 9. The drift distances for 50 cancer cells, reported in a mean standard deviation, were for microfluidic devices with a cylindrical radius of [45, 50, 55] , respectively. The distribution of shifted toward higher values when the cylinder diameter increased, as shown Figs. 9(a)–9(c). The increase of mainly comes from the size effect of cylinders, e.g., when a cell is migrated from one layer to another layer, the distance is increased, which is clearly indicated by the discrepancy between streamline and cell trajectory in Fig. 8.
FIG. 9.
The histogram for for 50 cancer cells in microfluidics with different radii of the microposts. (a) , (b) , (c) .
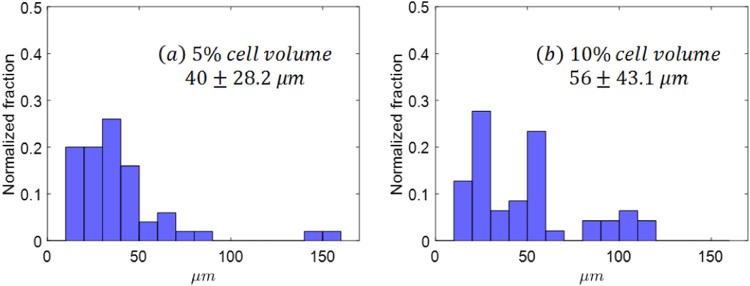
To study the collision effect of red blood cells (RBCs) on cancer cell trajectories, two different numbers of RBCs were added to simulations for microfluidics with a cylindrical radius of 50 : one simulation with 459 RBCs, another one with 1736 RBCs, see Figs. 6(c) and 6(d). Together with 50 cancer cells, the total cell volume fractions were about 5% and 10%, respectively. When RBCs were introduced, the cancer cell showed enhanced drift displacement. The average drift distance was increased from without RBCs to for 5% cell volume fraction to for 10% cell volume fraction, as shown in Fig. 10. Without RBCs, the collision between cancer cells contributed to the drifting distance , as shown in Fig. 8. When RBCs were added, cancer cells not only collided with other cancer cells but also RBCs; thus, the drifting distances increased further. Previous results71–74 for deformable particles flowing in straight channels suggested that the enhanced diffusivity () of particles under shear follows where is the local volume fraction of the particles, is the shear rate, is the particle radius, is a coefficient that depends on the Capillary number. Our results clearly showed that the cell drift is increased with cell concentration.
FIG. 10.
The histogram for for 50 cancer cells in microfluidics with different cell volume fractions. (a) 5% cell volume fraction, (b) 10% cell volume fraction.
D. Cell adhesion distribution in a shifted microfluidic device
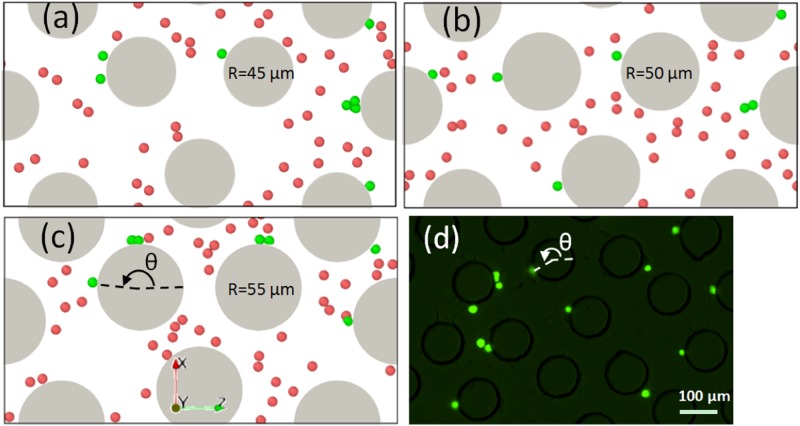
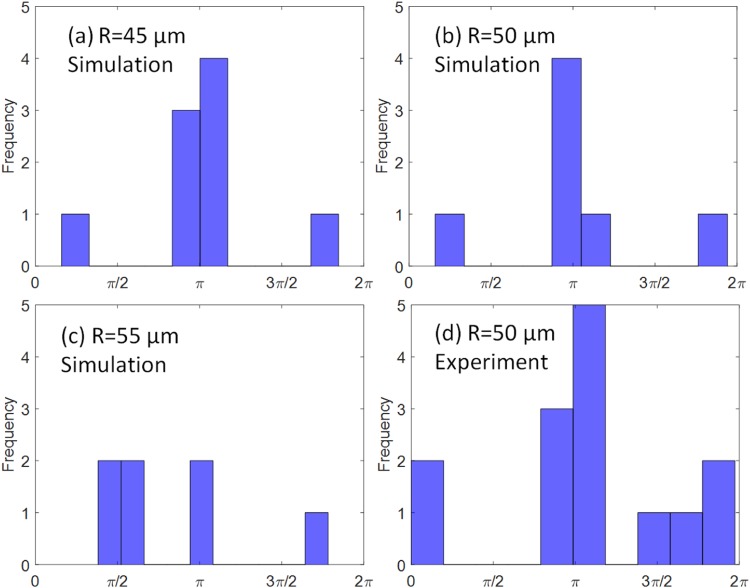
Cell adhesion is influenced by the random collisions between cells and the micropost surface. The spatial distribution of adhered cells on the micropost from simulations with three different radii is shown in Figs. 11(a)–11(c). The adhesion distribution in experiments for 50 microposts is also shown in Fig. 11(d), where the green dots indicate the adhered PC-3 cells. To quantify the cell adhesion sites on the micropost surface, an azimuthal angle measured counterclockwise from the flow direction (along the positive z direction) to the cell adhesion location was analyzed and plotted, as shown in Fig. 12. The angles from both the simulation data and experimental data were measured by ImageJ software.75 Statistical results showed that the most frequent angles were around radians or , which is exactly the front stagnant point on the micropost. The percentage of angles around were [77.8%, 71.4%, 28.6%] for a radius of , respectively. The angles obtained from experiments also showed the same pattern, with about 57.1% of the angles close to . The adhesion pattern is also consistent with the results from the regular design shown in Sec. III A.
FIG. 11.
The distribution of adhered cells on microposts from simulations for different radii (a) , (b) , (c) , and from microfluidic experiments with (d). The adhered cells are colored in green, while the free flowing cells are colored in red. The direction of the flow is along the positive z axis.
FIG. 12.
The distribution of the azimuthal angles that characterize the location of the adhesion. (a) , (b) , (c) , and (d) microfluidic experiments with .
IV. CONCLUSIONS
This paper used a coupled fluid solid interaction model to study cancer cell transport and adhesion in microfluidic devices. The cell size and ligand density effect on cell adhesion on cylinder surfaces were characterized. The cells showed transient rolling adhesion in the high shear region and preferred firm adhesion in the low shear region. The adhesive force for rolling cells increased before the cell reached the crest of the cylinder and then decreased afterward. The adhesive strength with cells increased with coating density. The cell trajectories were also studied in the microfluidic device with a shifted design. At low concentrations, the majority of the cells follow streamlines closely. However, the intercellular collision and collision from RBCs will impact some of the cell trajectories. An norm of was defined to characterize the difference between the cell trajectories and the steady state streamlines generated with the initial cell position. It showed that increases with cylinder sizes and cell concentrations. In the future, the cancer cell capture efficiency at high cell concentrations, nonuniform postlayout, and posts with different shapes will be investigated.
SUPPLEMENTARY MATERIAL
See the supplementary material for the convergence study of the numerical methods and experimental methods.
ACKNOWLEDGMENTS
J.T. acknowledges funding support from the Research and Artistry Grant from Northern Illinois University (NIU), high performance computing support from Gaea at NIU and Mira at Argonne National Laboratory. W.L. acknowledges funding support from the Cancer Prevention & Research Institute of Texas (CPRIT) under Grant No. RP170817.
There are no conflicts to declare.
Contributor Information
Jifu Tan, Email: .
Wei Li, Email: .
REFERENCES
- 1.Gupta G. P. and Massagué J., “Cancer metastasis: Building a framework,” Cell 127(4), 679–695 (2006). 10.1016/j.cell.2006.11.001 [DOI] [PubMed] [Google Scholar]
- 2.Wirtz D., Konstantopoulos K., and Searson P. C., “The physics of cancer: The role of physical interactions and mechanical forces in metastasis,” Nat. Rev. Cancer 11(7), 512–522 (2011). 10.1038/nrc3080 [DOI] [PMC free article] [PubMed] [Google Scholar]
- 3.Chaffer C. L. and Weinberg R. A., “A perspective on cancer cell metastasis,” Science 331(6024), 1559–1564 (2011). 10.1126/science.1203543 [DOI] [PubMed] [Google Scholar]
- 4.Shi W., Wang S., Maarouf A., Uhl C. G., He R., Yunus D., and Liu Y., “Magnetic particles assisted capture and release of rare circulating tumor cells using wavy-herringbone structured microfluidic devices,” Lab Chip 17(19), 3291–3299 (2017). 10.1039/C7LC00333A [DOI] [PubMed] [Google Scholar]
- 5.Chen P., Huang Y.-Y., Hoshino K., and Zhang J. X. J., “Microscale magnetic field modulation for enhanced capture and distribution of rare circulating tumor cells,” Sci. Rep. 5, 8745 (2015). 10.1038/srep08745 [DOI] [PMC free article] [PubMed] [Google Scholar]
- 6.Hoshino K., Huang Y.-Y., Lane N., Huebschman M., Uhr J. W., Frenkel E. P., and Zhang X., “Microchip-based immunomagnetic detection of circulating tumor cells,” Lab Chip 11(20), 3449–3457 (2011). 10.1039/c1lc20270g [DOI] [PMC free article] [PubMed] [Google Scholar]
- 7.Sun M., Xu J., Shamul J. G., Lu X., Husain S., and He X., “Creating a capture zone in microfluidic flow greatly enhances the throughput and efficiency of cancer detection,” Biomaterials 197, 161–170 (2019). 10.1016/j.biomaterials.2019.01.014 [DOI] [PMC free article] [PubMed] [Google Scholar]
- 8.Gascoyne P. R. C., Noshari J., Anderson T. J., and Becker F. F., “Isolation of rare cells from cell mixtures by dielectrophoresis,” Electrophoresis 30(8), 1388–1398 (2009). 10.1002/elps.200800373 [DOI] [PMC free article] [PubMed] [Google Scholar]
- 9.Wang M. M., Tu E., Raymond D. E., Yang J. M., Zhang H., Hagen N., Dees B., Mercer E. M., Forster A. H., Kariv I. et al., “Microfluidic sorting of mammalian cells by optical force switching,” Nat. Biotechnol. 23(1), 83–87 (2005). 10.1038/nbt1050 [DOI] [PubMed] [Google Scholar]
- 10.Chiu T.-K., Chao A.-C., Chou W.-P., Liao C.-J., Wang H.-M., Chang J.-H., Chen P.-H., and Wu M.-H., “Optically-induced-dielectrophoresis (ODEP)-based cell manipulation in a microfluidic system for high-purity isolation of integral circulating tumor cell (CTC) clusters based on their size characteristics,” Sens. Actuators B Chem. 258, 1161–1173 (2018). 10.1016/j.snb.2017.12.003 [DOI] [Google Scholar]
- 11.Shi J., Huang H., Stratton Z., Huang Y., and Huang T. J., “Continuous particle separation in a microfluidic channel via standing surface acoustic waves (SSAW),” Lab Chip 9(23), 3354–3359 (2009). 10.1039/b915113c [DOI] [PubMed] [Google Scholar]
- 12.Li P., Mao Z., Peng Z., Zhou L., Chen Y., Huang P.-H., Truica C. I., Drabick J. J., El-Deiry W. S., Dao M. et al., “Acoustic separation of circulating tumor cells,” Proc. Natl. Acad. Sci. U.S.A. 112(16), 4970–4975 (2015). 10.1073/pnas.1504484112 [DOI] [PMC free article] [PubMed] [Google Scholar]
- 13.Gleghorn J. P., Pratt E. D., Denning D., Liu H., Bander N. H., Tagawa S. T., Nanus D. M., Giannakakou P. A., and Kirby B. J., “Capture of circulating tumor cells from whole blood of prostate cancer patients using geometrically enhanced differential immunocapture (GEDI) and a prostate-specific antibody,” Lab Chip 10(1), 27–29 (2010). 10.1039/B917959C [DOI] [PMC free article] [PubMed] [Google Scholar]
- 14.Wan Y., Liu Y., Allen P. B., Asghar W., Iftakher Mahmood M. A., Tan J., Duhon H., Kim Y.-T., Ellington A. D., and Iqbal S. M., “Capture, isolation and release of cancer cells with aptamer-functionalized glass bead array,” Lab Chip 12(22), 4693–4701 (2012). 10.1039/c2lc21251j [DOI] [PMC free article] [PubMed] [Google Scholar]
- 15.Wan Y., Tan J., Asghar W., Kim Y.-T., Liu Y., and Iqbal S. M., “Velocity effect on aptamer-based circulating tumor cell isolation in microfluidic devices,” J. Phys. Chem. B 115(47), 13891–13896 (2011). 10.1021/jp205511m [DOI] [PubMed] [Google Scholar]
- 16.Preira P., Grandne V., Forel J.-M., Gabriele S., Camara M., and Theodoly O., “Passive circulating cell sorting by deformability using a microfluidic gradual filter,” Lab Chip 13(1), 161–170 (2013). 10.1039/C2LC40847C [DOI] [PubMed] [Google Scholar]
- 17.Sarioglu A. F., Aceto N., Kojic N., Donaldson M. C., Zeinali M., Hamza B., Engstrom A., Zhu H., Sundaresan T. K., Miyamoto D. T. et al., “A microfluidic device for label-free, physical capture of circulating tumor cell clusters,” Nat. Methods 12(7), 685–691 (2015). 10.1038/nmeth.3404 [DOI] [PMC free article] [PubMed] [Google Scholar]
- 18.Yu D., Tang L., Dong Z., Loftis K. A., Ding Z., Cheng J., Qin B., Yan J., and Li W., “Effective reduction of non-specific binding of blood cells in a microfluidic chip for isolation of rare cancer cells,” Biomater. Sci. 6(11), 2871–2880 (2018). 10.1039/C8BM00864G [DOI] [PubMed] [Google Scholar]
- 19.Gossett D. R., Weaver W. M., Mach A. J., Hur S. C., Tse H. T. K., Lee W., Amini H., and Carlo D. D., “Label-free cell separation and sorting in microfluidic systems,” Anal. Bioanal. Chem. 397(8), 3249–3267 (2010). 10.1007/s00216-010-3721-9 [DOI] [PMC free article] [PubMed] [Google Scholar]
- 20.Ito H., Yamaguchi N., Onimaru M., Kimura S., Ohmori T., Ishikawa F., Sato J., Ito S., and Inoue H., “Change in number and size of circulating tumor cells with high telomerase activity during treatment of patients with gastric cancer,” Oncol. Lett. 12(6), 4720–4726 (2016). 10.3892/ol.2016.5239 [DOI] [PMC free article] [PubMed] [Google Scholar]
- 21.Roland C. L., Harken A. H., Sarr M. G., and Barnett, Jr. C. C., “ICAM-1 expression determines malignant potential of cancer,” Surgery 141(6), 705–707 (2007). 10.1016/j.surg.2007.01.016 [DOI] [PubMed] [Google Scholar]
- 22.Chung I., Reichelt M., Shao L., Akita R. W., Koeppen H., Rangell L., Schaefer G., Mellman I., and Sliwkowski M. X., “High cell-surface density of HER2 deforms cell membranes,” Nat. Commun. 7, 12742 (2016). 10.1038/ncomms12742 [DOI] [PMC free article] [PubMed] [Google Scholar]
- 23.Baccelli I., Schneeweiss A., Riethdorf S., Stenzinger A., Schillert A., Vogel V., Klein C., Saini M., Bäuerle T., Wallwiener M. et al., “Identification of a population of blood circulating tumor cells from breast cancer patients that initiates metastasis in a xenograft assay,” Nat. Biotechnol. 31(6), 539 (2013). 10.1038/nbt.2576 [DOI] [PubMed] [Google Scholar]
- 24.Mohamadi R. M., Besant J. D., Mepham A., Green B., Mahmoudian L., Gibbs T., Ivanov I., Malvea A., Stojcic J., Allan A. L. et al., “Nanoparticle-mediated binning and profiling of heterogeneous circulating tumor cell subpopulations,” Angew. Chem. Int. Ed. 54(1), 139–143 (2015). 10.1002/anie.201409376 [DOI] [PubMed] [Google Scholar]
- 25.Labib M., Green B., Mohamadi R. M., Mepham A., Ahmed S. U., Mahmoudian L., Chang I.-H., Sargent E. H., and Kelley S. O., “Aptamer and antisense-mediated two-dimensional isolation of specific cancer cell subpopulations,” J. Am. Chem. Soc. 138(8), 2476–2479 (2016). 10.1021/jacs.5b10939 [DOI] [PubMed] [Google Scholar]
- 26.Ding Z., Zheng Y., Xu Y., Jiao Y., and Li W., “Hyperuniform flow fields resulting from hyperuniform configurations of circular disks,” Phys. Rev. E 98(6), 063101 (2018). 10.1103/PhysRevE.98.063101 [DOI] [Google Scholar]
- 27.Wong J. F., Young E. W. K., and Simmons C. A., “Computational analysis of integrated biosensing and shear flow in a microfluidic vascular model,” AIP Adv. 7(11), 115116 (2017). 10.1063/1.5006655 [DOI] [Google Scholar]
- 28.Kim S.-C., Wunsch B. H., Hu H., Smith J. T., Austin R. H., and Stolovitzky G., “Broken flow symmetry explains the dynamics of small particles in deterministic lateral displacement arrays,” Proc. Natl Acad. Sci. U.S.A. 114(26), E5034–E5041 (2017). 10.1073/pnas.1706645114 [DOI] [PMC free article] [PubMed] [Google Scholar]
- 29.Krüger T., Holmes D., and Coveney P. V., “Deformability-based red blood cell separation in deterministic lateral displacement devices—A simulation study,” Biomicrofluidics 8(5), 054114 (2014). 10.1063/1.4897913 [DOI] [PMC free article] [PubMed] [Google Scholar]
- 30.Zhu L., Rorai C., Mitra D., and Brandt L., “A microfluidic device to sort capsules by deformability: A numerical study,” Soft Matter 10(39), 7705–7711 (2014). 10.1039/C4SM01097C [DOI] [PubMed] [Google Scholar]
- 31.Cimrák I., “Collision rates for rare cell capture in periodic obstacle arrays strongly depend on density of cell suspension,” Comput. Methods Biomech. Biomed. Eng. 19(14), 1525–1530 (2016). 10.1080/10255842.2016.1165806 [DOI] [PubMed] [Google Scholar]
- 32.Bušík M., Jančigová I., Tóthová R., and Cimrák I., “Simulation study of rare cell trajectories and capture rate in periodic obstacle arrays,” J. Comput. Sci. 17, 370–376 (2016). 10.1016/j.jocs.2016.04.009 [DOI] [Google Scholar]
- 33.Singh D. K., Ahrens C. C., Li W., and Vanapalli S. A., “Label-free, high-throughput holographic screening and enumeration of tumor cells in blood,” Lab Chip 17(17), 2920–2932 (2017). 10.1039/C7LC00149E [DOI] [PubMed] [Google Scholar]
- 34.Tan J., Sinno T. R., and Diamond S. L., “A parallel fluid–solid coupling model using LAMMPS and Palabos based on the immersed boundary method,” J. Comput. Sci. 25, 89–100 (2018). 10.1016/j.jocs.2018.02.006 [DOI] [PMC free article] [PubMed] [Google Scholar]
- 35.Peng L., Nomura K.-I., Oyakawa T., Kalia R. K., Nakano A., and Vashishta P., “Parallel lattice Boltzmann flow simulation on emerging multi-core platforms,” in European Conference on Parallel Processing (Springer, 2008), pp. 763–777.
- 36.Clausen J. R., Reasor D. A., and Aidun C. K., “Parallel performance of a lattice-Boltzmann/finite element cellular blood flow solver on the IBM blue gene/P architecture,” Comput. Phys. Commun. 181(6), 1013–1020 (2010). 10.1016/j.cpc.2010.02.005 [DOI] [Google Scholar]
- 37.Boek E. S. and Venturoli M., “Lattice-Boltzmann studies of fluid flow in porous media with realistic rock geometries,” Comput. Math. Appl. 59(7), 2305–2314 (2010). 10.1016/j.camwa.2009.08.063 [DOI] [Google Scholar]
- 38.Spaid M. A. A. and Phelan, Jr. F. R., “Lattice Boltzmann methods for modeling microscale flow in fibrous porous media,” Phys. Fluids 9(9), 2468–2474 (1997). 10.1063/1.869392 [DOI] [Google Scholar]
- 39.Yu X., Tan J., and Diamond S. L., “Hemodynamic force triggers rapid NETosis within sterile thrombotic occlusions,” J. Thromb. Haemost. 16(2), 316–329 (2018). 10.1111/jth.13907 [DOI] [PMC free article] [PubMed] [Google Scholar]
- 40.Voronov R., Van Gordon S., Sikavitsas V. I., and Papavassiliou D. V., “Computational modeling of flow-induced shear stresses within 3d salt-leached porous scaffolds imaged via micro-CT,” J. Biomech. 43(7), 1279–1286 (2010). 10.1016/j.jbiomech.2010.01.007 [DOI] [PubMed] [Google Scholar]
- 41.He X., Chen S., and Zhang R., “A lattice Boltzmann scheme for incompressible multiphase flow and its application in simulation of Rayleigh–Taylor instability,” J. Comput. Phys. 152(2), 642–663 (1999). 10.1006/jcph.1999.6257 [DOI] [Google Scholar]
- 42.Shan X. and Chen H., “Lattice Boltzmann model for simulating flows with multiple phases and components,” Phys. Rev. E 47(3), 1815 (1993). 10.1103/PhysRevE.47.1815 [DOI] [PubMed] [Google Scholar]
- 43.Wang Y., He Y. L., Zhao T. S., Tang G. H., and Tao W. Q., “Implicit-explicit finite-difference lattice Boltzmann method for compressible flows,” Int. J. Mod. Phys. C 18(12), 1961–1983 (2007). 10.1142/S0129183107011868 [DOI] [Google Scholar]
- 44.Guo Z., Zheng C., and Shi B., “Discrete lattice effects on the forcing term in the lattice Boltzmann method,” Phys. Rev. E 65(4), 046308 (2002). 10.1103/PhysRevE.65.046308 [DOI] [PubMed] [Google Scholar]
- 45.Pivkin I. V. and Karniadakis G. E., “Accurate coarse-grained modeling of red blood cells,” Phys. Rev. Lett. 101(11), 118105 (2008). 10.1103/PhysRevLett.101.118105 [DOI] [PubMed] [Google Scholar]
- 46.Reasor D. A., Clausen J. R., and Aidun C. K., “Coupling the lattice-Boltzmann and spectrin-link methods for the direct numerical simulation of cellular blood flow,” Int. J. Numer. Methods Fluids 68(6), 767–781 (2012). 10.1002/fld.2534 [DOI] [Google Scholar]
- 47.Dao M., Li J., and Suresh S., “Molecularly based analysis of deformation of spectrin network and human erythrocyte,” Mater. Sci. Eng. C 26(8), 1232–1244 (2006). 10.1016/j.msec.2005.08.020 [DOI] [Google Scholar]
- 48.Tan J., Sohrabi S., He R., and Liu Y., “Numerical simulation of cell squeezing through a micropore by the immersed boundary method,” Proc. Inst. Mech. Eng. Part C J. Mech. Eng. Sci. 232(3), 502–514 (2018). 10.1177/0954406217730850 [DOI] [PMC free article] [PubMed] [Google Scholar]
- 49.Fedosov D. A., Caswell B., and Karniadakis G. E., “A multiscale red blood cell model with accurate mechanics, rheology, and dynamics,” Biophys. J. 98(10), 2215–2225 (2010). 10.1016/j.bpj.2010.02.002 [DOI] [PMC free article] [PubMed] [Google Scholar]
- 50.Griffith B. E., “Immersed boundary model of aortic heart valve dynamics with physiological driving and loading conditions,” Int. J. Numer. Methods Biomed. Eng. 28(3), 317–345 (2012). 10.1002/cnm.1445 [DOI] [PubMed] [Google Scholar]
- 51.Hsu M.-C. and Kamensky D., “Immersogeometric analysis of bioprosthetic heart valves, using the dynamic augmented Lagrangian method,” in Frontiers in Computational Fluid-Structure Interaction and Flow Simulation (Springer, 2018), pp. 167–212.
- 52.Rossinelli D., Tang Y.-H., Lykov K., Alexeev D., Bernaschi M., Hadjidoukas P., Bisson M., Joubert W., Conti C., Karniadakis G. et al., “The in-silico lab-on-a-chip: Petascale and high-throughput simulations of microfluidics at cell resolution,” in Proceedings of the International Conference for High Performance Computing, Networking, Storage and Analysis (ACM, 2015), p. 2.
- 53.Kou W., Bhalla A. P. S., Griffith B. E., Pandolfino J. E., Kahrilas P. J., and Patankar N. A., “A fully resolved active musculo-mechanical model for esophageal transport,” J. Comput. Phys. 298, 446–465 (2015). 10.1016/j.jcp.2015.05.049 [DOI] [PMC free article] [PubMed] [Google Scholar]
- 54.Liu Y. and Mori Y., “Properties of discrete delta functions and local convergence of the immersed boundary method,” SIAM J. Numer. Anal. 50(6), 2986–3015 (2012). 10.1137/110836699 [DOI] [Google Scholar]
- 55.Yang X., Zhang X., Li Z., and He G.-W., “A smoothing technique for discrete delta functions with application to immersed boundary method in moving boundary simulations,” J. Comput. Phys. 228(20), 7821–7836 (2009). 10.1016/j.jcp.2009.07.023 [DOI] [Google Scholar]
- 56.Peskin C. S., “The immersed boundary method,” Acta Numerica 11, 479–517 (2002). 10.1017/S0962492902000077 [DOI] [Google Scholar]
- 57.Mittal R. and Iaccarino G., “Immersed boundary methods,” Annu. Rev. Fluid Mech. 37, 239–261 (2005). 10.1146/annurev.fluid.37.061903.175743 [DOI] [Google Scholar]
- 58.Feng Z.-G. and Michaelides E. E., “The immersed boundary-lattice Boltzmann method for solving fluid–particles interaction problems,” J. Comput. Phys. 195(2), 602–628 (2004). 10.1016/j.jcp.2003.10.013 [DOI] [Google Scholar]
- 59.de Haan M., Zavodszky G., Azizi V., and Hoekstra A., “Numerical investigation of the effects of red blood cell cytoplasmic viscosity contrasts on single cell and bulk transport behaviour,” Appl. Sci. 8(9), 1616 (2018). 10.3390/app8091616 [DOI] [Google Scholar]
- 60.Frijters S., Krüger T., and Harting J., “Parallelised Hoshen–Kopelman algorithm for lattice-Boltzmann simulations,” Comput. Phys. Commun. 189, 92–98 (2015). 10.1016/j.cpc.2014.12.014 [DOI] [Google Scholar]
- 61.Doddi S. K. and Bagchi P., “Lateral migration of a capsule in a plane Poiseuille flow in a channel,” Int. J. Multiphase Flow 34(10), 966–986 (2008). 10.1016/j.ijmultiphaseflow.2008.03.002 [DOI] [Google Scholar]
- 62.Reasor, Jr. D. A., Mehrabadi M., Ku D. N., and Aidun C. K., “Determination of critical parameters in platelet margination,” Ann. Biomed. Eng. 41(2), 238–249 (2013). 10.1007/s10439-012-0648-7 [DOI] [PubMed] [Google Scholar]
- 63.Freund J. B. and Orescanin M. M., “Cellular flow in a small blood vessel,” J. Fluid Mech. 671, 466–490 (2011). 10.1017/S0022112010005835 [DOI] [Google Scholar]
- 64.Faria E. C., Ma N., Gazi E., Gardner P., Brown M., Clarke N. W., and Snook R. D., “Measurement of elastic properties of prostate cancer cells using AFM,” Analyst 133(11), 1498–1500 (2008). 10.1039/b803355b [DOI] [PubMed] [Google Scholar]
- 65.Skalak R., Tozeren A., Zarda R. P., and Chien S., “Strain energy function of red blood cell membranes,” Biophys. J. 13(3), 245–264 (1973). 10.1016/S0006-3495(73)85983-1 [DOI] [PMC free article] [PubMed] [Google Scholar]
- 66.Omori T., Ishikawa T., Barthès-Biesel D., Salsac A.-V., Walter J, Imai Y, and Yamaguchi T, “Comparison between spring network models and continuum constitutive laws: Application to the large deformation of a capsule in shear flow,” Phys. Rev. E 83(4), 041918 (2011). 10.1103/PhysRevE.83.041918 [DOI] [PubMed] [Google Scholar]
- 67.Cheung L. S.-L., Zheng X., Wang L., Baygents J. C., Guzman R., Schroeder J. A., Heimark R. L., and Zohar Y., “Adhesion dynamics of circulating tumor cells under shear flow in a bio-functionalized microchannel,” J. Micromech. Microeng. 21(5), 054033 (2011). 10.1088/0960-1317/21/5/054033 [DOI] [Google Scholar]
- 68.Yu X., Tan J., and Diamond S. L., “Hemodynamic force triggers rapid NETosis within sterile thrombotic occlusions,” J. Thromb. Haemost. 16(2), 316–329 (2018). 10.1111/jth.13907 [DOI] [PMC free article] [PubMed] [Google Scholar]
- 69.Chang K.-C., Tees D. F. J., and Hammer D. A., “The state diagram for cell adhesion under flow: Leukocyte rolling and firm adhesion,” Proc. Natl. Acad. Sci. U.S.A. 97(21), 11262–11267 (2000). 10.1073/pnas.200240897 [DOI] [PMC free article] [PubMed] [Google Scholar]
- 70.Li L., Tang H., Wang J., Lin J., and Yao H., “Rolling adhesion of cell in shear flow: A theoretical model,” J. Mech. Phys. Solids 119, 369–381 (2018). 10.1016/j.jmps.2018.07.013 [DOI] [Google Scholar]
- 71.Hudson S. D., “Wall migration and shear-induced diffusion of fluid droplets in emulsions,” Phys. Fluids 15(5), 1106–1113 (2003). 10.1063/1.1560617 [DOI] [Google Scholar]
- 72.Breedveld V., Van Den Ende D., Bosscher M., Jongschaap R. J. J., and Mellema J., “Measurement of the full shear-induced self-diffusion tensor of noncolloidal suspensions,” J. Chem. Phys. 116(23), 10529–10535 (2002). 10.1063/1.1478770 [DOI] [Google Scholar]
- 73.Loewenberg M. and Hinch E. J., “Collision of two deformable drops in shear flow,” J. Fluid. Mech. 338, 299–315 (1997). 10.1017/S0022112097005016 [DOI] [Google Scholar]
- 74.Pranay P., Henríquez-Rivera R. G., and Graham M. D., “Depletion layer formation in suspensions of elastic capsules in Newtonian and viscoelastic fluids,” Phys. Fluids 24(6), 061902 (2012). 10.1063/1.4726058 [DOI] [Google Scholar]
- 75.Schneider C. A., Rasband W. S., and Eliceiri K. W., “NIH image to ImageJ: 25 years of image analysis,” Nat. Methods 9(7), 671 (2012). 10.1038/nmeth.2089 [DOI] [PMC free article] [PubMed] [Google Scholar]
Associated Data
This section collects any data citations, data availability statements, or supplementary materials included in this article.
Supplementary Materials
See the supplementary material for the convergence study of the numerical methods and experimental methods.


