Summary
Background
Noninvasive quantitative assessment of dermal fibrosis remains a challenge. Optical coherence tomography (OCT) and high‐frequency ultrasound (HFUS) can accurately measure structural and physiological changes in skin.
Objectives
To perform quantitative analysis of cutaneous fibrosis.
Methods
Sixty‐two healthy volunteers underwent multiple sequential skin biopsies (day 0 and 1–8 weekly thereafter), with OCT and HFUS measurements at each time point supported with immunohistomorphometry analysis.
Results
HFUS and OCT provided quantitative measurements of skin thickness, which increased from uninjured skin (1·18 and 1·2 mm, respectively) to week 1 (1·28 mm, P = 0·01; 1·27 mm, P = 0·02), and compared favourably with haematoxylin and eosin. Spearman correlation showed good agreement between techniques (P < 0·001). HFUS intensity corresponded to dermal density, with reduction from uninjured skin (42%) to week 8 (29%) (P = 0·02). The OCT attenuation coefficient linked with collagen density and was reduced at week 8 (1·43 mm, P < 0·001). Herovici analysis showed that mature collagen levels were highest in uninjured skin (72%) compared with week 8 (42%, P = 0·04). Fibronectin was greatest at week 4 (0·72 AU) and reduced at week 8 (0·56 AU); and α‐smooth muscle actin increased from uninjured skin (11·5%) to week 8 (67%, P = 0·003).
Conclusions
Time‐matched comparison images between haematoxylin and eosin, OCT and HFUS demonstrated that epidermal and dermal structures were better distinguished by OCT. HFUS enabled deeper visualization of the dermis including the subcutaneous tissue. Choice of device was dependent on the depth of scar type, parameters to be measured and morphological detail required in order to provide better objective quantitative indices of the quality and extent of dermal fibrosis.
Short abstract
What's already known about this topic?
Objective studies of the progression of scar formation and the properties of mature scars are necessary in order to evaluate clinical treatment, and for research focused on developing novel methods for management of dermal fibrosis.
Optical coherence tomography (OCT) and high‐frequency ultrasound (HFUS) are two known noninvasive techniques that are used effectively for measuring structural and physiological changes in cutaneous tissue.
What does this study add?
OCT and HFUS are useful tools for noninvasive monitoring of cutaneous fibrosis, enabling quantitative sequential temporal measurements of cutaneous thickness similarly to histology.
OCT attenuation coefficient (better in resolution) and HFUS intensity (better in depth) provide an indication of collagen deposition in skin over the course of healing, supported by immunohistochemical analysis.
Choice of device is dependent upon wound and scar type, the parameters to be measured and the morphological detail required.
https://doi.org/10.1111/bjd.18394 available online
Cutaneous healing is a dynamic process during which there is a resolution of angiogenesis, wound contraction and tissue remodelling.1, 2 The skin healing process results in the formation of a scar, which can be defined as dermal fibrous tissue that replaces normal cutaneous tissue following injury.3 Scars often demonstrate a significantly reduced or total loss of several essential skin functions, including barrier function, mechanical and physical properties, and important physiological parameters.4 A multitude of scar treatment options are available, but despite this, none can totally erase a scar and many can result in an unsatisfactory or inconsistent outcome, with no single treatment method having been universally adopted.5 Therefore, in order to evaluate current clinical treatment modalities, as well as research focused on developing novel methods for scar management, objective quantitative methods of skin scarring assessment are required.6
Histological analysis of biopsied scar tissue remains the gold standard for assessment and diagnosis of normal and pathological scarring as it enables visualization of tissue architecture down to the cellular level.3, 7 Nevertheless, tissue sections take time to process, are invasive and can only provide snapshots of the scarring process. Biopsies cannot be repeated at the same site, may create a further wound or scar, and can be associated with patient‐related complications including delayed healing or infection.4 Therefore, there is an unmet need for urgent development of noninvasive devices for quantitative assessment of dermal fibrosis (as an index of cutaneous scarring) for the purposes of objective evaluation of response to scarring therapies and outcomes.6
A number of technologies have been used including magnetic resonance imaging (MRI),7 confocal laser microscopy (CLM),8 ultrasound (US)9 and optical coherence tomography (OCT).10, 11 Nevertheless, there is generally an inverse relationship between penetration depth and resolution. A number of studies have used CLM, which has a high resolution, but the limited penetration depth hinders the ability of this modality to study collagen density alterations in the dermis.12, 13, 14 US systems at 20 MHz frequency have also been used, which have good penetration depth but rather low resolution, limiting their ability to evaluate finer dermal tissue variations.9, 15
Although possessing excellent penetration depth, MRI has restricted resolution and only enables assessment of large architectural skin changes.16 OCT can image deeper structures than confocal microscopy while maintaining a resolution that exceeds that of US, although high‐frequency US (HFUS) provides deep dermal penetration with higher resolution.17 For the purpose of imaging cutaneous fibrosis, OCT provides an optimal balance between penetration depth and resolution.18 Although these tools have the potential to offer distinct advantages in wound and scar evaluation, their appropriate application and limitations remain to be determined. Furthermore, there is a lack of validation in the use of certain devices in wound repair, where objective measurements taken by noninvasive devices have been corroborated by immunohistochemical analysis.
We have previously compared OCT with histological assessment of acute wound healing and showed that characteristically architectural changes that correlate with histological phases of cutaneous wound healing could be identified with OCT.10 Additionally, a useful novel measure of fibroplasia and remodelling was identified, referred to as the mean grey value.10
In view of the above, for the purpose of this study we compared OCT with an equivalent form of HFUS. Thus, 50‐MHz HFUS was used as this allowed a similar penetration depth to OCT. Therefore, our aim was to generate normative data of dermal fibrosis following sequential temporal cutaneous biopsies created in healthy volunteers, using OCT and HFUS, with the intention of comparing both devices and to validate these findings by histological and immunohistochemical analysis.
Patients and methods
Healthy volunteer participants were enrolled into the study at the Manchester University NHS Foundation Trust, England, U.K. University of Manchester Research Ethics Committee and Trust Research and Development department approval was granted (reference: UoM 14333). All participants provided written consent to take part in the study.
Demographics
Demographic data are displayed in Table 1. Sixty‐two healthy volunteers participated, with more female (55%) than male patients. The majority were 21–30 years of age (68%) and most were of Caucasian ethnicity (94%).
Table 1.
Demographic data of the 62 healthy volunteers
| Demographic | Number (%) |
|---|---|
| Sex | |
| Male | 28 (45) |
| Female | 34 (55) |
| Age (years) | |
| 19–24 | 22 (35) |
| 25–30 | 24 (39) |
| 31–32 | 16 (26) |
| Ethnicity | |
| White | 58 (94) |
| Chinese | 4 (6) |
Study design
On day 0, all 62 participants had a 5‐mm‐diameter full‐thickness skin biopsy performed under local anaesthetic (lidocaine 1%) to both their upper inner arms, 5 cm from the axillary hairline and parallel to the medial epicondyle. The participants were split into seven groups (weeks 1, 2, 3, 4, 5, 6 and 8) in order to evaluate multiple time points, where 6‐mm rebiopsies were performed at their respective time points (Fig. 1 and Table S1; see Supporting Information). This would not have been possible in one cohort due to the large number of punch biopsies that would need to be performed in each participant. All wounds healed successfully in each group. The biopsy wound sites were dressed with Kaltostat (ConvaTec, Uxbridge, U.K.), gauze and Tegaderm pad dressing (3M, St Paul, MN, U.S.A.).
Figure 1.

Flowcharts demonstrating the clinical and experimental methodology. Clinical: 62 healthy volunteers were recruited and had objective measurements performed at multiple sequential time points. Objective noninvasive devices were used including optical coherence tomography (OCT), which provided measurements of attenuation coefficient and skin thickness, and high‐frequency ultrasound (HFUS), which measured intensity and skin thickness. Experimental: punch biopsies were performed on day 0 and weekly from weeks 1 to 8. Tissues were placed in formalin and underwent tissue processing for histological and immunohistochemical analysis. H+E, haematoxylin and eosin; SMA, smooth muscle actin.
Objective noninvasive imaging modalities were used at each time point for all groups prior to any intervention to monitor the progression of wound healing, with measurements taken in triplicate and average values used in the final analysis. The same area was located at each time point for each of the devices by the use of the small probe, which was positioned over the biopsy sites in the centre of the probe area. Once positioned, the area could be easily visualized in the software to ensure that the biopsy site or scar was positioned centrally, with the scar edges incorporated prior to image acquisition. The measurements were taken blinded to the previous images acquired. All clinical measurements and analyses were performed by the same researcher.
Optical coherence tomography
The OCT device (VivoSight; Michelson Diagnostics, Orpington, U.K.) uses low‐coherence near infrared radiation to produce an image of optical scattering from tissues, effectively creating an ‘optical ultrasound’ at a resolution close to that of histopathology (Fig. 2a). The frequency‐domain OCT device used offers a lateral optical resolution of < 7·5 μm and an axial resolution of 10 μm. The penetration depth is approximately 1·2–1·8 mm due to scattering effects and the scan area is 6 × 6 mm. Every scar was measured by setting the handheld imaging probe onto the lesion. Then its position was corrected by monitoring the trace of the aiming laser and the real‐time OCT image of the scar until a good cross‐sectional image was displayed on the screen. The device enabled quantitative measurements for (i) the attenuation coefficient, which is the amount by which the optical signal reduces with distance travelled into the skin and has been related to collagen density and organization, and (ii) the epidermal plus dermal skin thickness. We manually measured at five predefined places in the OCT image from the skin‐surface reflection or entrance signal to the first well‐demarcated change of reflectance intensity as expressed in a more signal‐poor zone indicating the base of the dermis (Fig. 2a). The system's ImageJ software (National Institutes of Health, Bethesda, MD, U.S.A.) provided the calculated distance between the two measurement lines.
Figure 2.
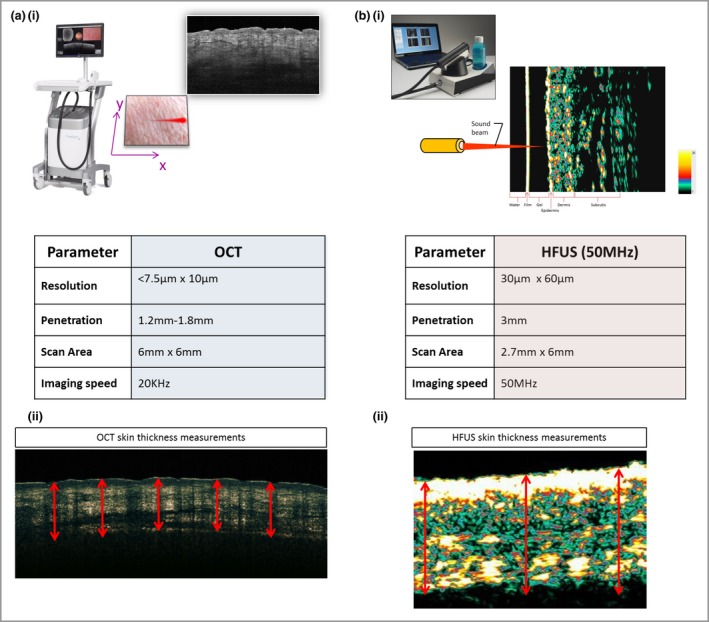
Comparison of device parameters. (a) Optical coherence tomography (OCT) device. OCT uses low‐coherence near‐infrared radiation to produce an image of optical scattering from tissues, effectively creating an ‘optical ultrasound’ at a resolution close to that of histopathology. The device has a lateral optical resolution of < 7·5 μm and an axial resolution of 10 μm. The penetration depth is approximately 1·2–1·8 mm due to scattering effects, and the scan area is 6 × 6 mm. (b) High‐frequency ultrasound (HFUS) device. HFUS uses sound waves, and the ultrasonic waves are partially reflected at the boundary between adjacent structures, producing echoes of different amplitudes. The epidermis, dermis and subcutis are displayed in the image. We chose to use a 50‐MHz probe, which has a lower resolution of 30 × 60 μm than OCT and a greater penetration depth of 3 mm with a scan area of 2·7 × 6 mm.
50‐MHz high‐frequency ultrasound
The HFUS device (Dermascan C; Cortex Technology, Hadsund, Denmark) uses sound waves, and the ultrasonic waves are partially reflected at the boundary between adjacent structures. This produces echoes of different amplitudes (Fig. 2b). The 50‐MHz probe has a lower resolution (30 × 60 μm) than OCT and a greater penetration depth of 3 mm, with a scan area of 2·7 × 6 mm. Water was employed as a coupling agent between the skin surface and the probe. Prior to each measurement a thin layer of conducting US gel was applied to the transducer. Minimal pressure was applied to preserve the thickness and echogenicity of the lesions. HFUS enabled quantitative measurements in the B‐mode software for (i) the intensity of reflections in the skin, which can be quantified as echodensity, and (ii) the epidermal plus dermal skin thickness. HFUS skin‐thickness measurements were performed automatically in the software by detection of the border between the epidermis and dermis based on the A‐scan. Average thickness values were automatically determined for the maximum and minimum distances between the outer edge of epidermis and the base of the dermis (Fig. 2b).
Laboratory techniques
For histology, formalin‐fixed paraffin‐embedded tissue sections at a thickness of 5 μm were prepared on glass slides. Haematoxylin and eosin (H&E) staining was performed to assess morphological and histological changes in the punch biopsies over time. The immunohistochemical staining methodology is provided in Appendix S1 (see Supporting Information). Details of the antibodies used are listed in Table S2 (see Supporting Information).
Information on statistics and data analysis is provided in Appendix S2 (see Supporting Information).
Results
Dermal fibrosis can display overexpression of a number of growth factors that can directly stimulate the proliferation of fibroblasts and their differentiation into myofibroblasts, and production of excessive extracellular matrix including collagen.4 Accurate assessment of dermal fibrosis is important as it is a good indicator of pathological scarring and mirrors an excessive amount of collagen synthesis. The results will now be presented in relation to scar thickness, HFUS intensity or dermal density and OCT attenuation coefficient. These relate to collagen density and morphological features including histological and immunohistochemical analysis of collagen, fibronectin and α‐smooth muscle actin (SMA), which play an important role in fibrogenesis.
Scar thickness
HFUS images of uninjured skin showed that there are three layers of different echogenicity. The outermost layer, showing what is known as an epidermal entrance echo, was highly echogenic. Underneath there was a dermal layer, which is less echogenic than the entrance echo, and the third layer, related to the nonechogenic hypodermis (Fig. S1; see Supporting Information). Scar images presented as more hypoechoic as they were more homogenic and thus appeared darker than uninjured skin beneath the strong hyperechoic entrance echo. Quantitative measurements demonstrated that there was an increase in skin thickness from day 0 (uninjured skin) (1·18 mm) to week 1 (1·28 mm) (P = 0·01), with a slight reduction to week 6 (1·23 mm) and a subsequent increase to week 8 (1·28 mm) (Fig. 3).
Figure 3.
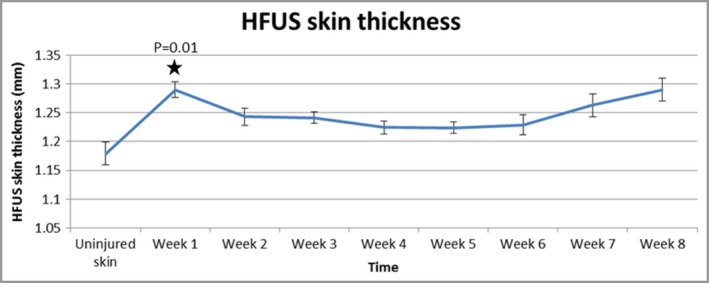
High‐frequency ultrasound (HFUS) demonstrates an increase in skin thickness from day 0 (uninjured skin) to week 1, with a slight reduction over time and subsequent increase to week 8. Furthermore, quantitative measurements of skin thickness provided by the device showed a significant increase from baseline to week 1 (P = 0·01).
OCT images showed that the layered structure of uninjured skin was clear, with differentiation between the epidermis, papillary dermis, reticular dermis and skin appendages (Fig. S2; see Supporting Information). Hair shafts and sebaceous glands were evident. Blood vessels appeared as transverse hyporeflective areas. Scarred skin showed the newly deposited extracellular matrix from 3 weeks after injury, and thereafter more ordered fibrosis with a thickened epidermis and a lack of defining features such as rete ridges. Measurements demonstrated an increase in skin thickness from day 0 (uninjured skin; 1·2 mm) to all other time points. This increase was significant at week 1 (1·27 mm, P = 0·02) and week 8 (1·28 mm, P = 0·03) (Fig. 4). Spearman correlation was performed, which demonstrated good agreement between HFUS and OCT skin‐thickness measurements; this was significant between day 0 and each week up to week 5 (P < 0·001) (Fig. S3; see Supporting Information).
Figure 4.
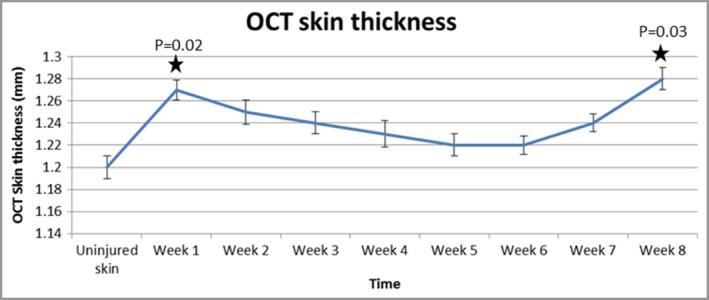
Optical coherence tomography (OCT) images demonstrate an increase in skin thickness from day 0 to all other time points. The graph shows that this increase was significant at week 1 (P = 0·02) and week 8 (P = 0·03).
H&E staining also corroborated these findings (Fig. S4; see Supporting Information), as measurements demonstrated increased skin thickness from day 0 (uninjured skin) (1·18 mm) to all time points, with a significant increase at week 1 (1·26 mm, P = 0·01) (Fig. 5a). Taking the histopathological skin thickness as the ‘gold standard’, OCT and HFUS tended to overestimate skin thickness compared with H&E analysis (Fig. 5b).
Figure 5.
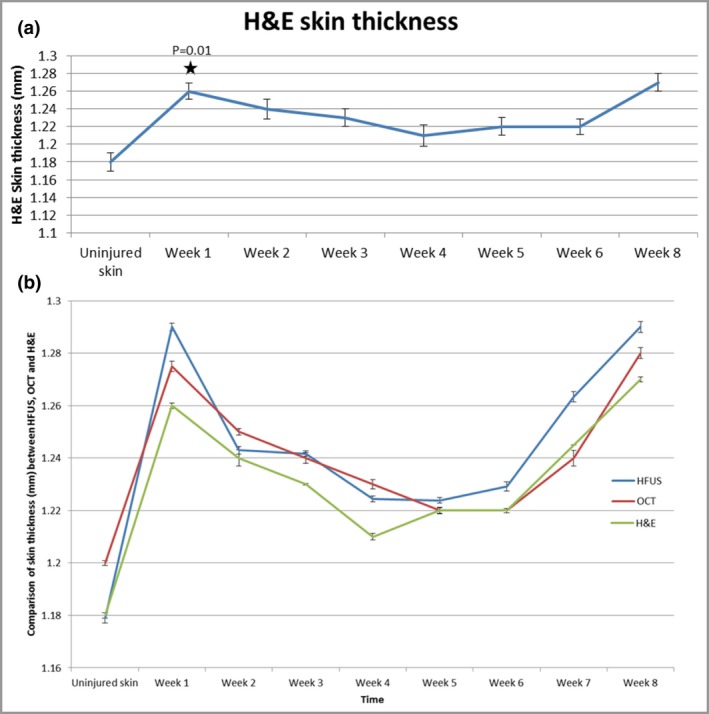
(a) Haematoxylin and eosin (H&E) staining demonstrated increased skin thickness from day 0 (uninjured skin) (1·18 mm) to all time points, with a significant increase at week 1 (1·26 mm) (P = 0·01). (b) Taking the histopathological skin thickness as the ‘gold standard’, optical coherence tomography (OCT) and high‐frequency ultrasound (HFUS) tended to overestimate skin thickness compared with H&E analysis.
High‐frequency ultrasound intensity
HFUS was used to measure the total intensity, which corresponds to the dermal density or echogenicity of the skin. Lower numbers or thinner collagen fibres can reflect a weaker echo than thicker collagen fibres, providing a stronger echo. Measurements showed that there was an initial drop at week 1 continuing to week 3, after which echogenicity readings slowly built back up. There was a significant reduction in echogenicity from day 0 (uninjured skin) (42%) to week 8 (29%, P = 0·02) (Fig. 6a).
Figure 6.
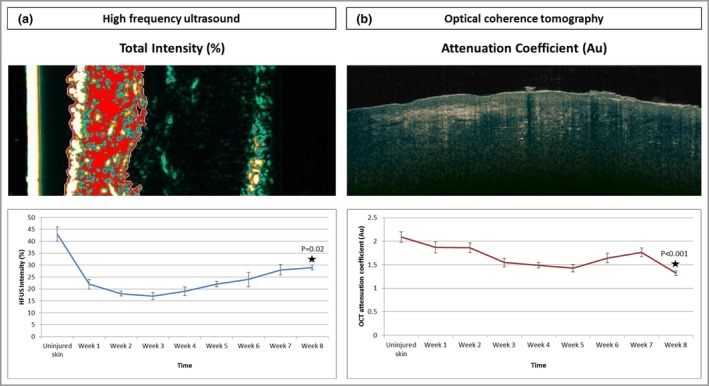
(a) The total intensity was measured by high‐frequency ultrasound (HFUS), which corresponds to the dermal density or echogenicity of the skin. Lower numbers or thinner collagen fibres can reflect a weaker echo than thicker collagen fibres, which provide a stronger echo. The measurements showed a significant reduction in echogenicity from day 0 (uninjured skin) (42%) to week 8 (29%) (P = 0·02). (b) The optical coherence tomography (OCT) attenuation coefficient is the amount by which the optical signal reduces with distance travelled into the skin, and has been related to collagen density and organization. The attenuation coefficient significantly reduced from uninjured skin [2·2 arbitrary units (Au)] to week 8 (1·35 Au) (P < 0·001).
Optical coherence tomography attenuation coefficient
The OCT attenuation coefficient is the amount by which the optical signal reduces with distance travelled into the skin, and has been related to collagen density and organization. The results showed that the attenuation coefficient significantly reduced from uninjured skin (2·2 arbitrary units) to week 8 (1·35 arbitrary units, P < 0·001) (Fig. 6b).
Morphological features
Time‐matched images with H&E demonstrated that re‐epithelialization was evident with both OCT and HFUS 1 week after injury (Fig. 7). H&E and OCT both displayed a haemostatic crust, but this was not detected by HFUS. All volunteers had complete epithelial cover after 2 weeks. By week 8, OCT and H&E showed that the healed epithelium was thickened and homogeneous. This was also shown by the strong hyperechoic band of the epidermis in the HFUS images. From 2 weeks after the initial biopsies, OCT, HFUS and H&E showed tissue remodelling and fibrosis until 8 weeks.
Figure 7.
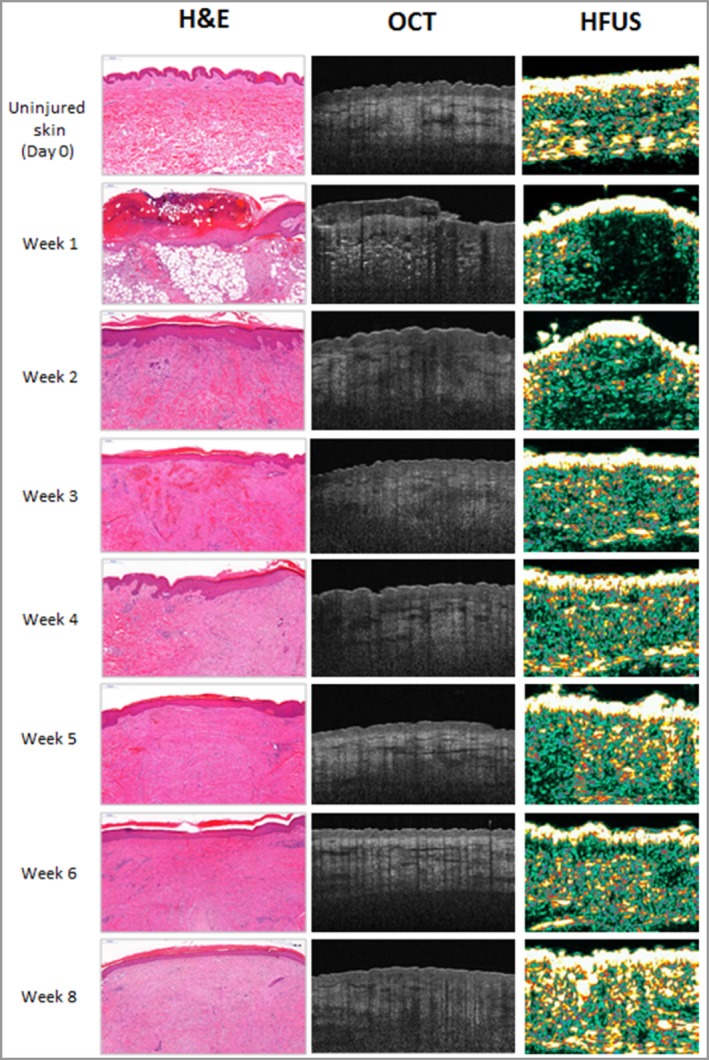
Time‐matched images with haematoxylin & eosin, optical coherence tomography and high‐frequency ultrasound.
Herovici staining demonstrated that mature collagen was greatest in uninjured skin (72%) compared with week 1 (19%, P = 0·001), week 2 (21%, P = 0·02) and week 3 (20%, P = 0·02) (Fig. S5a; see Supporting Information). Immature collagen was greater at all subsequent time points in scar skin compared with uninjured skin (19%), particularly at week 1 (68%, P = 0·01), week 2 (52%, P = 0·04) and week 3 (48%, P = 0·02). Collagen I and III intensity measurements corroborated this trend. Collagen I intensity was higher in uninjured tissues than in scar tissues, with the greatest intensity from beneath and at the wound edges over time (Fig. S5b), while collagen III intensity was greater in scar tissues than in normal skin (Fig. S5c). HFUS intensity and the OCT attenuation coefficient demonstrated a similar trend to mature collagen shown by Herovici staining and collagen I intensity, with higher levels in uninjured skin reducing to week 1 and a gradual increase over time (Fig. 8).
Figure 8.

Graphical representation of the trends between high‐frequency ultrasound (HFUS) intensity, optical coherence tomography (OCT) attenuation coefficient, Herovici collagen analyses and immunohistochemical analysis of collagen I and III. The trends show that HFUS intensity linked most closely with Herovici mature collagen and collagen I, while the OCT attenuation coefficient showed a similar trend except for at week 2 and week 8.
Fibronectin intensity was greatest at week 4 (0·72 arbitrary units) and reduced to week 8 (0·56 arbitrary units) (Fig. S6a). Furthermore, α‐SMA percentage marker area gradually increased from baseline in uninjured skin (11·5%) to week 8 (67%, P = 0·003) (Fig. S6b).
Discussion
In this unique human clinical study of 62 healthy volunteers, we have demonstrated that OCT and HFUS are useful tools for noninvasive monitoring of cutaneous fibrosis. They enable quantitative sequential temporal measurements of cutaneous thickness similar to those of histology. OCT attenuation coefficient values and HFUS intensity provided an indication of the intensity of collagen deposition in the skin over the course of healing, as supported by immunohistochemical analysis. Additionally, OCT enabled greater visualization of morphological detail than HFUS, while HFUS provided deeper penetration than OCT.
The total intensity measured by HFUS, corresponding to the dermal density or echogenicity of the skin, showed a significant reduction from uninjured skin to week 8. This indicates lower numbers or thinner collagen fibres reflecting a weaker echo, compared with thicker collagen fibres providing a stronger echo as evidenced in uninjured skin. There was an initial drop at the early time points, after which echogenicity readings slowly built back up. The OCT attenuation coefficient is the amount by which the optical signal reduces with distance travelled into the skin, and has been related to collagen density and organization. This was significantly reduced from uninjured skin to week 8. Again this showed a reduction at the earlier time points and a subsequent increase thereafter. The HFUS intensity and OCT attenuation coefficients showed a similar trend to mature collagen as evidenced by Herovici and collagen I analyses.
Time‐matched comparison images between H&E, OCT and HFUS demonstrated that layers such as the epidermis, dermis, structures and blood vessels could be well distinguished by OCT, allowing description of architectural details. However, in contrast to histopathology, single cells cannot be visualized. HFUS enabled visualization of the epidermis, dermis and subcutaneous tissue and indication of a hypoechoic area at the wound site, but did not show haemostatic crust or other specific structural details.
The OCT attenuation coefficient and HFUS intensity showed significantly reduced reflectivity at week 1 related to loss of dermal tissue secondary to injury, and reflected the lower intensity of subcutaneous fat due to the high water content. Values subsequently increased, which indicate fibroblast recruitment to the wound bed seen histologically, resulting in dermal regeneration and thus tissue fibrosis leading to mature scar tissue formation.
Skin‐thickness measurements were similar across OCT, HFUS and H&E; however, OCT and HFUS tended to overestimate skin thickness compared with histological measurements. This may be due to tissue shrinkage after formalin fixation and embedding in paraffin. This phenomenon has been investigated in a study evaluating HFUS and histological thickness measurements of tumour thickness, which showed that histological measurements were slightly lower than with HFUS.19 It was suggested that the tissue expanded after excision then subsequently contracted after formalin fixation. Despite the small discrepancies between OCT, HFUS and histological measurements, the modalities show that there are distinct trends between time points that are clear with both devices. We performed Spearman correlation analysis, which demonstrated good agreement between HFUS and OCT skin‐thickness measurements; this was significant from day 0 (uninjured skin) to week 5. Correlations were reduced at weeks 6, 7 and 8, which may have been due to the lower numbers of volunteers in these groups (12, 6 and 6, respectively) compared with the earlier time points. This could have led to more variation.
A number of studies have used HFUS as a measure of skin thickness and found it to be capable of producing valid and reproducible results in both healthy and scarred tissue.20, 21, 22, 23 Both the interobserver reliability and reproducibility of the device have been assessed, and a strong intraclass correlation coefficient of 0·94 was found.22 However, a major limitation of these studies was that they evaluated the consistency, and not accuracy, of measurements on postburn scars. In addition, despite a number of studies evaluating HFUS there has been a lack of studies using a device at > 20 MHz, and we have used 50 MHz.
We evaluated fibrotic markers: fibronectin and α‐SMA to identify trends in normal cutaneous healing. The ability to characterize the extent and rate of progression of dermal fibrosis is critically important in determining the degree of fibrotic severity, healing potential and response to therapies across all forms of cutaneous fibrosis. In normal acute wound healing, fibronectin plays a critical role in extracellular matrix organization and stability, and this role is visible in all phases.5 Accumulation of fibronectin‐rich fibrillar matrix will stimulate further matrix deposition.5 When a scar matures, fibronectin is broken down to create a place for collagen deposition, which gives strength to the final scar.24 This mirrors our results, which showed that fibronectin was greatest at week 4 and reduced thereafter to week 8.
Furthermore, α‐SMA gradually increased from baseline to week 8 in uninjured skin. The gradual increase in mature collagen I from week 1 to week 8 links with the increased wound contraction evidenced by α‐SMA.
The correct choice of device is paramount for a particular wound or scar type, as deeper wounds or thicker scars such as hypertrophic and keloid scars may not be detected as accurately with OCT as with HFUS. Preferably, both modalities would be combined for maximum theranostic value. Each modality allowed the detection and monitoring of cutaneous healing. In contrast to HFUS, OCT enabled a greater resolution of the morphology and architecture, although cellular morphology could not be identified with both modalities. Although it was possible to identify morphological aspects, assessment of these characteristics should be performed with caution due to their subjective nature, thus our primary focus was on the quantitative abilities of these devices. Data regarding the direct comparisons of HFUS, OCT and histopathology are limited; nevertheless, one study investigated the accuracy of HFUS and OCT for tumour thickness measurements of basal cell carcinomas and actinic keratosis and compared their results with histological measurements.25 They demonstrated more accurate results with OCT due to better resolution and contrast from the infrared radiation compared with the contrast of acoustic signals from HFUS.
The advantages of both devices are that they are noninvasive and side‐effect free. Furthermore, they can serially assess a wound or scar over time without interfering in the disease or healing process. The scanning processes for both modalities are fast, and images are ready for analysis within seconds, which can enable rapid diagnosis. OCT and HFUS have been shown to be precise in terms of repeatability and reproducibility, with low variation coefficients and high resolution.10, 22, 23, 25 In contrast to HFUS, OCT does not require any use of gels. Both devices are able to give high‐resolution images and the analytical algorithms are automatic, not involving any operator interpretation in relation to quantitative aspects.
Limitations of this study are that the maximum scanning depth of OCT is 2 mm, but in practice resolution over 1·25 mm from the surface is poor. Significant epidermal thickening or haemostatic crust can hinder the scan by producing shadowing, thus reducing the resolution. For diagnostic purposes, OCT may be most useful for epidermal, papillary dermal and upper reticular dermal pathologies. Furthermore, unlike histological analysis, OCT cannot identify individual cells. OCT and HFUS may be useful as complementary imaging biomarkers. For both devices, patient cooperation is essential as movement results in low‐quality scan images; therefore, certain patient cohorts may be unsuitable.
Our study used a large number of volunteers (n = 62) to assess healing over an 8‐week period, with a predominantly homogeneous cohort with respect to age and ethnicity. The study could be improved with longer‐term follow‐up and a more heterogeneous cohort. It would have been beneficial to perform these analyses in individuals of other ethnic groups, as substantial differences in scarring have been noted in dark pigmented skins.26
Based on our data, we conclude that both OCT and HFUS are suitable tools for noninvasive monitoring of cutaneous healing, and may be useful in choosing the optimal therapeutic regimen. Despite slightly overestimating skin thickness compared with histopathological measurements, OCT and HFUS demonstrated the same trend over time. OCT attenuation coefficient values and HFUS intensity provided an indication of collagen levels in the skin over the progression of healing. OCT enabled greater visualization in terms of resolution of morphological detail of the dermis compared with HFUS. On the other hand, HFUS enables deeper penetration than OCT. These findings have demonstrated that the choice of device is important and dependent upon wound or scar type, the parameters to be measured and the morphological detail required.
Supporting information
Table S1 Group allocation numbers for the participant clinical measurement acquisition.
Table S2 Details of the primary antibodies used, incubation details, secondary antibodies used and detection methods.
Appendix S1 Immunohistochemical staining.
Appendix S2 Statistics and data analysis.
Fig S1. High‐frequency ultrasound images demonstrating an increase in skin thickness from day 0 (uninjured skin) to week 8.
Fig S2. Optical coherence tomography images demonstrate an increase in skin thickness from day 0 to all other time points.
Fig S3. Spearman's correlation analysis demonstrated good agreement between high‐frequency ultrasound and optical coherence tomography skin thickness measurements.
Fig S4. Haematoxylin and eosin staining demonstrated increased skin thickness from day 0 uninjured skin (1·18 mm) to all time points, with a significant increase at week 1 (1·26 mm) (P = 0·01).
Fig S5. Collagen analysis (Herovici, collagen I and collagen III).
Fig S6. Fibrotic markers (alpha‐smooth muscle actin and fibronectin images).
Funding sources National Institute for Health Research (Biomedical Research Centre).
Conflicts of interest None to declare.
https://doi.org/10.1111/bjd.18394 available online
References
- 1. Krafts KP. Tissue repair. The hidden drama. Organogenesis 2010; 6:225–33. [DOI] [PMC free article] [PubMed] [Google Scholar]
- 2. Muiznieks LD, Keeley FW. Molecular assembly and mechanical properties of the extracellular matrix: a fibrous protein perspective. Biochim Biophys Acta 2013; 1832:866–75. [DOI] [PubMed] [Google Scholar]
- 3. Diegelmann RF, Evans MC. Wound healing: an overview of acute, fibrotic and delayed healing. Front Biosci 2004; 9:283–9. [DOI] [PubMed] [Google Scholar]
- 4. Shih B, McGrouther DA, Bayat A. Identification of novel keloid biomarkers through profiling of tissue biopsies versus cell cultures in keloid margin specimens compared to adjacent normal skin. Eplasty 2010; 10:e24. [PMC free article] [PubMed] [Google Scholar]
- 5. Tracy LE, Minasian RA, Caterson EJ. Extracellular matrix and dermal fibroblast function in the healing wound. Adv Wound Care (New Rochelle) 2016; 5:119–36. [DOI] [PMC free article] [PubMed] [Google Scholar]
- 6. Paul DW, Ghassemi P, Ramella‐Roman JC et al Non‐invasive imaging technologies for cutaneous wound assessment: a review. Wound Repair Regen 2015; 23:149–62. [DOI] [PubMed] [Google Scholar]
- 7. Mirrashed F, Sharp JC. In vivo morphological characterisation of skin by MRI micro‐imaging methods. Skin Res Technol 2004; 10:149–60. [DOI] [PubMed] [Google Scholar]
- 8. Oliveira GV, Hawkins HK, Chinkes D et al Hypertrophic versus non hypertrophic scars compared by immunohistochemistry and laser confocal microscopy: type I and III collagens. Int Wound J 2009; 6:445–52. [DOI] [PMC free article] [PubMed] [Google Scholar]
- 9. Agabalyan NA, Su S, Sinha S, Gabriel V. Comparison between high‐frequency ultrasonography and histological assessment reveals weak correlation for measurements of scar tissue thickness. Burns 2017; 43:531–8. [DOI] [PubMed] [Google Scholar]
- 10. Greaves NS, Benatar B, Whiteside S et al Optical coherence tomography: a reliable alternative to invasive histological assessment of acute wound healing in human skin? Br J Dermatol 2014; 170:840–50. [DOI] [PubMed] [Google Scholar]
- 11. Greaves NS, Iqbal SA, Hodgkinson T et al Skin substitute‐assisted repair shows reduced dermal fibrosis in acute human wounds validated simultaneously by histology and optical coherence tomography. Wound Repair Regen 2015; 23:483–94. [DOI] [PubMed] [Google Scholar]
- 12. Eichert S, Möhrle M, Breuninger H et al Diagnosis of cutaneous tumors with in vivo confocal laser scanning microscopy. J Dtsch Dermatol Ges 2010; 8:400–10. [DOI] [PubMed] [Google Scholar]
- 13. Edwards SJ, Osei‐Assibey G, Patalay R et al Diagnostic accuracy of reflectance confocal microscopy using VivaScope for detecting and monitoring skin lesions: a systematic review. Clin Exp Dermatol 2017; 42:266–75. [DOI] [PubMed] [Google Scholar]
- 14. Langley RG, Walsh N, Sutherland AE et al The diagnostic accuracy of in vivo confocal scanning laser microscopy compared to dermoscopy of benign and malignant melanocytic lesions: a prospective study. Dermatology 2007; 215:365–72. [DOI] [PubMed] [Google Scholar]
- 15. Nedelec B, Correa JA, de Oliveira A et al Longitudinal burn scar quantification. Burns 2014; 40:1504–12. [DOI] [PubMed] [Google Scholar]
- 16. Bittoun J, Querleux B, Darrasse L. Advances in MR imaging of the skin. NMR Biomed 2006; 19:723–30. [DOI] [PubMed] [Google Scholar]
- 17. Mamalis A, Ho D, Jagdeo J. Optical coherence tomography imaging of normal, chronologically aged, photoaged and photodamaged skin: a systematic review. Dermatol Surg 2015; 41:993–1005. [DOI] [PMC free article] [PubMed] [Google Scholar]
- 18. Babalola O, Mamalis A, Lev‐Tov H, Jagdeo J. Optical coherence tomography (OCT) of collagen in normal skin and skin fibrosis. Arch Dermatol Res 2014; 306:1–9. [DOI] [PMC free article] [PubMed] [Google Scholar]
- 19. Salmhofer W, Rieger E, Soyer HP et al Influence of skin tension and formalin fixation on sonographic measurement of tumor thickness. J Am Acad Dermatol 1996; 34:34–9. [DOI] [PubMed] [Google Scholar]
- 20. Kreuter A, Gambichler T, Avermaete A et al Low‐dose ultraviolet al phototherapy for extragenital lichen sclerosus: results of a preliminary study. J Am Acad Dermatol 2002; 46:251–5. [DOI] [PubMed] [Google Scholar]
- 21. van den Kerckhove E, Staes F, Flour M et al Reproducibility of repeated measurements on post‐burn scars with Dermascan C. Skin Res Technol 2003; 9:81–4. [DOI] [PubMed] [Google Scholar]
- 22. Lau JCM, Li‐Tsang CWP, Zheng YP. Application of tissue ultrasound palpation system (TUPS) in objective scar evaluation. Burns 2005; 31:445–52. [DOI] [PubMed] [Google Scholar]
- 23. Wohlrab J, Wohlrab D, Finke R et al [Ultrasound characterization of burn scars in children]. Unfallchirurg 2000; 103:754–60 (in German). [DOI] [PubMed] [Google Scholar]
- 24. Lenselink EA. Role of fibronectin in normal wound healing. Int Wound J 2015; 12:313–16. [DOI] [PMC free article] [PubMed] [Google Scholar]
- 25. Mogensen M, Nürnberg BM, Forman JL et al In vivo thickness measurement of basal cell carcinoma and actinic keratosis with optical coherence tomography and 20‐MHz ultrasound. Br J Dermatol 2009; 160:1026–33. [DOI] [PubMed] [Google Scholar]
- 26. Bayat A, McGrouther DA, Ferguson MW. Skin scarring. BMJ 2003; 326:88–92. [DOI] [PMC free article] [PubMed] [Google Scholar]
Associated Data
This section collects any data citations, data availability statements, or supplementary materials included in this article.
Supplementary Materials
Table S1 Group allocation numbers for the participant clinical measurement acquisition.
Table S2 Details of the primary antibodies used, incubation details, secondary antibodies used and detection methods.
Appendix S1 Immunohistochemical staining.
Appendix S2 Statistics and data analysis.
Fig S1. High‐frequency ultrasound images demonstrating an increase in skin thickness from day 0 (uninjured skin) to week 8.
Fig S2. Optical coherence tomography images demonstrate an increase in skin thickness from day 0 to all other time points.
Fig S3. Spearman's correlation analysis demonstrated good agreement between high‐frequency ultrasound and optical coherence tomography skin thickness measurements.
Fig S4. Haematoxylin and eosin staining demonstrated increased skin thickness from day 0 uninjured skin (1·18 mm) to all time points, with a significant increase at week 1 (1·26 mm) (P = 0·01).
Fig S5. Collagen analysis (Herovici, collagen I and collagen III).
Fig S6. Fibrotic markers (alpha‐smooth muscle actin and fibronectin images).


