Abstract
Objective
In hair care cosmetic products’ evaluation, one commonly used method is to evaluate the hair appearance as a gold standard in order to determine the effect of an active ingredient on the final state of the hair via visual appreciation. Although other techniques have been proposed for a direct analysis of the hair fibres, they give only surface or structural information, without any accurate molecular information. A different approach based on confocal Raman spectroscopy has been proposed for tracking in situ the molecular change in the keratin directly in the human hair fibres. It presents a high molecular specificity to detect chemical interactions between molecules and can provide molecular information at various depths at the cortex and cuticle levels.
Methods
To evaluate the potential of confocal Raman spectroscopy in testing the efficiency of cosmetic ingredients on keratin structure, we undertook a pilot study on the effectiveness of a smoothing shampoo on natural human hair, by analysing α‐helix and β‐sheet spectral markers in the Amide I band and spectral markers specific to the cystin sulfur content.
Results
We confirmed that an active proved to be effective on a gold standard decreases α‐helix keratin conformation and promotes β‐sheet keratin conformation in the hair fibres. We also showed that treatment with the effective active decreases the intensity of covalent disulfide (S–S at 510 cm‐1) cross‐linking bands of cysteine. These data confirm that the effective active also acts on the tertiary structure of keratin.
Conclusion
From these experiments, we concluded that the effective active has a smoothing effect on the human hair fibres by acting on α‐helix and β‐sheet keratin conformation and on the tertiary structure of keratin. Based on these results, confocal Raman spectroscopy can be considered a powerful technique for investigating the influence of hair cosmetic ingredients on keratin structure in human hair fibres. Moreover, this analytical technique has the advantage of being non‐destructive and label free; in addition, it does not require sample extraction or purification and it can be applied routinely in cosmetic laboratories.
Keywords: confocal Raman spectroscopy, hair care product, human hair treatment, keratin, molecular conformation
Confocal Raman spectroscopy can be considered as a powerful technique for investigating the influence of hair cosmetic ingredients on keratin structure in human hair fibres.

Résumé
OBJECTIF
Dans l’évaluation des produits cosmétiques pour le soin des cheveux, une méthode communément utilisée consiste à évaluer l'aspect des cheveux afin de déterminer l'effet d'un principe actif sur l’état final des cheveux via l'appréciation visuelle. Bien que d'autres techniques ont été proposées pour une analyse directe de la fibre capillaire, elles ne donnent que des informations de surface ou de structure, sans aucune information moléculaire précise. Une approche différente par la spectroscopie confocale Raman a été proposée pour le suivi in situ du changement moléculaire de la kératine directement dans les fibres de cheveux humains. Il présente une grande spécificité moléculaire, détecter les interactions chimiques entre les molécules et peut fournir des informations moléculaires à différents niveaux de profondeur du cortex et de la cuticule.
MÉTHODES
Afin d’évaluer le potentiel de la spectroscopie Raman confocale pour tester l'efficacité des ingrédients cosmétiques sur la structure de la kératine, nous avons entrepris une étude pilote sur l'efficacité d'un shampooing lissant sur cheveux naturels, en analysant les marqueurs spectraux de l'hélice α et du feuillet β dans la bande Amide I et les marqueurs spectraux spécifiques au contenu en sulfure‐cystine.
RÉSULTATS
Nous avons confirmé qu'un actif s'avérant efficace sur un gold standard diminue la conformation de la kératine en hélice α et favorise la conformation de la kératine en feuillet β dans les fibres des cheveux. Nous avons également montré que le traitement avec l'actif efficace diminue l'intensité des bandes de cystéine réticulant sous forme de ponts disulfures covalents (S – S à 510 cm‐1). Ces données confirment que l'actif efficace agit également sur la structure tertiaire de la kératine.
CONCLUSION
À partir de ces expériences, nous avons conclu que l'actif efficace a un effet lissant sur les fibres du cheveu humain en agissant sur la conformation hélice α et feuillet β de la kératine et sur la structure tertiaire de la kératine. Sur la base de ces résultats, la spectroscopie confocale Raman peut être considérée comme une technique puissante pour étudier l'influence des ingrédients cosmétiques sur la structure de la kératine dans les fibres de cheveux. De plus, cette technique analytique a l'avantage d’être non destructive et ne nécessite pas de marquage; de plus, elle ne nécessite pas d'extraction ou de purification des échantillons et peut être appliquée en routine dans les laboratoires de cosmétiques.
Introduction
A strand of hair comprises a follicle, embedded in the skin, and a hair shaft, which is the visible part of the strand. The follicle is the source of hair production, thanks to its dermal papilla localisation and the hair matrix, which induces secretion of signaling molecules that control hair growth and differentiation 1.
The hair shaft includes a number of compartments common to all hair types, namely the cuticle and cortex, which affect hair structure and appearance. Large and thick hairs have a third compartment called the medulla, which is the innermost layer of the hair shaft, considered to be the hair marrow 2. The cuticle is the outermost layer, comprising 6–8 layers of flat overlapping cells, and it is involved in hair surface formation 3. The cortex is the major site of keratinisation, an essential process which confers to the hair shaft its rigidity via the presence of cortical cells rich in keratin filaments. There are two types of keratin fibres in hair: type I, composed of acidic amino acid residues, and type II, which has basic amino acid residues. When a type I fibre and a type II fibre are arranged in a spiral, it forms a dimer, which coil together in an antiparallel direction to form tetramers; these are oriented parallel to the long axis of the hair shaft and are embedded in an amorphous matrix of high sulfur proteins 4.
The keratin chains are composed of α‐keratins, found in an α‐helix conformation, which are coiled by ionic forces, hydrogen bonds, Van Der Waals interactions and disulfide bonds. Weak hydrogen bonds links ensure links between the keratin polypeptide chains. These weaker bonds are easily overcome by water, thereby temporarily rendering curly hair straight. Disulfide bonds originate from sulfur‐containing cystine bonds, which create a strong cross‐link between adjacent chains. Disulfide bonds are stronger when free thiol groups from cystine are closer, as is the case for keratin in an α‐helix conformation, making these bonds easier to form. Consequently, the more hair keratin found in an α‐helix conformation, the greater the curve in the protein chain and the more the hair shaft will curl. These disulfide bonds are critical in conferring shape, stability and resilience to the hair shaft and can be broken by external oxidative chemical agents, such as occurs with perming or straightening, or by heat with the use of a hair straightener. Conversely, a β‐sheet conformation in the keratin decreases the formation of disulfide bonds and leads to a smoother hair shaft 5.
For decades, physical appearance has been essential to human social interactions, and this need to take care of one's appearance only continues to increase. This applies not only to skin beauty, but also to hair appearance, which has become highly important. The cosmetic industry is therefore striving to develop innovative new hair care products that have a positive effect on hair appearance. As previously explained, α‐helix and β‐sheet keratin conformation is an important parameter in evaluating the effectiveness of hair care products. Indeed, keratin conformation is a direct molecular indicator of hair shaft structure impacting the hair appearance. An active ingredient proven to modulate hair keratin conformation by transforming α‐helix conformations to β‐sheet conformations would be recognised as an effective hair smoothing ingredient with a mechanism of action at the molecular level.
The easiest technique to evaluate the smoothing effect of an active ingredient on hair is to measure hair length after washing with a shampoo containing the active ingredient vs. a shampoo not containing the active ingredient. Although this method gives a representative result of the smoothing effect via a qualitative appreciation of hair appearance, it does not provide any information on the activity of the active ingredient at the molecular level.
Several physical and biochemical techniques have already been used to test human hair and characterise keratin fibres, such as x‐ray diffraction, solid state nuclear magnetic resonance (NMR), circular dichroism, scanning electron microscopy and high‐pressure liquid chromatography–mass spectrometry (HPLC–MS) 6, 7, 8, 9, 10, 11. Although biochemical and microscopic techniques are innovative, they present some technical limitations owing to protocol complexities, prior sample preparation, the need for extraction, and reagent costs. Similarly, although some physical approaches reflect the state of the crystalline structure of keratin fibres, they can provide only surface or morphological information, without any precise molecular information in relation with the mechanism of action of ingredients. These techniques are therefore not suitable for routine application in cosmetic laboratories.
Different approaches based on optical spectroscopic techniques have been proposed to develop hair testing methods. Raman scattering and Fourier‐transform infrared absorption are molecular spectroscopic techniques, which provide spectra that serve as highly specific fingerprints to characterize the molecular composition of a sample. In addition, structural information can be extracted by preserving the sample integrity. These approaches appear to be appropriate tools for investigating the keratin fibre structure of entire hierarchical structures in human hair fibres. Since the analysis, based on the non‐destructive interaction between light and matter, is performed in situ, in label‐free manner and with only a little biomass 12.
Fourier‐transform infrared spectroscopy (FTIR) has been used in scalp and hair analysis to produce examples for matching and differentiating single human scalp hairs and to visualise defined hair follicle compartments, in addition to other many applications reported in forensic science 13, 14, 15, 16, 17. Raman spectroscopy is a powerful laser spectroscopic technique that detects the characteristic vibrational energy levels of a molecule and provides structural and molecular information about the hair sample. In confocal mode, it has the advantage of detecting information at various depths in the cortex and cuticle levels. Furthermore, it can provide information about disulfide (S–S) groups in keratin fibres that cannot be measured using infrared spectroscopy. Moreover, conformational information is provided by Amide I and Amide III vibrations and by the C–C skeletal stretching, this last vibration being only weakly active in the infrared absorption spectrum of keratin fibres 12, 18, 19, 20.
Raman spectroscopy has been used to analyse structural change in keratin fibres after chemical treatments and to investigate the mechanism of thioglycerol in straightening hair. Such studies have shown that structural keratin changes to hair fibres at various depths can be characterised directly through Raman spectroscopy 6, 21, 22.
In this study, we used a gold standard model to determine the straightening effect of two different active ingredients on hair in comparison with untreated hair and a placebo control. To better understand the molecular effects of effective active on human hair smoothing, we used confocal Raman spectroscopy in combination with chemometric methods. In the first stage of the study, we identified the spectral signature of human hair fibres and pure keratin molecules in order to evaluate the contribution of keratin to the hair fibres spectrum. In the second stage, we sought to evaluate the molecular effect of shampoo on hair keratin by analysing spectral markers of α‐helix and β‐sheet conformation, using the Amide I band and the intensity of the stretching vibration associated to the covalent disulfide (S–S) bands informative of the keratin tertiary structure.
Materials and methods
Human hair and keratin origin
We used natural, undyed, light hair purchased from a specialist hair provider (International Hair Importers & Products, NY, U.S.A.). In this study, we used natural light blond hair from a caucasian donor in order to limit fluorescence interference during Raman measurements.
Keratin powder was produced from the hair samples, which had been incubated in a chloroform and methanol (2:1) solution for 24 h to induce hair delipidation. The hair was then dried and incubated overnight at 60°C under constant agitation in a keratin extraction solution containing urea, sodium dodecyl sulfate (SDS) and 2‐mercaptoethanol. The following day, the dialysis bags were hydrated for 4 h in distilled water at room temperature, following which the keratin extract solution was transferred to the dialysis bags. Dialysis was performed for 6 days in degassed water, which was changed twice per day. After 6 days of dialysis, the contents of the dialysis bags were transferred to tubes and frozen for 1 h at −80°C before being lyophilised.
Shampoo composition: INCI (International Nomenclature of Cosmetic Ingredients) list
AQUA/WATER, SODIUM LAURETH SULFATE, COCAMIDOPROPYLBETAINE, HYDROLYZED SODIUM HYALURONATE, SODIUM CHLORIDE, PHENOXYETHANOL, HYDROXYPROPYL GUAR HYDROXYPROPYL TRIMONIUM CHLORIDE, FRAGRANCE, HEXYL CINNAMAL, BUTYLPHENYL METHYLPROPIONAL, CITRONELLOL, ALPHA ISOMETHYL IONONE, HYDROXYISOHEXYL 3‐CYCLOHEXENE CARBOXALDEHYDE, CITRIC ACID.
Two actives were incorporated in this formula, which are active A and active B. Both of these two actives are designed by “HYDROLYZED SODIUM HYALURONATE” in the INCI formula, they are both composed of a mixture of hydrolyzed sodium hyaluronate of different molecular weights and in a different ratio for each active. The exact composition of hydrolyzed sodium hyaluronate is kept confidential. The placebo formula has the same composition without hydrolyzed sodium hyaluronate.
Hair length measurement for the evaluation of active ingredient efficiency (gold standard method)
Two unknown actives (Active A and Active B) were evaluated vs. a placebo control and vs. no treatment. For each group, 10 hair samples of 2 g each were soaked for 5 s under a trickle of water and massaged for 1 min with 1 mL of either placebo shampoo, shampoo containing 3% of one of the two actives to be tested or, for the untreated hair, just water. The hair samples were then rinsed under a trickle of water for 5 s, dried with a hair dryer at 90°C and straightened with a hair straightener at 210°C. The samples were then subjected to extreme conditions of humidity (70 ± 10% relative humidity and 24 ± 2°C).
Macro photographs of the samples were taken using a digital camera (Nikon D7100) in order to evaluate hair length after straightening and after 8 h’ exposure to extreme conditions. The photographs were taken in standardised, indirect light. The aperture, shutter speed and distance were also standardised. The length of the hair samples was measured using a graduated ruler, recorded digitally and measured using Photoshop® software.
Evaluation of hair keratin conformation using confocal Raman spectroscopy
Treatment of hair samples
Five hair samples of 2 g each from the same donor were required. The first sample was not treated and was packaged immediately in aluminum foil; this was the negative control for keratin α‐helix conformation. The second sample was smoothed with an iron and then packaged; it served as the positive control for keratin β‐sheet conformation. The three other samples were soaked for 20 s in 200 mL of distilled water each and massaged for 2 min with 0.5 g of shampoo containing Active A at 3%, 0.5 g of shampoo containing Active B at 3% or just 0.5 g of the basic shampoo used as a placebo. Each sample was then rinsed three times for 20 s in three baths of distilled water and wiped with paper before being dried with a hair dryer for 3 min. These samples were also packaged in aluminum foil and stored at room temperature before being subjected to Raman spectroscopy analysis.
Raman spectroscopy and confocal measurements (Z) on hair fibres
The Raman spectra of the human hair fibres were recorded using a near infrared confocal Raman micro‐spectrometer (Labram, Horiba Jobin Yvon, Villeneuve d'Ascq, France). The set‐up comprised an optical microscope (Olym pus, BX41, France) coupled to a dispersive Raman spectrometer (Horiba Jobin Yvon, Villeneuve d'Ascq, France) and a charge‐coupled device (CCD) detector (1024 × 256 elements) cooled via the Peltier effect to −65°C. The spectrometer had a grating of 950 grooves per mm, allowing data to be collected at a spectral resolution of 4 cm−1.
The excitation source was provided by a titanium–sapphire laser (Model 3900S, Spectra‐Physics, France) generating a laser beam with a 785 nm wavelength and operating at 50 mW under the microscope objective, which is non‐destructive for light blond hair samples and does not cause any thermal or photochemical degradation. The laser wavelength excitation was chosen as the optimal compromise to ensure reduction of parasitic fluorescence generation, good penetration of the light deep into the hair samples and sensitivity of the CCD detector over the spectral range.
Confocal Raman measurements were recorded using a 100× infra‐red optimised objective (Olympus, France) operating in air with a numerical aperture of 0.8. To obtain axial Z profiles, the objective was mounted on a high‐precision piezoelectric device (Physics instrument, Germany) which allowed vertical in‐depth scanning by focusing the laser light on each depth point through the hair fibres and assuring an axial resolution of 2 μm. For our measurements, the objective was set to autofocus mode.
The axial Z profiles were recorded directly on the hair fibres without any particular sample preparation. The mapping zone was chosen using computer‐controlled, motorised x–y stage and camera visualisation of the hair fibrse using a 100× objective (Fig. 1). The spectral acquisitions were recorded on the 400–4000 cm−1 spectral range at different focus points, from the surface Z = 0 μm to a depth of 30 μm (Fig. 2a), taking into consideration the cortex and the cuticle of the fibres in each measurement. The Raman spectra of hair are shown in Fig. 2b. For all Raman profiles, a scanning z‐step size of 3 μm was defined, and for each spectrum, one accumulation of 30 s of laser exposure was taken. Data acquisition was performed using LabSpec 5 software (Horiba Jobin Yvon, Villeneuve d'Ascq, France). Previously to data acquisition the instrument was calibrated to the 520.7 cm−1 Raman line of silicon, and the laser power at the sample level was regularly controlled.
Figure 1.
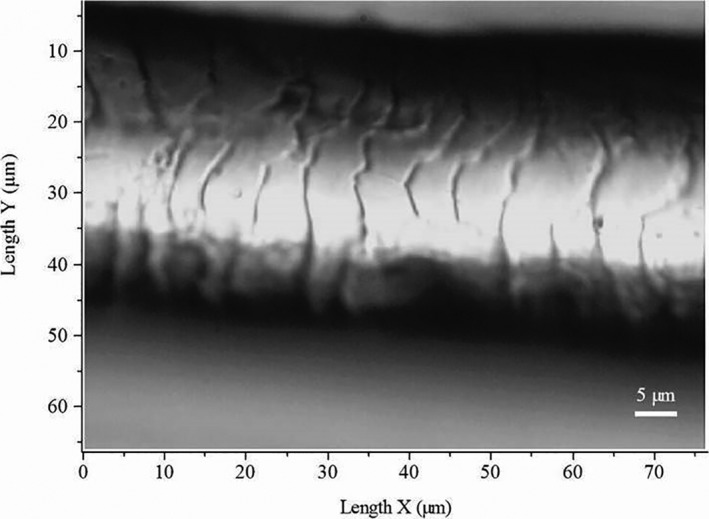
Light microscopy image of intact human hair fibre.
Figure 2.
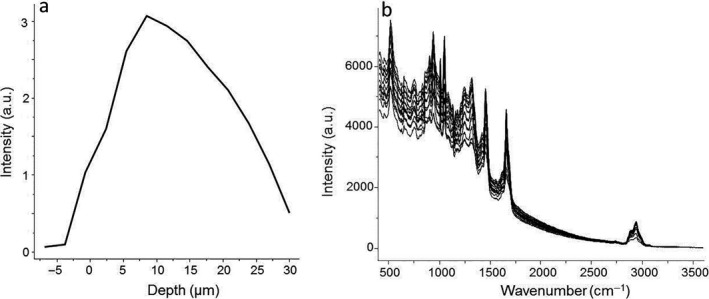
(a) Axial (Z) profile of human hair fibre recorded directly from hair surface to a depth of 30 μm. (b) Raman spectra of intact human hair fibre on the 400–3600 cm−1 spectral range
Spectral data processing
The spectral acquisitions were recorded on the 400–4000 cm−1 spectral range. Prior to data processing on all Raman spectra, the 400–3600 cm−1 spectral range was extracted. Beyond 3600 cm−1 Raman spectra do not present any molecular information. The pre‐processing of spectral data was performed using LabSpec 5 software (Horiba Jobin Yvon, Villeneuve d'Ascq, France). First, cosmic radiation was removed and all aberrant profiles were excluded from the database. Each remaining profile was subjected to corrections to clean up the Raman signal for the hair fibres. These corrections applied to the raw spectral data included the correction of spectral shifts, noise reduction using a 5‐point average Savitzky–Golay smoothing filter, and baseline correction using a polynomial function of degree 5 to remove the fluorescence background. Finally, for spectral data processing, the set of spectra were vector normalised across the entire spectral range (400–3600 cm−1). Three axial Z profiles were recorded for each hair sample, and mean Raman spectra were calculated to ensure that the Raman measurements were reproducible. Due to the irregularity of the flatness of the hair surface, the surface point can vary slightly and no longer corresponds to the zero position Z = 0 of the objective lens shift operated by the piezoelectric. The surface point is estimated at the half‐maximal intensity of CH vibration (2800–3000 cm−1) when the lower half of the laser beam is in the hair fibre and the upper half is in the air. In this case the maximum focal point is located exactly at the hair surface. The offset calculated at the surface position was also used to correct the depth of all spectra of the same profile.
For further data processing, the average spectra from surface point (Z = 0) to 30 μm of depth (Z = 30 μm) were calculated for each profile. These average spectra from 30 μm have been used in the analysis, taking into account the molecular information of hair in the cortex and the cuticle.
After the pre‐processing steps were completed, the corrected average spectra from 30 μm were processed using self‐coded software based on a hierarchical classification algorithm and Amide I band curve‐fitting methods operating in the Matlab environment (The Math Works Inc., U.S.A.).
The average spectra from axial z profiles of hair fibres were classified using Ward's clustering algorithm. This function calculates Euclidean distances between the spectra and groups them into clusters according to their similarities. This method of cluster analysis allows for the classification of hair fibres with a similar keratin structure. The results are shown as a dendrogram.
Curve fitting may be used when the resolved features of overlapping Raman bands are difficult to observe. In our analysis, curve‐fitting analysis was used to extract unresolved α‐helix and β‐sheet keratin conformations from the hair fibres spectra in the Amide I spectral band. This procedure was based on the least‐squares method using Gaussian and Lorentzian functions.
Statistical analysis
The results that followed a parametric distribution were subjected to statistical analysis using Student's t‐test, while those that did not follow a parametric distribution were subjected to statistical analysis using the Mann–Whitney test. P values from significance scores are presented in figures as follows: *P value < 0.05; **P value < 0.01; ***P value < 0.001.
Results
Hair straightening effect of active ingredients using gold standard
After application of either shampoos containing the actives, the placebo or water for the untreated hair, the hair samples were dried and straightened with a hair straightener. The anti‐frizz properties of the actives under test were analysed following exposure to high humidity. The results showed that the two tested actives (Active A and Active B) had different effects on hair length.
The hair samples treated with Active A showed a significant anti‐frizz effect, as demonstrated by the moderate decrease in hair length of 2.3% after extreme humidity exposure. Conversely, the hair samples that were left untreated or that were treated with the placebo were significantly impacted by the extreme humidity, with a reduction in hair length of 10.4% and 5.9% respectively. Active A induced a significant anti‐frizz effect relative to no treatment and the placebo (Fig. 3).
Figure 3.
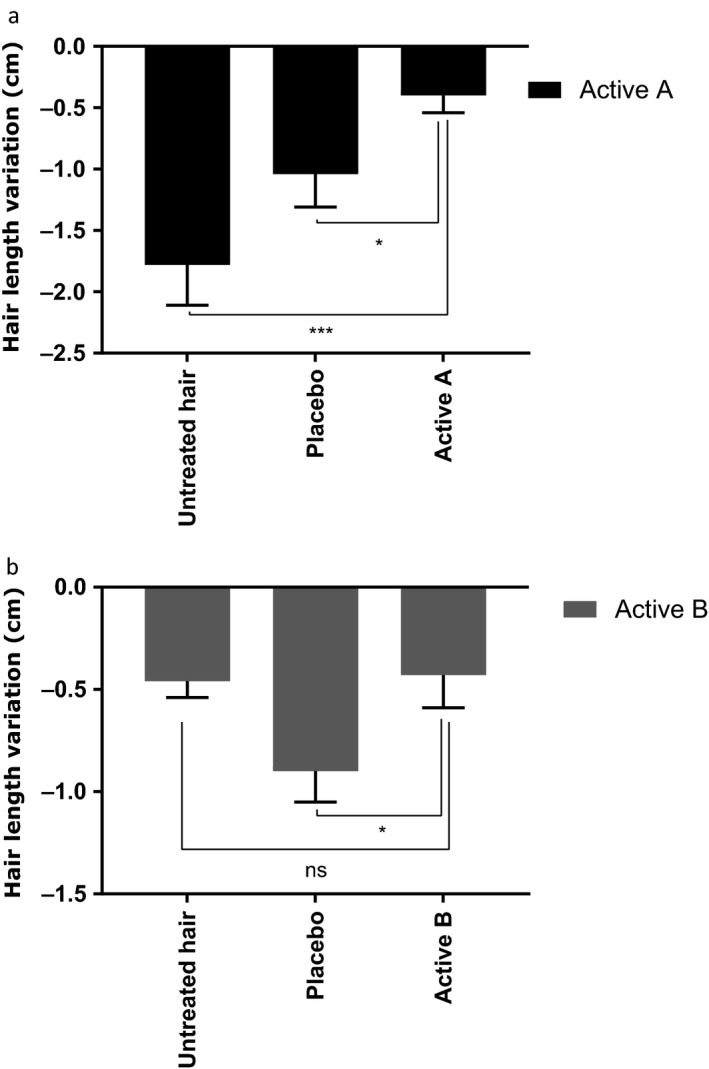
Hair length evaluation for the actives (A (label a) and B (label b)) vs. untreated condition and placebo. White values in the dark bars indicate the percentage of modulation of hair length in comparison with hair just after straightening. Student's statistical test, *P < 0.05; ***P < 0.001.
Secondly, the hair samples treated with Active B did not show a relevant straightening effect, with a similar decrease in hair length to that obtained without treatment. Hair length was 5% shorter with the placebo, which proves that no placebo effect was experienced in the experiment. Active B therefore did not show any straightening activity because it is as sensitive to extreme humidity as untreated hair (Fig. 3).
In this study, we demonstrated that Active A has an effective straightening effect, while Active B is ineffective. Active A contained hyaluronic acid, which is known to interact with keratin on the surface of the skin, inducing α‐helix to β‐sheet interconversion 23. We hypothesised that Active A would have an anti‐frizz property, owing to the interconversion of keratin structures. Finally, we decided that Active A would be named an “effective active” and Active B an “ineffective active”.
Evaluation of hair keratin conformation using confocal Raman spectroscopy
Spectral matching between standard spectrum of pure keratin and human hair fibres spectra
The comparison between Raman spectra of human hair fibres and pure keratin molecules allowed us to evaluate the contribution of the keratin molecule to the hair fibre spectrum and the assignment of specific keratin bands in the global spectrum of human hair. The corresponding Raman spectra are shown in Fig. 4. Table 1 summarises the Raman bands in the spectra of the overall hair fibres and of pure keratin with an approximate description of the vibrational modes (Table 1) 19, 20, 22, 24, 25.
Figure 4.
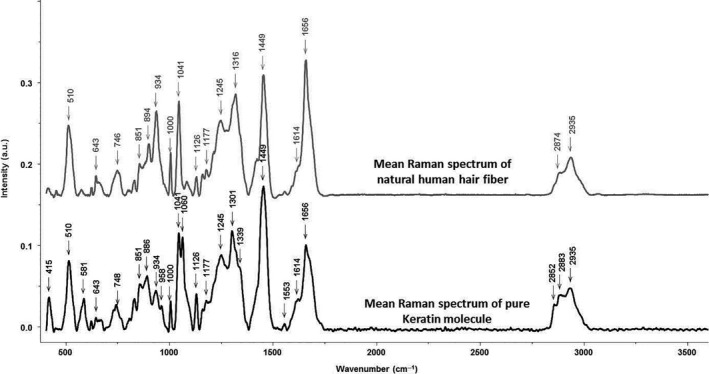
Comparison between mean Raman spectra of natural human hair fibres (grey) and pure keratin molecule (black) on the 400–3600 cm−1 spectral range
Table 1.
Peak assignment of the Raman spectra of human hair fibre and pure keratin
| Raman shift (cm−1) | Bands assignments | |
|---|---|---|
| Human Hair | Pure keratin | |
| 415 | (NCC) Ala | |
| 510 | 510 | Disulfide Cys (S‐S) strech |
| 581 | Disulfide Cys (S‐S) strech and Cys residues | |
| 643 | 643 | Tyr |
| 746 | 748 | Trp |
| 851 | 851 | Ring breathig mode of Tyr |
| 894 | 886 | Trp |
| 934 | 934 | Stretch C‐C skeletal a‐helix |
| 958 | CH3, CCH olefinic, CH2 rock | |
| 1000 | 1000 | Symmetric ring breathing of Phe |
| 1041 | 1041 | CH inplane bending of Phe |
| 1060 | CC skeletal, trans conformation | |
| 1126 | 1126 | CC skeletal, trans conformation, C‐N stretch |
| 1177 | 1177 | Tyr |
| 1245 | 1245 | Amide III (unordered) |
| 1316 | 1301 | CH2 |
| 1339 | CH2 bend, Trp | |
| 1449 | 1449 | CH2 bending mode |
| 1553 | Trp | |
| 1614 | 1614 | Tyr and Trp |
| 1656 | 1656 | C=O Amide I |
| 2852 | CH stretchnig (CH2, CH3) | |
| 2874 | 2883 | CH stretchnig (CH2, CH3) |
| 2935 | 2935 | CH stretchnig (CH2, CH3) |
The mean spectra of hair fibres and pure keratin were compared using the Mann–Whitney statistical test (P = 0.05), which allowed us to determine the most pertinent spectral features, which can be used as markers for detecting structural changes in keratin directly in the intact hair fibres spectra. Table 1 summarises the specific keratin bands (underlined in grey).
This spectral analysis showed that the Raman spectra of the hair fibre and pure keratin are very similar and that the Raman scatterings are informative to the structure of keratin proteins, particularly in the spectral window of 400–1800 cm−1. This result can be explained by the fact that hair fibres are mainly composed of keratin proteins. In the hair spectra, several peaks specific to keratin can be distinguished.
Evaluation of α‐helix, β‐sheet keratin and disulfide (S–S) cross‐link conformation in treated human hair using Raman spectroscopy
To investigate the influence of treatments using an active ingredient on keratin structure, five samples (S1, S2 S3, S4 and S5) of natural, light human hair were analysed directly using confocal Raman spectroscopy. To provide a negative and a positive control, we analysed S1 as untreated hair and S2 as hair smoothed using a straightening process. S3, S4 and S5 corresponded to the hair fibres treated with the placebo, with the efficient active (Active A) and with the ineffective active (Active B) respectively. After treatment, for each sample three hair fibres were selected and three axial Z profiles were recorded directly on the intact hair fibre from the surface to a depth of 30 μm. Taking into account the molecular information of keratin in the cortex and the cuticle, mean spectra for every analysis depth were generated. The first approach used in the spectral analysis was to estimate the spectral difference between the hair samples; to do so, the mean Raman spectra of the human hair fibre for each treatment were compared and the corresponding spectra were classified using a non‐supervised processing approach based on the hierarchical cluster analysis algorithm (HCA). This analysis was performed using the specific spectral windows of the keratin structure identified during the first stage. The results are shown in dendrogram (Fig. 5).
Figure 5.
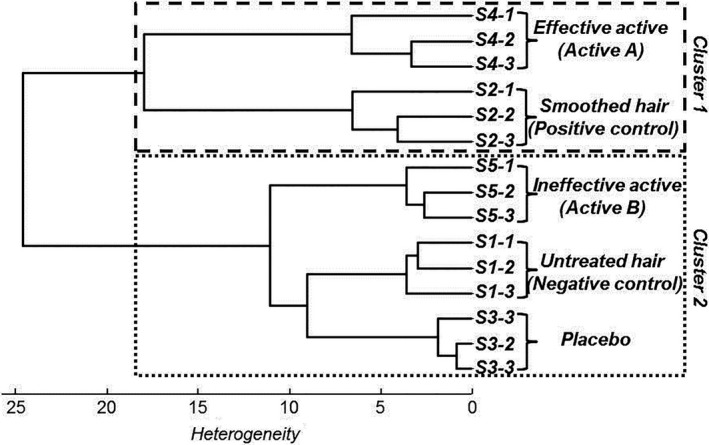
Hierarchical cluster analysis of five hair samples following treatment, using mean Raman spectra on specific spectral markers of keratin
The results of the spectral classification, for which the threshold heterogeneity was set to 18, allowed us to distinguish two spectral groups corresponding to the first cluster, which included S4 and S2 (the positive control and the hair treated with the effective active), and the second cluster, which included S1, S3 and S5 (the negative control, the placebo and the hair treated with the ineffective active).
To identify which molecular component of keratin the effective active has a significant effect on, the Raman spectra of the human hair fibre for each treatment were submitted to a statistical analysis to determine whether there were any significant differences between them.
The mean spectra for treated and untreated hair fibres were compared using the Mann–Whitney statistical test (P = 0.05), which allowed us to identify the most discriminant spectral features. The changes were located in the Amide I band for α–helix and β‐sheet keratin conformation and in the S–S stretching vibrations of the disulfide cross‐links bonds, which contributes to the physical and mechanical properties of keratin by forming cross‐linkages in its tertiary structure.
For keratin conformation, the Amide I band can be modeled by three Gaussian Lorentzian bands by using curve‐fitting analysis based on a least‐squares method (Fig. 6). The Amide I band was split into α‐helix, β‐sheet and unordered scatterings; in our study, analysis of the keratin conformation focused on prominent α‐helix and β‐sheet bands 26, 27. Three spectral markers were calculated on the mean spectra for the effective and ineffective actives: α‐helix band 1640–1660 cm−1, β‐sheet band 1660–1685 cm−1 and the α‐helix to β‐sheet band ratio. The results are shown in Fig. 7.
Figure 6.
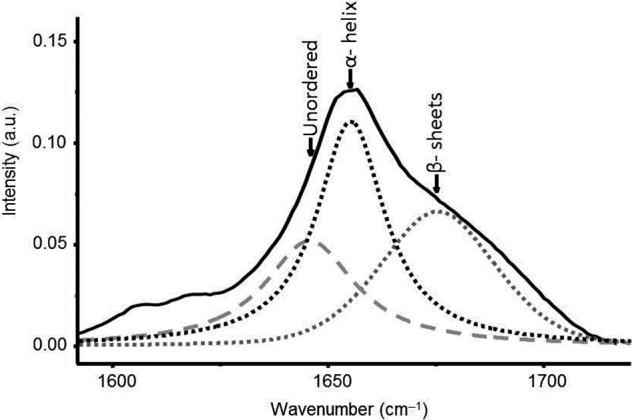
Curve fitting of Amide I band of hair spectrum (black continuous curve) on unordered (grey drawn curve), β‐sheets (grey dots curve) and α‐helix (black dots curve) bands
Figure 7.
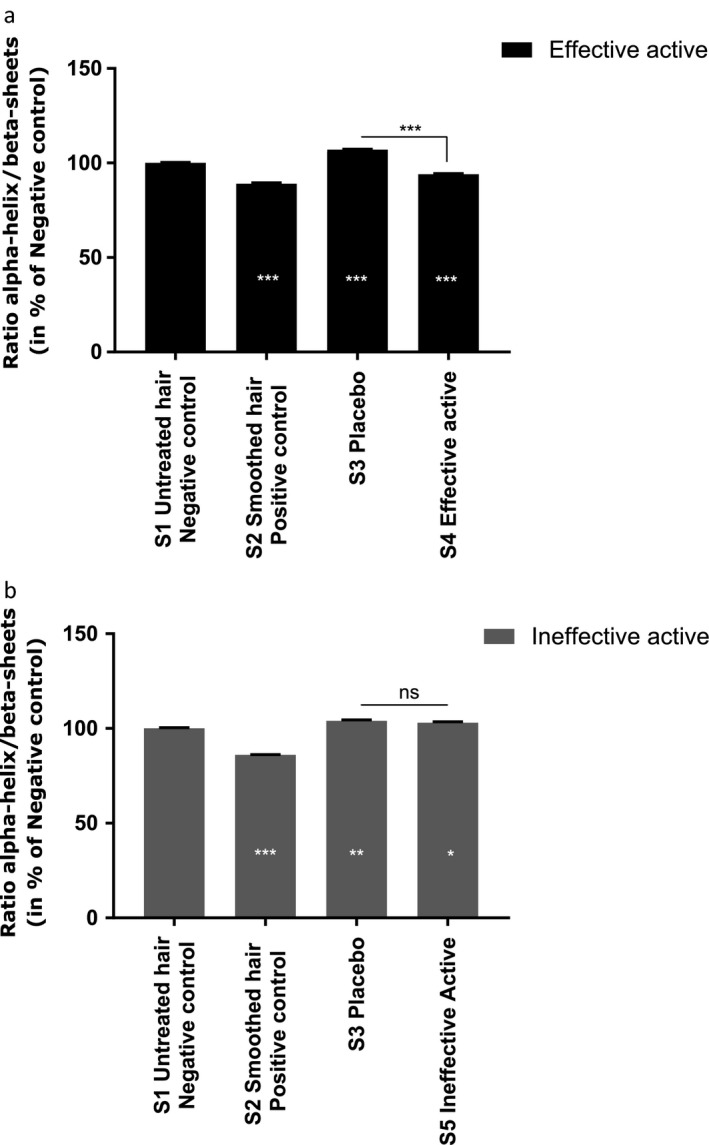
Evaluation of α‐helix to β‐sheets keratin bands ratio after hair treatment with effective active (Active A‐ label a) and ineffective active (Active B‐ label b). White values in the dark bars indicate the percentage of modulation in comparison with S1 Negative control. Student's statistical test, *P < 0.05; **P < 0.01; ***P < 0.001.
The results for the effective active show that the ratio of α‐helix to β‐sheet conformations decreased in S2 (positive control) and S4 (hair treated with the effective active) compared with the negative control (untreated hair). The modulation percentages were −11% and −6% respectively. However, for the ineffective active, this ratio increased in the placebo (S3) and in hair treated with the ineffective active (S5) compared with the negative control, with modulation percentages of +4% and +3% respectively. The α‐helix conformation dominated β‐sheet conformation in keratin structures for the placebo (S3) and for hair treated with the ineffective active (S5), but the opposite phenomenon was observed in the positive control and in hair treated with the effective active. Moreover, for both actives, the placebo had no effect on α‐helix and β‐sheet keratin conformation compared with the negative control.
These results confirmed that the effective active promotes β‐sheet keratin conformation compared with the negative control, which may explain its active molecular effect on keratin hair fibres, leading to a smoothing effect.
In order to better understand the molecular effects of the effective active on human hair smoothing, its effect on the disulfide cystine content in keratin structures was examined by analysing the intensity and area of the disulfide (S–S) cross‐links band, which contributes to the physical and mechanical properties of keratin. To compare this effect, the intensity of the disulfide band at 510 cm−1 were normalised, and the area was calculated. The results are shown in Fig. 8. Differences in the observed disulfide (S–S) band decreased significantly in hair fibres from both the positive control and the hair treated with the effective active. The intensity of the disulfide cystine content in keratin hair fibres was reduced by −10% and −16% respectively for the positive control and effective active, while it decreased by only −4% for the placebo. These results suggest that the effective active acts on the tertiary structure of keratin by decreasing the intensity of covalent disulfide (S–S) cross‐links bands in cystine.
Figure 8.
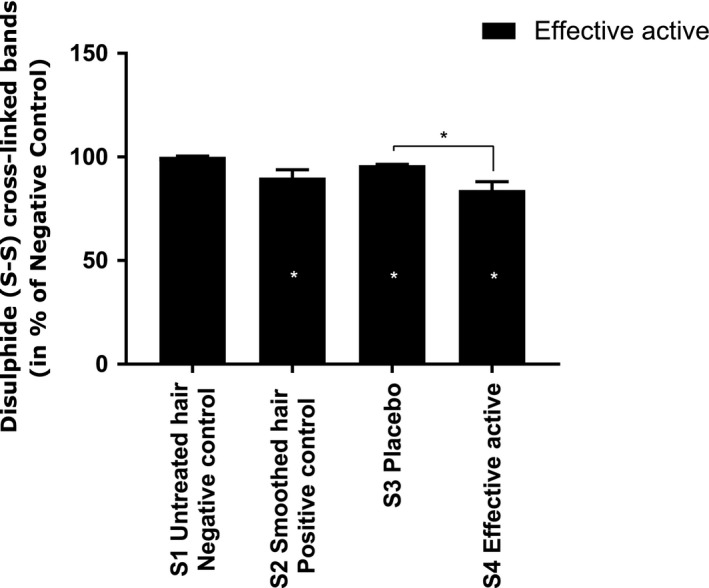
Evaluation of disulfide (S–S) band after hair treatment with effective active (Active A). White values in the dark bars indicate the percentage of modulation in comparison with S1 Negative control. Mann Whitney statistical test, *P < 0.05.
Indeed, disulfide bonds are important for the stabilisation of folding structure of keratin. The stability of S‐S disulfide bonds in keratin can be assessed by calculating the conformational order of disulfide bonds in the 474–578 cm−1 spectral range which decomposed into three Raman bands: the gauche–gauche–gauche conformation at 493 cm−1, the gauche‐gauche‐trans conformation at 515 cm−1 and trans‐gauche‐trans conformation at 538 cm−1. The ratio of the gauche‐gauche‐gauche conformation to the total disulfide bonds is considered a criterion for the stability of disulfide bonds in keratin 28.
This ratio was calculated for the negative control and effective active and the obtained values are respectively (0.28 ± 0.009) and (0.26 ± 0.008), which shows no significant difference between the two groups.
Discussion
The use of a gold standard — as we used — is common in hair care research and enables researchers to establish preliminary information about the effectiveness of an active ingredient using an ex vivo hair samples model. In this study, the evaluation of a potential anti‐frizz effect of two actives provided interesting information which allowed us to distinguish them based on their effectiveness. This initial evaluation allowed us to discriminate the two tested actives in order to show that one was effective in improving hair smoothing and increasing resistance to humidity, while the other appeared to be ineffective in this regard. The effective active contained hyaluronic acid, which is described as being able to interact with keratin in stratum corneum, thereby inducing the interconversion of keratin conformations from α‐helix to β‐sheet conformations 23. As has already been described in the literature, mechanical hair straightening causes the interconversion of keratin conformation from α‐helix to β‐sheet, which leads to hair smoothing and ultimately gives an anti‐frizz effect. Regarding our results, the next step in the study was to evaluate both the effective and the ineffective active ingredients on hair keratin structure and conformation in order to identify the mode of action of the effective active on the hair through which it confers resistance to high humidity.
To that end, we used confocal Raman spectroscopy, which is sufficiently sensitive to reflect small molecular and structural variations in hair keratin. The standardisation of the experimental conditions and spectral acquisition parameters was important to ensure the reproducibility of the spectra. Consequently, only spectra recorded for the same batch of human hair and under the same treatment conditions were compared.
The first step was to determine and compare the reference Raman spectra of human hair fibres and pure keratin molecules in order to ensure that the Raman signal of keratin was present in the hair spectra. Our results show that the Raman scatterings are informative to the structure of the keratin protein, particularly in the spectral window of 400–1800 cm−1. Consequently, several spectroscopic markers specific to keratin could be distinguished, which allowed us to track the structural modification of keratin directly on intact human hair fibres.
To continue this process, we estimated the spectral differences between five human hair samples that had been subjected to different treatments. The spectral comparison was performed using the specific spectral markers of the keratin structure that had been identified during the first stage. The results showed that the keratin spectral signature of the hair treated with the effective active ingredient was very similar to that of the positive control (smoothed hair) and that the keratin spectral signature of the hair treated with the placebo and with the ineffective active was very similar to that of the negative control (untreated hair). This suggests that the effective active had a smoothing effect on the hair fibres, compared with the placebo and the ineffective active. Moreover, we think that the effective active modified the structure of hair keratin, making it identical to that of smoothed hair. The need to better understand the effect of the effective active on the molecular structure of keratin led us to evaluate primarily the Amide I and the disulfide (S–S) bands, which reflect keratin conformational and tertiary structural changes.
Our results demonstrated that the effective active was able to significantly decrease the ratio of α‐helix to β‐sheet keratin conformation, similar to in the smoothed positive control. Conversely, the ineffective active and the placebo increased this ratio, thereby reinforcing the interesting result obtained for the effective active. Similarly to the results for keratin conformation, the effective active decreased the intensity of covalent disulfide (S–S) cross‐links bands in cystine. Through this study we were able to prove that the effective active was able to confer hair smoothing with resistance to humidity by modifying structural conformation of hair.
Conclusions and perspectives
In this study, confocal Raman spectra were acquired from intact human hair fibres. The full informational content of these spectra were correlated to keratin hair chemistry and structural organisation through multivariate data analysis. We demonstrated that confocal Raman spectroscopy is a suitable tool for in situ identifying the molecular action of hair care products on intact human hair fibres. In our case, we highlighted the smoothing effect of the effective active to its simultaneous activity on the conformation and tertiary structure of keratin.
Raman spectroscopy is a technique with great analytical potential to evaluate the molecular effect of cosmetics ingredients used in human hair care. Raman analysis is performed directly on intact hair fibres by preserving the sample integrity. This technique offers the opportunity to study other important aspects related to the effectiveness of hair cosmetics, such as hydration, oxidation, active penetration and bioavailability. Thanks to the development of portable Raman probes, Raman spectroscopy can be used effectively in vivo and in real time to track structural changes in keratin in human hair fibres. This makes the technique suitable for routine application in cosmetic research.
Acknowledgements
The authors would like to thanks Dermscan (France) for their great help in the completion of this paper.
References
- 1. Kulessa, H. , Turk, G. and Hogan, B.L. Inhibition of Bmp signaling affects growth and differentiation in the anagen hair follicle. EMBO J. 19, 6664–6674 (2000). [DOI] [PMC free article] [PubMed] [Google Scholar]
- 2. William, D. , James, T.B and Elston D.. Andrews’ diseases of the skin In: Clinical Dermatology, 12th edn (Saunders Elsevier , ed.), pp. 5–6. Saunders Elsevier, Philadelphia: (2005). [Google Scholar]
- 3. Robbins, C.R. Chemical and Physical Behavior of Human Hair, 5th edn Springer, New York: (2012). [Google Scholar]
- 4. Yang, F.C. , Zhang, Y. and Rheinstadter, M.C. The structure of people's hair. PeerJ 2, 619–638 (2014). [DOI] [PMC free article] [PubMed] [Google Scholar]
- 5. Cruz, C.F. , Martins, M. , Egipto, J. , Osório, H. , Ribeiro, A. and Cavaco‐Paulo, A. Changing the shape of hair with keratin peptides. RSC Adv. 7, 51581–51592 (2017). [Google Scholar]
- 6. Fedorkova, M.V. , Brandt, N.N. , Chikishev, A.Y. et al Photoinduced formation of thiols in human hair. J. Photochem. Photobiol., B 164, 43–48 (2016). [DOI] [PubMed] [Google Scholar]
- 7. Kadir, M. , Wang, X. , Zhu, B. , Liu, J. , Harland, D. and Popescu, C. The structure of the “amorphous” matrix of keratins. J. Struct. Biol. 198, 116–123 (2017). [DOI] [PubMed] [Google Scholar]
- 8. Singh, R.S. , Palmer, J.C. , Pudney, P.D. et al Molecular modeling and structural characterization of a high glycine‐tyrosine hair keratin associated protein. Phys. Chem. Chem. Phys. 19, 8575–8583 (2017). [DOI] [PubMed] [Google Scholar]
- 9. Turner, E.A. , Stenson, A.C. and Yazdani, S.K. HPLC‐MS/MS method for quantification of paclitaxel from keratin containing samples. J. Pharm. Biomed. Anal. 139, 247–251 (2017). [DOI] [PMC free article] [PubMed] [Google Scholar]
- 10. Volkov, V. and Cavaco‐Paulo, A. Enzymatic phosphorylation of hair keratin enhances fast adsorption of cationic moieties. Int. J. Biol. Macromol. 85, 476–486 (2016). [DOI] [PubMed] [Google Scholar]
- 11. Zhang, Y. , Alsop, R.J. , Soomro, A. , Yang, F.C. and Rheinstadter, M.C. Effect of shampoo, conditioner and permanent waving on the molecular structure of human hair. PeerJ 3, 1296–1312 (2015). [DOI] [PMC free article] [PubMed] [Google Scholar]
- 12. Zhang, G. , Senak, L. and Moore, D.J. Measuring changes in chemistry, composition, and molecular structure within hair fibers by infrared and Raman spectroscopic imaging. J. Biomed. Opt. 16, 056009–7 (2011). [DOI] [PubMed] [Google Scholar]
- 13. Kim, K.S. , Shin, M.K. and Park, H.K. Effects of scalp dermatitis on chemical property of hair keratin. Spectrochim. Acta A. Mol. Biomol. Spectrosc. 109, 226–231 (2013). [DOI] [PubMed] [Google Scholar]
- 14. Lau, K. , Hedegaard, M.A. , Kloepper, J.E. , Paus, R. , Wood, B.R. and Deckert, V. Visualization and characterisation of defined hair follicle compartments by Fourier transform infrared (FTIR) imaging without labelling. J. Dermatol. Sci. 63, 191–198 (2011). [DOI] [PubMed] [Google Scholar]
- 15. Manheim, J. , Doty, K.C. , McLaughlin, G. and Lednev, I.K. Forensic hair differentiation using attenuated total reflection Fourier transform infrared (ATR FT‐IR) spectroscopy. Appl. Spectrosc. 70, 1109–1117 (2016). [DOI] [PubMed] [Google Scholar]
- 16. Pienpinijtham, P. , Thammacharoen, C. , Naranitad, S. and Ekgasit, S. Analysis of cosmetic residues on a single human hair by ATR FT‐IR microspectroscopy. Spectrochim. Acta A. Mol. Biomol. Spectrosc. 197, 230–236 (2018). [DOI] [PubMed] [Google Scholar]
- 17. Robotham, C. and Tikhomirov, S.V. Possibilities for the application of modern IR Fourier microscopes in forensic and criminalistic laboratory analysis. Sud. Med. Ekspert. 55, 50–52 (2012). [PubMed] [Google Scholar]
- 18. Kuzuhara, A. Internal structural changes in keratin fibres resulting from combined hair waving and stress relaxation treatments: a Raman spectroscopic investigation. Int. J. Cosmet. Sci. 38, 201–209 (2015). [DOI] [PubMed] [Google Scholar]
- 19. Kuzuhara, A. Analysis of structural change in keratin fibers resulting from chemical treatments using Raman spectroscopy. Biopolymers 77, 335–344 (2005). [DOI] [PubMed] [Google Scholar]
- 20. Kuzuhara, A. Raman spectroscopic analysis of L‐phenylalanine and hydrolyzed eggwhite protein penetration into keratin fibers. J. Appl. Polym. Sci. 122, 2680–2689 (2011). [Google Scholar]
- 21. Kuzuhara, A. A Raman spectroscopic investigation of the mechanism of the reduction in hair with thioglycerol and the accompanying disulphide conformational changes. Int. J. Cosmet. Sci. 40, 34–43 (2017). [DOI] [PubMed] [Google Scholar]
- 22. Kuzuhara, A. Analysis of structural changes in bleached keratin fibers (black and white human hair) using Raman spectroscopy. Biopolymers 81, 506–514 (2006). [DOI] [PubMed] [Google Scholar]
- 23. Witting, M. , Boreham, A. , Brodwolf, R. , Vavrova, K. , Alexiev, U. , Friess, W. and Hedtrich, S. Interactions of hyaluronic acid with the skin and implications for the dermal delivery of biomacromolecules. Mol. Pharm. 12, 1391–1401 (2015). [DOI] [PubMed] [Google Scholar]
- 24. Shin, M.K. , Kim, T.I. , Kim, W.S. , Park, H.K. and Kim, K.S. Changes in nail keratin observed by Raman spectroscopy after Nd:YAG laser treatment. Microsc. Res. Tech. 80, 338–343 (2016). [DOI] [PubMed] [Google Scholar]
- 25. De Faria, D.L.A. and De Souza, M. Raman spectra of human skin and nail excited in the visible region. J. Raman Spectrosc. 30, 169–171 (1999). [Google Scholar]
- 26. Nishikawa, N. , Tanizawa, Y. , Tanaka, S. , Horiguchi, Y. and Asakura, T. Structural change of keratin protein in human hair by permanent waving treatment. Polymer 39, 3835–3840 (1998). [Google Scholar]
- 27. Gniadecka, M. , Faurskov Nielsen, O. , Christensen, D.H. and Wulf, H.C. Structure of water, proteins, and lipids in intact human skin, hair, and nail. J. Invest. Dermatol. 110, 393–398 (1998). [DOI] [PubMed] [Google Scholar]
- 28. Choe, C. , Schleusener, J. , Lademann, J. and Darvin, M.E. Keratin‐water‐NMF interaction as a three layer model in the human stratum corneum using in vivo confocal Raman microscopy. Sci. Rep. 7, 1–13 (2017). [DOI] [PMC free article] [PubMed] [Google Scholar]


