

Abstract
We investigated the effect of efavirenz on the activities of cytochrome P450 (CYP)1A2, CYP2A6, xanthine oxidase (XO), and N‐acetyltransferase 2 (NAT2), using caffeine as a probe. A single 150 mg oral dose of caffeine was administered to healthy volunteers (n = 58) on two separate occasions; with a single 600 mg oral dose of efavirenz and after treatment with 600 mg/day efavirenz for 17 days. Caffeine and its metabolites in plasma and urine were quantified using liquid chromatography/tandem‐mass spectrometry. DNA was genotyped for CYP2B6*4 (785A>G), CYP2B6*9 (516G>T), and CYP2B6*18 (983T>C) alleles using TaqMan assays. Relative to single‐dose efavirenz treatment, multiple doses of efavirenz decreased CYP1A2 (by 38%) and increased CYP2A6 (by 85%) activities (P < 0.05); XO and NAT2 activities were unaffected. CYP2B6*6*6 genotype was associated with lower CYP1A2 activity following both single and multiple doses of efavirenz. No similar association was noted for CYP2A6 activity. This is the first report showing that efavirenz reduces hepatic CYP1A2 and suggesting chronic efavirenz exposure likely enhances the elimination of CYP2A6 substrates. This is also the first to report the extent of efavirenz–CYP1A2 interaction may be efavirenz exposure‐dependent and CYP2B6 genotype‐dependent.
Study Highlights.
WHAT IS THE CURRENT KNOWLEDGE ON THE TOPIC?
☑ Efavirenz‐based human immunodeficiency virus (HIV) therapy is associated with complex and often unpredictable drug–drug interactions, potentially compromising efficacy and toxicity of coadministered drugs. Although efavirenz causes in vivo induction and/or inhibition of selected drug‐metabolizing enzymes (e.g., cytochrome P450 (CYP)2B6, CYP2C8, CYP2C9, CYP2C19, and CYP3A), its effect on other enzymes, such as CYP1A2 and CYP2A6, is unknown.
WHAT QUESTION DID THIS STUDY ADDRESS?
☑ This work tested the effect of efavirenz on the in vivo hepatic activities of four enzymes: CYP1A2, CYP2A6, xanthine oxidase, and N‐acetyltransferase 2. The impact of efavirenz exposure and genetic variation in CYP2B6 expression on the magnitude of interaction was also tested. The plasma and urinary disposition of a single 150 mg oral dose of caffeine was profiled in healthy volunteers (N = 58) as in vivo probes following a single 600 mg oral dose of efavirenz and after chronic efavirenz treatment for 17 days.
WHAT DOES THIS STUDY ADD TO OUR KNOWLEDGE?
☑ This is the first clinical study showing that efavirenz reduces hepatic CYP1A2 and suggesting chronic efavirenz exposure likely enhances the elimination of CYP2A6 substrates. This is also the first to report the extent of efavirenz–CYP1A2 interaction is CYP2B6 genotype‐dependent.
HOW MIGHT THIS CHANGE CLINICAL PHARMACOLOGY OR TRANSLATIONAL SCIENCE?
☑ Concomitant use of CYP1A2 and CYP2A6 substrate drugs with efavirenz‐based HIV therapy will require careful monitoring to minimize the risk of adverse drug effects or loss of efficacy. Moreover, CYP2B6 genotypes associated with increased efavirenz exposure may be particularly at increased risk for adverse drug interactions involving CYP1A2.
The nonnucleoside human immunodeficiency virus (HIV)‐1 reverse transcriptase inhibitor efavirenz, in combination with two nucleoside/nucleotide reverse transcriptase inhibitors, has been the preferred first‐line regimen for over 15 years for treatment‐naive HIV‐infected adults 1 and children.2 Although regimens containing efavirenz are considered alternative therapy since 2015 due to the increased effectiveness and safety of newer agents, such as integrase inhibitors,3 the World Health Organization continues to recommend efavirenz‐based therapies as cost‐effective and convenient first‐line therapy in resource‐limited countries with pandemic HIV.4 However, the use of efavirenz is associated with numerous and often unpredictable pharmacokinetic drug–drug interactions (DDIs).5 These DDIs are of major clinical concerns as they potentially increase the risk for loss of efficacy or adverse effects of those drugs coadministered with efavirenz. Thus, understanding the mechanisms of these DDIs is crucial to identify, predict, and manage them.
Most efavirenz‐mediated DDIs can be explained by efavirenz's ability to induce drug disposition genes via activation of the constitutive androstane receptor (CAR)6 and pregnane X receptor (PXR),7 nuclear receptors that regulate the transcription of drug‐metabolizing enzymes and transporters.8 As a result, chronic administration of efavirenz increases its own elimination (“autoinduction” of metabolism),6, 9 and those of other drugs through induction of drug‐metabolizing enzymes, including cytochrome P450 (CYP)2B6, CYP2C19, and CYP3A.10, 11, 12 However, not all DDIs with efavirenz are due to induction of drug disposition genes. Our in vitro data show that efavirenz directly inhibits certain enzymes at therapeutically relevant concentrations (e.g., CYP2B6, CYP2C8, CYP2C19, and CYP2C9),13 with reduction in the elimination of CYP2C8 and CYP2C9 substrates in vivo 14, 15 and efavirenz being a mixed inhibitor/inducer of CYP2B616 and CYP2C19.11 The potential in vivo effect of efavirenz on the activity of other drug metabolizing enzymes, such as CYP1A2, CYP2A6, xanthine oxidase (XO), and N‐acetyltransferase 2 (NAT2), is not fully investigated. In HIV/tuberculosis‐coinfected patients, model‐predicted exposure of isoniazid exposure was marginally reduced by efavirenz (by 29%) in those who are fast acetylators, but no effect was observed in slow acetylators.17 However, these patients were receiving multiple medications, making it difficult to attribute the observed effect to efavirenz alone. Using human liver microsomal preparations and/or expressed enzymes, we have shown that efavirenz does not inhibit/inactivate the activities of CYP1A2 and CYP2A6.13 Although human liver microsomals are important in vitro experimental tools to estimate the estimation and prediction of inhibition DDI potential of a drug candidate, this approach would not be appropriate to test the effect of efavirenz on gene expression (e.g., due to enzyme induction). Appropriate in vitro models (e.g., cell lines or human hepatocytes) or in vivo studies using probe substrates are required to exclude the potential effect of efavirenz on CYP1A2 and CYP2A6.
Efavirenz is mainly metabolized by hepatic CYP2B6.18 Two gene variants (CYP2B6*6 and CYP2B6*18) produce higher efavirenz exposure after standard dosing in patients with HIV.19 The extent of efavirenz autoinduction of metabolism is influenced by CYP2B6 genetic variants.20 Recent evidence indicates that the extent of efavirenz‐mediated DDIs with such CYP3A substrates as lumefantrine21 and levonogestrel22 also depends on the variability in CYP2B6 gene expression, suggesting that variable efavirenz exposure due to functionally relevant CYP2B6 genetic variants and other factors may be an important determinant of the magnitude of DDIs.
The main objectives of this study were to test whether (i) efavirenz alters the activity of CYP1A2 in healthy volunteers and (ii) the magnitude of the alteration correlated with genetic variation in CYP2B6 expression. Caffeine is extensively metabolized in humans with at least 17 metabolites identified in the urine following caffeine administration.23, 24, 25 Approximately 80–90% of the total caffeine elimination in humans is mediated via hepatic CYP1A2‐mediated demethylation to paraxanthine,25, 26 and caffeine is a well‐established and validated probe drug for CYP1A2. The secondary objective of this study is to explore the effect of efavirenz on the activities of CYP2A6, XO, and NAT2. CYP2A6, XO, and NAT2 are involved in the formation of caffeine metabolites.24, 25 Although these enzymes catalyze minor metabolic pathways, which makes it difficult to validate against oral clearance of caffeine, urinary metabolic ratios of caffeine have been widely used as convenient markers of CYP1A2, CYP2A6, XO, and NAT2 activities in population, epidemiological, and DDI studies.24, 25, 27 Activities of hepatic CYP1A2, CYP2A6, XO, and NAT2 were profiled in healthy volunteers using plasma and urinary caffeine and metabolites as an in vivo probes following the administration of caffeine on two occasions: with a single 600 mg oral dose of efavirenz and after chronic efavirenz (600 mg/day) treatment for 17 days.
Materials and Methods
Study subjects
Healthy male and female volunteers (age, 18–49 years old; and body mass index, 20–32 kg/m2) were recruited to participate in this study. Potential subjects underwent a pre‐enrollment screening examination (within a maximum of 6 weeks prior to enrollment into the study) for any medical abnormalities, which included physical examination, medical history, and standard clinical laboratory tests. Details of inclusion and exclusion criteria are described in our previous publications.11, 28, 29, 30 During the screening, a blood sample (~10 mL) was obtained from each subject to extract genomic DNA for genotyping purposes. The Indiana University Institutional Review Board approved the protocol and the study was conducted at the Indiana University Clinical Research Center. All participants gave written informed consent. The study was registered at http://www.clinicaltrials.gov (ClinicalTrials.gov number NCT00668395).
Study design
This study used a two‐session sequential design to characterize efavirenz autoinduction, pharmacogenetics, and drug interactions (Figure S1 ). To determine efavirenz‐mediated changes in hepatic drug metabolizing enzyme activity, volunteers received a cocktail probe drugs orally with water on two occasions: concomitantly with a single 600 mg oral dose of efavirenz and again at the end of 17‐day treatment with 600 mg efavirenz daily. On day 1, the participants were admitted to the hospital at ~7 am, after an overnight fast. Following a predose blood sample, each participant received a single 600‐mg oral dose of efavirenz (Sustiva; Bristol‐Myers Squibb, Princeton, NJ) with 240 mL water on an empty stomach. One hour later, a cocktail probe drugs was administered orally with water to assess potential drug interactions: 150 mg caffeine, 250 mg tolbutamide, 20 mg omeprazole, and 1 mg of midazolam syrup. Although high doses of omeprazole can induce CYP1A2 after chronic administration, the small single dose (20 mg) used in this study is not expected to alter CYP1A2 activity. In fact, there is no mutual pharmacokinetic interaction of caffeine and omeprazole (or among the other components of the cocktail used here), and these probe drugs (including caffeine and omeprazole) have been validated for simultaneous use without fear of interaction and, thus, widely used in several CYP phenotyping cocktails. Venous blood samples (10 mL) were collected from an indwelling catheter 0.5, 1, 1.5, 2, 2.5, 3, 4, 6, 8, 10, 12, 16, and 24 hours following efavirenz administration while participants were in the hospital and at 48, 72, and 144 hours as outpatients. All urine voided during the 24 hours after efavirenz administration was collected in fractions. Plasma was separated by centrifugation for 20 minutes at 3,000 rpm within an hour of collection and two 10‐mL urine aliquots were saved from each timepoint after the total urine volume was recorded. Plasma and urine samples were immediately stored at −80°C until analysis. The volunteers began chronic oral efavirenz (600 mg/day) in the evening, from day 7 to day 23. On the morning of day 24, participants were again admitted to the hospital. After predose blood collection, participants received their final dose of oral efavirenz (600 mg) and 1 hour later, a cocktail probe of drugs was administered as on day 1. All other procedures and sample processing were identical to day 1. We present here the data that relate to efavirenz interaction with caffeine metabolism as marker of CYP1A2, CYP2A6, XO, and NAT2.
DNA genotyping
The CYP2B6 gene is highly polymorphic, with over 38 alleles reported to date (https://www.pharmvar.org/gene/CYP2B6). The CY2B6*6 allele, which consists of the CYP2B6*4 and CYP2B6*9 variants on the same haplotype, has functional relevance and occurs at high frequency across ethnically and geographically diverse populations.19 In addition, the CYP2B6*18 allele, which does not express functional protein, is frequent in the black population (4–12%).19 Briefly, genomic DNA was extracted from whole blood (QIAamp DNA Mini Kit; Qiagen, Valencia, CA). Polymerase chain reaction was performed on the Quant Studio 12K Flex real‐time polymerase chain reaction instrument blocks for 96‐well plates. CYP2B6*9, rs3745274 (516G>T, Q172H); CYP2B6*4, rs2279343 (785A>G, K262R); and CYP2B6*18, rs28399499 (983T>C, I328T) were genotyped using TaqMan Assay‐Reagent Allelic Discrimination Kits (Applied Biosystems, Foster City, CA) according to the supplier's instructions. Genotype groups considered for the analysis were normal metabolizers (*1/*1 genotype, n = 36), intermediate metabolizers (*1/*6 genotype, n = 15), and slow metabolizers (*6/*6* genotype, n = 5 and *1/*18 genotype, n = 1). The additional variants in the CYP2B6 gene and other CYP variants that were genotyped in these samples have been previously published.28, 30
Measurement of drugs and metabolites in plasma and urine
Plasma samples from single and multiple doses were assayed in the same run. Similarly, urine samples from single and multiple doses were run together. Plasma and urine samples were run separately as the number of analytes tested and the methods used were slightly different.
Chemicals
Caffeine (1,3,7 TMX), 1‐methylxanthine (1 MX), 1‐methyluric acid (1 MU), 1,7‐dimethyluric acid (1,7 DMU), 5‐acetylamino‐6‐formylamino‐3‐methyluracil (AFMU), and 1,7‐dimethylxanthine (1,7 DMX) or paraxanthine and theobromine and theophylline were purchased from Sigma–Aldrich (St. Louis, MO). Efavirenz, 8‐hydroxyefavirenz, 8,14‐dihydroxyefavirenz, 7‐hydroxyefavirenz, and β‐glucuronidase were purchased from Toronto Research Chemicals (North York, Ontario, Canada). All other chemicals and solvents were high‐performance liquid chromatography (HPLC) grade or the highest quality commercially available.
Plasma extraction and quantification of efavirenz, caffeine, and their respective metabolites
Plasma (250 μL) was mixed with 250 μL of 0.2 M sodium acetate (pH = 5), 12.5 μL of 600 mM sodium azide, and 25 μL of β‐glucuronidase (1,000 U/mL), and incubated at 37°C for 18 hours to hydrolyze circulating glucuronide conjugates of efavirenz. Efavirenz‐d4 (30 μL of 1 μg/mL) and 1 μg/mL acetaminophen were added as internal standards and the sample vortex mixed. Hydrochloric acid (250 μL of 0.1 M) and 6 mL of ethyl acetate/hexane (50/50, v/v) was added and the sample mixture shaken for 10 minutes and then centrifuged at 3,600 rpm for 10 minutes at 0°C (Beckman Coulter, Schaumburg, IL). The organic layer was evaporated to dryness and reconstituted in 120 μL of 50% mobile phase A and 50% mobile phase B. Aliquot (25 μL) was injected onto the HPLC–tandem mass spectrometry system.
Caffeine and its metabolites were quantified on an API 3200 triple‐quadrupole mass spectrometer (Applied Biosystem/MDS Sciex, Foster City, CA) equipped with a turbo ion spray source. The HPLC system consist of two LC‐20AD pumps, SIL‐20AHT UFLC auto‐sampler, DGU‐20A3 degasser, and a CBM‐20A controller (Shimadzu, Columbia, MD). The chromatographic separation was achieved using a Restek C8 (250 × 4.6 mm, 5 μm particle size) column (Bellefonte, PA). Before and after each injection, the sampling needle was washed with acetonitrile/water (75%/25%, v/v). Mobile phase A (methanol: formic acid (0.1% in water; 1/99, v/v)) and mobile phase B (methanol: formic acid (0.1% in water; 99/1, v/v)) was pumped at 0.8 mL/minute using a gradient elution described elsewhere.30 The mass spectrometry optimization was achieved via adjustment of both the compound‐dependent and instrument‐dependent parameters for caffeine, theophylline, paraxanthine, and acetaminophen (internal standard) in positive mode. The analytes were optimized at a source temperature of 400°C in positive mode under unit resolution for quadrupole 1 and 3 and were given a dwell time of 60 ms and a setting time of 700 ms. Gas pressures for all analytes, including the internal standards, were optimized as described previously.30 Multiple reaction monitoring (MRM) at mass to charge number ratio (m/z) of 195.12/138.12, 181.13/124.20, 181.13/124.2, and 152.13/110.20 for caffeine, theophylline, paraxanthine, and acetaminophen (internal standard), respectively, in positive mode was used. Theophylline and paraxanthine were chromatographically separated. Data acquisition and processing were performed using Analyst software. The lower limit of quantification was 1 ng/mL for all analytes and was linear over a wide range of therapeutically relevant concentrations. The intraday and interday variabilities were <20%.
Efavirenz, 8‐hydroxyefavirenz, 7‐hydroxyefavirenz, and 8,14‐dihydroxyefavirenz were quantified by liquid chromatography tandem mass spectrometry in negative mode using efavirenz‐d4 as an internal standard, as detailed in our previous publication.30 MRM at m/z of 313.97/244.01, 329.98/210.0, 329.98/257.89, 345.91/262.0, and 318.01/247.95 was used to measure first and third quadrupole (Q1/Q3) transitions for efavirenz, 8‐hydroxyefavirenz, 7‐hydroxyefavirenz, 8,14‐dihydroxyefavirenz, and efavirenz‐d4 (internal standard), respectively, in negative mode. Metabolites (8‐ and 7‐hydroxyefavirenz) were separated chromatographically.
Urine extraction and quantification
Urine (250 μL) was spiked with 30 μL of internal standard (nevirapine, 500 ng/mL). Each sample was extracted by adding 300 μL of acetic acid (0.1% in water) and 6 mL of dichloromethane: isopropyl alcohol (85:15), vortex mix for 20 seconds, centrifuged at 3,600 rpm for 5 minutes at 10°C. The aqueous layer was decanted by suction and the organic layer evaporated using speed vacuum. Residue was reconstituted in 100 μL of 99% ammonium acetate (20 mM, pH = 4.8)/1% methanol and vortex mix for 15 seconds. An aliquot (50 μL) was injected onto the liquid chromatography tandem mass spectrometry system described above for plasma. Analytes were separated on a Zorbax Eclipse XDB‐C8 column (4.6 × 150 mm, 3.5 μM; Agilent Technologies, Santa Clara, CA). The gradient mobile phase was pumped at a flow rate of 0.5 mL/minute and consist of phase A (99% ammonium acetate (20 mM, pH = 3.5)/1% methanol (v/v)) and phase B (10% ammonium acetate (20 mM, pH = 3.5)/90% methanol (v/v)). MRM at m/z 195.12/138.12 for caffeine, 181.13/124.2 for theophylline, 181.13/124.2 for paraxanthine, 181/138 for theobromine, 166/149 for 1‐methylxanthine, 183/105 1‐methyluric acid, 195/180 for 1,7‐dimethyluric acid, 225/197 for 5‐acetylamino‐6‐formylamino‐3‐methyluracil (AFMU), and 152.1/110.2 for acetaminophen (internal standard) was used to measure first and third quadrupole (Q1/Q3) transitions, in positive mode. Theophylline, paraxanthine, and theobromine peaks were separated chromatographically.
Pharmacokinetic analyses
Pharmacokinetic parameters were estimated using WinNonlin software (version 5.01; Pharsight, Mountain View, CA). Area under the plasma concentration vs. time curve (AUC) from time zero to the time of the last quantifiable concentration (AUC0–t) was estimated using the linear and logarithmic trapezoidal rule for the respective up and down portions of the curve. The elimination rate constant (λz) was determined by linear regression analysis of the terminal portion of the log concentration vs. time curve. The AUC from zero to infinity (AUC0–∞) was calculated as the sum of C t/λz and AUC0–t, where C t was the last measured concentration. The terminal elimination half‐life (t1/2) was calculated as the quotient of 0.693 and λz. The maximum plasma concentration (Cmax) and the time to Cmax (Tmax) were determined by visual inspection of the respective individual concentration‐time curves. Total clearance was calculated as the quotient of the administered dose and AUC0–∞.
Calculation of metabolic ratios
Systemic clearance, caffeine AUC, and/or plasma paraxanthine to caffeine metabolic ratios (MRs) 5–7 hours after administration of caffeine are preferred (or accepted) and validated in vivo metrics of CYP1A2 activity.26 In addition, urinary MRs are useful markers of CYP1A2, CYP2A6, XO, and NAT2 activities. Therefore, the following plasma and urinary caffeine MRs were calculated as indices of the respective enzyme activity besides estimation of pharmacokinetic parameters of caffeine.
Plasma MRs
where C is plasma concentrations at 5 and 7 hours post–caffeine dosing.
Urinary MRs
CYP1A2 activity = (AFMU + 1 MU + 1 MX)/1,7 DMU
CYP2A6 activity = 1,7 DMU/1,7 DMX
XO activity = (1 MU)/(1 MX + 1 MU)
NAT2 activity = AFMU/(AFMU + 1 MU + 1 MX),
where the terms are defined as follows: 1 MX, 1‐methylxanthine; 1 MU, 1‐methyluric acid; 1,7 DMU, 1,7‐dimethyluric acid; AFMU, 5‐acetylamino‐6‐formylamino‐3‐methyluracil; and 1,7 DMX, 1,7‐dimethylxanthine (paraxanthine).
Statistical analyses
Data are expressed as mean ± SD. Statistical analyses were performed using GraphPad Prism Software (La Jolla, CA). Comparison of pharmacokinetic parameters or enzyme activity between single and multiple doses of efavirenz were performed using the Wilcoxon‐matched paired test. Testing the association among CYP2B6 genotypes and the activities of CYP1A2 and CYP2A6 following single and multiple doses of efavirenz were evaluated by nonparametric analysis of variance (Kruskal–Wallis test) using Dunn's posttest for multiple comparison correction. Correlation analyses between efavirenz exposure and enzyme activities (CYP1A2 and CYP2A6) were determined from the Spearman's Rank‐Order Correlation (r s). Differences were judged to be due to chronic efavirenz treatment rather than single‐dose efavirenz administration when P < 0.05.
A sample size of at least 52 subjects was calculated as sufficient to provide a 95% power to detect a 40% difference in CYP1A2 activity between a single efavirenz dose vs. multiple doses of efavirenz at a two‐sided alpha level of 5%. Power calculation for efavirenz's effect on CYP2A6, XO, and NAT2 was not performed a priori. However, data from a relatively large sample size were analyzed in this study as compared with conventional DDIs reported in the literature, which often involves sample size < 15 subjects.
Results
Human volunteers
Sixty healthy normal volunteers were recruited and completed the entire study protocol. Two participants were excluded due to missing samples from one of the efavirenz treatment phases. Caffeine metabolic ratios were calculated from 58 individuals. Plasma pharmacokinetic parameters were available from only 52 volunteers after documentation of exogenous caffeine intake by 6 individuals during the study; this was an exclusion criteria.
The demographics of the 58 participants completing the study were the following: 36 men and 22 women; median age of 28.5 years (range 18–49 years); body weight of 74.6 ± 13.7 kg; and body mass index of 24.6 ± 3.8 kg/m2. Based on self‐identification, 74% were white, and 19% were black/African American. The remaining ~7% belonged to other ethnic/racial groups.
The pharmacokinetics of caffeine and metabolite data are shown in Table 1. The caffeine t1/2 was prolonged (P < 0.0001) and AUC0–∞ increased (P < 0.01) following chronic efavirenz compared with a single dose of efavirenz. Accordingly, chronic administration of efavirenz decreased the Cmax of paraxanthine (P < 0.0001), the major metabolite of caffeine. Relative to the single‐dose phase, chronic efavirenz treatment decreased CYP1A2 activity (plasma MRs) by 38% (Table 1 and Figure 1 a; P < 0.0001) with marked interindividual variability (range −78.2% to 31.7%; Figure 1 b). Similarly, CYP1A2 activity measured by urinary MRs decreased 28.9% (P < 0.0001) from 5.7 to 3.6 after chronic treatment with efavirenz (Table 1 ; Figure 1 c). The percent change in urine MR also varied widely among individuals (ranging from −65.1% to 43.2%; Figure 1 d). CYP1A2 activity measured by the plasma MRs correlated with CYP1A2 activity measured by urinary MRs in the single‐dose efavirenz phase (Spearman r s = 0.57; P < 0.0001) and after chronic efavirenz (r s = 0.33; P = 0.013) and combination of both phases (single dose and after multiple doses of efavirenz; r s = 0.57; P < 0.0001; Figure S2a–c ). Plasma caffeine MRs are the preferred phenotype marker for CYP1A2 rather than urinary MRs.27 Thus, only results from plasma MRs are presented as markers of CYP1A2 subsequently.
Table 1.
Pharmacokinetic parameters of caffeine and its main metabolite paraxanthine, and activities of select enzymes calculated from plasma and urinary MRs, following co‐administration of caffeine with a single dose and after multiple doses of efavirenz
| Single dose | Multiple dose | Mean percent change | |
|---|---|---|---|
| Caffeine (1,3,7 TMX) | |||
| Tmax (hour) | 1 (0.5–3) | 1 (0.5–5) | |
| Cmax (ng/mL) | 1,825 ± 972 | 1,897 ± 1,050 | 17.4 |
| AUC0–∞ (μg/mL*hour) | 17.3 ± 11.6 | 22.7 ± 18.4** | 46.2 |
| t1/2 (hour) | 7.61 ± 8.29 | 8.87 ± 4.98*** | 32.5 |
| Paraxanthine (1,7 MX) | |||
| Tmax (hour) | 7 (1.5–15) | 7 (1–15) | |
| Cmax (ng/mL) | 504 ± 236 | 358 ± 208*** | −24.5 |
| AUC0‐∞ (μg/mL*hour) | 10.8 ± 6.1 | 8.6 ± 5.8* | −8.6 |
| t1/2 (hour) | 10.85 ± 9.21 | 12.22 ± 7.88** | 26.3 |
| Relative change in enzyme activity | |||
| Plasma MR | |||
| CYP1A2 | 0.52 ± 0.28 | 0.31 ± 0.18*** | −38.1 |
| Urinary MR | |||
| CYP1A2 | 5.2 ± 2.4 | 3.5 ± 1.3*** | −28.9 |
| CYP2A6 | 0.58 ± 0.38 | 0.94 ± 0.59*** | 85.5 |
| XO | 0.37 ± 0.16 | 0.37 ± 0.16 | 1.1 |
| NAT2 | 0.31 ± 0.21 | 0.32 ± 0.22 | 4.5 |
Data are expressed as mean ± SD except Tmax, which was presented as median (minimum–maximum).
AUC, area under the plasma concentration‐time curve; Cmax, maximum concentration; CYP, cytochrome P450; MR, metabolic ratio; NAT2, N‐acetyltransferase 2; t1/2, terminal elimination half‐life; Tmax, time to maximum concentration; XO, xanthine oxidase.
*P < 0.05; **P < 0.01; ***P < 0.0001, Wilcoxon matched‐pairs test (single dose vs. multiple doses of efavirenz).
Figure 1.
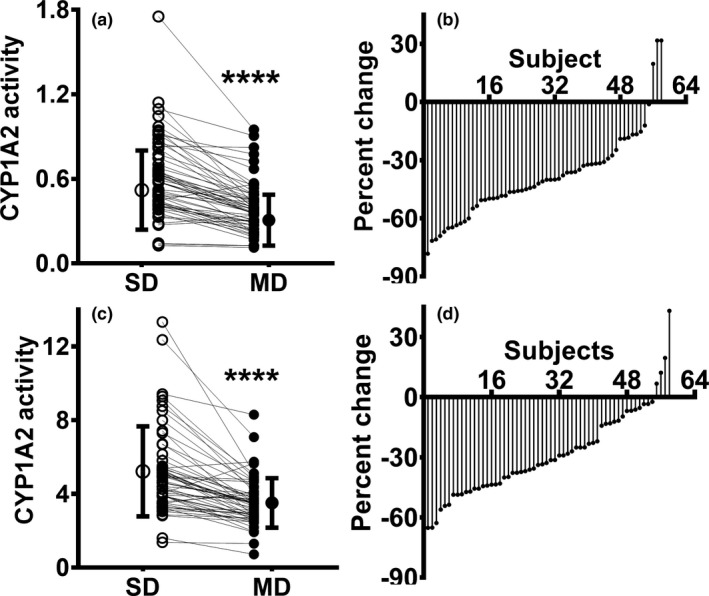
Relative CYP1A2 activity following single dose (SD; open circles) and after multiple doses (MDs; closed circles) of efavirenz in healthy volunteers (N = 58). (a) Plasma and (c) urine caffeine metabolic ratios (MRs) were calculated as the surrogate for relative changes in CYP1A2 activity. Ranked percent change in CYP1A2 activity using MRs in (b) plasma and (d) urine of 58 subjects (multiple doses vs. a single dose of efavirenz) are shown. CYP1A2 activity following SD and after MD of efavirenz was compared using Wilcoxon signed‐rank test. ****P < 0.0001. CYP, cytochrome P450.
CYP2A6, XO, and NAT‐2 activities were estimated from respective caffeine MRs as described in the METHODS section. Chronic efavirenz treatment significantly increased CYP2A6 activity (Table 1 ; Figure 2 a) with marked intersubject variability (range 45.4–281.4%; Figure 2 b). Urinary metabolic ratios reflecting XO and NAT2 activities were not significantly altered by chronic efavirenz exposure (Table 1).
Figure 2.
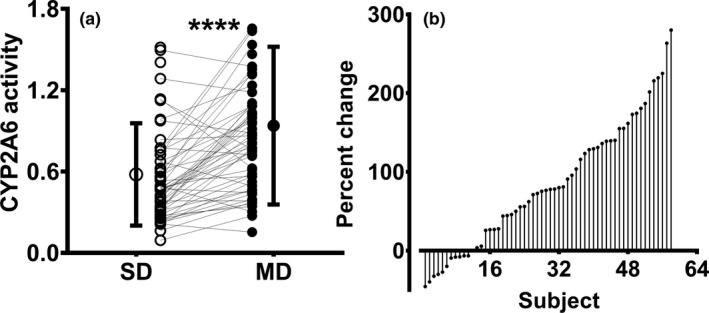
Relative CYP2A6 activity following single dose (SD; open circles) and after multiple doses (MDs; closed circles) of efavirenz in healthy volunteers (N = 58). (a) CYP2A6 activity was calculated from urinary caffeine metabolic ratios as described and (b) ranked percent change in CYP2A6 activity of 58 individuals (MD vs. SD of efavirenz). CYP2A6 activity following SD and after MD of efavirenz was compared using Wilcoxon signed‐rank test. ****P < 0.0001 (between CYP1A2 activity following SD and after MD of efavirenz). CYP, cytochrome P450.
Approximately sevenfold between‐subject differences in efavirenz exposure was observed following a single dose and multiple doses of efavirenz. To test whether changes in CYP1A2 and CYP2A6 activities were dependent on the exposure of efavirenz and its metabolites, correlations between efavirenz exposure and indices of CYP1A2 and CYP2A6 were examined. Greater reduction in CYP1A2 activity was observed with higher efavirenz exposure, as shown by the negatively significant correlation between CYP1A2 activity and efavirenz AUC0–∞ at single dose (Pearson r s = −0.32; P < 0.01) as well as efavirenz AUC0–24 h after multiple doses (r s = −0.61; P < 0.001). The percent change in CYP1A2 was negatively correlated with efavirenz AUC0–24 h after multiple doses (r s = −0.41; P < 0.01; Figure S3 ). Efavirenz exposure at single dose or at steady state did not significantly correlate with urine marker of CYP2A6 activity (Figure S4 ). Exposure of efavirenz metabolites did not correlate with CYP1A2 or CYP2A6 activity.
The correlation analysis suggests that the extent of reduction of CYP1A2 activity is dependent on efavirenz exposure (the higher the efavirenz exposure the greater reduction in CYP1A2 activity). Genotype–phenotype data from the same subjects analyzed in this study and published elsewhere29, 30 show that efavirenz exposure following a single dose of efavirenz (AUC0–∞) was 2.1‐fold and 1.8‐fold higher; and multiple doses of efavirenz (AUC0–24) was 2.5‐fold and 2‐fold higher in CYP2B6*6/*6 genotypes compared with CYP2B6*1/*1 and CYP2B6*1/*6 genotypes, respectively. Difference in efavirenz exposure between *1/*1 and *1/*6, although statistically different, was small. To test whether the extent of efavirenz‐CYP1A2 interaction is dependent on CYP2B6 genotypes, data analyses were performed after stratifying by CYP2B6*1/*1, CYP2B6*1/*6, and CYP2B6*6/*6 genotypes. One subject with *1/*18 genotype was grouped with *6/*6 as the genotype‐predicted phenotype was close to a slow metabolizer. The demographics are comparable among the three genotypes (Table S1 ). CYP1A2 activity was lower for the CYP2B6*6/*6 genotypes compared with *1/*1 or *1/*6 genotypes following single dose (Kruskal–Wallis test, P < 0.05; Figure 3 a) and multiple doses of efavirenz (P < 0.01; Figure 3 b). Compared with the single‐dose phase, chronic efavirenz inhibited CYP1A2 activity within each genotype (P < 0.05; Figure 3 c). The percent change in CYP1A2 activity was greater in *6/*6 genotypes when compared with *1/*1 and *1/*6 genotypes (Kruskal–Wallis test, P < 0.05; Figure 3 d). Similarly, caffeine AUC0‐∞ was significantly higher for *6/*6 genotype in both efavirenz treatment groups compared with *1/*1 genotype (Figure S5a,b ), whereas caffeine AUC0‐∞ and CYP1A2 for the *1/*6 genotype were not different from the wild type *1/*1 genotype in either treatment group.
Figure 3.
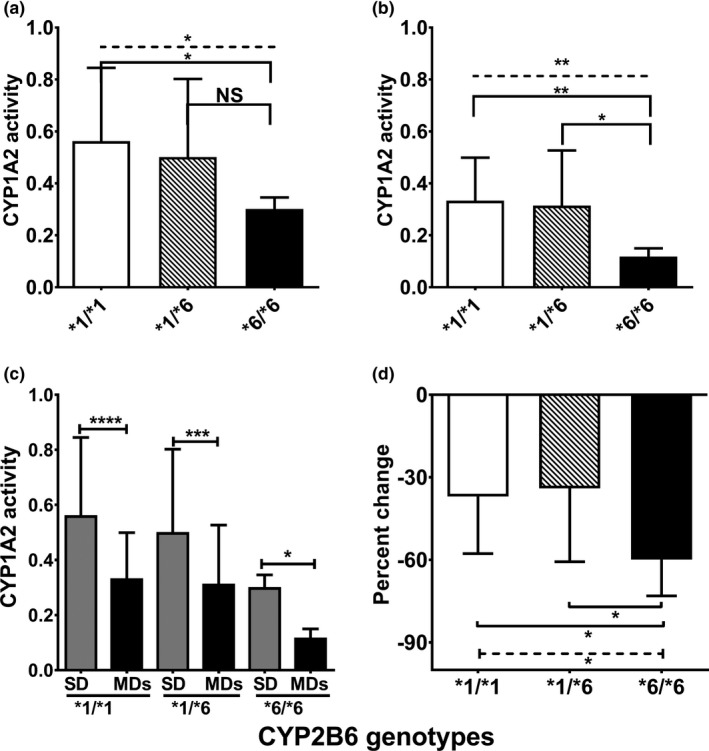
Relative CYP1A2 activity stratified by CYP2B6 genotypes following a single dose (SD) and multiple doses (MDs) of efavirenz in health volunteers (N = 58). Plasma metabolic ratio of paraxanthine to caffeine represents relative CYP1A2 activity. (a) CYP1A2 activity following SD of efavirenz. (b) CYP1A2 activity after chronic administration of efavirenz. (c) Comparison between single and multiple efavirenz dosing within each genotype group. (d) Represents percent change in CYP1A2 activity. CYP1A2 activity was compared between an SD and MDs of efavirenz in each genotype using Wilcoxon matched‐pairs test. Comparison among genotypes was tested using nonparametric analysis of variance (Kruskal–Wallis test) with post hoc Dunn's multiple‐comparison test. ****P < 0.0001, ***P < 0.001, **P < 0.01, *P < 0.05. CYP, cytochrome P450; NS, not statistically significant (P > 0.05).
The impact of CYP2B6 genotypes on the extent of efavirenz‐mediated induction of CYP2A6 was also tested. CYP2A6 activity was not statistically different among the CYP2B6 genotypes either at a single dose of efavirenz (Figure 4 a) or after multiple doses of efavirenz (Figure 4 b). Compared with the single‐dose phase, chronic efavirenz increased the urinary caffeine metabolic ratio for CYP2A6 in *1/*1 and *1/*6 genotypes but not in *6/*6 genotype (Figure 4 c). Although percent change in CYP2A6 activity was lower in *6/*6 genotypes when compared with *1/*1 and *1/*6 genotypes, this did not reach a statistically significant level (Figure 4 d).
Figure 4.
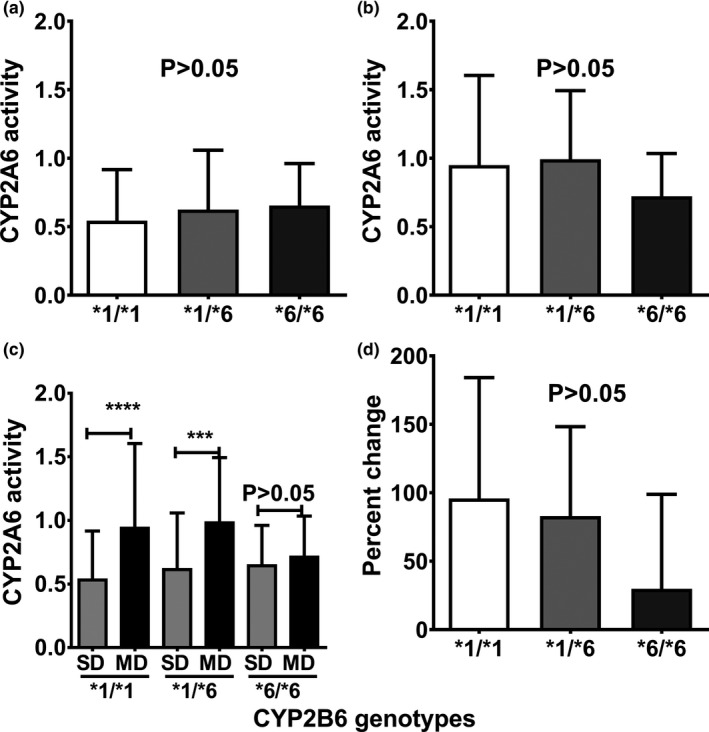
Relative CYP2A6 activity stratified by CYP2B6 genotypes (*1/*1, n = 37; *1/*6, n = 15; and *6/*6, n = 6) following a single dose (SD) and multiple doses (MDs) of efavirenz in health volunteers (N = 58). (a) Relative CYP2A6 activity following SD of efavirenz. (b) Relative CYP2A6 activity after MDs of efavirenz. (c) Compares CYP2A6 activity between single and multiple dosing within each genotype group. (d) Represents percent change in CYP2A6 activity (MDs vs. SD of efavirenz). CYP2A6 activity was compared between an SD and MDs of efavirenz in each genotype using Wilcoxon matched pairs test. Comparison among genotypes was tested using nonparametric analysis of variance (Kruskal–Wallis test) with post hoc Dunn's multiple comparison test. ****P < 0.0001, ***P < 0.001. CYP, cytochrome P450; NS, not statistically significant (P > 0.05).
Discussion
In the present study, chronic administration of efavirenz significantly reduced and increased the in vivo activity of hepatic CYP1A2 and CYP2A6, respectively. The effect of efavirenz on CYP1A2 activity was more pronounced in individuals with higher efavirenz exposure and those expressing CYP2B6*6*6 genotype, whereas the increase in CYP2A6 activity was neither efavirenz exposure‐dependent nor CYP2B6 genotype‐dependent. Efavirenz did not significantly alter the activity of XO or NAT‐2. These data suggest that there is an increased risk for DDIs in individuals receiving efavirenz‐based HIV therapy who are comedicated with CYP1A2 or CYP2A6 substrates. Moreover, CYP2B6 genotypes associated with reduced efavirenz clearance may particularly alter the risk for adverse drug interactions involving CYP1A2.
Efavirenz activates two nuclear receptors that regulate a range of genes involved in drug disposition, namely the CAR (NR1I3) and PXR (NR1I2).6, 7 Accordingly, efavirenz treatment enhances the elimination of numerous drugs metabolized by the cytochromes P450 (e.g., CYP3A, CYP2B6, and CYP2C1910, 11, 12). This together with the fact that CYP2A6 is also transcriptionally regulated via PXR31 and CAR32 may explain our observed increase in CYP2A6 activity following efavirenz treatment. CYP2A6 catalyzes, fully or partially, the metabolism of several clinically used drugs (e.g., letrozole, metronidazole, efavirenz, and tegafur)33 and, based on our findings, it is anticipated that efavirenz would alter the disposition of these drugs. CYP2A6 is also the main metabolic pathway for nicotine elimination and contributes to the biotransformation of several nicotine‐derived carcinogens (N′‐nitrosonornicotine and 4‐(methylnitrosamino)‐1‐(3‐pyridyl)‐1‐butanone.33 Hepatic CYP2A6 activity has been associated with the number of cigarettes smoked per day, smoking topography (puff volume, duration, and velocity), and smoking cessation.33 Thus, it is conceivable that cigarette smokers would be at increased risk for tobacco‐related illnesses when coprescribed efavirenz‐based HIV therapy. Our data show that neither efavirenz exposure nor the presence of the CYP2B6 polymorphisms altered the magnitude of the increase in CYP2A6 activity suggesting that maximum nuclear receptor activation occurs at relatively low efavirenz concentrations.
In contrast to the induction effects of efavirenz on gene expression, drug interactions also occur as a result of direct enzymatic inhibition by efavirenz.15, 34 Our findings clearly indicate that chronic doses of efavirenz significantly reduced CYP1A2 activity in vivo compared with CYP1A2 activity determined when caffeine was administered with a single dose of efavirenz. The mechanism by which efavirenz reduces CYP1A2 activity remains unknown. In vitro studies indicate that efavirenz is neither a reversible inhibitor nor a mechanism‐based (i.e., time‐dependent) inactivator of CYP1A2 activity.13 It is unlikely that efavirenz metabolites produce CYP1A2 inhibition because the major oxidative metabolite, 8‐hydroxyefavirenz, had no effect on CYP1A2 activity in vitro.13 Efavirenz‐hydroxylated metabolites undergo extensive conjugation mainly by glucuronosyltransferases. With few exceptions (e.g., glucuronides of gemfibrozil35 and clopidogrel36), glucuronide conjugates are relatively hydrophilic and do not seem to produce clinically significant drug interactions. The possibility that efavirenz reduces CYP1A2 activity in vivo via mechanisms other than direct enzymatic inhibition/inactivation cannot be excluded. However, a limitation of these findings is that the study design in which probe substrates, including caffeine, were administered on two occasions (with a single dose of efavirenz and after multiple doses of efavirenz) without inclusion of the caffeine‐alone arm (absence of efavirenz) to determine baseline CYP1A2 did not allow accurate determination of the true magnitude of efavirenz–CYP1A2 interaction. Initially, the study was designed to address potential induction of drug metabolism by efavirenz.
Of note, the CYP1A2 probe, caffeine, has low intrinsic clearance with no significant presystemic metabolism. The magnitude of the efavirenz‐CYP1A2 interaction reported here is likely an underestimate for any CYP1A2 drugs known to exhibit significant presystemic (i.e., first‐pass) metabolism and low bioavailability (e.g., tizanidine).37 Thus, efavirenz coadministration with CYP1A2 substrates possessing narrow therapeutic ranges (e.g., clozapine, olanzapine, duloxetine, remolten, and tizanidine), would likely produce clinically significant drug interactions. For example, ciprofloxacin and fluvoxamine (potent inhibitors of CYP1A2) increase the plasma exposure of tizanidine up to 30‐fold, resulting in concomitant increased toxicity.37, 38 Tizanidine is an α2‐adrenergic agonist approved for therapy of muscle spasm and other conditions. It is frequently prescribed, off‐label, for suppression of the symptoms associated with opiate withdrawal during detoxification.39, 40 Because some individuals with HIV infection may also suffer from and be treated for opioid abuse, the likelihood that tizanidine and efavirenz may be coadministered is high.
Drug interactions with efavirenz are difficult to predict because of the marked interindividual variability in its plasma exposure.41 Efavirenz is mainly eliminated by metabolism via CYP2B6, with minor contributions from CYP2A6, CYP3A, CYP1A2, and UGT2B7.18, 42, 43 Patients with variants in the CYP2B6 gene (e.g., CYP2B6*6 and CYP2B6*18) demonstrate higher efavirenz plasma exposure after administration of single30 and multiple doses19 of efavirenz. Consistent with the literature, genotype‐phenotype data from the same subjects analyzed in this study and published elsewhere29, 30 show that efavirenz exposure is over twofold higher in CYP2B6*6/*6 genotypes compared with CYP2B6*1/*1 genotype. Evidence exist that genetic variants in the CYP2B6 gene that contributes to variable efavirenz exposure may dictate the magnitude of certain induction drug interactions caused by efavirenz. For example, efavirenz reduced lumefantrine concentrations in patients coinfected with HIV and malaria, resulting in poor malaria treatment response, and the decrease in lumefantrine concentrations was greater in those with higher efavirenz exposure and in CYP2B6 slow metabolizer.21 Efavirenz‐based HIV therapy has been associated with lower levonorgestrel concentrations in women with the contraceptive subdermal implant,22 resulting in a risk for unintended pregnancy44 particularly in CYP2B6 slow metabolizer. CYP2B6 genotypes are also associated with differential efavirenz autoinduction of metabolism.20 However, this is the first report to suggest greater reduction of CYP1A2 in carriers of the CYP2B6*6/*6 genotype compared with *1/*1 and *1/*6 genotypes. These data along with the correlation analysis showing efavirenz exposure‐dependent reduction in CYP1A2 activity suggest that factors that increase efavirenz exposure would increase the risk for efavirenz–CYP1A2 interaction. The genotype‐dependent effect may have particularly important clinical consequences in certain populations (e.g., this likely poses unique risks in African or African American populations) as the allele frequencies of relevant CYP2B6 genotypes (e.g., *6 and *18) are higher in these populations compared with other ethnic and racial groups.45 Taken together, although the association of CYP2B6*6/*6 genotype on the extent of efavirenz–CYP1A2 interaction seems plausible and anticipated, our sample size for the CYP2B6*6/*6 was small. Thus, a well‐designed (including a caffeine‐alone arm) and more detailed study in adequate sample size of CYP2B6 genotype subgroups may be warranted to validate our findings and to assess the true extent of efavirenz‐CYP1A2 interaction.
In summary, we have demonstrated that efavirenz is an inhibitor of CYP1A2 activity and an inducer of CYP2A6 activity and is likely to alter the disposition and efficacy of drugs metabolized by these enzymes. The results further suggest that genetic and nongenetic factors will increase the risk for efavirenz‐mediated drug interactions. Finally, specific populations expressing higher frequencies of CYP2B6 variants (e.g., black and African American) may be at increased risk for efavirenz drug interactions. Concomitant use of CYP1A2 and CYP2A6 substrate drugs with efavirenz‐based HIV therapy will require careful monitoring to minimize the risk of adverse drug effects.
Funding
This project was supported by Public Health Service (PHS) grants R01GM078501, R01GM121707, and T32GM008425 from the National Institute of General Medical Sciences/National Institute of Health (NIH; Bethesda, MD). The clinical studies were performed at the Indiana Clinical and Translational Sciences Institute (CTSI)'s Clinical Research Center of Indiana University (PHS grant UL1TR001108, NIH).
Conflict of Interest
The authors declared no competing interests for this work.
Author Contributions
I.F.M., N.D., R.E.G., and Z.D. wrote the article. Z.D. designed the research. I.F.M., Y.K., and J.B.L.L. performed the research. I.F.M., N.D., R.E.G., and Z.D. analyzed the data.
Supporting information
Supplemental Tables and Figures.
Acknowledgments
The authors would like to thank Nancy Thong, RN, NP (Indiana University), for coordinating the clinical study and the healthy volunteers who participated in the study.
I.F.M. and N.D. contributed equally to this work.
References
- 1. Gulick, R.M. et al Triple‐nucleoside regimens versus efavirenz‐containing regimens for the initial treatment of HIV‐1 infection. N. Engl. J. Med. 350, 1850–1861 (2004). [DOI] [PubMed] [Google Scholar]
- 2. McKinney, R.E. Jr. et al Long‐term safety and efficacy of a once‐daily regimen of emtricitabine, didanosine, and efavirenz in HIV‐infected, therapy‐naive children and adolescents: Pediatric AIDS Clinical Trials Group Protocol P1021. Pediatrics 120, e416–e423 (2007). [DOI] [PubMed] [Google Scholar]
- 3. Panel on Antiretroviral Guidelines for Adults and Adolescents . Guidelines for the Use of Antiretroviral Agents in Adults and Adolescents with HIV. Department of Health and Human Services. <http://www.aidsinfo.nih.gov/ContentFiles/AdultandAdolescentGL.pdf>. Accessed May 9, 2019.
- 4. World Health Organization . Consolidate Guidelines on the Use of Antiretroviral Drugs for Treating and Preventing HIV Infection, 2nd edition 1–480 (2016). WHO Press, Switzerland. [Google Scholar]
- 5. Bristol‐Myers Squibb Company 2017 . Sustiva (efavirenz) package insert. Bristol‐Myers Squibb Company, 1−38 (revised October 2017).
- 6. Meyer zu Schwabedissen, H.E. et al Compartment‐specific gene regulation of the CAR inducer efavirenz in vivo. Clin. Pharmacol. Ther. 92, 103–111 (2012). [DOI] [PMC free article] [PubMed] [Google Scholar]
- 7. Sharma, D. , Lau, A.J. & Sherman, M.A. , Chang, T.K. Agonism of human pregnane X receptor by rilpivirine and etravirine: comparison with first generation non‐nucleoside reverse transcriptase inhibitors. Biochem. Pharmacol. 85, 1700–1711 (2013). [DOI] [PubMed] [Google Scholar]
- 8. Willson, T.M. & Kliewer, S.A. PXR, CAR and drug metabolism. Nat. Rev. Drug Discov. 1, 259–266 (2002). [DOI] [PubMed] [Google Scholar]
- 9. Ngaimisi, E. et al Long‐term efavirenz autoinduction and its effect on plasma exposure in HIV patients. Clin. Pharmacol. Ther. 88, 676–684 (2010). [DOI] [PubMed] [Google Scholar]
- 10. Kharasch, E.D. et al Mechanism of efavirenz influence on methadone pharmacokinetics and pharmacodynamics. Clin. Pharmacol. Ther. 91, 673–684 (2012). [DOI] [PMC free article] [PubMed] [Google Scholar]
- 11. Michaud, V. et al Induction of CYP2C19 and CYP3A activity following repeated administration of efavirenz in healthy volunteers. Clin. Pharmacol. Ther. 91, 475–482 (2012). [DOI] [PMC free article] [PubMed] [Google Scholar]
- 12. Habtewold, A. et al Pharmacogenetic and pharmacokinetic aspects of CYP3A induction by efavirenz in HIV patients. Pharmacogenomics J. 13, 484–489 (2013). [DOI] [PubMed] [Google Scholar]
- 13. Xu, C. & Desta, Z. In vitro analysis and quantitative prediction of efavirenz inhibition of eight cytochrome P450 (CYP) enzymes: major effects on CYPs 2B6, 2C8, 2C9 and 2C19. Drug Metab. Pharmacokinet. 28, 362–371 (2013). [DOI] [PMC free article] [PubMed] [Google Scholar]
- 14. McIlleron, H.M. et al Effects of rifampin‐based antituberculosis therapy on plasma efavirenz concentrations in children vary by CYP2B6 genotype. AIDS 27, 1933–1940 (2013). [DOI] [PMC free article] [PubMed] [Google Scholar]
- 15. Soyinka, J.O. , Onyeji, C.O. , Nathaniel, T.I. , Odunfa, O.O. & Ebeshi, B.U. Effects of concurrent administration of efavirenz on the disposition kinetics of amodiaquine in healthy volunteers. J. Pharm. Res. 6, 275–279 (2013). [Google Scholar]
- 16. Gufford, B.T. , Masters, A.R. , Lu, J.B. , Metzger, I.F. , Jones, D.R. & Desta, Z. Stereoselective inhibition and induction of bupropion metabolism by efavirenz in healthy volunteers. Clin. Pharmacol. Ther. 101(suppl. 1), S66 (2017). [DOI] [PMC free article] [PubMed] [Google Scholar]
- 17. Chirehwa, M.T. et al Effect of efavirenz‐based antiretroviral therapy and high‐dose rifampicin on the pharmacokinetics of isoniazid and acetyl‐isoniazid. J. Antimicrob. Chemother. 74, 139–148 (2019). [DOI] [PMC free article] [PubMed] [Google Scholar]
- 18. Ward, B.A. , Gorski, J.C. , Jones, D.R. , Hall, S.D. , Flockhart, D.A. & Desta, Z. The cytochrome P4502B6 (CYP2B6) is the main catalyst of efavirenz primary and secondary metabolism: implication for HIV/AIDS therapy and utility of efavirenz as a substrate marker of CYP2B6 catalytic activity. J. Pharmacol. Exp. Ther. 306, 287–300 (2003). [DOI] [PubMed] [Google Scholar]
- 19. Desta, Z. et al Clinical Pharmacogenetics Implementation Consortium (CPIC) guideline for CYP2B6 and efavirenz‐containing antiretroviral therapy. Clin. Pharmacol. Ther. (2019). < 10.1002/cpt.1477>. [DOI] [PMC free article] [PubMed] [Google Scholar]
- 20. Ngaimisi, E. et al Effect of rifampicin and CYP2B6 genotype on long‐term efavirenz autoinduction and plasma exposure in HIV patients with or without tuberculosis. Clin. Pharmacol. Ther. 90, 406–413 (2011). [DOI] [PubMed] [Google Scholar]
- 21. Maganda, B.A. , Minzi, O.M. , Ngaimisi, E. , Kamuhabwa, A.A. & Aklillu, E. CYP2B6*6 genotype and high efavirenz plasma concentration but not nevirapine are associated with low lumefantrine plasma exposure and poor treatment response in HIV‐malaria‐coinfected patients. Pharmacogenomics J. 16, 88–95 (2016). [DOI] [PubMed] [Google Scholar]
- 22. Neary, M. et al The effect of gene variants on levonorgestrel pharmacokinetics when combined with antiretroviral therapy containing efavirenz or nevirapine. Clin. Pharmacol. Ther. 102, 529–536 (2017). [DOI] [PMC free article] [PubMed] [Google Scholar]
- 23. Tang‐Liu, D.D. , Williams, R.L. & Riegelman, S. Disposition of caffeine and its metabolites in man. J. Pharmacol. Exp. Ther. 224, 180–185 (1983). [PubMed] [Google Scholar]
- 24. Natasa Djordjevic Importance of pharmacogenomic and environmental factors for variation in caffeine disposition: with special emphasis on CYP1A2, CYP2A6, NAT2 and XO. Thesis/Dissertation 1–48. Karolinska Institute; (2012). [Google Scholar]
- 25. Nehlig, A. Interindividual differences in caffeine metabolism and factors driving caffeine consumption. Pharmacol. Rev. 70, 384–411 (2018). [DOI] [PubMed] [Google Scholar]
- 26. Fuhr, U. & Rost, K.L. Simple and reliable CYP1A2 phenotyping by the paraxanthine/caffeine ratio in plasma and in saliva. Pharmacogenetics 4, 109–116 (1994). [DOI] [PubMed] [Google Scholar]
- 27. Hakooz, N.M. Caffeine metabolic ratios for the in vivo evaluation of CYP1A2, N‐acetyltransferase 2, xanthine oxidase and CYP2A6 enzymatic activities. Curr. Drug Metab. 10, 329–338 (2009). [DOI] [PubMed] [Google Scholar]
- 28. Michaud, V. et al Efavirenz‐mediated induction of omeprazole metabolism is CYP2C19 genotype dependent. Pharmacogenomics J. 14, 151–159 (2014). [DOI] [PMC free article] [PubMed] [Google Scholar]
- 29. Abdelhady, A.M. et al Efavirenz inhibits the human ether‐a‐go‐go related current (hERG) and induces QT interval prolongation in CYP2B6*6*6 allele carriers. J. Cardiovasc. Electrophysiol. 27, 1206–1213 (2016). [DOI] [PMC free article] [PubMed] [Google Scholar]
- 30. Robarge, J.D. et al Population pharmacokinetic modeling to estimate the contribution of genetic and non genetic factors of efavirenz disposition. Antimicrob. Agents Chemother. 61, 1–17 (2016). [DOI] [PMC free article] [PubMed] [Google Scholar]
- 31. Itoh, M. et al Induction of human CYP2A6 is mediated by the pregnane X receptor with peroxisome proliferator‐activated receptor‐gamma coactivator 1alpha. J. Pharmacol. Exp. Ther. 319, 693–702 (2006). [DOI] [PubMed] [Google Scholar]
- 32. Maglich, J.M. et al Identification of a novel human constitutive androstane receptor (CAR) agonist and its use in the identification of CAR target genes. J. Biol. Chem. 278, 17277–17283 (2003). [DOI] [PubMed] [Google Scholar]
- 33. Tanner, J.A. & Tyndale, R.F. Variation in CYP2A6 activity and personalized medicine. J. Pers. Med. 7, 1–29 (2017). [DOI] [PMC free article] [PubMed] [Google Scholar]
- 34. McIlleron, H. et al Reduced antituberculosis drug concentrations in HIV‐infected patients who are men or have low weight: implications for international dosing guidelines. Antimicrob. Agents Chemother. 56, 3232–3238 (2012). [DOI] [PMC free article] [PubMed] [Google Scholar]
- 35. Ogilvie, B.W. et al Glucuronidation converts gemfibrozil to a potent, metabolism‐dependent inhibitor of CYP2C8: implications for drug‐drug interactions. Drug Metab. Dispos. 34, 191–197 (2006). [DOI] [PubMed] [Google Scholar]
- 36. Tornio, A. et al Glucuronidation converts clopidogrel to a strong time‐dependent inhibitor of CYP2C8: a phase II metabolite as a perpetrator of drug‐drug interactions. Clin. Pharmacol. Ther. 96, 498–507 (2014). [DOI] [PubMed] [Google Scholar]
- 37. Granfors, M.T. , Backman, J.T. , Neuvonen, M. & Neuvonen, P.J. Ciprofloxacin greatly increases concentrations and hypotensive effect of tizanidine by inhibiting its cytochrome P450 1A2‐mediated presystemic metabolism. Clin. Pharmacol. Ther. 76, 598–606 (2004). [DOI] [PubMed] [Google Scholar]
- 38. Granfors, M.T. , Backman, J.T. , Neuvonen, M. , Ahonen, J. & Neuvonen, P.J. Fluvoxamine drastically increases concentrations and effects of tizanidine: a potentially hazardous interaction. Clin. Pharmacol. Ther. 75, 331–341 (2004). [DOI] [PubMed] [Google Scholar]
- 39. Henney, H.R. III & Runyan, J.D. A clinically relevant review of tizanidine hydrochloride dose relationships to pharmacokinetics, drug safety and effectiveness in healthy subjects and patients. Int. J. Clin. Pract. 62, 314–324 (2008). [DOI] [PubMed] [Google Scholar]
- 40. Gowing, L. , Farrell, M. , Ali, R. & White, J.M. Alpha(2)‐adrenergic agonists for the management of opioid withdrawal. Cochrane Database Syst. Rev. (5), CD002024 (2016).27140827 [Google Scholar]
- 41. Rotger, M. et al Predictive value of known and novel alleles of CYP2B6 for efavirenz plasma concentrations in HIV‐infected individuals. Clin. Pharmacol. Ther. 81, 557–566 (2007). [DOI] [PubMed] [Google Scholar]
- 42. Belanger, A.S. , Caron, P. , Harvey, M. , Zimmerman, P.A. , Mehlotra, R.K. & Guillemette, C. Glucuronidation of the antiretroviral drug efavirenz (EFV) by UGT2B7 and an in vitro investigation of drug‐drug interaction with zidovudine (AZT). Drug Metab. Dispos. 37, 1793–1796 (2009). [DOI] [PMC free article] [PubMed] [Google Scholar]
- 43. Ogburn, E.T. , Jones, D.R. , Masters, A.R. , Xu, C. , Guo, Y. & Desta, Z. Efavirenz primary and secondary metabolism in vitro and in vivo: identification of novel metabolic pathways and cytochrome P450 (CYP) 2A6 as the principal catalyst of efavirenz 7‐hydroxylation. Drug Metab. Dispos. 38, 1218–1229 (2010). [DOI] [PMC free article] [PubMed] [Google Scholar]
- 44. Scarsi, K.K. et al Unintended pregnancies observed with combined use of the levonorgestrel contraceptive implant and efavirenz‐based antiretroviral therapy: a three‐arm pharmacokinetic evaluation over 48 weeks. Clin. Infect. Dis. 62, 675–682 (2016). [DOI] [PMC free article] [PubMed] [Google Scholar]
- 45. Li, J. et al Worldwide variation in human drug‐metabolism enzyme genes CYP2B6 and UGT2B7: implications for HIV/AIDS treatment. Pharmacogenomics 13, 555–570 (2012). [DOI] [PMC free article] [PubMed] [Google Scholar]
Associated Data
This section collects any data citations, data availability statements, or supplementary materials included in this article.
Supplementary Materials
Supplemental Tables and Figures.