Abstract
Background and Objective
Liver cancer is a highly malignant tumor, and patients typically have poor prognoses. Metabolic reprogramming is a hallmark of cancer, and downregulation of oxoglutarate dehydrogenase-like (OGDHL) contributes to the onset and progression of several cancers. We examined the role of altered OGDHL expression in liver cancer and determined its value as a diagnostic and prognostic indicator for patients.
Material and Methods
R (version 3.5.1) and several R extensions were used for data mining of The Cancer Genome Atlas (TCGA) dataset (including RNAseq and clinical information) and statistical analysis. Receiver operating characteristic analysis was used to determine the diagnostic value of OGDHL. The chi-squared test was used to identify the clinical correlates of OGDHL downregulation. Survival analysis (with the log-rank test) and univariate and multivariate Cox analysis were used to evaluate the effect of OGDHL expression on overall survival (OS) and relapse-free survival. TCGA was used for analysis of gene set enrichment.
Results
OGDHL had lower expression in cancerous liver tissues than noncancerous adjacent tissues, and low expression correlated with more advanced patient age, histologic grade, stage, T classification, and poor survival. Patients with lower OGDHL expression had shorter OS and relapse-free survival. Multivariate Cox regression indicated that low OGDHL expression was an independent risk factor for poor prognosis. Gene set enrichment analysis indicated enrichment of the mitotic spindle, G2M checkpoint, and E2F targets in the OGDHL low expression phenotype.
Conclusion
OGDHL has potential as a diagnostic and prognostic biomarker for liver cancer.
1. Introduction
Liver cancer is one of the most common digestive cancers in the world [1]. Although there have been improvements in clinical treatments in recent years, there have not been significant improvements in the prognosis of affected patients. There is an urgent need to identify novel prognostic biomarkers for liver cancer so that treatment selection can be improved.
Metabolic reprogramming is one of the hallmarks of cancer. Oxoglutarate dehydrogenase-like (OGDHL) is an essential regulatory gene and a putative tumor suppressor gene. The OGDHL protein is an isoform of 2-oxoglutarate dehydrogenase and functions as the first and rate-limiting step of the multienzyme OGDH complex (OGDHC), which degrades glucose and glutamate [2, 3]. Previous studies have reported enrichment of OGDHL in the brain and undetectable levels in the heart [2]. Subsequent studies examined the downregulation and methylation of OGDHL in breast cancer [4], cervical cancer [5], and colorectal cancer [6].
However, the diagnostic value, prognostic value, and role of OGDHL in liver cancer remain unknown. In this study, we compared OGDHL expression in cancerous and healthy liver tissues and evaluated its diagnostic value by receiver operating characteristic (ROC) analysis. We also examined the correlation of OGDHL expression with clinical features and performed survival analysis using the Cox model to assess its function as an independent prognostic indicator in liver cancer.
2. Materials and Methods
2.1. Data Mining of The Cancer Genome Atlas Database
The RNAseq data of OGDHL and clinical information were downloaded from The Cancer Genome Atlas (TCGA) dataset. No ethical approval was necessary because these are anonymized public datasets.
2.2. Statistical Analysis
All data analyses were performed using R (version 3.5.1) [7] and several R extensions. Boxplots were used to display expression of OGDHL mRNA. The chi-squared test was used to evaluate the correlation between OGDHL expression and the clinical features of patients. The pROC package was used to perform ROC analysis, to determine the optimal OGDHL cut-off point and to assess the diagnostic value of OGDHL expression by calculation of the area under the curve (AUC) [8]. Survival curves were plotted for different groups of patients, and curves were compared using the log-rank test. A survival package executed univariate and multivariate Cox analyses [9].
Ggplot2 was used for data visualization [10].
2.3. Gene Set Enrichment Analysis
Gene set enrichment analysis (GSEA) was used to assess the distributions of predefined gene sets in gene lists sorted by phenotype correlation and to determine the contribution of different genes to phenotype [11, 12]. This analysis was performed using the GSEA 3.0 software and the gene set of “h.all.v6.2.symbols.gmt” from the Molecular Signatures Database. The normalized enrichment score (NES) was obtained from 1000 permutations.
3. Results
3.1. Patient Characteristics and OGDHL Expression
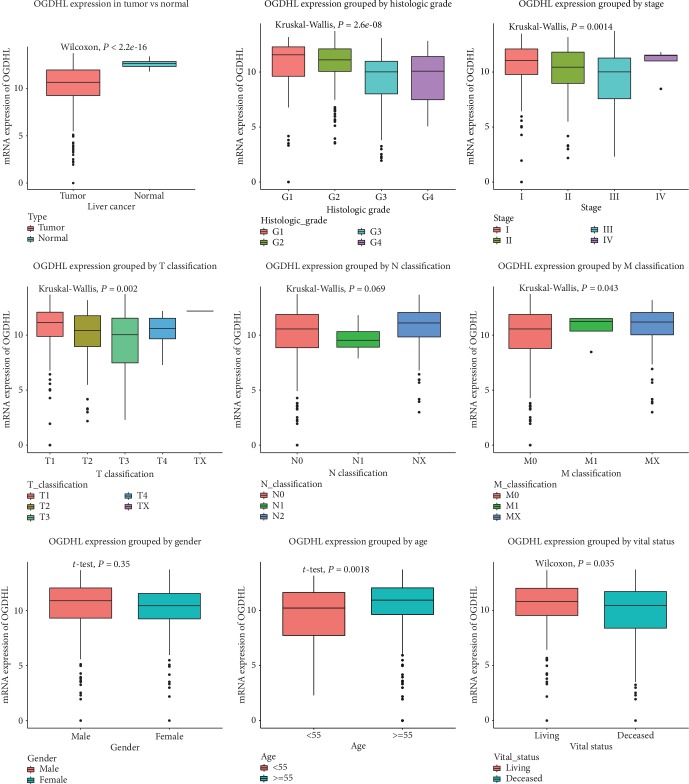
Table 1 shows the clinical characteristics of the 373 liver cancer patients from TCGA dataset, including age, sex, histological type, histologic grade, stage, TNM classification, receipt of radiation therapy, presence of residual tumor, vital status, and relapse. Analysis of OGDHL expression (Figure 1) indicated significantly lower expression in cancerous liver tissues than adjacent normal tissues (P < 2.2 × 10⁻¹⁶). In addition, OGDHL expression was inversely correlated with more advanced histologic grade (P = 2.6 × 10⁻⁸), stage (P = 0.0014), T classification (P = 0.002), M classification (P = 0.043), and age (P = 0.0016) but positively correlated with longer survival (P = 0.035).
Table 1.
Clinical characteristics of the liver cancer patients.
| Characteristics | Number of pts (%) |
|---|---|
| Age | |
| <55 | 117 (31.45) |
| ≥55 | 255 (68.55) |
| Gender | |
| Female | 121 (32.44) |
| Male | 252 (67.56) |
| Histological type | |
| Fibrolamellar carcinoma | 3 (0.8) |
| Hepatocellular carcinoma | 363 (97.32) |
| Hepatocholangiocarcinoma (mixed) | 7 (1.88) |
| Histologic grade | |
| NA | 5 (1.34) |
| G1 | 55 (14.75) |
| G2 | 178 (47.72) |
| G3 | 123 (32.98) |
| G4 | 12 (3.22) |
| Stage | |
| NA | 24 (6.43) |
| I | 172 (46.11) |
| II | 87 (23.32) |
| III | 85 (22.79) |
| IV | 5 (1.34) |
| T classification | |
| NA | 2 (0.54) |
| T1 | 182 (48.79) |
| T2 | 95 (25.47) |
| T3 | 80 (21.45) |
| T4 | 13 (3.49) |
| TX | 1 (0.27) |
| N classification | |
| NA | 1 (0.27) |
| N0 | 253 (67.83) |
| N1 | 4 (1.07) |
| NX | 115 (30.83) |
| M classification | |
| M0 | 267 (71.58) |
| M1 | 4 (1.07) |
| MX | 102 (27.35) |
| Radiation therapy | |
| NA | 25 (6.7) |
| No | 340 (91.15) |
| Yes | 8 (2.14) |
| Residual tumor | |
| NA | 7 (1.88) |
| R0 | 326 (87.4) |
| R1 | 17 (4.56) |
| R2 | 1 (0.27) |
| RX | 22 (5.9) |
| Vital status | |
| Deceased | 130 (34.85) |
| Living | 243 (65.15) |
| Relapse | |
| No | 179 (55.94) |
| Yes | 141 (44.06) |
| OGDHL | |
| High | 270 (72.39) |
| Low | 103 (27.61) |
Figure 1.
Expression of OGDHL in cancerous vs. normal liver tissues and in groups with different histologic grade, stage, TNM classification, sex, age, and vital status.
3.2. Diagnostic Capability of OGDHL Expression and Correlation with Clinical Features
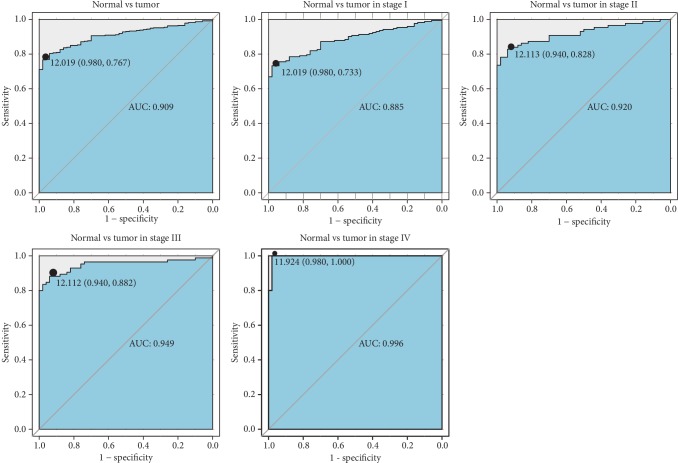
We performed receiver operating characteristic (ROC) analysis to determine the diagnostic value of OGDHL expression (Figure 2). OGDHL expression had excellent diagnostic value overall (AUC = 0.909) and was also able to distinguish noncancerous tissue from stage I cancer (AUC = 0.885), stage II cancer (AUC = 0.920), stage III cancer (AUC = 0.949), and stage IV cancer (AUC = 0.998). We also found that low OGDHL expression correlated with more advanced patient age (P = 0.009), histologic grade (P = 0.000), stage (P = 0.015), T classification (P = 0.020), and poor survival (P = 0.037) (Table 2).
Figure 2.
ROC analysis of the performance of OGDHL expression in identification of cancerous vs. normal tissues in all patients and subgroup analysis of patients with different stages of liver cancer.
Table 2.
Relationship between the clinical features and OGDHL expression in liver cancer patients.
| Clinical characteristics | Variable | No. of patients | OGDHL expression | χ 2 | P value | |||
|---|---|---|---|---|---|---|---|---|
| High | % | Low | % | |||||
| Age | <55 | 117 | 74 | 27.41 | 43 | 42.16 | 6.802 | 0.009 |
| ≥55 | 255 | 196 | 72.59 | 59 | 57.84 | |||
|
| ||||||||
| Gender | Female | 121 | 86 | 31.85 | 35 | 33.98 | 0.072 | 0.788 |
| Male | 252 | 184 | 68.15 | 68 | 66.02 | |||
|
| ||||||||
| Histological type | Fibrolamellar carcinoma | 3 | 3 | 1.11 | 0 | 0 | 1.809 | 0.617 |
| Hepatocellular carcinoma | 363 | 261 | 96.67 | 102 | 99.03 | |||
| Hepatocholangiocarcinoma (mixed) | 7 | 6 | 2.22 | 1 | 0.97 | |||
|
| ||||||||
| Histologic grade | G1 | 55 | 41 | 15.47 | 14 | 13.59 | 25.673 | 0.000 |
| G2 | 178 | 147 | 55.47 | 31 | 30.1 | |||
| G3 | 123 | 69 | 26.04 | 54 | 52.43 | |||
| G4 | 12 | 8 | 3.02 | 4 | 3.88 | |||
|
| ||||||||
| Stage | I | 172 | 135 | 54 | 37 | 37.37 | 10.116 | 0.015 |
| II | 87 | 60 | 24 | 27 | 27.27 | |||
| III | 85 | 51 | 20.4 | 34 | 34.34 | |||
| IV | 5 | 4 | 1.6 | 1 | 1.01 | |||
|
| ||||||||
| T classification | T1 | 182 | 144 | 53.73 | 38 | 36.89 | 10.765 | 0.020 |
| T2 | 95 | 64 | 23.88 | 31 | 30.1 | |||
| T3 | 80 | 49 | 18.28 | 31 | 30.1 | |||
| T4 | 13 | 10 | 3.73 | 3 | 2.91 | |||
| TX | 1 | 1 | 0.37 | 0 | 0 | |||
|
| ||||||||
| N classification | N0 | 253 | 178 | 65.93 | 75 | 73.53 | 3.519 | 0.149 |
| N1 | 4 | 2 | 0.74 | 2 | 1.96 | |||
| NX | 115 | 90 | 33.33 | 25 | 24.51 | |||
|
| ||||||||
| M classification | M0 | 267 | 186 | 68.89 | 81 | 78.64 | 3.523 | 0.156 |
| M1 | 4 | 3 | 1.11 | 1 | 0.97 | |||
| MX | 102 | 81 | 30 | 21 | 20.39 | |||
|
| ||||||||
| Radiation therapy | No | 340 | 245 | 97.22 | 95 | 98.96 | 0.320 | 0.572 |
| Yes | 8 | 7 | 2.78 | 1 | 1.04 | |||
|
| ||||||||
| Residual tumor | R0 | 326 | 239 | 90.53 | 87 | 85.29 | 4.018 | 0.245 |
| R1 | 17 | 12 | 4.55 | 5 | 4.9 | |||
| R2 | 1 | 1 | 0.38 | 0 | 0 | |||
| RX | 22 | 12 | 4.55 | 10 | 9.8 | |||
|
| ||||||||
| Vital status | Deceased | 130 | 85 | 31.48 | 45 | 43.69 | 4.371 | 0.037 |
| Living | 243 | 185 | 68.52 | 58 | 56.31 | |||
3.3. Correlation of OGDHL Expression with Survival
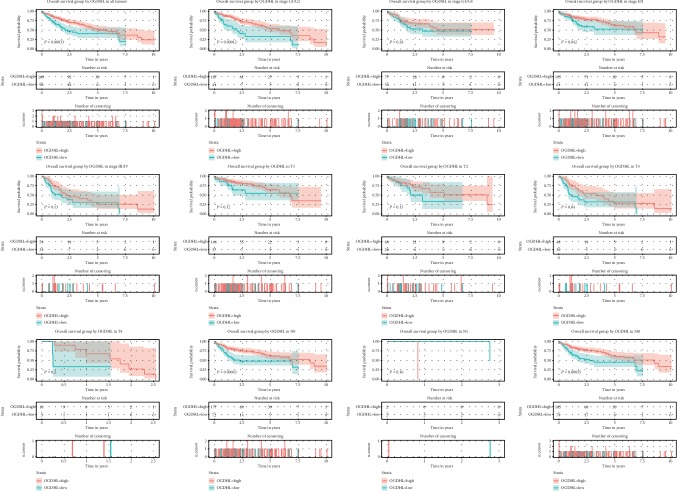
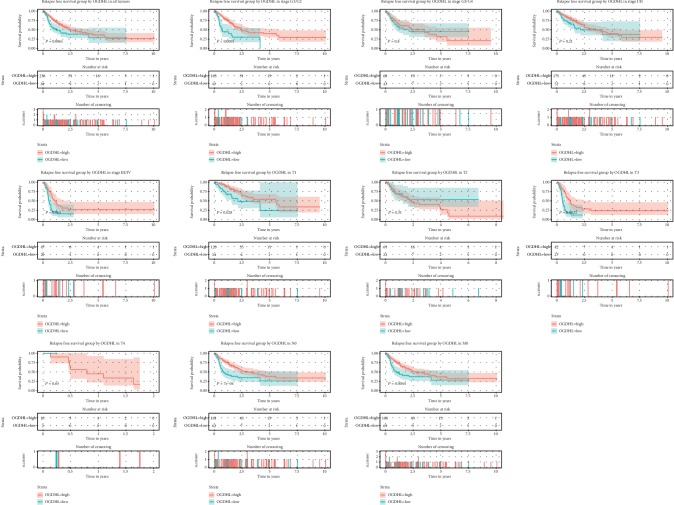
Survival analysis showed that patients with lower OGDHL levels had shorter overall survival (OS), and subgroup analysis indicated this relationship also held for patients with grade G1/G2, stage I/II, T3, N0, and M0 cancers (Figure 3). In addition, patients with lower OGDHL levels had shorter relapse-free survival, and subgroup analysis indicated this relationship also held for patients with grade G1/G2, stage III/IV, T1, T3, N0, and M1 cancers (Figure 4).
Figure 3.
Relationship of OGDHL expression with OS in all patients and subgroup analysis of patients with different classifications of liver cancer (G1/G2, G3/G4, I/II, III/IV, T1-T4, N0, N1, and M0).
Figure 4.
Relationship of OGDHL expression with relapse-free survival in all patients and subgroup analysis of patients with different classifications of liver cancer (G1/G2, G3/G4, I/II, III/IV, T1-T4, N0, and M0).
3.4. Low OGDHL as an Independent Risk Factor for Survival
We initially used univariate Cox analysis to select the potential variables for multivariable analysis (Tables 3 and 4). The subsequent multivariate Cox regression analysis indicated that low OGDHL expression was an independent risk factor for poor OS (hazard ratio (HR) = 1.75; 95% confidence interval (CI) = 1.2 to 2.54; P = 0.003) and poor relapse-free survival (HR = 1.58; 95%CI = 1.09 to 2.3; P = 0.016).
Table 3.
Univariate analysis and multivariate analysis of liver cancer patients' overall survival.
| Parameters | Univariate analysis | Multivariate analysis | ||||
|---|---|---|---|---|---|---|
| Hazard ratio | 95% CI (lower~upper) | P value | Hazard ratio | 95% CI (lower-upper) | P value | |
| Age | 1 | 0.69-1.45 | 0.997 | |||
| Gender | 0.8 | 0.56-1.14 | 0.220 | |||
| Histological type | 0.99 | 0.27-3.66 | 0.986 | |||
| Histologic grade | 1.04 | 0.84-1.3 | 0.698 | |||
| Stage | 1.38 | 1.15-1.66 | 0.001 | 0.83 | 0.67-1.04 | 0.105 |
| T classification | 1.66 | 1.39-1.99 | 0.000 | 1.84 | 1.46-2.32 | 0.000 |
| N classification | 0.73 | 0.51-1.05 | 0.086 | |||
| M classification | 0.72 | 0.49-1.04 | 0.077 | |||
| Radiation therapy | 0.51 | 0.26-1.03 | 0.060 | |||
| Residual tumor | 1.42 | 1.13-1.8 | 0.003 | 1.38 | 1.08-1.77 | 0.011 |
| OGDHL | 1.93 | 1.34-2.79 | 0.000 | 1.75 | 1.2-2.54 | 0.003 |
Table 4.
Univariate analysis and multivariate analysis of liver cancer patients' relapse-free survival.
| Parameters | Univariate analysis | Multivariate analysis | ||||
|---|---|---|---|---|---|---|
| Hazard ratio | 95% CI (lower~upper) | P value | Hazard ratio | 95% CI (lower-upper) | P value | |
| Age | 0.9 | 0.63-1.28 | 0.550 | |||
| Gender | 0.99 | 0.7-1.41 | 0.966 | |||
| Histological type | 2.02 | 0.66-6.24 | 0.220 | |||
| Histologic grade | 0.98 | 0.8-1.21 | 0.883 | |||
| Stage | 1.66 | 1.38-1.99 | 0.000 | 1.09 | 0.85-1.41 | 0.497 |
| T classification | 1.78 | 1.49-2.12 | 0.000 | 1.69 | 1.3-2.19 | 0.000 |
| N classification | 0.97 | 0.67-1.4 | 0.874 | |||
| M classification | 1.17 | 0.79-1.74 | 0.432 | |||
| Radiation therapy | 0.74 | 0.26-2.16 | 0.584 | |||
| Residual tumor | 1.28 | 1.01-1.61 | 0.042 | 1.3 | 1.03-1.66 | 0.030 |
| OGDHL | 1.66 | 1.15-2.39 | 0.007 | 1.58 | 1.09-2.3 | 0.016 |
3.5. OGDHL-Related Signaling Pathways
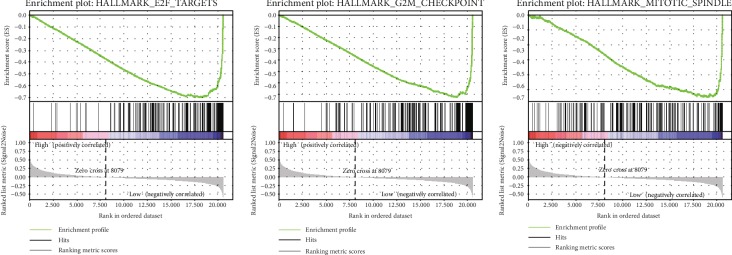
We used GSEA to identify the signaling pathway(s) activated in HCC by comparing data sets that had low and high expression of OGDHL (Table 5, Figure 5). The results indicate significant differences in the enrichment of the MSigDB Collection (false discovery rate < 0.25, nominal P value < 0.05; h.all.v6.2.symbols.gmt). We then identified the most significant signaling pathways based on NES. These results show that E2F targets, the mitotic spindle, and the G2M checkpoint were enriched in the OGDHL low-expression phenotype.
Table 5.
Gene sets enriched in phenotype high.
| NAME | ES | NES | NOM P value | FDR q value |
|---|---|---|---|---|
| HALLMARK_MITOTIC_SPINDLE | 0.608 | 1.963 | 0.000 | 0.027 |
| HALLMARK_G2M_CHECKPOINT | 0.763 | 1.930 | 0.000 | 0.019 |
| HALLMARK_E2F_TARGETS | 0.748 | 1.881 | 0.002 | 0.020 |
Notes: gene sets with NOM P value < 0.05 and FDR q value < 0.25 are considered as significant. Abbreviations: FDR: false discovery rate; NES: normalized enrichment score; NOM: nominal.
Figure 5.
GSEA and identification of the potential targets of OGDHL as E2F, G2M checkpoint and mitotic spindle pathway.
4. Discussion
Our team previously used TCGA to identify diagnostic and prognostic biomarkers for several cancers [13–19]. In the present study, we found that OGDHL had low expression in liver cancer and that low expression correlated with more advanced patient age, histologic grade, stage, T classification, and shorter survival. In addition, our multivariable analysis indicated that low OGDHL expression was a significant diagnostic and prognostic biomarker for liver cancer.
Previous research identified OGDHL as an isoform of 2-oxoglutarate dehydrogenase, which regulated the degradation of glucose and glutamate [3]. An initial study of OGDHL function found enrichment of this protein in the brain but undetectable levels in the heart [2]. Subsequent studies focused on the relationship of OGDHL expression in several cancers and reported low expression in breast cancer [4], cervical cancer [5], and colorectal cancer [6]. Consistent with these results, we found low expression of OGDHL in liver cancer. Moreover, our ROC analysis showed that OGDHL expression had good diagnostic performance for patients with different stages of liver cancer, supporting its clinical use as a diagnostic biomarker. OGDHL expression also gradually decreased as histologic grade increased from G1 to G4, as stage increased from I to III, and as T classification increased from T1 to T3. The reason for the slightly higher expression in patients with the stage IV and T4 liver cancer is unknown, but it may be because we only analyzed a small number of patients with advanced cancer. We also found lower OGDHL expression in deceased than living patients, suggesting that OGDHL expression may be useful as a prognostic indicator.
Several previous studies have examined the functions of OGDHL. For example, Bunik and Degtyarev reported that OGDHL was located in the mitochondria (as predicted based on its sequence) and was an isoform of 2-oxoglutarate dehydrogenase [3]. Fujisawa et al. found that OGDHL functioned in adenylate kinase 4- (AK4-) regulated mitochondrial activity [20]. Yoon et al. identified nardilysin (NRD1) as a mitochondrial cochaperone for OGDH [21]. Sherrill et al. reported that certain variants of OGDHL lead to mitochondrial dysfunction and eosinophilic esophagitis [22]. Sen et al. found that OGDHL functioned as an antiproliferative gene and inhibited tumorigenesis via the AKT signaling pathway [5]. In conjunction with our results, this suggests that the downregulation of OGDHL, which alters mitochondrial function and increases cell proliferation, might explain our observation of a correlation of low OGDHL expression with more advanced cancer.
Many studies of OGDHL that examined its regulation of cancer have focused on methylation of its promoter region [4, 6, 23, 24]. However, no previous studies have examined its clinical significance or prognostic value. We found that patients with liver cancer who had lower OGDHL expression had shorter OS and shorter relapse-free survival. Our subgroup analysis indicated that OGDHL had prognostic value for specific groups of patients in predicting OS (G1/G2, I/II, T3, N0, and M0) and in specific group of patients for predicting relapse-free survival (G1/G2, III/IV, T1, T3, N0, and M1). These results suggest that OGDHL may be useful as a prognostic biomarker for liver cancer.
This study is the first to identify OGDHL as a novel diagnostic and prognostic biomarker for liver cancer. The targets of this protein appear to be the mitotic spindle, G2M checkpoint, and E2F. However, a limitation of this study is that we only examined a small number of patients with advanced-stage liver cancer; the cause of higher OGDHL expression in late stage liver cancer patients needs to be explored in the future study.
5. Conclusion
In conclusion, we found low expression of OGDHL in liver cancer and that low expression correlated with advanced patient age, histologic grade, stage, T classification, and poor survival. We also found that OGDHL expression had value as a diagnostic and prognostic indicator of liver cancer and that low OGDHL expression was an independent prognostic risk factor. Our GSEA analysis indicated that the potential targets of OGDHL were the mitotic spindle, G2M checkpoint, and E2F. This study is the first to identify the diagnostic and prognostic value of OGDHL in liver cancer, and our results indicate that OGDHL might be useful as a novel biomarker for liver cancer.
These results require verification by studies of larger populations.
Contributor Information
Miao He, Email: hemiao_2019@126.com.
Zhaoying Yang, Email: zhaoyingyang@163.com.
Data Availability
The raw data used in this study have been deposited in TCGA database (https://cancergenome.nih.gov/).
Conflicts of Interest
The authors declare that there is no conflict of interest regarding the publication of this paper.
References
- 1.Llovet J. M., Zucman-Rossi J., Pikarsky E., et al. Hepatocellular carcinoma. Nature Reviews. Disease Primers. 2016;2(1, article 16018) doi: 10.1038/nrdp.2016.18. [DOI] [PubMed] [Google Scholar]
- 2.Bunik V., Kaehne T., Degtyarev D., Shcherbakova T., Reiser G. Novel isoenzyme of 2-oxoglutarate dehydrogenase is identified in brain, but not in heart. The FEBS Journal. 2008;275(20):4990–5006. doi: 10.1111/j.1742-4658.2008.06632.x. [DOI] [PubMed] [Google Scholar]
- 3.Bunik V. I., Degtyarev D. Structure-function relationships in the 2-oxo acid dehydrogenase family: substrate-specific signatures and functional predictions for the 2-oxoglutarate dehydrogenase-like proteins. Proteins. 2008;71(2):874–890. doi: 10.1002/prot.21766. [DOI] [PubMed] [Google Scholar]
- 4.Ostrow K. L., Park H. L., Hoque M. O., et al. Pharmacologic unmasking of epigenetically silenced genes in breast cancer. Clinical Cancer Research. 2009;15(4):1184–1191. doi: 10.1158/1078-0432.CCR-08-1304. [DOI] [PMC free article] [PubMed] [Google Scholar]
- 5.Sen T., Sen N., Noordhuis M. G., et al. OGDHL is a modifier of AKT-dependent signaling and NF-κB function. PLoS One. 2012;7(11, article e48770) doi: 10.1371/journal.pone.0048770. [DOI] [PMC free article] [PubMed] [Google Scholar]
- 6.Fedorova M. S., Kudryavtseva A. V., Lakunina V. A., et al. Downregulation of OGDHL expression is associated with promoter hypermethylation in colorectal cancer. Molecular Biology. 2015;49(4):678–688. doi: 10.7868/S0026898415040047. [DOI] [PubMed] [Google Scholar]
- 7.Team R. C. R: A Language and Environment for Statistical Computing. Vienna, Austria: R Foundation for Statistical Computing; 2009. [Google Scholar]
- 8.Robin X., Turck N., Hainard A., et al. pROC: an open-source package for R and S+ to analyze and compare ROC curves. BMC Bioinformatics. 2011;12(1, article 77) doi: 10.1186/1471-2105-12-77. [DOI] [PMC free article] [PubMed] [Google Scholar]
- 9.Therneau T. M., Grambsch P. M. Modeling Survival Data: Extending the Cox Model. New York: Springer; 2000. [DOI] [Google Scholar]
- 10.Wickham H. Ggplot2 :elegant graphics for data analysis. Journal of the Royal Statistical Society. 2011;174(1):245–246. [Google Scholar]
- 11.Mootha V. K., Lindgren C. M., Eriksson K. F., et al. PGC-1α-responsive genes involved in oxidative phosphorylation are coordinately downregulated in human diabetes. Nature Genetics. 2003;34(3):267–273. doi: 10.1038/ng1180. [DOI] [PubMed] [Google Scholar]
- 12.Subramanian A., Tamayo P., Mootha V. K., et al. Gene set enrichment analysis: a knowledge-based approach for interpreting genome-wide expression profiles. Proceedings of the National Academy of Sciences of the United States of America. 2005;102(43):15545–15550. doi: 10.1073/pnas.0506580102. [DOI] [PMC free article] [PubMed] [Google Scholar]
- 13.Jiao Y., Fu Z., Li Y., Meng L., Liu Y. High EIF2B5 mRNA expression and its prognostic significance in liver cancer: a study based on the TCGA and GEO database. Cancer Management and Research. 2018;10:6003–6014. doi: 10.2147/CMAR.S185459. [DOI] [PMC free article] [PubMed] [Google Scholar]
- 14.Jiao Y., Fu Z., Li Y., Zhang W., Liu Y. Aberrant FAM64A mRNA expression is an independent predictor of poor survival in pancreatic cancer. PLoS One. 2019;14(1, article e0211291) doi: 10.1371/journal.pone.0211291. [DOI] [PMC free article] [PubMed] [Google Scholar]
- 15.Jiao Y., Li Y., Jiang P., Han W., Liu Y. PGM5: a novel diagnostic and prognostic biomarker for liver cancer. PeerJ. 2019;7, article e7070 doi: 10.7717/peerj.7070. [DOI] [PMC free article] [PubMed] [Google Scholar]
- 16.Jiao Y., Li Y., Liu S., Chen Q., Liu Y. ITGA3 serves as a diagnostic and prognostic biomarker for pancreatic cancer. OncoTargets and Therapy. 2019;12:4141–4152. doi: 10.2147/OTT.S201675. [DOI] [PMC free article] [PubMed] [Google Scholar]
- 17.Jiao Y., Li Y., Lu Z., Liu Y. High trophinin-associated protein expression is an independent predictor of poor survival in liver cancer. Digestive Diseases and Sciences. 2019;64(1):137–143. doi: 10.1007/s10620-018-5315-x. [DOI] [PubMed] [Google Scholar]
- 18.Li Y., Jiao Y., Fu Z., Luo Z., Su J., Li Y. High miR-454-3p expression predicts poor prognosis in hepatocellular carcinoma. Cancer Management and Research. 2019;11:2795–2802. doi: 10.2147/CMAR.S196655. [DOI] [PMC free article] [PubMed] [Google Scholar]
- 19.Hou L., Zhang X., Jiao Y., et al. ATP binding cassette subfamily B member 9 (ABCB9) is a prognostic indicator of overall survival in ovarian cancer. Medicine. 2019;98(19, article e15698) doi: 10.1097/MD.0000000000015698. [DOI] [PMC free article] [PubMed] [Google Scholar]
- 20.Fujisawa K., Terai S., Takami T., et al. Modulation of anti-cancer drug sensitivity through the regulation of mitochondrial activity by adenylate kinase 4. Journal of Experimental & Clinical Cancer Research. 2016;35(1, article 48) doi: 10.1186/s13046-016-0322-2. [DOI] [PMC free article] [PubMed] [Google Scholar]
- 21.Yoon W. H., Sandoval H., Nagarkar-Jaiswal S., et al. Loss of nardilysin, a mitochondrial co-chaperone for α-ketoglutarate dehydrogenase, promotes mTORC1 activation and neurodegeneration. Neuron. 2017;93(1):115–131. doi: 10.1016/j.neuron.2016.11.038. [DOI] [PMC free article] [PubMed] [Google Scholar]
- 22.Sherrill J. D., KC K., Wang X., et al. Whole-exome sequencing uncovers oxidoreductases DHTKD1 and OGDHL as linkers between mitochondrial dysfunction and eosinophilic esophagitis. JCI Insight. 2018;3(8) doi: 10.1172/jci.insight.99922. [DOI] [PMC free article] [PubMed] [Google Scholar]
- 23.Lo P. K., Watanabe H., Cheng P. C., et al. MethySYBR, a novel quantitative PCR assay for the dual analysis of DNA methylation and CpG methylation density. The Journal of Molecular Diagnostics. 2009;11(5):400–414. doi: 10.2353/jmoldx.2009.080126. [DOI] [PMC free article] [PubMed] [Google Scholar]
- 24.Guerrero-Preston R., Hadar T., Ostrow K. L., et al. Differential promoter methylation of kinesin family member 1a in plasma is associated with breast cancer and DNA repair capacity. Oncology Reports. 2014;32(2):505–512. doi: 10.3892/or.2014.3262. [DOI] [PMC free article] [PubMed] [Google Scholar]
Associated Data
This section collects any data citations, data availability statements, or supplementary materials included in this article.
Data Availability Statement
The raw data used in this study have been deposited in TCGA database (https://cancergenome.nih.gov/).


