

Summary
Regulatory B cells (Bregs) play a critical role in the control of autoimmunity and inflammation. IL-10 production is the hallmark for the identification of Bregs. However, the molecular determinants that regulate the transcription of IL-10 and control the Breg developmental program remain unknown. Here, we demonstrate that aryl hydrocarbon receptor (AhR) regulates the differentiation and function of IL-10-producing CD19+CD21hiCD24hiBregs and limits their differentiation into B cells that contribute to inflammation. Chromatin profiling and transcriptome analyses show that loss of AhR in B cells reduces expression of IL-10 by skewing the differentiation of CD19+CD21hiCD24hiB cells into a pro-inflammatory program, under Breg-inducing conditions. B cell AhR-deficient mice develop exacerbated arthritis, show significant reductions in IL-10-producing Bregs and regulatory T cells, and show an increase in T helper (Th) 1 and Th17 cells compared with B cell AhR-sufficient mice. Thus, we identify AhR as a relevant contributor to the transcriptional regulation of Breg differentiation.
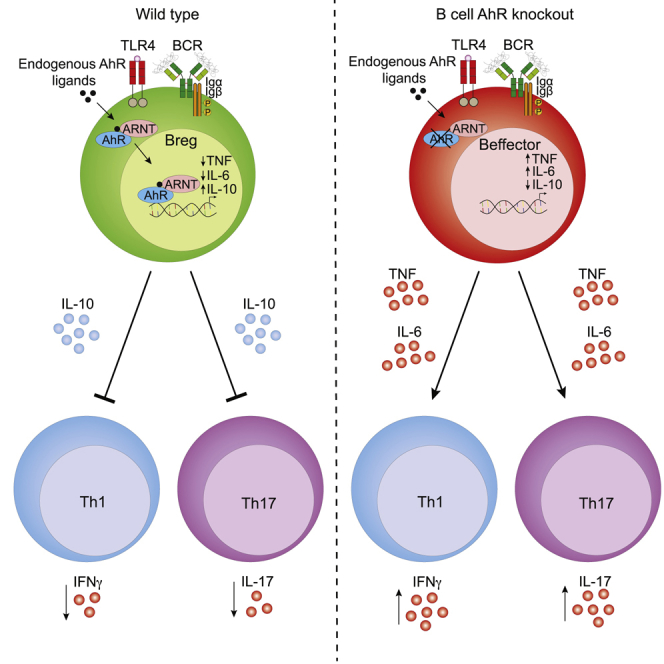
Graphical Abstract
Highlights
-
•
IL-10+ Bregs are identified by high expression of AhR
-
•
B cell AhR deficiency leads to exacerbated arthritis and impaired Breg function
-
•
AhR directly binds to and regulates the expression of IL-10 in Bregs
-
•
AhR maintains Breg phenotype by suppressing pro-inflammatory gene expression
The transcriptional control of interleukin-10 (IL-10) in regulatory B cells (Bregs) remains undefined. Piper et al. identify the aryl hydrocarbon receptor (AhR) as an important transcription factor involved in Breg differentiation and show a direct role of AhR in the regulation of IL-10 transcription.
Introduction
B cells with immunosuppressive capacity, known as regulatory B cells (Bregs), play an important role in restraining inflammation. In mice, regulatory function has been ascribed to IL-10-producing transitional type 2 marginal zone precursors (T2-MZPs) (Evans et al., 2007), marginal zone (MZ) (Gray et al., 2007) and CD1dhiCD5+B cells (Yanaba et al., 2008), plasmablast (Matsumoto et al., 2014), and plasma cell (Lino et al., 2018) populations. Bregs suppress inflammatory cytokine production by T cells and promote the differentiation of Foxp3+ regulatory T cells (Tregs), primarily via the secretion of interleukin-10 (IL-10) (Carter et al., 2011, Rosser et al., 2014). Mice lacking IL-10-expressing B cells develop exacerbated autoimmune arthritis and experimental autoimmune encephalitis (EAE) (Carter et al., 2011, Fillatreau et al., 2002), and adoptive transfer of IL-10-deficient B cells to arthritic mice fails to suppress inflammation (Carter et al., 2011).
B cell receptor (BCR) engagement, Toll-like receptor (TLR) agonists lipopolysaccharide (LPS; TLR2 and TLR4) (Lampropoulou et al., 2008, Tian et al., 2001), CpG oligo-deoxynucleotides (TLR9), and inflammatory cytokines such as IL-1β and IL-6 or IFN-α are all potent inducers of B cell-derived IL-10, suggesting an important role for Bregs in the restoration of tolerance after infection or inflammation (Menon et al., 2016, Rosser et al., 2014). Cell-derived signals arising from B and T lymphocyte cross-talk, including T cell-derived CD40L and IL-21, further support the expansion of Bregs (Mauri et al., 2000, Yoshizaki et al., 2012). Bregs, in turn, suppress inflammatory cytokine production by T cells and promote the differentiation of Foxp3+ regulatory T cells (Treg) (Carter et al., 2011, Oleinika et al., 2018, Rosser et al., 2014).
Unlike in murine T cells, in which it is well established that IL-10 expression is controlled by several transcription factors, including c-Maf and the aryl hydrocarbon receptor (AhR) (Apetoh et al., 2010), there is limited knowledge of the transcriptional control of IL-10 production by Bregs. To date, studies of the molecular control of B cell IL-10 production have been limited to the examination of NFAT downstream of STIM1/STIM2 calcium sensors (Matsumoto et al., 2011) and Myd88 (Liu et al., 2019) in mice and ERK (Li et al., 2012) and STAT3 (Blair et al., 2010) in humans. More recently, Blimp1 and IRF4 (Matsumoto et al., 2014) have been linked to IL-10+ plasmablasts, but at least for Blimp1 and IRF4, neither transcription factor appeared to directly control the production of IL-10 by splenic B cells (Matsumoto et al., 2014).
To explore the molecular mechanisms regulating the differentiation of B cells into IL-10-producing Bregs, we used an IL-10-eGFP reporter mouse (Madan et al., 2009). We compared the gene expression profiles of IL-10eGFP+CD19+CD21hiCD24hiBregs, IL-10eGFP−CD19+CD21hiCD24hiB cells, and IL-10eGFP−CD19+CD21intCD24int follicular (FO) B cells isolated from arthritic mice (FO B cells do not produce IL-10 and do not suppress arthritis after adoptive transfer; Evans et al., 2007). We chose to study IL-10+CD19+CD21hiCD24hiBregs because this population contains both T2-MZP and MZ B cells, which together have been shown to contain the vast majority of splenic IL-10-producing Bregs (Evans et al., 2007, Gray et al., 2007).
IL-10eGFP+CD19+CD21hiCD24hiBregs have a unique transcriptome, characterized by a highly restricted cytokine/chemokine profile that distinguishes them from the IL-10eGFP−B cell subsets. AhR was among the most significant differentially expressed transcription factors in IL-10eGFP+CD19+CD21hiCD24hiBregs, compared with both IL-10eGFP−CD19+CD21hiCD24hiB cells and IL-10eGFP−FO B cells. We show that AhR binds upstream to the transcription start site (TSS) of the Il10 locus in IL-10eGFP+B cells but not in IL-10eGFP−B cells. LPS and anti-IgM, stimuli previously shown and confirmed here to induce the expression of AhR (Vaidyanathan et al., 2017, Villa et al., 2017), promote the differentiation of CD19+CD21hiCD24hiB cells (a population poised to become Bregs; Evans et al., 2007, Matsumoto et al., 2011) into IL-10+CD19+CD21hiCD24hiBregs. Taking advantage of high-throughput sequencing, we demonstrated that activation of AhR under this Breg-polarizing condition results in the suppression of several pro-inflammatory cytokine and chemokine genes and in a highly restricted phenotype in CD19+CD21hiCD24hiB cells congruous with an immunosuppressive population.
In vivo, B cell-specific deletion of AhR caused exacerbated arthritis, reduced IL-10 production by CD19+CD21hiCD24hiBregs, and reduced the frequency of Foxp3+Tregs and expansion of Th1 and Th17 cells. These results support a role of AhR in the differentiation of IL-10-producing Bregs and in the control of their immunosuppressive phenotype.
Results
IL-10+ Bregs Present a Restricted Cytokine and Chemokine Gene Expression Profile
To identify candidate genes that regulate the transcription of IL-10 in Bregs, arthritis was induced in IL-10eGFP reporter mice (Vert-x) (Madan et al., 2009). We sorted splenic IL-10eGFP+CD19+CD21hiCD24hiBregs, IL-10eGFP−CD19+CD21hiCD24hiB cells, and IL-10eGFP−FO B cells (the two GFP− populations are hereafter referred to as IL-10eGFP−B cell subsets) and profiled these cells using gene expression microarray (Figures 1A and 1B). Of note, very few IL-10-producing Bregs were present in the joint or draining lymph nodes (DLNs) of arthritic mice (Figure S1A). This sorting strategy was chosen to capture the majority of described Breg subsets, including IL-10+T2-MZP, IL-10+MZ, and IL-10+CD1dhiCD5+, which have been shown to exert suppressive capacity via IL-10 in this model of arthritis and in other models of autoimmunity (Brummel and Lenert, 2005, Evans et al., 2007, Tian et al., 2001, Yanaba et al., 2009). Virtually no IL-10-expressing plasma cells or plasmablasts (LAG-3+ plasma cells [Lino et al., 2018] and CD138+CD44+ plasmablasts [Matsumoto et al., 2014]) were detected in the spleen or DLNs following the induction of arthritis (Figures S1B–S1H). The purity of sorted IL-10eGFP+ and IL-10eGFP− subsets isolated for the microarray was more than 98% (Figure S1I). Principal-component analysis (PCA) revealed three distinct groups along the first dimension, with the IL-10eGFP+CD19+CD21hiCD24hiBreg population clustered separately away from both IL-10eGFP−B cell subsets (Figure 1C). Analysis of gene expression revealed 1,073 differentially expressed genes (DEGs) between IL-10eGFP+CD19+CD21hiCD24hiBregs and IL-10eGFP−CD19+CD21hiCD24hiB cells and 1,267 genes that were differentially expressed between IL-10eGFP+CD19+CD21hiCD24hiBregs and IL-10eGFP−FO B cells (fold change > 1.5 and adjusted p value < 0.05) (Figure S1J; Figure 1D).
Figure 1.

Bregs Express a Highly Specific Cytokine and Chemokine Transcriptional Profile
Antigen-induced arthritis (AIA) was induced in IL-10eGFP reporter (Vert-X) mice.
(A) Representative flow cytometry plots showing the frequency of CD19+CD21hiCD24hi and CD19+CD21intCD24int(FO)B cells.
(B) Representative flow cytometry plots showing the frequency of IL-10eGFP+ respectively in CD19+CD21hiCD24hi and FO B cell subsets.
(C) Principal-component analysis of transcripts in CD19+CD21hiCD24hieGFP+, CD19+CD21hiCD24hieGFP−, and FO B cell subsets (n = 3).
(D) Heatmap showing the expression of genes by CD19+CD21hiCD24hiGFP+, CD19+CD21hiCD24hiGFP−, and FO B cells. Blue dashed line represents SD of 0.
(E) Heatmaps showing the expression of cytokine (left) and chemokine (right) genes in the respective subsets.
(F) Heatmaps of cytokine receptor (left) and chemokine receptor (right) expression profiles in the respective subsets (n = 3).
(G) Log2 fold changes (FCs) of all significant genes identified in (E) and (F) for the GFP+ (left graph) and GFP− (right graph) signatures. Log2 FCs are highlighted for GFP+ versus both GFP− populations.
All experiments were performed at day 7 post-IA injection. For (D)–(F), heatmaps show Z scores based on normalized GeneChip robust multiarray averaging (GC-RMA) values. Listed genes highlighted in red are upregulated in the CD19+CD21hiCD24hieGFP+ population compared with CD19+CD21hiCD24hieGFP− (adjusted p value < 0.05). In (A) and (B), data are representative of at least five independent experiments.
See also Figure S1.
In the context of arthritis, splenic Bregs have been shown to produce mainly IL-10 (Rosser and Mauri, 2015). Of the cytokine genes upregulated in IL-10eGFP+CD19+CD21hiCD24hiBregs, only Il10 and Ebi3 reached an adjusted p value of < 0.05, compared with both IL-10eGFP− B cell subsets. However, because Il12a was not found to be upregulated in IL-10eGFP+CD19+CD21hiCD24hiBregs, we excluded a role of IL-35 in these cells. Although a trend in the increase of transcripts for pro-inflammatory genes such as Il1a, Il12b, Il15, and Il18 was noted, the expression of these genes was not significantly different from the IL-10eGFP−B cell subsets (Figure 1E). IL-10eGFP−FO B cells, which unlike CD19+CD21hiCD24hiB cells do not suppress inflammation on adoptive transfer (Evans et al., 2007), express a different transcriptional profile, characterized by higher expression of cytokines and cytokine receptors known to mediate inflammatory responses, compared with IL-10eGFP+CD19+CD21hiCD24hiBregs (Figures 1E and 1F). The transcripts that were significantly differentially expressed in IL-10eGFP+CD19+CD21hiCD24hiBregs versus IL-10eGFP−B cell subsets are summarized in (Figure 1G). In keeping with the anti-inflammatory role of Bregs, we found that the Th2-attracting chemokines Ccl17 and Ccl22 (Imai et al., 1999, Nakayama et al., 2004), and the chemokine receptor Cxcr3, important for the trafficking of lymphocytes to the synovium in arthritis (Mohan and Issekutz, 2007), were upregulated in IL-10eGFP+CD19+CD21hiCD24hiBregs compared with IL-10eGFP−B cell subsets (Figures 1E–1G). These results showed that in the context of arthritis, splenic Bregs displayed a distinct anti-inflammatory transcriptional profile compared with IL-10eGFP−B cell subsets.
AhR Is Highly Expressed in IL-10-Producing Bregs
To screen for molecules involved in IL-10 transcription and Breg function, genes concordant for comparison 1 (between IL-10eGFP+CD19+CD21hiCD24hiBregs and IL-10eGFP−FO B cells) and comparison 2 (between IL-10eGFP+CD19+CD21hiCD24hiBregs and IL-10eGFP−CD19+CD21hiCD24hiB cells) (Figure S1K) were filtered on the basis of the transcription factor Gene Ontology term, resulting in 23 candidates (Figure 2A). Pathway analyses showed that AhR represented a central network hub (Figure 2B) and was the most significantly enriched candidate in IL-10eGFP+CD19+CD21hiCD24hiBregs (adjusted p value < 3.34 × 10⁻⁵; Table S1; Figure S1L). Analysis of transcription factors previously shown to be associated with IL-10 transcriptional regulation in other lymphocyte subsets, including Tregs (Iyer and Cheng, 2012), confirmed that AhR was the most significantly upregulated IL-10-related transcription factors in IL-10eGFP+CD19+CD21hiCD24hiBregs, in comparison with IL-10eGFP−B cell subsets (Figure 2C). Microarray signal intensities for Il10 and Ahr were higher in IL-10eGFP+CD19+CD21hiCD24hiBregs compared with IL-10eGFP−B cell subsets (Figure 2D). qPCR analysis confirmed that Il10 and Ahr mRNA expression was higher in IL-10eGFP+CD19+CD21hiCD24hiBregs than in both IL-10eGFP−B cell subsets (Figures 2E and 2F). Corroborating the results in Figures 2E and 2F, assay for transposase-accessible chromatin using sequencing (ATAC-seq) showed increased accessibility in both the Il10 and Ahr loci in IL-10eGFP+CD19+CD21hiCD24hiBregs, in comparison with both IL-10eGFP−B cell subsets (Figure 2G).
Figure 2.

Identification of AhR as a Key IL-10 Associated Transcription Factor in Bregs
Antigen-induced arthritis (AIA) was induced in IL-10eGFP reporter mice.
(A) Heatmap showing Z scores of significant DEG (n = 23, adjusted p value < 0.05) based on normalized GC-RMA values, filtered on transcription factor activity Gene Ontology terms in sorted CD19+CD21hiCD24hieGFP+, CD19+CD21hiCD24hieGFP−, and FO B cells.
(B) Ingenuity pathway network analysis identifies a cluster of genes with AhR as the central hub. The lines between genes represent known interactions (solid lines represent direct interactions, dashed lines represent indirect interactions).
(C) Heatmap of Z scores of transcription factors regulating IL-10, expressed by CD19+CD21hiCD24hieGFP+, CD19+CD21hiCD24hieGFP−, and FO B cells. Genes highlighted in red are upregulated in the CD19+CD21hiCD24hiGFP+ population compared with eGFP− populations. Black asterisks, adjusted p value < 0.05 for the comparison of CD19+CD21hiCD24hieGFP+ versus FO eGFP−. Red asterisks, adjusted p value < 0.05 for the comparison of CD19+CD21hiCD24hieGFP+ versus CD19+CD21hiCD24hieGFP−.
(D) Microarray signal intensities of Il10 and Ahr (n = 3).
(E and F) Validation of (E) Il10 and (F) Ahr mRNA expression in the indicated B cell subsets by qPCR (n = 3).
(G) Representative ATAC-seq tracks for the Il10 and Ahr loci in CD19+CD21hiCD24hieGFP+, CD19+CD21hiCD24hieGFP−, and FO B cells (n = 3). Track heights between samples are normalized through group autoscaling. For qPCR, gene expression was calculated normalizing to β-actin.
All experiments were performed at day 7 post-IA injection. In (D)–(F), data are expressed as mean ± SEM. In (E) and (F), data are representative of three independent experiments with biological replicates. ∗p < 0.05, ∗∗p < 0.01, and ∗∗∗p < 0.001, one- and two-way ANOVA.
See also Figures S1 and S2 and Table S1.
AhR Upregulation Promotes the Generation of IL-10+CD19+CD21hiCD24hiBregs
We and others have recently shown that BCR signals combined with TLR stimulation induce a substantial upregulation of AhR in B cells (Vaidyanathan et al., 2017, Villa et al., 2017). Because BCR signals together with TLR engagement are known to be pivotal in the generation of Bregs (Rosser and Mauri, 2015), next we investigated whether the differentiation of Bregs “marked” by the induction of IL-10 expression by these stimuli was AhR dependent. For this purpose, CD19+CD21hiCD24hiB cells were sorted from the spleens of arthritic mice and stimulated with LPS ± anti-IgM. An 11-fold increase in the frequency of IL-10+CD19+CD21hiCD24hiBregs and a 200-fold increase in the production of IL-10 by CD19+CD21hiCD24hiBregs were observed upon LPS+anti-IgM stimulation compared with unstimulated cells (Figures 3A–3C). Increased levels of AhR expression in IL-10+CD19+CD21hiCD24hi Bregs compared with IL-10−FO and IL-10−CD19+CD21hiCD24hiB cells were confirmed using flow cytometry (Figures S2A and S2B). We established the kinetics of AhR and AhR pathway-associated gene expression in relation to Il10 transcription, after activation with Breg-polarizing stimuli. We observed a peak in the expression of Ahr and Cyp1a1 (the gene encoding the AhR-dependent cytochrome P4501A1) at 6 h post-stimulation with LPS+anti-IgM, followed by an upregulation of AhR repressor (Ahrr) and Il10 at 24 h. No significant changes in the expression of the AhR binding partner AhR nuclear translocator (Arnt) were observed (Figures 3D–3H). Of note, ex vivo CD19+CD21hiCD24hiB cells display higher expression of Ahr (confirmed at the protein level using flow cytometry and western blotting), Il10, Cyp1a1, Ahrr, and Arnt compared with FO B cells (Figures S2C–S2J). Together these data show that IL-10+CD19+CD21hiCD24hiBregs express the highest levels of AhR compared with the IL-10−CD19+CD21hiCD24hi and IL-10−FO B cells and that in CD19+CD21hiCD24hiB cells, AhR upregulation precedes the production of IL-10.
Figure 3.

The Effect of AhR in the Differentiation of CD19+CD21hiCD24hi into Bregs
Antigen-induced arthritis (AIA) was induced in IL-10eGFP reporter or C57BL/6 mice.
(A and B) Representative flow cytometry plots (A) and bar chart (B) showing the percentage of IL-10 expression in CD19+CD21hiCD24hiB cells (n = 5). In these experiments, CD19+CD21hiCD24hiB cells were stimulated for 24 h with LPS, followed by an additional 24 h with anti-IgM.
(C) IL-10 production, as measured by ELISA (n = 7).
(D–H) CD19+CD21hiCD24hiB cells were isolated from WT C57BL/6 mice and stimulated for 6 or 24 h with LPS+anti-IgM. The mRNA levels of (D) Ahr, (E) Cyp1a1, (F) Ahrr, (G) Arnt, and (H) Il10 were analyzed ex vivo and after stimulation (n = 3).
(I) IL-10 production measured by ELISA in LPS+anti-IgM-stimulated CD19+CD21hiCD24hiB cells and FO B cells (n = 4 per group).
(J) CpGb-stimulated CD19+CD21hiCD24hi and FO B cells from Ahr+/− and Ahr−/− mice co-cultured for 72 h with anti-CD3 stimulated autologous CD4+T cells from Ahr+/− mice. Representative flow cytometry plots showing the frequency of IFN-γ+CD4+ T cell.
(K) Bar chart showing percentage suppression of IFN-γ+CD4+ T cells by splenic CD19+CD21hiCD24hiB cells or FO B cells following stimulation with anti-CD3 (n = 3).
(L) CD19+CD21hiCD24hi and FO B cells were stimulated for 6 h with either vehicle alone (DMSO) or the AhR agonist FICZ, and the expression of Cyp1a1 and Il10 was measured using qRT-PCR (n = 3).
(M) Jaspar binding motif analysis of putative AhR binding sites (XRE sites) in 500 bp regions of DNA, upstream of the Il10 TSS.
(N) Schematic representing the experimental design for the ChIP-qPCR assay. Briefly, we isolated splenic B cells from IL-10eGFP reporter mice and stimulated them for 24 h with LPS, followed by 24 h with anti-IgM+FICZ.
(O) ChIP analysis of AhR binding to the Il10 locus was performed in IL-10eGFP+CD19+ and IL-10eGFP−CD19+ B cells. Bar chart showing the relative enrichment of AhR binding to regions upstream/downstream or in the promoters (labeled as P) of Il10, Cyp1a1, and Gapdh (n = 3). For qPCR, gene expression was calculated normalizing to β-actin.
All experiments were performed at day 7-post-IA injection. Data representative of at least three independent experiments with biological replicates. In (B)–(I), (K), (L), and (O), data are expressed as mean ± SEM. ∗p < 0.05, ∗∗p < 0.01, and ∗∗∗p < 0.001, one- and two-way ANOVA.
See also Figure S2.
To understand the role of AhR in the regulation and function of IL-10 expression in CD19+CD21hiCD24hiBregs, we isolated CD19+CD21hiCD24hiB cells and FO B cells from Ahr+/− and Ahr−/− mice and stimulated them in vitro with LPS+anti-IgM. Lack of AhR significantly reduced the ability of CD19+CD21hiCD24hiB cells to differentiate into IL-10-producing CD19+CD21hiCD24hiBregs compared with AhR competent CD19+CD21hiCD24hiB cells (Figure 3I). In addition, Ahr−/− CD19+CD21hiCD24hiB cells presented a reduced capacity to inhibit IFN-γ production by CD4+T cells in vitro compared with Ahr+/− CD19+CD21hiCD24hiB cells (Figures 3J and 3K). FO B cells failed to produce IL-10 and to suppress IFN-γ by CD4+ T cells, irrespective of AhR expression (Figures 3I–3K).
To assess if activation of AhR directly with endogenous ligands promotes the differentiation of CD19+CD21hiCD24hiB cells into IL-10+CD19+CD21hiCD24hiBregs, we stimulated sorted CD19+CD21hiCD24hiB cells or FO B cells with the AhR ligand 6-formylindolo(3,2-b) carbazole (FICZ). AhR activation significantly upregulated the expression of Cyp1a1 and Il10 in the CD19+CD21hiCD24hiB cell subset but not in FO B cells compared with the vehicle control (Figure 3L). Secretion of IL-10 was further enhanced by the addition of FICZ to LPS+anti-IgM-stimulated CD19+CD21hiCD24hiB cells, compared with LPS+anti-IgM alone (Figure S2K). An increase in Breg IL-10 expression was observed when CD19+CD21hiCD24hiB cells were cultured in Iscove’s modified Dulbecco’s medium (IMDM; enriched in aromatic amino acids that give rise to AhR ligands; Veldhoen et al., 2009) (Heath-Pagliuso et al., 1998) compared with RPMI media (Figure S2L).
We next investigated whether AhR regulates IL-10 expression in IL-10eGFP+CD19+CD21hiCD24hiBregs by directly binding the Il10 locus. To address this, we took advantage of the JASPAR tool (Khan et al., 2018) and identified putative AhR binding sites in 500 bp regions up to −5 kb upstream and +5 kb downstream of the Il10 TSS and designed primer probes to span these regions (Figure 3M). We sorted IL-10eGFP+ and IL-10eGFP−B cells, after stimulation with LPS+anti-IgM+FICZ (the combination of stimuli was used to maximize AhR activation and translocation to the nucleus) and performed chromatin immunoprecipitation (ChIP) qPCR on AhR-bound DNA (Figure 3N). Significantly enriched AhR binding was observed at −3.5 kb upstream of the Il10 TSS in the IL-10eGFP+ population. Minimal binding of AhR was observed in other regions of the Il10 locus. As a positive control, we confirmed that under these experimental conditions, there was enriched binding of AhR to the promoter of Cyp1a1 but no binding to Gapdh, an AhR-independent housekeeping gene (Figure 3O). These results show that AhR controls IL-10 transcription and the function of Bregs.
AhR Controls the Breg Transcriptional Program by Suppressing Pro-inflammatory Gene Expression
To examine the role of AhR in controlling the differentiation of CD19+CD21hiCD24hiB cells into Bregs, and to ascertain the relative contribution of AhR in establishing the restricted Breg phenotype identified in the microarray (Figures 1E–1G) in addition to IL-10 production, we took advantage of mice with a B cell-specific deficiency of AhR (Ahrfl/−Mb1cre/+) (Villa et al., 2017)) (Figures S3A and S3B). The use of these mice avoids any cell extrinsic effects of AhR that could indirectly influence Breg differentiation (Stockinger et al., 2014). CD19+CD21hiCD24hiB cells were sorted from immunized Mb1cre/+ and Ahrfl/−Mb1cre/+ mice, and the transcriptional profile of sorted CD19+CD21hiCD24hiB cells was compared before and after stimulation under Breg-polarizing conditions (LPS+anti-IgM). Both the normalized counts for Ahr and the accessibility of the Ahr locus measured by ATAC-seq increased in LPS+anti-IgM-stimulated Mb1cre/+ CD19+CD21hiCD24hiB cells compared with ex vivo Mb1cre/+ CD19+CD21hiCD24hiB cells (Figures S4A and S4B). Signaling pathway impact analysis (SPIA) of DEGs revealed overrepresented pathways relating to cytokine-cytokine receptor interactions and chemokine signaling in stimulated Mb1cre/+ CD19+CD21hiCD24hiB cells versus ex vivo Mb1cre/+ CD19+CD21hiCD24hiB cells (Figure 4A). Analysis of the genes differentially expressed within this pathway confirmed that under Breg-polarizing conditions, several genes identified in the IL-10eGFP+ signature (as shown in Figure 1G), including Il10, Ccl22, and Il2ra, were upregulated, while those associated with the IL-10eGFP− signature, including Il12a, Il10ra, and Ltb, were downregulated under Breg-polarizing conditions (Figure 4B; Figure S4C).
Figure 4.

AhR Suppresses Pro-inflammatory Gene Expression during the Differentiation of Bregs
AIA was induced in Mb1cre/+ and Ahrfl/−Mb1cre/+ mice.
(A) Signaling pathway impact analysis (SPIA) showing the top significant (p < 0.05) over-represented and under-represented pathways in LPS+anti-IgM-stimulated compared with ex vivo CD19+CD21hiCD24hiB cells from Mb1cre/+ mice. The total perturbation accumulation of these pathways (tA) score is represented on the x axis.
(B) Volcano plot of RNA-seq analysis showing log2 fold changes (FCs) between LPS+anti-IgM-stimulated compared with ex vivo CD19+CD21hiCD24hiB cells from Mb1cre/+ mice, plotted against –log10 p value for the cytokine-cytokine receptor interaction pathway. Red dots represent significant DEG, with the red line denoting a cut-off p value of < 0.05.
(C) Signaling pathway impact analysis (SPIA) showing the top significant (p < 0.05) over-represented and under-represented pathways in 6 h LPS+anti-IgM-stimulated CD19+CD21hiCD24hiB cells from Ahrfl/−Mb1cre/+ mice compared with Mb1cre/+ mice.
(D) Volcano plot of RNA-seq analysis showing log2 fold changes (FCs) between LPS+anti-IgM-stimulated CD19+CD21hiCD24hiB cells from Ahrfl/−Mb1cre/+ versus Mb1cre/+ mice, plotted against –log10 p value for the cytokine-cytokine receptor interaction pathway.
(E) CD19+CD21hiCD24hiB cells were isolated from Mb1cre/+ mice and Ahrfl/−Mb1cre/+ mice, stimulated for 6 h with LPS+anti-IgM, and assessed for mRNA levels of Il2, Il6, Tnf, Ccl22, and Il5ra (n = 4).
(F) IL-2, IL-6, and TNFα concentrations from 48 h LPS+anti-IgM-stimulated CD19+CD21hiCD24hi B cells from Mb1cre/+ mice and Ahrfl/−Mb1cre/+ mice (n = 4).
(G) Volcano plot of ATAC-seq DARs in genes taken from the cytokine-cytokine receptor interaction pathway, comparing chromatin accessibility at these sites between Ahrfl/−Mb1cre/+ and Mb1cre CD19+CD21hiCD24hi B cells after 6 h LPS+anti-IgM. For qPCR, gene expression was calculated normalizing to β-actin.
All experiments were performed at day 7 post-IA injection. For RNA-seq data, n = 3 per condition and genotype. For ATAC-seq data, n = 3 for Mb1cre/+ mice and n = 2 for Ahrfl/−Mb1cre/+ mice. For (E) and (F), data are representative of two independent experiments with biological replicates, and data are expressed as mean ± SEM. ∗p < 0.05, Mann-Whitney test.
See also Figure S4.
A signature of genes related to cytokine-cytokine receptor interaction was upregulated in Ahrfl/−Mb1cre/+ CD19+CD21hiCD24hi B cells under LPS+anti-IgM stimulation compared with Mb1cre/+ (Figure 4C). Forty-four of 102 genes in this pathway were significantly differentially expressed between Ahrfl/−Mb1cre/+ and Mb1cre/+ CD19+CD21hiCD24hiB cells (Figures 4C and 4D). Of the genes that were differentially expressed under Breg-polarizing conditions (Figure 4B), pro-inflammatory cytokines including Il6, Tnf, Il2, and chemokines such as Ccl3, Ccl5, and Cxcl16, known to recruit lymphocytes to the inflamed synovia in models of arthritis (Kasama et al., 1995, Ruth et al., 2006, Szekanecz et al., 2000, Thornton et al., 1999), were upregulated in the absence of AhR (Figure 4D). The absence of AhR expression led to downregulation of the Il5ra gene, which had previously been associated with Breg function (Klinker et al., 2013), Ccl22, and Il18, which we have identified as Breg-associated genes in the microarray. Testing key arthritogenic pro-inflammatory transcripts (Feige et al., 2000, Ohshima et al., 1998, Thornton et al., 2000) using qPCR confirmed that Il2, Il6, and Tnf were increased in Ahrfl/−Mb1cre/+ CD19+CD21hiCD24hiB cells, and Ccl22 and Il5ra were decreased compared with Mb1cre/+ CD19+CD21hiCD24hiB cells. The increase in pro-inflammatory cytokines in Ahrfl/−Mb1cre/+ CD19+CD21hiCD24hiB cells was confirmed using ELISA (Figures 4E and 4F).
Specific interrogation of differentially accessible regions (DARs) in loci encoding genes from the cytokine-cytokine receptor interaction pathway revealed an overall decrease in chromatin accessibility in these genes in Ahrfl/−Mb1cre/+ CD19+CD21hiCD24hiB cells. Seventy-eight DARs (p < 0.05) were identified among the genes regulated by AhR at the transcriptional level, including Il2, Il6, Ccl3, Ccl5, Il5ra, Ccl22, and Il10 between LPS+anti-IgM polarized Ahrfl/−Mb1cre/+ and Mb1cre/+ CD19+CD21hiCD24hiB cells (Figure 4G).
To confirm that AhR suppresses pro-inflammatory gene expression during the development of Bregs, we blocked AhR signaling in vitro with CH-223191. Concordant with the results identified with RNA sequencing (RNA-seq), blocking AhR signaling resulted in upregulation of Il6 and Tnf and downregulation of Il10 and Ccl22 mRNA (Figure S4D).
AhR can repress gene expression indirectly by controlling the activity of additional molecules involved in gene regulation, including genes related to the NF-κB pathway. Because we have previously shown that the NF-κB pathway is linked to IL-10 production in Bregs (Rosser et al., 2014), next we analyzed the effect that the lack of AhR in B cells had on the NF-κB pathway in LPS+anti-IgM-stimulated cells. A reduction in NF-κB pathway-related genes, including Cd40 and Myd88, required for IL-10 production, was observed in Ahrfl/−Mb1cre/+ CD19+CD21hiCD24hiB cells. This was mirrored by upregulation of genes relating to inflammation (Tnf, Tnfaip3, Ccl4, and Il1r1) in Ahrfl/−Mb1cre/+ compared with Mb1cre/+ CD19+CD21hiCD24hiB cells (Figure S4E).
Our data suggest that AhR contributes the Breg transcriptional program by suppressing pro-inflammatory gene expression. To rule out whether this effect is secondary to the decrease in IL-10, we cultured wild-type (WT) and Il10r−/− CD19+CD21hiCD24hiB cells with LPS+anti-IgM in the presence or absence of the selective AhR antagonist CH-223191. The expression of Il6 and Tnf was significantly increased in both WT and IL-10R−/− CD19+CD21hiCD24hiB cells cultured with the AhR antagonist, suggesting a direct effect of AhR in the suppression of pro-inflammatory gene expression (Figure S4F). Collectively, these data show that under Breg-polarizing conditions, AhR acts as a molecular switch that “turns off” a number of pro-inflammatory cytokines and chemokines in CD19+CD21hiCD24hiB cells, while promoting the expression of IL-10+CD19+CD21hiCD24hiBreg-associated cytokines and receptors.
B Cell-Specific AhR Deficiency Causes Exacerbated Arthritis and Increased T Cell-Driven Arthritogenic Responses
Having confirmed the contribution of AhR in the programming of the IL-10+CD19+CD21hiCD24hiBreg transcriptional profile, we explored the impact of AhR deficiency specifically in B cells on the immune response associated with arthritis. Ahrfl/−Mb1cre/+ mice developed exacerbated arthritis compared with control Mb1cre/+ mice (Figure 5A). Histological analysis of joint tissue showed an increase in immune cell infiltration in the synovia and hyper-vascularization in Ahrfl/−Mb1cre/+ compared with control Mb1cre/+ mice (Figure 5B). The enhanced inflammation was associated with a significant increase in the frequency and number of IFN-γ- and IL-17-expressing CD4+ T cells in the spleen and DLN (Figures 5C–5F). Ahrfl/−Mb1cre/+ mice had an increased frequency and number of IL-17+CD4+ cells and a reduction in the frequency and total number of Foxp3+Tregs in the inguinal DLN compared with the control mice (Figures 5F–5H). Increased levels of IL-17 were observed in the synovium of inflamed joints of Ahrfl/−Mb1cre/+ compared with the control group, whereas IFN-γ levels were undetectable (Figure 5I).
Figure 5.

B Cell AhR Deficiency Exacerbates Antigen Induced Arthritis
(A) Mean clinical score of Mb1cre/+ and Ahrfl/−Mb1cre/+ mice following induction of arthritis; y axis shows percentage swelling in antigen-injected knee compared with control knee (n = 12 per group).
(B) Representative H&E staining of arthritic joints from Mb1cre/+ and Ahrfl/−Mb1cre/+ mice (n = 3; original magnification of 20×). Arrows indicate hyper-vascularization. Scale bar, 100 μM.
(C–H) Representative flow cytometry plots and bar charts showing respectively the percentage and number of (C and D) IFN-γ+CD4+ cells, (E and F) IL-17+CD4+ cells, and (G and H) Foxp3+CD4+T cells in the spleens and DLNs of Mb1cre/+ and Ahrfl/−Mb1cre/+ mice (n = 7).
(I) IL-17 concentration as measured in the synovial fluid of Mb1cre/+ and Ahrfl/−Mb1cre/+ mice (n = 6).
(J) Schematic showing the experimental design of the adoptive transfer system.
(K) Mean clinical score of C57BL/6 mice following adoptive transfer of CD19+CD21hiCD24hiB cells purified from Mb1cre/+ and Ahrfl/−Mb1cre/+ mice, administered on the day of disease onset. Control (no transfer) group received PBS (n = 5).
(L) Bar charts showing respectively the percentage of IFN-γ+CD4+ cells and IL-17+CD4+ cells in the spleens of WT recipient mice, following an adoptive transfer of Mb1cre/+ and Ahrfl/−Mb1cre/+ CD19+CD21hiCD24hiB cells or a PBS control (n = 5).
All experiments were performed at day 7 post-IA injection. Data are representative of at least three independent experiments with biological replicates. In (A), (D), (F), (H), (I), (K), and (L), data are expressed as mean ± SEM. ∗p < 0.05 and ∗∗p < 0.01, one- and two-way ANOVA and Mann-Whitney test.
Adoptive transfer of Mb1cre/+ or Ahrfl/−Mb1cre/+ CD19+CD21hiCD24hiB cells into syngeneic mice showed that only CD19+CD21hiCD24hiB cells from Mb1cre/+, but not from Ahrfl/−Mb1cre/+ mice, significantly inhibited disease and Th17/Th1 differentiation in the recipient mice (Figures 5J–5L), confirming that CD19+CD21hiCD24hiB cells were less effective at suppressing inflammation in the absence of AhR.
Ahrfl/−Mb1cre/+ Mice Do Not Have a Defect in B Cell Development but Present with a Reduced Frequency and Number of Bregs
To establish that the increase in disease severity and the impact on the T cell compartment was due to the lack of AhR-expressing Bregs, rather than a consequence of abnormal B cell development, we next compared the frequencies of pro, pro-pre, pre, immature, transitional (T), early, and late mature B cells in the bone marrow or T1 or FO B cells in the spleens of Ahrfl/−Mb1cre/+ and Mb1cre/+ mice. We observed no differences in these populations, suggesting that the increase in arthritis severity and in pro-inflammatory T cells was indeed due to a reduction of CD19+CD21hiCD24hiBregs rather than a consequence of abnormal B cell development (Figures 6A and 6B; Figures S5A–S5H). In line with previous findings showing that AhR represses differentiation of B cells into plasma cells (Tucker et al., 1986), we found increased frequencies of splenic plasma cells (Figures S5I and S5J) and increased Prdm1 mRNA expression in Ahrfl/−Mb1cre/+ B cells relative to Mb1cre/+ B cells (Figure S5K). Despite changes in the frequency of plasma cells in the spleens, there were no differences in the amounts of secreted IgG, IgM, and IgA in the serum of arthritic Ahrfl/−Mb1cre/+ versus Mb1cre/+ mice (Figure S5L).
Figure 6.

CD19+CD21hiCD24hiB Cells in Ahrfl/−Mb1cre/+ Mice Are Less Able to Differentiate into Bregs
AIA was induced in Mb1cre/+ and Ahrfl/−Mb1cre/+ mice.
(A) Representative flow cytometry plots showing percentage and (B) bar charts showing the percentages and absolute numbers of CD19+CD21−CD24hi (T1), CD19+CD21hiCD24hi, and FO B cells in the spleens of Mb1cre/+ and Ahrfl/−Mb1cre/+ mice (n = 7).
(C) CD19+CD21hiCD24hi or FO B cells were sorted from Mb1cre/+ and Ahrfl/−Mb1cre/+ mice and stimulated with LPS+anti-IgM for 48 h. IL-10 production, as measured by ELISA (n = 4 per group).
(D and E) Representative flow cytometry plots (D) showing percentage and (E) bar charts showing percentages and absolute numbers of CD19+CD21−CD24hi, CD19+CD21hiCD24hi and FO B cells in the MLNs of Mb1cre/+ and Ahrfl/−Mb1cre/+ mice (n = 7).
(F) CD19+B cells were sorted from Mb1cre/+ and Ahrfl/−Mb1cre/+ mice and stimulated with LPS+anti-IgM for 48 h. IL-10 production, as measured by ELISA (n = 3).
All experiments were performed at day 7 post-IA injection. Data representative of at least two independent experiments with biological replicates. In (B), (C), (E), and (F), data are expressed as mean ± SEM. ∗p < 0.05, ∗∗p < 0.01, and ∗∗∗p < 0.01, two-way ANOVA and Mann-Whitney test.
See also Figures S5–S7.
Although there were no differences in the number of splenic CD19+CD21hiCD24hiB cells between the two groups, Ahrfl/−Mb1cre/+CD21hiCD24hiB cells secreted significantly less IL-10 than Mb1cre/+CD19+CD21hiCD24hiB cells, following stimulation with LPS+anti-IgM (Figure 6C). IL-10 production by Ahrfl/−Mb1cre/+ CD19+B cells was significantly reduced in response to TLR9 stimulation (Figures S6A–S6C). Comparable levels of Ebi3 and Il12a were present in B cells from Ahrfl/−Mb1cre/+ mice and Mb1cre/+ mice (Figures S6D and S6E). These results, together with our previous findings showing a redundant effect of IL-35 in Bregs in this model (Vasconcellos et al., 2011), excluded that Bregs were non-functional because of a lack of IL-35 production in the absence of AhR.
The observed IL-10 reduction was not due to impaired B cell proliferation, as an equivalent expression of Ki-67 in Mb1cre/+ and Ahrfl/−Mb1cre/+ CD19+CD21hiCD24hiB cells was observed both directly ex vivo after antigen-induced arthritis (AIA) and after stimulation with LPS+anti-IgM (Figures S6F–S6I). No difference in genes related to the cell cycle was observed, including Ccno, previously been shown to be regulated by AhR in splenic B cells (Villa et al., 2017), between Mb1cre/+ and Ahrfl/−Mb1cre/+ CD19+CD21hiCD24hiB cells (Figure S6J), suggesting that there was no impairment in BCR-driven regulation of B cell entry into the cell cycle (Richards et al., 2008).
Mesenteric lymph nodes (MLNs) are important sites for the licensing of Breg development, through the exposure to microbiota-derived pro-inflammatory signals IL-1β and IL-6 (Rosser et al., 2014). Fewer CD19+CD21hiCD24hiB cells, and a decreased amount of B cell-derived IL-10 after in vitro polarization with LPS+anti-IgM, were observed in the MLN of Ahrfl/−Mb1cre/+ mice compared with control Mb1cre/+ mice (Figures 6D–6F). Of interest, no difference in gut-homing integrin α4β7 expression was observed in splenic or MLN-derived CD19+CD21hiCD24hiB cells between Ahrfl/−Mb1cre/+ and Mb1cre/+ mice, suggesting that the reduction of Bregs observed in the MLN of Ahrfl/−Mb1cre/+ mice is α4β7 independent (Figures S6K–S6M). We can exclude that the decreased frequency of Bregs was the consequence of a reduction in monocyte-derived lL-1β and IL-6 produced in the spleens or in the MLNs, as equivalent amounts of these cytokines were produced by these cells in both Ahrfl/−Mb1cre/+ and Mb1cre/+ mice (Figures S7A–S7D).
Thus, our results collectively show that mice lacking AhR expression in B cells phenocopy the results we have previously observed in mice with IL-10−/−B cells (Carter et al., 2011) and influence IL-10+CD19+CD21hiCD24hiBreg differentiation in a cell-intrinsic manner.
Discussion
Bregs are generated in the periphery in response to a variety of “homeostatic” inflammatory stimuli including activation through TLRs and by pro-inflammatory cytokines (Rosser and Mauri, 2015). The transcriptional program that governs the differentiation and function of IL-10+CD19+CD21hiCD24hiBregs remains virtually unknown. Here, we show that AhR contributes to the differentiation of CD19+CD21hiCD24hiB cells into functionally suppressive IL-10+CD19+CD21hiCD24hiBregs by regulating their IL-10 production and by repressing the transcription of pro-inflammatory mediators. The importance of IL-10 in mediating the suppressive effect of Bregs is well established, and its role is corroborated by in vivo results showing that mice lacking IL-10-producing B cells develop exacerbated autoimmunity (Carter et al., 2011). Similarly, AhR deficiency restricted to B cells impairs IL-10+CD19+CD21hiCD24hiBreg differentiation and function, resulting in an increase of IFNγ and IL-17-expressing CD4+ T cells, a decrease in Tregs, and the development of an exacerbated arthritis.
AhR plays a pleiotropic role in the regulation of several immune responses (Stockinger et al., 2014), most notably in the differentiation of CD4+ T cells, in which AhR influences both the differentiation and activation of Th17 cells, which are known to play a major role in the pathogenesis of several autoimmune diseases (Stockinger and Omenetti, 2017) and the differentiation of CD4+ T cells into Tr1 cells (Apetoh et al., 2010). Immune suppression was one of the earliest known observations of AhR function. 2,3,7,8-Tetrachlorodibenzo-ρ-dioxin (TCDD), an environmental contaminant and a potent AhR agonist, was found to suppress delayed hypersensitivity (DTH) responses to tuberculin (Vos et al., 1973). More recently, it has become apparent that AhR has a conserved role in the regulation of IL-10 across the innate and adaptive immune system, controlling IL-10 production in natural killer cells (Wagage et al., 2014), peritoneal (Kimura et al., 2009) and bone marrow-derived macrophages (Shinde et al., 2018), and Tr1 cells, in which AhR binding to the Il10 promoter region has been described (Apetoh et al., 2010). We demonstrate that in IL-10+B cells, AhR binds upstream of the Il10 TSS to a different genomic region than in Tr1 cells, suggesting that there are cell context- and cell signal-specific epigenetic differences in the regulation of Il10 (Saraiva et al., 2005).
An interesting finding in our study was the discovery that AhR partly controls the differentiation of CD19+CD21hiCD24hiB cells into a polarized IL-10+CD19+CD21hiCD24hiBreg population that produces only IL-10 by contributing to IL-10 induction and by suppressing the transcription of several pro-inflammatory cytokines, such as Il2, Il6, and Tnf. AhR has been previously shown to inhibit pro-inflammatory IL-17 and IFN-γ cytokine production in T cells and to induce Tr1 cell differentiation in the gut (Ye et al., 2017). In addition, in the absence of AhR in macrophages, mice are more susceptible to LPS-induced endotoxic shock and present with an increase in pro-inflammatory IL-6 expression (Kimura et al., 2009). AhR deletion in microglial cells led to the upregulation of Ccl2, Il1b, Nos2, and Vegfb gene expression, factors known to be involved in inflammation and neurodegeneration (Rothhammer et al., 2018). Our data reveal that AhR preserves the immunosuppressive function of splenic IL-10+CD19+CD21hiCD24hiBregs by silencing a pro-inflammatory transcriptional program. Whether AhR complexes bind to XRE on the loci of pro-inflammatory cytokines and directly inhibit their expression in B cells, or if AhR coordinates the suppression of pro-inflammatory immune responses through interaction with other transcription factors in B cells, warrants further study.
Our adoptive transfer results suggest that the predominant effect of AhR loss in B cells on AIA is through the loss of IL-10. We have previously shown that adoptive transfer of IL-10−/− B cells is unable to suppress arthritis (Carter et al., 2011, Evans et al., 2007). Here we show that WT mice do not get worse disease than the PBS control-injected mice upon adoptive transfer of AhR−CD19+CD21hiCD24hi B cells. Equally, AhR−CD19+CD21hiCD24hi B cells do not suppress disease onset in the recipient mice, unlike the transfer of control AhR+CD19+CD21hiCD24hi B cells. These data therefore suggest that the deleterious effects observed in AIA is the consequence of the reduced amount of IL-10. However, we cannot rule out the possibility that in vivo, AhR-deficient B cells contribute to overall inflammation through the upregulation of pro-inflammatory cytokines and chemokines or indirectly through the recruitment of other cell types.
We have recently reported that AhR deletion, rather than impairing the capacity of B cells to proliferate, instead compromised their ability to commence the cell cycle (Villa et al., 2017). Indeed, there was reduction in Ccno mRNA expression in splenic B cells isolated from naive Ahrfl/−Mb1cre/+ compared with Mb1cre/+ mice. Here we show that this defect is overcome during an arthritogenic response, as no change in Ki-67 expression or in genes regulating the cell cycle, including Ccno, were observed between Mb1cre/+ and Ahrfl/−Mb1cre/+ CD19+CD21hiCD24hiB cells taken directly from arthritic mice. Furthermore, no difference was observed in Ki-67 expression between Mb1cre/+ and Ahrfl/−Mb1cre/+ CD19+CD21hiCD24hiB cells after restimulation with LPS+anti-IgM. Although, in the latter, we used purified CD19+CD21hiCD24hi B cells instead of total splenic B cells and used different stimuli to activate this population, which together might account for the differences observed in this study. Therefore, these data confirmed that the phenotype observed in the absence of AhR expression in B cells is not due to impaired B cell proliferation but instead is due to the reduced ability of B cells to differentiate into Bregs and reduction in the production of IL-10.
Our results show that although the loss of B cell AhR expression reduces IL-10+CD19+CD21hiCD24hiBreg frequency and leads to an expansion of plasma cells, it does not affect the frequencies or absolute numbers of B cell populations up to a mature naive B cell stage. Taken together with previous findings showing that AhR is expressed by B cells from the immature B cell stage in the bone marrow (Villa et al., 2017, Yamaguchi et al., 1997a, Yamaguchi et al., 1997b), we suggest that B cell AhR expression is important primarily for the control of IL-10+CD19+CD21hiCD24hiBreg immune-regulatory transcriptional programming and restricting plasma cell development but is dispensable for homeostatic B cell development. We report that Ahrfl/−Mb1cre/+ mice have increased frequencies of splenic plasma cells compared with control Mb1cre/+ mice, and these results are in line with those showing that both prototypic AhR agonists (polycyclic aromatic and planar halogenated hydrocarbons) affect terminal differentiation of B cells and humoral immune responses by inhibiting plasma cell differentiation and reducing the production of IgM (Schneider et al., 2009, Tucker et al., 1986, Vaidyanathan et al., 2017). We find increased levels of Prdm1 (Blimp-1) mRNA expression in B cells lacking AhR, consistent with previous findings showing that the suppression of terminal differentiation is mediated through AhR increases Bach2 expression (De Abrew et al., 2011); Bach2 in turn represses the expression of Blimp-1, a key transcription factor that controls B cell differentiation into immunoglobulin-producing plasma cells (Turner et al., 1994). We have extended the significance of these results to an inflammatory model and shown that early B cell development and maturation of B cells is not affected by B cell AhR expression but that AhR is required for the differentiation of IL-10+CD19+CD21hiCD24hiBregs. It is tantalizing to propose that the increase in plasma cells observed in mice lacking AhR+IL-10+CD19+CD21hiCD24hiBregs is due to the impaired function of Bregs. We have previously shown that at least in humans, IL-10 produced by Bregs directly inhibits T helper cell differentiation, which prevents plasma cell differentiation (Menon et al., 2016).
Here we have shown that AhR, in response to inflammatory signals, plays an important role in the homeostatic maintenance of Breg function by acting as a molecular brake, preventing the differentiation of Bregs into effector B cells producing pro-inflammatory mediators. In addition to identifying that AhR regulates IL-10 expression in Bregs, our data highlight an additional mechanism by which AhR restrains inflammatory responses. These results add to a growing body of evidence supporting AhR as a key modulator of immune tolerance and therefore a potential therapeutic target in autoimmunity.
STAR★Methods
Key Resources Table
| REAGENT or RESOURCE | SOURCE | IDENTIFIER |
|---|---|---|
| Antibodies | ||
| CD3e, Clone 145-2C11 | BD PharMingen | Cat# 550275; RRID:AB_393572 |
| InVivoPlus anti-mouse CD40 | BioXcell | Cat# BP0016-2; RRID:AB_1107647 |
| AffiniPure Fab Fragment Goat Anti-Mouse IgM, μ chain specific | Jackson ImmunoResearch | Cat# 115-007-020; RRID:AB_2338477 |
| CD1d Percp/Cy5.5, Clone 1B1 | Biolegend | Cat# 123514; RRID:AB_2073523 |
| CD3 BV605, Clone 17A2 | Biolegend | Cat# 100237; RRID:AB_2562039 |
| CD4 BV605, Clone RM4-5 | Biolegend | Cat# 100548; RRID:AB_2563054 |
| CD4 BV711, Clone RM4-5 | Biolegend | Cat# 100550; RRID:AB_2562099 |
| CD5 AF647, Clone 53-7.3 | Biolegend | Cat# 100614; RRID:AB_2075301 |
| CD8a BV605, Clone 53-6.7 | Biolegend | Cat# 100744; RRID:AB_2562609 |
| CD11b BV605, Clone M1/70 | Biolegend | Cat# 101257; RRID:AB_2565431 |
| CD11c BV605, Clone N418 | Biolegend | Cat# 117334; RRID:AB_2562415 |
| CD19 BV785, Clone 6D5 | Biolegend | Cat# 115543; RRID:AB_11218994 |
| CD21 APC, Clone CR2/CR1 | Biolegend | Cat# 123412; RRID:AB_2085160 |
| CD23 FITC, Clone B3B4 | Biolegend | Cat# 101606; RRID:AB_312831 |
| CD24 PE-Cy7, Clone M1/69 | Biolegend | Cat# 101822; RRID:AB_756048 |
| CD24 BV421, Clone M1/69 | Biolegend | Cat# 101826; RRID:AB_2563508 |
| CD43 PECy7, Clone S7 | BD PharMingen | Cat# 562866; RRID:AB_2737852 |
| CD138 BV711, Clone 281-2 | Biolegend | Cat# 142519; RRID:AB_2562571 |
| F4/80 BV605, Clone BM8 | Biolegend | Cat# 123133; RRID:AB_2562305 |
| TER-119/Erythroid cells BV605, Clone TER-119 | Biolegend | Cat# 116239; RRID:AB_2562447 |
| Ly6C/G BV605, Clone RB6-8C5 | Biolegend | Cat# 108440; RRID:AB_2563311 |
| TCRβ BV605, Clone H57-597 | Biolegend | Cat# 109241; RRID:AB_2629563 |
| Tim-1 PE, Clone RMT1-4 | Biolegend | Cat# 119506; RRID:AB_2232887 |
| CD249 PE, Clone BP-1 | BD PharMingen | Cat# 553735; RRID:AB_395018 |
| Blimp-1 AF647, Clone 5E7 | Biolegend | Cat# 150004; RRID:AB_2565618 |
| Ki-67 BV421, Clone 16A8 | Biolegend | Cat# 652411; RRID:AB_2562663 |
| FoxP3 APC, Clone FJK-16 | ThermoFisher Scientific | Cat# 17-5773-82; RRID:AB_469457 |
| IFN-γ APC, Clone XMG1.2 | ThermoFisher Scientific | Cat# 17-7311-82; RRID:AB_469504 |
| IL-10 PE, Clone JES5-16E3 | Biolegend | Cat# 505008; RRID:AB_315362 |
| IL-17 PE (TC11-18H10.1) | Biolegend | Cat# 506904; RRID:AB_315464 |
| AhR PE, Clone 4MEJJ | ThermoFisher Scientific | Cat# 12-5925-82; RRID:AB_2572644 |
| Polyclonal antibody against AhR (used for ChIP and western blot) | Enzo Life Sciences | Cat# BML-SA210; RRID:AB_10540536 |
| Rabbit anti-mouse β-actin, Clone 13E5 | Cell Signaling Technology | Cat# 4970; RRID:AB_2223172 |
| Goat Anti-Rabbit IgG – H&L Polyclonal antibody, HRP conjugated | Abcam | Cat# ab6721; RRID:AB_955447 |
| Chemicals, Peptides, and Recombinant Proteins | ||
| 6-Formylindolo(3,2-b)carbazole (FICZ) | Enzo Life Sciences | Cat# BML-GR206 |
| CH-223191 (AhR antagonist) | Merck Millipore | Cat# 182705 |
| Lipopolysaccharide (LPS) | Sigma Aldrich | Cat# L4391 |
| Methylated bovine serum albumin (mBSA) | Sigma Aldrich | Cat# A1009 |
| Incomplete Freund’s adjuvant (CFA) | Sigma Aldrich | Cat# F5506 |
| CpG-B (ODN1826) | Invivogen | Cat# tlrl-1826 |
| Phorbol-12-myristate-13 acetate (PMA) | Sigma Aldrich | Cat# P8139 |
| Ionomycin | Sigma Aldrich | Cat# I0634 |
| DAPI | Sigma Aldrich | Cat# D9542 |
| Brefeldin A | Biolegend | Cat# 420601 |
| 2-Mercaptoethanol | ThermoFisher Scientific | Cat# 31350010 |
| RNase-Free DNase set | QIAGEN | Cat# 79254 |
| Critical Commercial Assays | ||
| IL-2 duoset ELISA kit | Biotechne | Cat# DY402 |
| IL-6 duoset ELISA kit | Biotechne | Cat# DY402 |
| IL-10 duoset ELISA kit | Biotechne | Cat# DY417 |
| IL-17 duoset ELISA kit | Biotechne | Cat# DY421 |
| TNFα duoset ELISA kit | Biotechne | Cat# DY410 |
| Total mouse IgA ELISA kit | ThermoFisher Scientific | Cat# 88-50450-88 |
| Total mouse IgG ELISA kit | ThermoFisher Scientific | Cat# 88-50470-88 |
| Total mouse IgM ELISA kit | ThermoFisher Scientific | Cat# 88-50400-88 |
| Negative CD43- Isolation Kit | Miltenyi Biotec | Cat# 130-049-801 |
| Murine Treg isolation kit | N/A | |
| Picopure™ RNA isolation kit | ThermoFisher Scientific | Cat# KIT0204 |
| iScript™ cDNA synthesis kit | Biorad | Cat# 1708891 |
| iQ™ SYBR® green supermix | Biorad | Cat# 1708882 |
| Nextera DNA library preparation kit | Illumina | Cat# FC-121-1030 |
| MinElute PCR purification kit | QIAGEN | Cat# 28004 |
| Pierce™ BCA Protein Assay Kit | ThermoFisher Scientific | Cat# 23225 |
| Deposited Data | ||
| Raw microarray data – IL-10+CD19+CD21hiCD24hi B cells, IL-10-CD19+CD21hiCD24hi B cells, IL-10-CD19+CD21intCD24int | This paper | E-MTAB-7375 |
| Raw and analyzed ATAC-seq data – IL-10+CD19+CD21hiCD24hi B cells, IL-10-CD19+CD21hiCD24hi B cells, IL-10-CD19+CD21intCD24int | This paper | E-MTAB-8393 |
| Raw and analyzed ATAC-seq data – Ahrfl/-Mb1cre/+ and Mb1cre/+ CD19+CD21hiCD24hi B cells ex-vivo & after 6h LPS+anti-IgM stimulation | This paper | E-MTAB-7525 |
| Raw and analyzed RNA-seq data - Ahrfl/-Mb1cre/+ and Mb1cre/+ CD19+CD21hiCD24hi B cells ex-vivo & after 6h LPS+anti-IgM stimulation | This paper | E-MTAB-7345 |
| Experimental Models: Organisms/Strains | ||
| Mouse, B6(Cg)-Il10tm1.1Karp/J | Prof. Christopher Karp | RRID:IMSR_JAX:014530 |
| Mouse, C57BL/6J | Envigo | N/A |
| Mouse, IL-10R KO | Pils et al., 2010. Professor Werner Muller | N/A |
| Mouse, B6.C(Cg)-Cd79atm1(cre)Reth/EhobJ | Jackson laboratory | RRID:IMSR_JAX:020505 |
| Mouse, B6.129-Ahrtm1Bra/J | Jackson laboratory | RRID:IMSR_JAX:002831 |
| Mouse, Ahr−/−Mb1cre/cre | Prof. Brigitta Stockinger | N/A |
| Mouse, Ahrfl/flR26R FP635fl/fl | Prof. Brigitta Stockinger | N/A |
| Mouse, Mb1cre/+ | Generated in house from above strains | N/A |
| Mouse, Ahrfl/-Mb1cre/+ | Generated in house from above strains | N/A |
| Oligonucleotides | ||
| Please refer to Table S2 | This paper | N/A |
| Software and Algorithms | ||
| GraphPad Prism 6 | Graphpad Software | https://www.graphpad.com |
| Flowjo v10.5.0 | Flowjo, LLC | https://www.flowjo.com |
| Limma | Ritchie et al., 2015 | https://bioconductor.org/packages/release/bioc/html/limma.html |
| STAR | Dobin et al., 2013 | https://github.com/alexdobin/STAR |
| HTSeq | Anders et al., 2015 | https://htseq.readthedocs.io/en/release_0.11.1/install.html#install |
| Kallisto | Bray et al., 2016 | https://pachterlab.github.io/kallisto/download |
| EdgeR | Robinson et al., 2010 | https://bioconductor.org/packages/release/bioc/html/edgeR.html |
| Signaling pathway impact analysis | Tarca et al., 2009 | https://bioconductor.org/packages/release/bioc/html/SPIA.html |
| Illumina Casava 1.7 | Illumina | https://www.illumina.com |
| Picard Tools | N/A | https://broadinstitute.github.io/picard/ |
| MACS2 v2.1.1.20160309 | Zhang et al., 2008 | https://github.com/taoliu/MACS |
| Multiple Experiment Viewer (MeV_4_8) | Saeed et al., 2003 | http://mev.tm4.org/#/welcome |
| Other | ||
| RPMI-1640 media | Sigma Aldrich | Cat# R8758 |
| IMDM media | Lonza | Cat# BE12-915F |
| Red blood cell lysis buffer | Sigma Aldrich | Cat# R7757 |
| Foetal calf serum (FCS) | Biosera | Cat# FB1001/500 |
| Penicillin/Streptomycin | Sigma Aldrich | Cat# P0781 |
| eBioscience™ Intracellular fixation & permeabilisation buffer set | ThermoFisher Scientific | Cat# P078188-8824-00 |
| Brilliant stain buffer | BD Biosciences | Cat# 563794 |
| eBioscience™ FoxP3 / Transcription Factor Staining Buffer Set | ThermoFisher Scientific | Cat# 00-5523-00 |
| M. tuberculosis H37 Ra, desiccated | BD | Cat# 231141 |
| Cell Lysis Buffer (10x) | Cell Signaling Technology | Cat# 9803 |
| PierceTMECL Western Blotting Substrate | ThermoFisher Scientific | Cat# 32106 |
Lead Contact and Materials Availability
Further information and requests for resources and reagents should be directed to and will be fulfilled by the Lead Contact, Professor Claudia Mauri (c.mauri@ucl.ac.uk). This study did not generate new unique reagents.
Experimental Model and Subject Details
IL-10eGFP mice were as described (Madan et al., 2009), courtesy of Prof Karp. C57BL/6 mice were from purchased from Envigo, UK. Ahr−/−, Ahr+/−, Mb1cre/+ (courtesy of Prof Reth) and Ahrfl/-Mb1cre/+ mice were kindly provided by Prof. Brigitta Stockinger. IL-10R−/− mice were kindly given courtesy of Professor Werner Muller. Male and female mice were used at 8–12 weeks of age and were bred and maintained at the animal facility, University College London. All experiments were approved by the Animal Welfare and Ethical Review Body of University College London and authorized by the United Kingdom Home Office.
Induction of antigen-induced arthritis (AIA)
AIA was induced and assessed as previously described (Rosser et al., 2014). Briefly, mice were injected subcutaneously at the tail base with 200 μg of methylated BSA (mBSA; Sigma-Aldrich) emulsified in 100 μL Complete Freund’s Adjuvant (CFA). CFA was made by mixing 3mg/ml of Mycobacterium tuberculosis (Difco) in Incomplete Freund’s Adjuvant (IFA; Sigma-Aldrich). After 7 days, mice received an intra-articular (IA) injection of 10 μL of PBS containing 200 μg mBSA in the right knee and 10 μL PBS alone in the left knee as a control. Joint size was measured using callipers (POCO 2T; Kroeplin GmbH) at daily intervals and swelling was calculated as a percentage increase in size between the inflamed and control knee. All experiments, unless stated otherwise, were performed at day 7 post-IA injection.
Method Details
Cell isolation and culture
For splenocyte and lymph node cell preparation, organs were mashed through a 70 μM cell strainer (BD Biosciences), as previously described (Rosser et al., 2014), and erythrocytes from spleens were lysed using Red Cell Lysis Buffer (Sigma-Aldrich). B cells were negatively purified by magnetic separation, according to manufacturer’s instructions (Miltenyi Biotec). Cells were cultured with either RPMI 1640 (Sigma-Aldrich) containing L-glutamine and NAHCO3 or Iscove’s Modified Dulbecco’s Medium (IMDM; Pan Biotech), enriched in AhR agonists (Veldhoen et al., 2009), supplemented with L-Glutamine and 25mM HEPES. Media were supplemented with 10% fetal calf serum (LabTech), 1% penicillin/streptomycin (100U/ml Penicillin+100 μg/ml streptomycin; Sigma-Aldrich) and 50 μM 2-Mercaptoethanol (ThermoFisher Scientific). Cells were cultured at 37°C with 5% CO2.
Total lymphocytes, B cells and B cell subsets were cultured for 48h with CpGb ODN1826 (1 μM; Invivogen), LPS (1 μg/ml; Sigma-Aldrich) ± anti-mouse IgM (10 μg/ml; Jackson ImmunoResearch). or anti-CD40 (10 μg/ml; BioXcell). In addition, AhR agonist FICZ (100nM; Enzo LifeSciences) was added to culture. For 48h culture, anti-IgM ± FICZ were added 24h into culture.
ELISA’s on cell culture supernatants and sera
Supernatants from cell cultures were harvested and analyzed for cytokines using standard sandwich IL-2, IL-6, IL-10, IL-17 and TNFα ELISA Kits (R&D Systems) and performed according to manufacturer’s instructions. Serum was collected from Mb1cre/+ and Ahrfl/-Mb1cre/+ day 7 post AIA and was analyzed for total IgA, IgG and IgM (ThermoFisher Scientific).
Flow cytometry and cell sorting
Flow cytometry was performed with the following directly conjugated antibodies from Biolegend: CD1d Percp/Cy5.5 (1B1), CD3 BV605 (17A2), CD4 BV711 (RM4-5), CD5 AF647 (53-7.3), CD19 BV785 (6D5), CD21 APC (CR2/CR1), CD23 FITC (B3B4), CD24 PE-Cy7 or BV421 (M1/69), CD43 PECy7 (S7), CD138 BV711 (281-2) and Tim-1 PE (RMT1-4). CD249 PE (BP-1) was purchased from BD Biosciences. For multi-color flow cytometric surface staining, cells were stained at 4°C for 20 min as previously described (Nistala et al., 2010). LIVE/DEAD fixable blue Dead Cell Stain (Life Technologies) was used to exclude dead cells from flow cytometric analysis. For measurement of intra-nuclear Blimp-1, Ki-67 and FoxP3 expression, cells were fixed for 25 minutes with FoxP3 Fixation buffer (ThermoFisher Scientific) and Blimp-1 AF647 (5E7), Ki-67 BV421 (16A8; Biolegend) or FoxP3 APC (FJK-16 s; ThermoFisher Scientific) was added in permeabilisation buffer. Intracellular cytokine analysis was performed as described previously (Rosser et al., 2014). Briefly, for detection of IFN-γ, IL-10 and IL-17, splenocyte or lymph node cells were cultured in complete medium with PMA (50ng/ml; Sigma-Aldrich), Ionomycin (250ng/ml; Sigma-Aldrich) and Brefeldin A (5 μg/ml; Sigma-Aldrich) for 4.5h. Cells were then stained with surface markers followed by intracellular fixation and permeabilisation (ThermoFisher Scientific). Cells were incubated with IFN-γ ΑPC (XMG1.2; BD PharMingen), IL-10 PE (JES5-16E3; Biolegend) and IL-17 PE (TC11-18H10.1; BD PharMingen). FP635 and eGFP reporter expression were analyzed ex vivo without fixation.
B cell subsets were sorted using a cell sorter (FACSAria; BD PharMingen) by using CD19 BV785, CD21 APC, CD23 FITC and CD24 PE-Cy7. Dead cells were excluded by the use of 4,6-diamidino-2-phenylindole at 1 μg/ml (DAPI; Sigma). For cell sorting for RNA-seq and ATAC-seq, addition of BV605 dump channel antibodies against CD3 (17A2), CD4 (RM4-5), CD8a (53-6.7), CD11b (M1/70), CD11c (N418), F4/80 (BM8), Ly6C/G (RB6-8C5), erythroid cells (TER-119) and TCRβ (H57-597) were incorporated (Biolegend). Sort purity of B cell subpopulations was routinely > 95%. Flow cytometric data were collected on an LSRII or LSR Fortessa (BD PharMingen) using FACS Diva software. Data were analyzed using Flowjo (Tree Star).
In-vitro suppression assay
Splenic B cell subsets from Ahr−/− and Ahr+/− mice were sorted at day 7 post IA injection and stimulated with CpGb (ODN2006) for 6 hours. Cells were washed and then co-cultured with 0.5 μg/ml plate-bound anti-CD3 (145-2C11, BD Biosciences) for 72 hours with CD4+CD25- (bead isolated) T cells from Ahr+/− mice. Following stimulation, cells were analyzed for CD4+ IFN-γ expression. The percentage suppression of IFN-γ was calculated as a percentage reduction in IFN-γ from CD4+ cells cultured alone, compared to when B cell subsets were added to culture.
Adoptive transfer experiments
CD19+CD21hiCD24hi B cells were isolated from spleens of Mb1cre/+ and Ahrfl/-Mb1cre/+ mice after remission from AIA and 5x10⁶ were transferred into recipient wild-type mice on the day of intra-articular injection. The control group (no transfer) received a PBS injection.
Histology
For histopathological examination, joints from Ahrfl/-Mb1cre/+ and Mb1cre/+ mice were removed post-mortem and fixed in 5% formalin and decalcified in 5% EDTA. The fixed joints were embedded in paraffin and 4 μm sections were cut and stained with hematoxylin-eosin.
Microarray analysis and RNA extraction
Splenic B cell subsets were sorted and RNA extracted using columns (Picopure, Life Technologies) and hybridized to murine mogene 2.0 ST arrays (Affymetrix). Raw CEL files were processed using the online GeneProfiler tool (accessible at https://www.beringresearch.com). Briefly, the GeneProfiler pipeline consists of present/absent call detection, (McClintick and Edenberg, 2006) Robust Microarray Average (RMA) normalization, and outlier detection (Kauffmann et al., 2009). Differential expression analysis was performed using the limma package (Ritchie et al., 2015).
Chromatin Immunoprecipitation
Total Vert-X splenic B cells were bead cell sorted and cultured for 24h with LPS, followed by addition of anti-IgM (10 μg/ml) and FICZ (100nM) at 24h into culture. After 48h total, total B cells were sorted based on eGFP for IL-10+ and IL-10- populations. Cells were fixed for 10 minutes with 1% (vol/vol) formaldehyde and quenched with 400mM Tris. Fixed cells were lysed with 120 μL lysis buffer (1% (wt/vol) SDS, 10mM EDTA and 50mM Tris-HCl, pH 8.1, 1 × protease inhibitor ‘cocktail’ (Roche), 1mM PMSF) per 5x10⁶ cells. Chromatin was sheared to 200-500bp fragments and 10% of the initial chromatin material was kept as input. The chromatin was diluted 5-fold in Dilution Buffer (1% (vol/vol) Triton X-100, 2mM EDTA, 150mM NaCl and 20mM Tris-HCl, pH 8.1) and incubated overnight, after preclearing, with 1 μg/106 cells of a polyclonal AhR-specific antibody (BML-SA210; Enzo Life Sciences). Immunoprecipitation took place by incubation with protein G Dynal magnetic beads (Invitrogen), held for at least 3 hours at 4°C. Immunoprecipitated chromatin complexes were washed with High Salt Wash Buffer (2x), Low Salt Wash Buffer (2x), LiCl Wash Buffer (2x) and TE Buffer (2x). Immunoprecipitated chromatin was eluted from the magnetic beads with Proteinase K Digestion Buffer and heated at 65°C for at least 6h for reverse crosslinking. DNA fragments were purified with NucleoMag beads kit (MN) and were analyzed by SYBR Green Quantitative Real-time PCR. The following primers were used for ChIP qPCR: Il10 −3.5kb forward (5′-AGGGCTTGATAACGTGTGAGT-3′); Il10 −3.5kb reverse (5′-TGAACTTCACACCCAGCTTGAG-3′); Il10 −2kb forward (5′-TAAGAGGTGCTGCTTCTCCTG-3′); Il10 −2kb reverse (5′-TGGCACTGGACAGTTCTATGA-3′); Il10 −0.5kb forward (5′-AGGGAGGAGGAGCCTGAATAA-3′); Il10 −0.5kb reverse (5′-CCTGTTCTTGGTCCCCCTTTT-3′); Il10 +2kb forward (5′-GCCACATGCATCCAGAGACAC-3′); Il10 +2kb reverse (5′-GTGCCTCAAAGTCACTCCCAC-3′); Cyp1a1 −3.6kb forward (5′-GCTCTTTCTCTGCCAGGTTG-3′); Cyp1a1 −3.6kb reverse (5′-GGCTAAGGGTCACAATGGAA-3′); Cyp1a1 promoter forward (5′-AAGCATCACCCTTTGTAGCC-3′); Cyp1a1 promoter reverse (5′-CAGGCAACACAGAGAAGTCG-3′); Gapdh promoter forward (5′-GCGCGAAAGTAAAGAAAGAAGCCC-3′); Gapdh promoter reverse (5′-AGCGGCCCGGAGTCTTAAGTATTAG-3′).
Western blot
5x10⁶ cells CD19+CD21hiCD24hi and FO B cells were FACS sorted from arthritic WT mice and lysed for 15 minutes at 4°C with cell lysis buffer (Cell signaling technology) for extraction of whole cell lysate. Protein was resolved by SDS-PAGE, transferred to nitrocellulose membranes and blotted using anti-AhR at 1/1000 (Enzo Life sciences) and anti-β-actin at 1/1000 (Cell Signaling Technology). Bound antibodies were revealed with a goat-anti rabbit H&L HRP-conjugated secondary antibody (1/1000) and ECL western blotting substrate (ThermoFisher Scientific).
RNA-seq
Splenic CD19+CD21hiCD24hi B cells were isolated from Mb1cre and Ahrfl/-Mb1cre mice in the remission phase of arthritis, at day 7 post-IA injection. Sorted cells were either left untouched (ex-vivo) or stimulated with LPS+anti-IgM for 6h in IMDM media. Dead cells were excluded using DAPI. Total RNA was isolated from these populations using the Picopure RNA isolation kit (ThermoFisher Scientific), according to manufacturer’s instructions. 60bp single reads were sequenced on 3 lanes of an Illumina hiseq. 130-500ng of total RNA was fragmented followed by reverse transcription and second strand cDNA synthesis. The double strand cDNA was subjected to end repair, A base addition, adaptor ligation and PCR amplification to create libraries. Libraries were evaluated by Qubit and TapeStation. Sequencing libraries were constructed with barcodes to allow multiplexing of samples in 3 lanes. Around 23-43 million single-end 60-bp reads were sequenced per sample on an Illumina HiSeq 2500 V4 instrument.
Poly-A/T stretches and Illumina adapters were trimmed from the reads using cutadapt. Resulting reads < 30bp were discarded. Reads were mapped to the Mus musculus GRCm38 reference genome using STAR (Dobin et al., 2013). Gene annotations were applied from Ensembl (EndToEnd option and outFilterMismatchNoverLmax was set to 0.04). Gene expression levels were quantified using htseq-count (“HTSeq,” n.d.) (Anders et al., 2015), using the gtf above. Transcripts per million (TPM) values were estimated independently using Kallisto (Bray et al., 2016).
Bioinformatic analysis of RNA-seq data
Differential expression analysis was performed using the default settings of the edgeR algorithm (Robinson et al., 2010). p values reflect two-sided p values obtained using the exact test proposed by Robinson and Smyth (Robinson and Smyth, 2008) for a difference in means, between two groups of negative binomial random variables (implemented in edgeR package). Signaling Pathway Impact Analysis (SPIA) (Tarca et al., 2009) was used to detect significantly over-represented pathways, with the Kyoto Encyclopedia of Genes and Genomes (KEGG) Pathways database (Kanehisa et al., 2016) employed as a reference. The full mouse genome was used as background for enrichment.
ATAC-seq
ATAC-seq was performed on splenic IL-10eGFP+CD19+CD21hiCD23hiCD24hi, IL-10eGFP-CD19+CD21hiCD23hiCD24hi and IL-10eGFP-FO B cells. In addition, ATAC-seq was performed on splenic total CD19+CD21hiCD24hi B cells isolated as above for the RNA-seq from Mb1cre/+ and Ahrfl/-Mb1cre/+ mice either left untouched (ex-vivo) or stimulated with LPS+anti-IgM for 6h in IMDM media. After sorting, 40,000 were washed with 1xPBS (10% FCS). The cell pellet was prepped for sequencing by using the Nextera DNA library preparation kit (Illumina). Briefly, 10.5 μL nuclease free water, 12.5 μL 2x Transposase buffer, 2 μL transposase and 0.25 μL digitonin (0.05%) per reaction were added to the cell pellets. Cells were incubated at 37°C for 30 minutes. DNA was then purified using a MinElute PCR purification kit (QIAGEN), according to manufacturer’s instructions. Following DNA purification, 1μl of eluted DNA was used in a qPCR reaction to estimate the optimum number of amplification cycles. Library amplification was performed using custom Nextera primers and was followed by solid phase reversible immobilization (SPRI) size selection to exclude fragments larger than 1,200bp. DNA concentration was measured with a Qubit fluorometer (Life Technologies). The libraries were sequenced by the Biomedical Sequencing Facility at CeMM using the Illumina HiSeq4000 platform and the 50bp single-end configuration.
Bioinformatic analysis of ATAC-seq data
Bioinformatic analysis was performed as previously described (Rendeiro et al., 2016). Briefly, Illumina Casava1.7 software was used for basecalling. Sequenced reads were trimmed for adaptor and Nextera sequences and reads were mapped to mm10 reference genome using bowtie2 v2.2.4 with the “–very-sensitive” parameter. Duplicate reads were marked and removed with picard tools version 1.118. Reads were extended to the average fragment size and bigWig files containing counts of reads per basepair created. Peaks for ATAC-seq samples were called with MACS2 version 2.1.1.20160309 (Zhang et al., 2008) using the “–nomodel” and “–extsize 147” parameters. Peaks were assigned to genes by proximity. If a peak overlapped the gene body or promoter ± 2500bp of the transcription start site (TSS), the peak was assigned to that gene. If a peak did not fall into these criteria, the peak was assigned to the closest TSS. If the nearest TSS to the peak was further than 100kb away, no gene was assigned.
qPCR
qPCR analyses were performed as described (Nistala et al., 2010). RNA from isolated B cells/subsets was extracted using Arcturus Picopure RNA isolation kit (ThermoFisher Scientific) and RNA was reverse transcribed using an iScript cDNA synthesis kit (Bio-Rad), according to manufacturer’s instructions. qPCR was performed on the cDNA samples using iQ SYBR® Green Supermix (Bio-Rad), according to manufacturer’s instructions. Primers were used at a concentration of 10 μM. Quantitect primers for Arnt, Ahrr and Cyp1a1 were purchased from QIAGEN. Primers for β-Actin and Ahr were custom designed with the following sequences: Act Forward (5′-AGATGACCCAGATCATGTTTGAG-3′); Act Reverse (5′- AGGTCCAGACGCAGGATG-3′); Ahr Forward (5′-AGGATCGGGGTACCAGTTCA-3′); Ahr Reverse (5′-CTCCAGCGACTGTGTTTTGC-3′); Il6 Forward (5′-GCCTTCTTGGGACTGATGCT-3′); Il6 Reverse (5′-TGCCATTGCACAACTCTTTTC-3′); Il5ra Forward (5′-GGTCCCGGTATGCAGTTCTA-3′); Il5ra Reverse 5′-AGCCGAATGCTGGAAAAGTG-3′. Ccl22 (Hao et al., 2016), Ebi3 (Shen et al., 2014), Il2 (Martins et al., 2008), Il10 (Yanaba et al., 2009), p35 (Shen et al., 2014) Tnf (Denaës et al., 2016) were used as previously described. qPCR data were calculated as the ratio of gene to β-Actin expression by the relative quantification method (ΔΔCt; means ± s.e.m. of triplicate determination).
Quantification and Statistical Analysis
Heatmap analyses for microarray, RNA-seq and ATAC-seq datasets were performed using Multiple Experiment Viewer (MeV_4_8) software (Saeed et al., 2003). Hierarchical clustering was applied to genes using average linking clustering with the Euclidean distance metric. All data are expressed as mean ± s.e.m, unless stated otherwise. For in vivo studies, power calculations were performed on data showing mean maximum wild-type arthritic knee swelling of 2 mm with a s.d. of 0.39 mm, and an expected test group (transferred T2-MZPs) arthritic knee swelling of 1.4 mm. Group sizes of three mice or above were sufficient to reach a statistical power of at least 80% (http://www.statisticalsolutions.net/pss_calc.php). Mice were assigned at random to treatment groups for all mouse studies and, where possible, mixed among cages. Clinical scoring was performed in a blinded fashion. Mice that developed adverse reactions to protocols were excluded from datasets. Statistical significance was determined using unpaired t tests (comparison of two groups), using mann-whitney tests (comparison of two groups, non-parametric data), one-way ANOVA (comparison of three or more groups) or two-way ANOVA (comparison of two or more groups with 2 independent variables). One and two-way ANOVA were assessed with Bonferonni’s multiple comparison tests. All data met the assumption of statistical tests and had a normal distribution and variance was similar between groups that were statistically compared. Results were considered significant at p ≤ 0.05. Statistical tests were performed using GraphPad Prism (La Jolla, CA, USA) v.6, Software for Apple Mac.
Data and Code Availability
The microarray, RNA-seq and ATAC-seq datasets generated during this study are available at ArrayExpress: E-MTAB-7345, E-MTAB-7375, E-MTAB-7525 and E-MTAB-8393.
Acknowledgments
We would like to thank Dr. Chris Karp (Bill and Melinda Gates Foundation) for providing the Vert-X mice; Professor Michael Reth (Max Planck Institute) for Mb1cre mice; Professor Werner Muller (University of Manchester) for IL-10R−/− mice; the staff of the University College London Biological Services Unit for all the help with animal husbandry; Jamie Evans for cell sorting; Drs. Diego Catalán and Amanda Duhlin for critically reviewing the manuscript; Drs. Tina Baker and Leo Swadling for help with analysis of the RNA-seq dataset; and Professor Idit Shachar, Lihi Radomir, and the Crown Institute for Genomics in the Nancy and Stephen Grand Israel National Center for Personalized Medicine (G-INCPM) for the library preparation and sequencing of the RNA-seq samples. This work is funded by a Versus Arthritis program grant (21140) to C.M. and the European Community’s Seventh Framework Programme (FP7-2007-2013) under grant agreement HEALTH-F2-2013-602114 (Athero-B-Cell) to C.M. and I.D. C.J.M.P is funded by a Rosetrees Trust PhD studentship (M536). E.C.R. is funded by a Versus Arthritis UK Foundation fellowship (21141). K.N. and part of this work are funded by a Wellcome Trust Intermediate Clinical Fellowship (097259/Z/11/Z). B.S. is supported by the Francis Crick Institute, which receives its core funding from Cancer Research UK (FC001159), The UK Medical Research Council (FC001159), and the Wellcome Trust (FC001159).
Author Contributions
C.J.M.P. designed and performed experiments, analyzed data, and wrote the manuscript. E.C.R. performed experiments, analyzed data, and critically reviewed the manuscript. K.O. analyzed data and wrote the manuscript. T.K., A.F.R., and C.B. performed the bioinformatics analysis of the ATAC-seq data and critically reviewed the manuscript. A.B. and G.X. performed the ChIP and critically reviewed the manuscript. I.D. performed the bioinformatics analysis of the expression microarray and RNA-seq datasets. K.N. and S.T. performed some of the experiments and analyzed data. B.S. and M.V. generated the Ahrfl/−Mb1cre/+ deficient mice, helped design the experiments, and critically reviewed the manuscript. C.M. designed the study, analyzed data, and wrote the manuscript.
Declaration of Interests
The authors declare no competing interests.
Published: November 12, 2019
Footnotes
Supplemental Information can be found online at https://doi.org/10.1016/j.celrep.2019.10.018.
Supplemental Information
References
- Anders S., Pyl P.T., Huber W. HTSeq—a Python framework to work with high-throughput sequencing data. Bioinformatics. 2015;31:166–169. doi: 10.1093/bioinformatics/btu638. [DOI] [PMC free article] [PubMed] [Google Scholar]
- Apetoh L., Quintana F.J., Pot C., Joller N., Xiao S., Kumar D., Burns E.J., Sherr D.H., Weiner H.L., Kuchroo V.K. The aryl hydrocarbon receptor interacts with c-Maf to promote the differentiation of type 1 regulatory T cells induced by IL-27. Nat. Immunol. 2010;11:854–861. doi: 10.1038/ni.1912. [DOI] [PMC free article] [PubMed] [Google Scholar]
- Blair P.A., Noreña L.Y., Flores-Borja F., Rawlings D.J., Isenberg D.A., Ehrenstein M.R., Mauri C. CD19(+)CD24(hi)CD38(hi) B cells exhibit regulatory capacity in healthy individuals but are functionally impaired in systemic Lupus Erythematosus patients. Immunity. 2010;32:129–140. doi: 10.1016/j.immuni.2009.11.009. [DOI] [PubMed] [Google Scholar]
- Bray N.L., Pimentel H., Melsted P., Pachter L. Near-optimal probabilistic RNA-seq quantification. Nat. Biotechnol. 2016;34:525–527. doi: 10.1038/nbt.3519. [DOI] [PubMed] [Google Scholar]
- Brummel R., Lenert P. Activation of marginal zone B cells from lupus mice with type A(D) CpG-oligodeoxynucleotides. J. Immunol. 2005;174:2429–2434. doi: 10.4049/jimmunol.174.4.2429. [DOI] [PubMed] [Google Scholar]
- Carter N.A., Vasconcellos R., Rosser E.C., Tulone C., Muñoz-Suano A., Kamanaka M., Ehrenstein M.R., Flavell R.A., Mauri C. Mice lacking endogenous IL-10-producing regulatory B cells develop exacerbated disease and present with an increased frequency of Th1/Th17 but a decrease in regulatory T cells. J. Immunol. 2011;186:5569–5579. doi: 10.4049/jimmunol.1100284. [DOI] [PubMed] [Google Scholar]
- De Abrew K.N., Phadnis A.S., Crawford R.B., Kaminski N.E., Thomas R.S. Regulation of Bach2 by the aryl hydrocarbon receptor as a mechanism for suppression of B-cell differentiation by 2,3,7,8-tetrachlorodibenzo-p-dioxin. Toxicol. Appl. Pharmacol. 2011;252:150–158. doi: 10.1016/j.taap.2011.01.020. [DOI] [PMC free article] [PubMed] [Google Scholar]
- Denaës T., Lodder J., Chobert M.N., Ruiz I., Pawlotsky J.M., Lotersztajn S., Teixeira-Clerc F. The cannabinoid receptor 2 protects against alcoholic liver disease via a macrophage autophagy-dependent pathway. Sci. Rep. 2016;6:28806. doi: 10.1038/srep28806. [DOI] [PMC free article] [PubMed] [Google Scholar]
- Dobin A., Davis C.A., Schlesinger F., Drenkow J., Zaleski C., Jha S., Batut P., Chaisson M., Gingeras T.R. STAR: ultrafast universal RNA-seq aligner. Bioinformatics. 2013;29:15–21. doi: 10.1093/bioinformatics/bts635. [DOI] [PMC free article] [PubMed] [Google Scholar]
- Evans J.G., Chavez-Rueda K.A., Eddaoudi A., Meyer-Bahlburg A., Rawlings D.J., Ehrenstein M.R., Mauri C. Novel suppressive function of transitional 2 B cells in experimental arthritis. J. Immunol. 2007;178:7868–7878. doi: 10.4049/jimmunol.178.12.7868. [DOI] [PubMed] [Google Scholar]
- Feige U., Hu Y.L., Gasser J., Campagnuolo G., Munyakazi L., Bolon B. Anti-interleukin-1 and anti-tumor necrosis factor-alpha synergistically inhibit adjuvant arthritis in Lewis rats. Cell. Mol. Life Sci. 2000;57:1457–1470. doi: 10.1007/PL00000629. [DOI] [PMC free article] [PubMed] [Google Scholar]
- Fillatreau S., Sweenie C.H., McGeachy M.J., Gray D., Anderton S.M. B cells regulate autoimmunity by provision of IL-10. Nat. Immunol. 2002;3:944–950. doi: 10.1038/ni833. [DOI] [PubMed] [Google Scholar]
- Gray M., Miles K., Salter D., Gray D., Savill J. Apoptotic cells protect mice from autoimmune inflammation by the induction of regulatory B cells. Proc. Natl. Acad. Sci. U S A. 2007;104:14080–14085. doi: 10.1073/pnas.0700326104. [DOI] [PMC free article] [PubMed] [Google Scholar]
- Hao S., Han X., Wang D., Yang Y., Li Q., Li X., Qiu C.H. Critical role of CCL22/CCR4 axis in the maintenance of immune homeostasis during apoptotic cell clearance by splenic CD8α(+) CD103(+) dendritic cells. Immunology. 2016;148:174–186. doi: 10.1111/imm.12596. [DOI] [PMC free article] [PubMed] [Google Scholar]
- Heath-Pagliuso S., Rogers W.J., Tullis K., Seidel S.D., Cenijn P.H., Brouwer A., Denison M.S. Activation of the Ah receptor by tryptophan and tryptophan metabolites. Biochemistry. 1998;37:11508–11515. doi: 10.1021/bi980087p. [DOI] [PubMed] [Google Scholar]
- Imai T., Nagira M., Takagi S., Kakizaki M., Nishimura M., Wang J., Gray P.W., Matsushima K., Yoshie O. Selective recruitment of CCR4-bearing Th2 cells toward antigen-presenting cells by the CC chemokines thymus and activation-regulated chemokine and macrophage-derived chemokine. Int. Immunol. 1999;11:81–88. doi: 10.1093/intimm/11.1.81. [DOI] [PubMed] [Google Scholar]
- Iyer S.S., Cheng G. Role of interleukin 10 transcriptional regulation in inflammation and autoimmune disease. Crit. Rev. Immunol. 2012;32:23–63. doi: 10.1615/critrevimmunol.v32.i1.30. [DOI] [PMC free article] [PubMed] [Google Scholar]
- Kanehisa M., Sato Y., Kawashima M., Furumichi M., Tanabe M. KEGG as a reference resource for gene and protein annotation. Nucleic Acids Res. 2016;44(D1):D457–D462. doi: 10.1093/nar/gkv1070. [DOI] [PMC free article] [PubMed] [Google Scholar]
- Kasama T., Strieter R.M., Lukacs N.W., Lincoln P.M., Burdick M.D., Kunkel S.L. Interleukin-10 expression and chemokine regulation during the evolution of murine type II collagen-induced arthritis. J. Clin. Invest. 1995;95:2868–2876. doi: 10.1172/JCI117993. [DOI] [PMC free article] [PubMed] [Google Scholar]
- Kauffmann A., Gentleman R., Huber W. arrayQualityMetrics—a bioconductor package for quality assessment of microarray data. Bioinformatics. 2009;25:415–416. doi: 10.1093/bioinformatics/btn647. [DOI] [PMC free article] [PubMed] [Google Scholar]
- Khan A., Fornes O., Stigliani A., Gheorghe M., Castro-Mondragon J.A., van der Lee R., Bessy A., Chèneby J., Kulkarni S.R., Tan G. JASPAR 2018: update of the open-access database of transcription factor binding profiles and its web framework. Nucleic Acids Res. 2018;46(D1):D260–D266. doi: 10.1093/nar/gkx1126. [DOI] [PMC free article] [PubMed] [Google Scholar]
- Kimura A., Naka T., Nakahama T., Chinen I., Masuda K., Nohara K., Fujii-Kuriyama Y., Kishimoto T. Aryl hydrocarbon receptor in combination with Stat1 regulates LPS-induced inflammatory responses. J. Exp. Med. 2009;206:2027–2035. doi: 10.1084/jem.20090560. [DOI] [PMC free article] [PubMed] [Google Scholar]
- Klinker M.W., Reed T.J., Fox D.A., Lundy S.K. Interleukin-5 supports the expansion of fas ligand-expressing killer B cells that induce antigen-specific apoptosis of CD4(+) T cells and secrete interleukin-10. PLoS ONE. 2013;8:e70131. doi: 10.1371/journal.pone.0070131. [DOI] [PMC free article] [PubMed] [Google Scholar]
- Lampropoulou V., Hoehlig K., Roch T., Neves P., Calderón Gómez E., Sweenie C.H., Hao Y., Freitas A.A., Steinhoff U., Anderton S.M., Fillatreau S. TLR-activated B cells suppress T cell-mediated autoimmunity. J. Immunol. 2008;180:4763–4773. doi: 10.4049/jimmunol.180.7.4763. [DOI] [PubMed] [Google Scholar]
- Li S., Miao T., Sebastian M., Bhullar P., Ghaffari E., Liu M., Symonds A.L., Wang P. The transcription factors Egr2 and Egr3 are essential for the control of inflammation and antigen-induced proliferation of B and T cells. Immunity. 2012;37:685–696. doi: 10.1016/j.immuni.2012.08.001. [DOI] [PMC free article] [PubMed] [Google Scholar]
- Lino A.C., Dang V.D., Lampropoulou V., Welle A., Joedicke J., Pohar J., Simon Q., Thalmensi J., Baures A., Fluhler V. LAG-3 inhibitory receptor expression identifies immunosuppressive natural regulatory plasma cells. Immunity. 2018;49:120–133.e9. doi: 10.1016/j.immuni.2018.06.007. [DOI] [PMC free article] [PubMed] [Google Scholar]
- Liu D., Yin X., Olyha S.J., Nascimento M.S.L., Chen P., White T., Gowthaman U., Zhang T., Gertie J.A., Zhang B. IL-10-dependent crosstalk between murine marginal zone B cells, macrophages, and CD8alpha(+) dendritic cells promotes Listeria monocytogenes infection. Immunity. 2019;51:64–76.e7. doi: 10.1016/j.immuni.2019.05.011. [DOI] [PMC free article] [PubMed] [Google Scholar]
- Madan R., Demircik F., Surianarayanan S., Allen J.L., Divanovic S., Trompette A., Yogev N., Gu Y., Khodoun M., Hildeman D. Nonredundant roles for B cell-derived IL-10 in immune counter-regulation. J. Immunol. 2009;183:2312–2320. doi: 10.4049/jimmunol.0900185. [DOI] [PMC free article] [PubMed] [Google Scholar]
- Martins G.A., Cimmino L., Liao J., Magnusdottir E., Calame K. Blimp-1 directly represses Il2 and the Il2 activator Fos, attenuating T cell proliferation and survival. J. Exp. Med. 2008;205:1959–1965. doi: 10.1084/jem.20080526. [DOI] [PMC free article] [PubMed] [Google Scholar]
- Matsumoto M., Fujii Y., Baba A., Hikida M., Kurosaki T., Baba Y. The calcium sensors STIM1 and STIM2 control B cell regulatory function through interleukin-10 production. Immunity. 2011;34:703–714. doi: 10.1016/j.immuni.2011.03.016. [DOI] [PubMed] [Google Scholar]
- Matsumoto M., Baba A., Yokota T., Nishikawa H., Ohkawa Y., Kayama H., Kallies A., Nutt S.L., Sakaguchi S., Takeda K. Interleukin-10-producing plasmablasts exert regulatory function in autoimmune inflammation. Immunity. 2014;41:1040–1051. doi: 10.1016/j.immuni.2014.10.016. [DOI] [PubMed] [Google Scholar]
- Mauri C., Mars L.T., Londei M. Therapeutic activity of agonistic monoclonal antibodies against CD40 in a chronic autoimmune inflammatory process. Nat. Med. 2000;6:673–679. doi: 10.1038/76251. [DOI] [PubMed] [Google Scholar]
- McClintick J.N., Edenberg H.J. Effects of filtering by Present call on analysis of microarray experiments. BMC Bioinformatics. 2006;7:49. doi: 10.1186/1471-2105-7-49. [DOI] [PMC free article] [PubMed] [Google Scholar]
- Menon M., Blair P.A., Isenberg D.A., Mauri C. A regulatory feedback between plasmacytoid dendritic cells and regulatory B cells is aberrant in systemic lupus erythematosus. Immunity. 2016;44:683–697. doi: 10.1016/j.immuni.2016.02.012. [DOI] [PMC free article] [PubMed] [Google Scholar]
- Mohan K., Issekutz T.B. Blockade of chemokine receptor CXCR3 inhibits T cell recruitment to inflamed joints and decreases the severity of adjuvant arthritis. J. Immunol. 2007;179:8463–8469. doi: 10.4049/jimmunol.179.12.8463. [DOI] [PubMed] [Google Scholar]
- Nakayama T., Hieshima K., Nagakubo D., Sato E., Nakayama M., Kawa K., Yoshie O. Selective induction of Th2-attracting chemokines CCL17 and CCL22 in human B cells by latent membrane protein 1 of Epstein-Barr virus. J. Virol. 2004;78:1665–1674. doi: 10.1128/JVI.78.4.1665-1674.2004. [DOI] [PMC free article] [PubMed] [Google Scholar]
- Nistala K., Adams S., Cambrook H., Ursu S., Olivito B., de Jager W., Evans J.G., Cimaz R., Bajaj-Elliott M., Wedderburn L.R. Th17 plasticity in human autoimmune arthritis is driven by the inflammatory environment. Proc. Natl. Acad. Sci. U S A. 2010;107:14751–14756. doi: 10.1073/pnas.1003852107. [DOI] [PMC free article] [PubMed] [Google Scholar]
- Ohshima S., Saeki Y., Mima T., Sasai M., Nishioka K., Nomura S., Kopf M., Katada Y., Tanaka T., Suemura M., Kishimoto T. Interleukin 6 plays a key role in the development of antigen-induced arthritis. Proc. Natl. Acad. Sci. U S A. 1998;95:8222–8226. doi: 10.1073/pnas.95.14.8222. [DOI] [PMC free article] [PubMed] [Google Scholar]
- Oleinika K., Rosser E.C., Matei D.E., Nistala K., Bosma A., Drozdov I., Mauri C. CD1d-dependent immune suppression mediated by regulatory B cells through modulations of iNKT cells. Nat. Commun. 2018;9:684. doi: 10.1038/s41467-018-02911-y. [DOI] [PMC free article] [PubMed] [Google Scholar]
- Pils M.C., Pisano F., Fasnacht N., Heinrich J.M., Groebe L., Schippers A., Rozell B., Jack R.S., Müller W. Monocytes/macrophages and/or neutrophils are the target of IL-10 in the LPS endotoxemia model. Eur. J. Immunol. 2010;40:443–448. doi: 10.1002/eji.200939592. [DOI] [PubMed] [Google Scholar]
- Rendeiro A.F., Schmidl C., Strefford J.C., Walewska R., Davis Z., Farlik M., Oscier D., Bock C. Chromatin accessibility maps of chronic lymphocytic leukaemia identify subtype-specific epigenome signatures and transcription regulatory networks. Nat. Commun. 2016;7:11938. doi: 10.1038/ncomms11938. [DOI] [PMC free article] [PubMed] [Google Scholar]
- Richards S., Watanabe C., Santos L., Craxton A., Clark E.A. Regulation of B-cell entry into the cell cycle. Immunol. Rev. 2008;224:183–200. doi: 10.1111/j.1600-065X.2008.00652.x. [DOI] [PMC free article] [PubMed] [Google Scholar]
- Ritchie M.E., Phipson B., Wu D., Hu Y., Law C.W., Shi W., Smyth G.K. limma powers differential expression analyses for RNA-sequencing and microarray studies. Nucleic Acids Res. 2015;43:e47. doi: 10.1093/nar/gkv007. [DOI] [PMC free article] [PubMed] [Google Scholar]
- Robinson M.D., Smyth G.K. Small-sample estimation of negative binomial dispersion, with applications to SAGE data. Biostatistics. 2008;9:321–332. doi: 10.1093/biostatistics/kxm030. [DOI] [PubMed] [Google Scholar]
- Robinson M.D., McCarthy D.J., Smyth G.K. edgeR: a Bioconductor package for differential expression analysis of digital gene expression data. Bioinformatics. 2010;26:139–140. doi: 10.1093/bioinformatics/btp616. [DOI] [PMC free article] [PubMed] [Google Scholar]
- Rosser E.C., Mauri C. Regulatory B cells: origin, phenotype, and function. Immunity. 2015;42:607–612. doi: 10.1016/j.immuni.2015.04.005. [DOI] [PubMed] [Google Scholar]
- Rosser E.C., Oleinika K., Tonon S., Doyle R., Bosma A., Carter N.A., Harris K.A., Jones S.A., Klein N., Mauri C. Regulatory B cells are induced by gut microbiota-driven interleukin-1β and interleukin-6 production. Nat. Med. 2014;20:1334–1339. doi: 10.1038/nm.3680. [DOI] [PubMed] [Google Scholar]
- Rothhammer V., Borucki D.M., Tjon E.C., Takenaka M.C., Chao C.C., Ardura-Fabregat A., de Lima K.A., Gutiérrez-Vázquez C., Hewson P., Staszewski O. Microglial control of astrocytes in response to microbial metabolites. Nature. 2018;557:724–728. doi: 10.1038/s41586-018-0119-x. [DOI] [PMC free article] [PubMed] [Google Scholar]
- Ruth J.H., Haas C.S., Park C.C., Amin M.A., Martinez R.J., Haines G.K., 3rd, Shahrara S., Campbell P.L., Koch A.E. CXCL16-mediated cell recruitment to rheumatoid arthritis synovial tissue and murine lymph nodes is dependent upon the MAPK pathway. Arthritis Rheum. 2006;54:765–778. doi: 10.1002/art.21662. [DOI] [PMC free article] [PubMed] [Google Scholar]
- Saeed A.I., Sharov V., White J., Li J., Liang W., Bhagabati N., Braisted J., Klapa M., Currier T., Thiagarajan M. TM4: a free, open-source system for microarray data management and analysis. Biotechniques. 2003;34:374–378. doi: 10.2144/03342mt01. [DOI] [PubMed] [Google Scholar]
- Saraiva M., Christensen J.R., Tsytsykova A.V., Goldfeld A.E., Ley S.C., Kioussis D., O’Garra A. Identification of a macrophage-specific chromatin signature in the IL-10 locus. J. Immunol. 2005;175:1041–1046. doi: 10.4049/jimmunol.175.2.1041. [DOI] [PubMed] [Google Scholar]
- Schneider D., Manzan M.A., Yoo B.S., Crawford R.B., Kaminski N. Involvement of Blimp-1 and AP-1 dysregulation in the 2,3,7,8-tetrachlorodibenzo-p-dioxin-mediated suppression of the IgM response by B cells. Toxicol. Sci. 2009;108:377–388. doi: 10.1093/toxsci/kfp028. [DOI] [PMC free article] [PubMed] [Google Scholar]
- Shen P., Roch T., Lampropoulou V., O’Connor R.A., Stervbo U., Hilgenberg E., Ries S., Dang V.D., Jaimes Y., Daridon C. IL-35-producing B cells are critical regulators of immunity during autoimmune and infectious diseases. Nature. 2014;507:366–370. doi: 10.1038/nature12979. [DOI] [PMC free article] [PubMed] [Google Scholar]
- Shinde R., Hezaveh K., Halaby M.J., Kloetgen A., Chakravarthy A., da Silva Medina T., Deol R., Manion K.P., Baglaenko Y., Eldh M. Apoptotic cell-induced AhR activity is required for immunological tolerance and suppression of systemic lupus erythematosus in mice and humans. Nat. Immunol. 2018;19:571–582. doi: 10.1038/s41590-018-0107-1. [DOI] [PMC free article] [PubMed] [Google Scholar]
- Stockinger B., Omenetti S. The dichotomous nature of T helper 17 cells. Nat. Rev. Immunol. 2017;17:535–544. doi: 10.1038/nri.2017.50. [DOI] [PubMed] [Google Scholar]
- Stockinger B., Di Meglio P., Gialitakis M., Duarte J.H. The aryl hydrocarbon receptor: multitasking in the immune system. Annu. Rev. Immunol. 2014;32:403–432. doi: 10.1146/annurev-immunol-032713-120245. [DOI] [PubMed] [Google Scholar]
- Szekanecz Z., Halloran M.M., Volin M.V., Woods J.M., Strieter R.M., Kenneth Haines G., 3rd, Kunkel S.L., Burdick M.D., Koch A.E. Temporal expression of inflammatory cytokines and chemokines in rat adjuvant-induced arthritis. Arthritis Rheum. 2000;43:1266–1277. doi: 10.1002/1529-0131(200006)43:6<1266::AID-ANR9>3.0.CO;2-P. [DOI] [PubMed] [Google Scholar]
- Tarca A.L., Draghici S., Khatri P., Hassan S.S., Mittal P., Kim J.S., Kim C.J., Kusanovic J.P., Romero R. A novel signaling pathway impact analysis. Bioinformatics. 2009;25:75–82. doi: 10.1093/bioinformatics/btn577. [DOI] [PMC free article] [PubMed] [Google Scholar]
- Thornton S., Duwel L.E., Boivin G.P., Ma Y., Hirsch R. Association of the course of collagen-induced arthritis with distinct patterns of cytokine and chemokine messenger RNA expression. Arthritis Rheum. 1999;42:1109–1118. doi: 10.1002/1529-0131(199906)42:6<1109::AID-ANR7>3.0.CO;2-7. [DOI] [PubMed] [Google Scholar]
- Thornton S., Boivin G.P., Kim K.N., Finkelman F.D., Hirsch R. Heterogeneous effects of IL-2 on collagen-induced arthritis. J. Immunol. 2000;165:1557–1563. doi: 10.4049/jimmunol.165.3.1557. [DOI] [PubMed] [Google Scholar]
- Tian J., Zekzer D., Hanssen L., Lu Y., Olcott A., Kaufman D.L. Lipopolysaccharide-activated B cells down-regulate Th1 immunity and prevent autoimmune diabetes in nonobese diabetic mice. J. Immunol. 2001;167:1081–1089. doi: 10.4049/jimmunol.167.2.1081. [DOI] [PubMed] [Google Scholar]
- Tucker A.N., Vore S.J., Luster M.I. Suppression of B cell differentiation by 2,3,7,8-tetrachlorodibenzo-p-dioxin. Mol. Pharmacol. 1986;29:372–377. [PubMed] [Google Scholar]
- Turner C.A., Jr., Mack D.H., Davis M.M. Blimp-1, a novel zinc finger-containing protein that can drive the maturation of B lymphocytes into immunoglobulin-secreting cells. Cell. 1994;77:297–306. doi: 10.1016/0092-8674(94)90321-2. [DOI] [PubMed] [Google Scholar]
- Vaidyanathan B., Chaudhry A., Yewdell W.T., Angeletti D., Yen W.F., Wheatley A.K., Bradfield C.A., McDermott A.B., Yewdell J.W., Rudensky A.Y., Chaudhuri J. The aryl hydrocarbon receptor controls cell-fate decisions in B cells. J. Exp. Med. 2017;214:197–208. doi: 10.1084/jem.20160789. [DOI] [PMC free article] [PubMed] [Google Scholar]
- Vasconcellos R., Carter N.A., Rosser E.C., Mauri C. IL-12p35 subunit contributes to autoimmunity by limiting IL-27-driven regulatory responses. J. Immunol. 2011;187:3402–3412. doi: 10.4049/jimmunol.1100224. [DOI] [PubMed] [Google Scholar]
- Veldhoen M., Hirota K., Christensen J., O’Garra A., Stockinger B. Natural agonists for aryl hydrocarbon receptor in culture medium are essential for optimal differentiation of Th17 T cells. J. Exp. Med. 2009;206:43–49. doi: 10.1084/jem.20081438. [DOI] [PMC free article] [PubMed] [Google Scholar]
- Villa M., Gialitakis M., Tolaini M., Ahlfors H., Henderson C.J., Wolf C.R., Brink R., Stockinger B. Aryl hydrocarbon receptor is required for optimal B-cell proliferation. EMBO J. 2017;36:116–128. doi: 10.15252/embj.201695027. [DOI] [PMC free article] [PubMed] [Google Scholar]
- Vos J.G., Moore J.A., Zinkl J.G. Effect of 2,3,7,8-tetrachlorodibenzo-p-dioxin on the immune system of laboratory animals. Environ. Health Perspect. 1973;5:149–162. doi: 10.1289/ehp.7305149. [DOI] [PMC free article] [PubMed] [Google Scholar]
- Wagage S., John B., Krock B.L., Hall A.O., Randall L.M., Karp C.L., Simon M.C., Hunter C.A. The aryl hydrocarbon receptor promotes IL-10 production by NK cells. J. Immunol. 2014;192:1661–1670. doi: 10.4049/jimmunol.1300497. [DOI] [PMC free article] [PubMed] [Google Scholar]
- Yamaguchi K., Matulka R.A., Shneider A.M., Toselli P., Trombino A.F., Yang S., Hafer L.J., Mann K.K., Tao X.J., Tilly J.L. Induction of PreB cell apoptosis by 7,12-dimethylbenz[a]anthracene in long-term primary murine bone marrow cultures. Toxicol. Appl. Pharmacol. 1997;147:190–203. doi: 10.1006/taap.1997.8263. [DOI] [PubMed] [Google Scholar]
- Yamaguchi K., Near R.I., Matulka R.A., Shneider A., Toselli P., Trombino A.F., Sherr D.H. Activation of the aryl hydrocarbon receptor/transcription factor and bone marrow stromal cell-dependent preB cell apoptosis. J. Immunol. 1997;158:2165–2173. [PubMed] [Google Scholar]
- Yanaba K., Bouaziz J.D., Haas K.M., Poe J.C., Fujimoto M., Tedder T.F. A regulatory B cell subset with a unique CD1dhiCD5+ phenotype controls T cell-dependent inflammatory responses. Immunity. 2008;28:639–650. doi: 10.1016/j.immuni.2008.03.017. [DOI] [PubMed] [Google Scholar]
- Yanaba K., Bouaziz J.D., Matsushita T., Tsubata T., Tedder T.F. The development and function of regulatory B cells expressing IL-10 (B10 cells) requires antigen receptor diversity and TLR signals. J. Immunol. 2009;182:7459–7472. doi: 10.4049/jimmunol.0900270. [DOI] [PMC free article] [PubMed] [Google Scholar]
- Ye J., Qiu J., Bostick J.W., Ueda A., Schjerven H., Li S., Jobin C., Chen Z.E., Zhou L. The aryl hydrocarbon receptor preferentially marks and promotes gut regulatory T cells. Cell Rep. 2017;21:2277–2290. doi: 10.1016/j.celrep.2017.10.114. [DOI] [PMC free article] [PubMed] [Google Scholar]
- Yoshizaki A., Miyagaki T., DiLillo D.J., Matsushita T., Horikawa M., Kountikov E.I., Spolski R., Poe J.C., Leonard W.J., Tedder T.F. Regulatory B cells control T-cell autoimmunity through IL-21-dependent cognate interactions. Nature. 2012;491:264–268. doi: 10.1038/nature11501. [DOI] [PMC free article] [PubMed] [Google Scholar]
- Zhang Y., Liu T., Meyer C.A., Eeckhoute J., Johnson D.S., Bernstein B.E., Nusbaum C., Myers R.M., Brown M., Li W., Liu X.S. Model-based analysis of ChIP-Seq (MACS) Genome Biol. 2008;9:R137. doi: 10.1186/gb-2008-9-9-r137. [DOI] [PMC free article] [PubMed] [Google Scholar]
Associated Data
This section collects any data citations, data availability statements, or supplementary materials included in this article.
Supplementary Materials
Data Availability Statement
The microarray, RNA-seq and ATAC-seq datasets generated during this study are available at ArrayExpress: E-MTAB-7345, E-MTAB-7375, E-MTAB-7525 and E-MTAB-8393.