Summary
Whole genome sequencing (WGS) brings comprehensive insights to cancer genome interpretation. To explore clinical value of WGS, we sequenced 254 triple negative breast cancers (TNBC) with associated treatment and outcome data collected between 2010-2015 via the population-based Sweden Cancerome Analysis Network-Breast (SCAN-B) project (ClinicalTrials.gov ID:NCT02306096). Applying the HRDetect mutational-signature-based algorithm to classify tumors, 59% were predicted to have Homologous-recombination-repair deficiency (HRDetect-high): 67% explained by germline/somatic mutations of BRCA1/BRCA2, BRCA1 promoter hypermethylation, RAD51C hypermethylation or biallelic loss of PALB2. A novel mechanism of BRCA1 abrogation was discovered via germline SINE-VNTR-Alu retrotransposition. HRDetect provided independent prognostic information, with HRDetect-high patients having better outcome on adjuvant chemotherapy for invasive disease-free survival (Hazard Ratio, HR=0.42, 95% confidence interval, CI=0.2-0.87), and distant relapse-free interval (HR=0.31, CI=0.13-0.76) compared to HRDetect-low, regardless of whether a genetic/epigenetic cause was identified. HRDetect-intermediate, some possessing potentially targetable biological abnormalities, had poorest outcomes. HRDetect-low cancers also had inadequate outcomes: ~4.7% were mismatch-repair-deficient - another targetable defect, not typically sought; and was enriched for (but not restricted to) PIK3CA/AKT1 pathway abnormalities. New treatment options need to be considered for now-discernible HRDetect-intermediate and HRDetect-low categories. This population-based study advocates for WGS of TNBC to better inform trial stratification and improve clinical decision-making.
Introduction
Recent advances in sequencing technology1 have significantly reduced sequencing costs. Cancer whole genome sequencing (WGS) is now feasible, with thousands of matched tumor-normal pairs successfully sequenced to date, revealing novel biological insights2–4. Yet, for WGS to become adopted clinically, systematic demonstrations of utility in well-characterised population-based studies and validation in clinical trials are required.
The Sweden Cancerome Analysis Network – Breast (SCAN-B; ClinicalTrials.gov identifier NCT02306096)5 is an on-going population-based observational study currently involving nine hospitals in the South of Sweden serving nearly two million inhabitants or ~20% of the Swedish population. All patients with suspected breast cancer are offered recruitment without exception. Connection to national cancer registries ensures availability of excellent clinical and outcome data. High inclusion rates of ~85% have resulted in >13,500 patients recruited since 2010. Tissue samples are taken via standard clinical diagnostic pathways without special dispensation. Outcomes from research on SCAN-B patients thus reflect real-world population medicine (Extended Data 1).
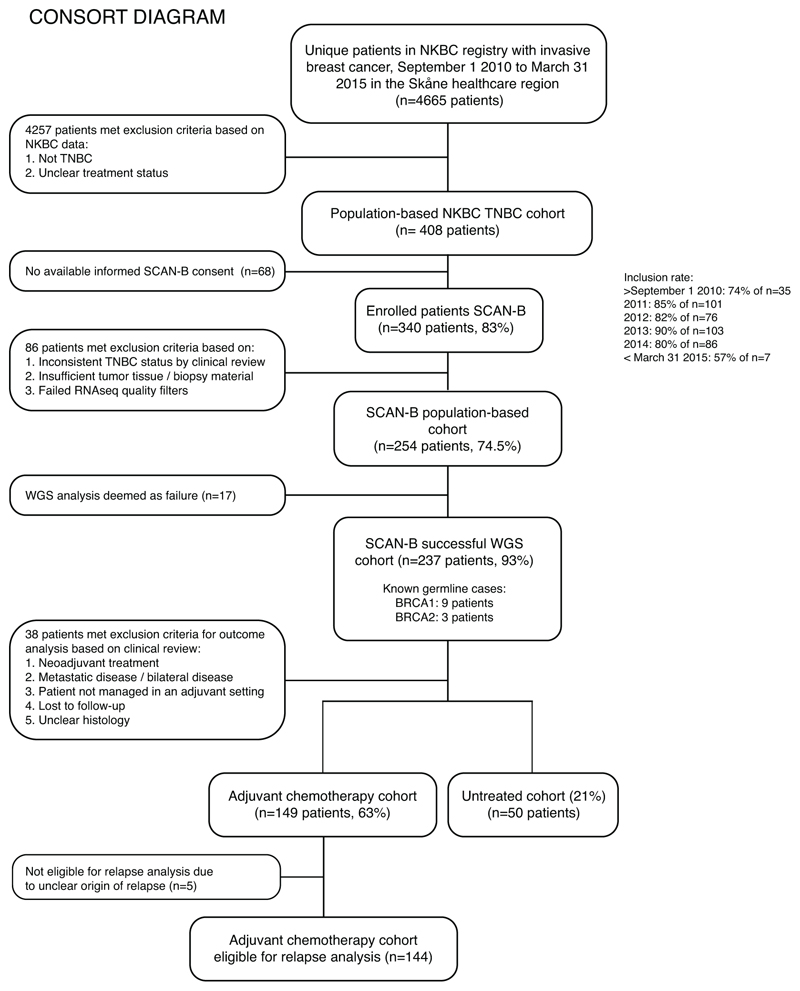
To gauge WGS value in a clinical setting and capturing sufficient outcome information, we defined a recruitment period of September 1 2010 to March 31 2015 in the Skåne healthcare region serving ~1.3 million inhabitants. We focused on an area of unmet clinical need: triple negative breast cancer (TNBC) (estrogen-receptor [ER], progesterone-receptor [PR], human epidermal receptor growth factor 2/erythroblastic oncogene B [HER2/ERBB2]-negative)6,7, historically associated with poor clinical outcomes6,7. 4665 patients were registered with invasive breast cancer in that period. Nine percent (n=408) were TNBCs, consistent with national TNBC incidence (~9% in 2015). 340 had enrolled into SCAN-B. Clinical re-review and availability of material for genomic/transcriptomic sequencing left 254 cases for matched tumor-normal WGS/RNAseq analysis (170 at 30-fold and 84 at 15-fold sequence depth) (Figure 1). Among 254 patients, 2.4% had metastatic disease at diagnosis, and 6.7% received neoadjuvant treatment.
Figure 1. CONSORT diagram of the study.
CONSORT diagram for patients identified during September 1 2010 to March 31 2015 in the Skåne healthcare region with four participating SCAN-B sites: Lund, Malmö, Helsingborg, and Kristianstad. NKBC: Swedish national breast cancer quality registry.
237 (93%) had WGS data of sufficient quality for comprehensive genomic profiling. Failure rate was influenced by sequencing depth: of cases sequenced to 30-fold depth, 3% failed, whereas 11% of cases failed when sequenced to 15-fold coverage. SCAN-B fresh-tissue procurement is fully-integrated into routine clinical diagnostics across participating healthcare institutions5. Failure rates of ~3% thus provide true estimates of 30-fold WGS success in a clinical context, without preselection for tumor cellularity. 15-fold coverage for clinical WGS is unlikely to be adequate.
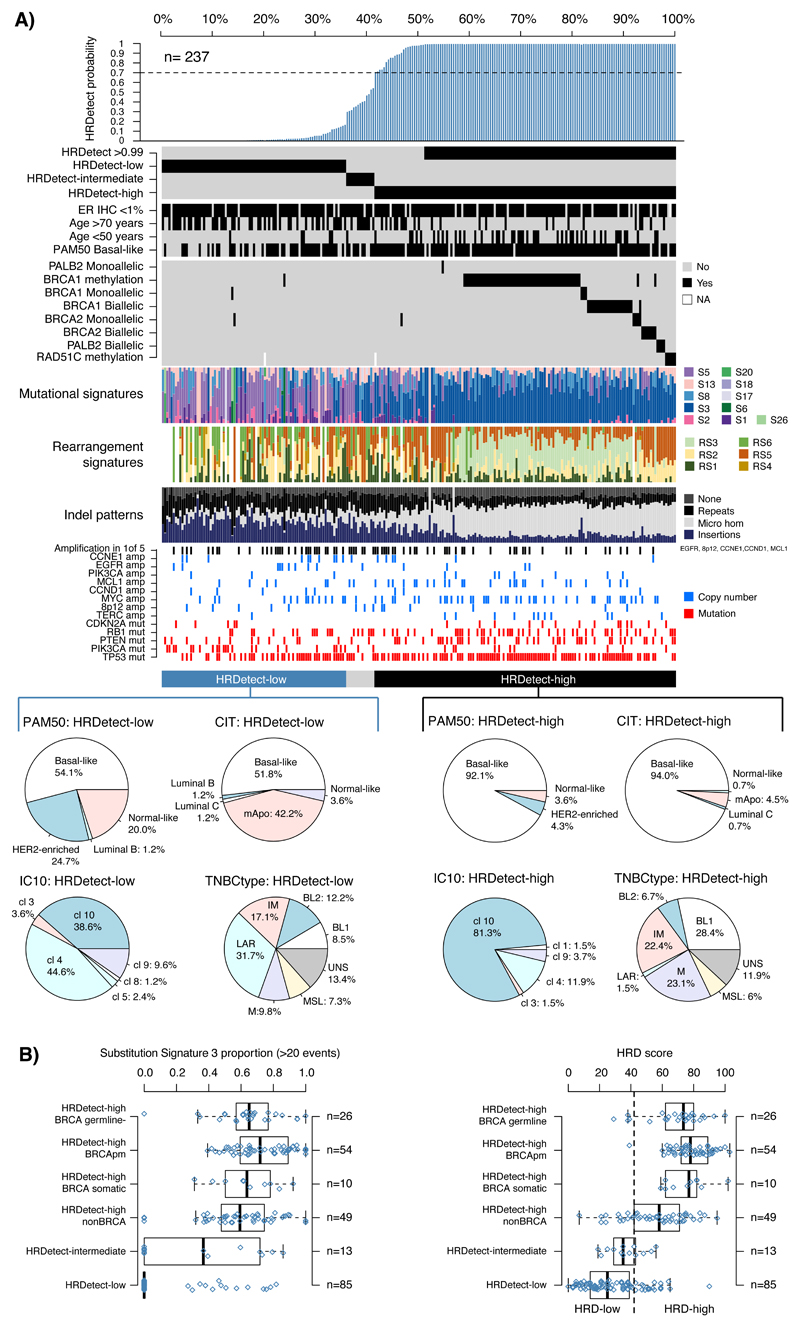
Predicted somatic driver mutations, pathogenic germline mutations and somatic mutational signatures were obtained, together with regions of copy number loss, gain and loss of heterozygosity (LOH). These genomic features in the SCAN-B TNBC cohort were comparable to a previously reported WGS cohort8 (Extended Data 2). To assess additional benefits of WGS-based stratification, we applied a mutational-signature-based algorithm, HRDetect9 designed to detect “BRCA”ness or Homologous-recombination-repair deficiency (HRD)10, using default breast-cancer-specific parameters. More than half of TNBCs (58.6%) were classified as HRDetect-high (exceeding predefined score of 0.7, predictive of BRCA1/BRCA2-deficiency9). 35.9% were classified as HRDetect-low (score <0.2), 5.5% fell within an HRD-intermediate category (score 0.2-0.7) (Figure 2A).
Figure 2. HRDetect classification and genomic characteristics in population-based TNBC.
(A) Bar plot of HRDetect probability obtained in 237 TNBCs together with clinical and genomic characteristics obtained from WGS and RNAseq. Annotation tracks for samples include from top to bottom ER IHC scoring, patient age, the basal-like phenotype from PAM50 classification11, and genetic alterations in homologous recombination associated genes (BRCA1, BRCA2, PALB2, RAD51C). Further, proportions of mutational and rearrangement signatures and indel patterns are shown as bar plots. Mutations and copy number amplifications in key oncogenes and tumor suppressors are represented for individual samples. Molecular subtype proportions in HRDetect-high and HRDetect-low cases for PAM50, CIT, IC10, and TNBCtype are represented by pie charts. Intermediary samples excluded due to low numbers. CIT subtypes12; mApo, molecular apocrine. IC10 subtypes15; cl (IntClust) 10 corresponding to basal-like tumors by other subtyping schemes. TNBCtype subtypes14; BL1, basal-like 1: BL 2, basal-like 2: IM, immunomodulatory: M, mesenchymal: MSL, mesenchymal stem-like: LAR, luminal androgen receptor: UNS, uncertain. (B) Proportions of mutational signature 3 (in tumors with >20 events) and HRD scores according to Telli et al.10 across subgroups defined first by HRDetect class (-low, -intermediate, and –high), where the HRDetect-high subgroup is further divided into whether BRCA1/BRCA2 was inactivated by a germline mutation, somatic mutation, promoter hypermethylation, or no mutation was identified. Right axes in box-plots shows the number of patients in each group. Box-plot elements correspond to: i) center line = median, ii) box limits = upper and lower quartiles, iii) whiskers = 1.5x interquartile range
To compare customary breast cancer stratification methods with HRDetect, we examined age, grade and gene expression phenotypes (e.g. PAM5011, CIT12, IC1013, TNBCtype14) in this cohort. HRDetect-high classification was enriched in expected subgroups such as young patients (88.5% of women <50 years), high-grade tumors and a basal-like expression subtype (PAM50 basal-like11, CIT basal-like12, IC10 IntClust 1013, and TNBCtype basal-like 114) (Supplementary Table S1, Figure 2A). However, HRDetect-high scores were also observed in tumors with ER-staining (62.1% of cases with 1-10% ER-staining intensity), in middle-aged patients (58% of HRDetect-high were 50-70 years) and older patients (>70 years, 36.4% HRDetect-high cases), as well as tumors with non-basal-like gene expression profiles (Supplementary Table S1). Consequently, the HRD phenotype identified by HRDetect is enriched for but not restricted to typical basal-like tumors characteristic of young patients in TNBC. The corollary is also true - expression-based profiling (e.g., PAM50) and Integrative Clusters13,15 are not adequately able to discriminate HRDetect groups, suggesting that HRDetect provides a novel, independent angle to TNBC stratification.
Previously, Substitution Signature 3 and specific patterns of copy number aberrations (CNAs; “genomic scars”) have been used to infer a HRD phenotype10,16. However, choosing a Signature 3 cut-off is challenging as this signature has a featureless, flat profile, where mutations are often mis-assigned. The CNA-based “HRD assay” has a designated cut-off of 4210. When compared with HRDetect as reference, the “HRD assay” has a false negative rate of 13%, and 16% of CNA-based HRD-high cases were false positives. HRDetect is therefore more specific than current substitution signature and CNA approaches, while extending identification of HRD to a wider set of samples revealing tumors that are likely inactivated by ways other than classical mechanisms (Figure 2B).
Next, to comprehensively understand the causes of HRDetect-high scores, we examined germline and somatic mutation status of BRCA1, BRCA2, a set of 163 additional HR-related or breast cancer susceptibility genes (Supplementary Data Table), and status of remaining wild-type parental allele in all samples. Systematic promoter hypermethylation by pyrosequencing of BRCA1 and RAD51C was also performed.
Of 139 HRDetect-high cases, 29 (21%) confirmed biallelic loss of BRCA1 or BRCA2 (i.e., 20 germline and 9 somatic with LOH of the wild-type parental allele) and 55 (40%) had BRCA1 hypermethylation with loss of the other parental allele (Figure 2A, note one case with concurrent BRCA2 biallelic alteration and BRCA1 hypermethylation). There were no instances of a dominantly inherited 5’ UTR variant causing methylation-associated BRCA1 silencing17.
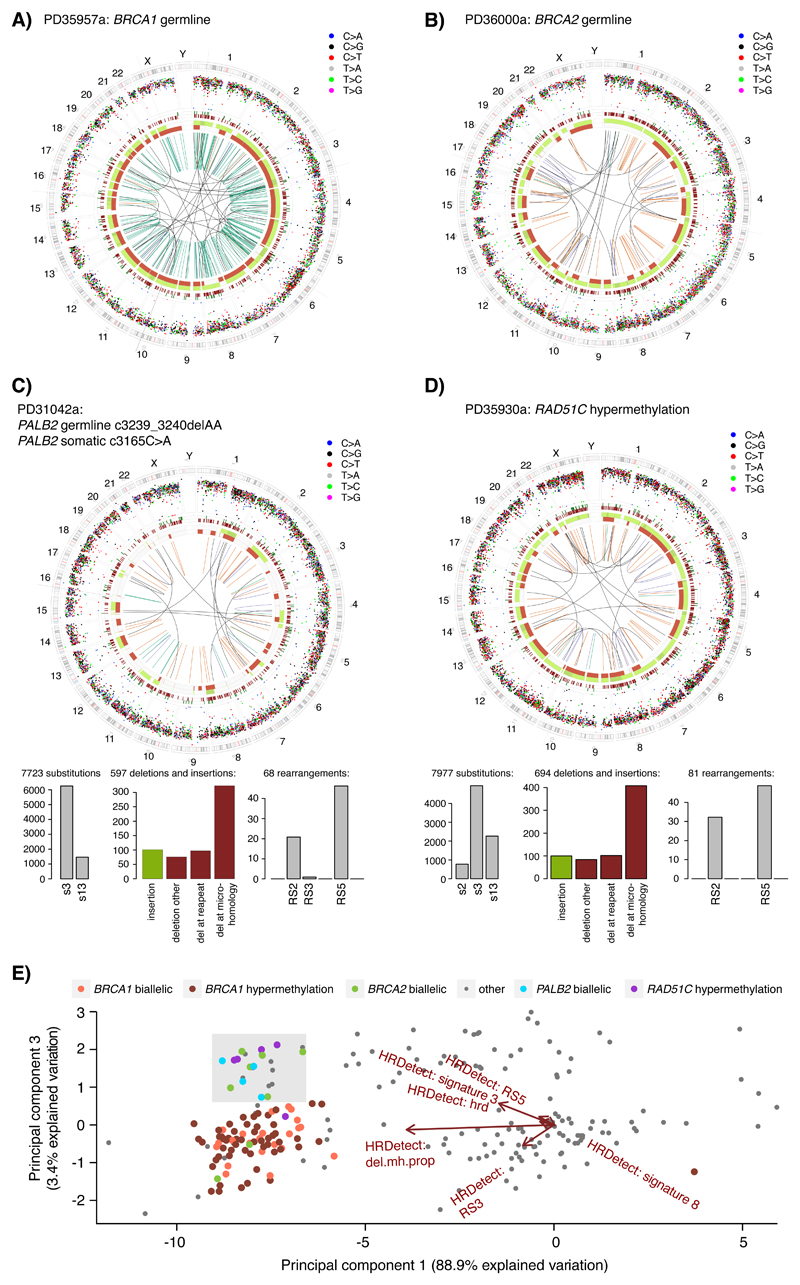
Five tumors had pathogenic germline PALB2 variants, three cases with c.509_510delGA variant (two biallelic, one monoallelic), one c.3239_3240delAA variant, one c.1039G>T variant. Four had wild-type allele inactivation through somatic pathogenic mutation in three cases and loss-of-heterozygosity in one instance. Five RAD51C hypermethylation cases were also observed with concomitant marked downregulation of RAD51C mRNA expression (Wilcoxon-test p=0.0001). Intriguingly, the four biallelic PALB2 and five RAD51C cases (6.5% of HRDetect-high cases) consistently showed a BRCA2-null phenotype16 including elevated Substitution Signature 3, elevated Rearrangement Signatures 2 and 5, and no Rearrangement Signature 3 (Figures 2A, 3A-D, Supplementary Data Table), evidenced also by principal component analysis of HRDetect components (Figure 3E). PALB2, RAD51C and BRCA2 are involved in a complex that stimulates strand invasion of the RAD51 nucleoprotein filament18,19, a critical step in HR-related repair. Thus, their BRCA2-like profiles may be explained by these molecular relationships.
Figure 3. Genetic characteristics of RAD51C- and PALB2- altered TNBCs.
(A) Circos plot of a BRCA1 germline altered TNBC case classified as HRDetect-high. Circos plot depicting from outermost rings heading inwards: Karyotypic ideogram outermost. Base substitutions next, plotted as rainfall plots (log10 intermutation distance on radial axis, dot colours: blue, C>A; black, C>G; red, C>T; grey, T>A; green, T>C; pink, T>G). Ring with short green lines, insertions; ring with short red lines, deletions. Major copy number allele ring (green, gain), minor copy number allele ring (red, loss), Central lines represent rearrangements (green, tandem duplications; red, deletions; blue, inversions; grey, interchromosomal events). (B) Circos plot of a BRCA2 germline altered TNBC case classified as HRDetect-high. (C) Circos plot and mutational signatures of a PALB2 biallelic altered TNBC case classified as HRDetect-high, histograms below show distribution of substitution signatures (left), rearrangement signatures (right), and deletions and insertions (center) as defined in8. Del: deletion. (D) Circos plots and mutational signatures of a RAD51C hypermethylated TNBC case classified as HRDetect-high. (E) Principal component analysis (PCA) of the six normalized HRDetect components9 for the 237 TNBC cases annotated by their BRCA1, BRCA2, PALB2, or RAD51C status. The plot displays PCA component 1 and 3 (accounting for 92.3% of variation across the six HRDetect components), showing the separation of biallelic BRCA2, biallelic PALB2, and RAD51C hypermethylated cases into a common sector (light grey), indicating similarities of HRDetect features.
Causes for HRDetect-high scores in the remaining 46 (33%) samples were unclear. Six were monoallelic for BRCA1/BRCA2 and had low tumor cellularity. RAD51 and PALB2 pyrosequencing did not reveal positive findings. Mobile Element analysis for 11 HR genes (ATM, BARD1, BRCA1, BRCA2, BRIP1, CHEK2, MRE11, NBN, PALB2, RAD51C, RAD51D) identified a germline SINE-VNTR-Alu (SVA) retrotransposon 1.8kb downstream of the first coding exon of BRCA1 in one patient, PD35958a. This specific mobile element has not been reported in the 1000 genomes dataset. Moreover, wild-type allele LOH was noted and BRCA1 expression was markedly reduced. SVA elements have been reported as disease-causing20, but not in BRCA1. Thus, this observation may indicate a potential novel mechanism of germline BRCA1 abrogation.
Fourteen new pathogenic germline BRCA1/BRCA2 variants were identified, in addition to the 12 hitherto known variants, raising clinical genetic counselling implications. In Sweden, re-contacting patients/families based on BRCA1/BRCA2 incidental findings has been perceived positively21 supporting the added value that tumor-directed WGS brings to family counselling.
To seek distinguishing features between different HRDetect groups, we examined driver alterations. HRDetect-high and HRDetect-intermediate cases tended towards more driver amplifications (e.g. MYC and MCL1) than HRDetect-low (Extended Data 3). Eight substitution/indel driver genes were enriched, albeit non-discriminatory between groups (TP53, PTEN, ARID1B, MLLT4 for HRDetect-high, PIK3CA and AKT1 for HRDetect-low, and RB1 and FBXW7 for HRDetect-high and HRDetect-intermediate) (Chi-square test p<0.05, Extended Data 3). Of interest, PTEN driver mutations and activating PIK3CA and AKT1 mutations are differently enriched between HRDetect-high and HRDetect-low groups: (29% versus 14% for PTEN, 2.2% versus 25% for PIK3CA, and 0.7% versus 7.1% for AKT1 for HRDetect-high versus HRDetect-low, respectively). Thus, PIK3CA/AKT1/PTEN pathway dysregulation is not restricted to a particular HRDetect group. This has potential implications for patient selection in clinical trials using PI3K-AKT-mTOR pathway agents, as mis-stratifying patients based on single mutations may affect clinical trial success.
To investigate whether HRDetect groups were simply genetic portraits of traditional transcriptional TNBC subgroups, we performed unsupervised group discovery and machine-learning based supervised classification using matched RNAseq data (Extended Data 4). Two approaches of unsupervised consensus clustering were used. Neither was able to find distinct transcriptional patterns distinguishing HRDetect-high and HRDetect-low groups (Extended Data 4A-E). Likewise, exhaustive machine-learning-based exploration could also not achieve high prediction accuracy for HRDetect-high and HRDetect-low subgroups (Extended Data 4F-G). Further, tumor-infiltrating-lymphocytes (TILs) are increasingly implicated as a predictor of relapse in breast cancer. We examined CD8/CD3/CD4 and CD247 infiltration using matched transcriptomic data for all patients in this cohort. None was differentially expressed between HRDetect groups (Kruskal-Wallis p>0.05, Extended Data 4H). Together this implies that the mutational-signature-based algorithm HRDetect captures distinctive, pathognomonic phenotypes of TNBC that are not apparent at bulk tissue transcriptional level.
HRDetect categorizes tumors differently to customary TNBC classifiers. We thus evaluated whether HRDetect’s signature-based stratification had prognostic potential. TNBC patients that did not receive adjuvant treatment due to age and/or poor performance status were considered a particular subgroup and assessed separately (Supplementary Table S2). For these patients, there were no differences observed in overall survival (OS), invasive disease-free survival (IDFS), or distant relapse-free interval (DRFI) between HRDetect-high and HRDetect-low categories (log-rank p>0.05).
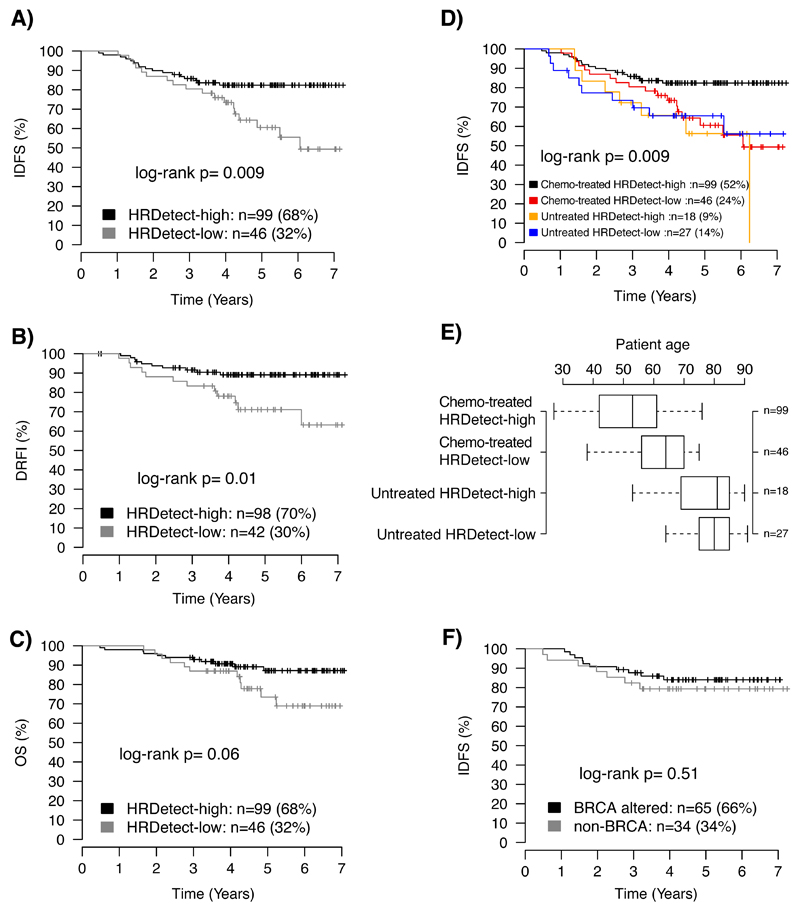
In distinct analyses of patients that received standard-of-care adjuvant chemotherapy (typically FEC±docetaxel, Supplementary Data Table), patients with HRDetect-high tumors significantly improved IDFS and DRFI (log-rank p=0.009 and p=0.01) compared to those with HRDetect-low tumors (Figures 4A-B). An improved OS was also observed (log-rank p=0.06, Figure 4C), albeit non-significant because of limited follow-up interval. This suggests that TNBC patients with HRDetect-high scores have a higher degree of chemosensitivity than HRDetect-low cases and are worth identifying.
Figure 4. Association of HRDetect classification with clinical outcomes in an unselected population-based TNBC cohort.
Kaplan-Meier analysis of association with outcome for HRDetect classification in TNBC patients treated with standard-of-care adjuvant chemotherapy (ACT) for (A) distant relapse-free interval (DRFI) as endpoint, (B) invasive disease-free survival (IDFS) as endpoint, and (C) overall survival (OS) as endpoint. (D) Invasive disease-free survival (IDFS) as endpoint showing both adjuvantly treated and untreated patients stratified by HRDetect status. (E) Distribution of patient age between HRDetect high and low groups stratified by treatment and eligibility for IDFS analysis. Box-plot elements correspond to: i) center line = median, ii) box limits = upper and lower quartiles, iii) whiskers = 1.5x interquartile range. Right axis provides number of patients in each group. (F) Kaplan-Meier analysis of association with IDFS of HRDetect-high group demonstrating no significant difference between subjects where BRCA alterations were and were not identified. All p-values in panels A-F were calculated using the log-rank test and are two-sided.
Strikingly, chemotherapy-treated HRDetect-low patients had a similar IDFS to patients that did not receive adjuvant chemotherapy, in spite of superior fitness and lower age of diagnosis (75% <70 years) (Figures 4D-E). Soberingly, this suggests that HRDetect-low cases are deriving limited benefit from current standard-of-care, warranting a re-appraisal of systemic therapies for this now-identifiable subgroup with poor outcome.
To test independent prognostic value of HRDetect in patients receiving adjuvant chemotherapy, we performed multivariable Cox regression, adjusting for tumor size (≤20mm, >20mm), patient age (<50, ≥50 years), tumor grade (1, 2, 3), and lymph node status (N0, N+). We found that HRDetect classification amongst chemotherapy-treated patients provided independent prognostic information favouring a better outcome in HRDetect-high cases compared to HRDetect-low cases, for IDFS (Hazard ratio, HR=0.42, 95% confidence interval, CI=0.20-0.87) and DRFI (HR=0.31, CI=0.13-0.76). Although not significant for OS (HR=0.46, CI=0.19-1.13), it implies a potential effect with longer follow-up time (60% of the chemotherapy-treated cases had ≤5 years follow-up).
Notably, within the HRDetect-high group, we observed no difference in patient outcomes (OS, IDFS, DRFI) between cases with confirmed BRCA1/BRCA2 loss and cases where it was not possible to confirm genetic/epigenetic abrogation of these genes (log-rank p=0.79, 0.51, 0.67, respectively, Figure 4F). Lending further credence, survival analysis excluding known BRCA1/BRCA2 cases showed that HRDetect-high classification remained significantly associated with improved IDFS in remaining patients (log-rank p=0.008, multivariable Cox regression HR=0.41, CI=0.19-0.91, p=0.03). BRCA1/BRCA2 abrogated status was next added as a covariate to the multivariable Cox regression. HRDetect classification persisted as a meaningful independent positive prognostic indicator for IDFS (HR=0.38, CI=0.17-0.85, p=0.02). This strengthens the argument that even in the absence of confirmation of the genetic/epigenetic aetiology, the mutational signature-based approach is capable of predicting potential clinical benefit for adjuvant chemotherapy. Critically, it expands the number of TNBC patients eligible for treatment strategies targeting DNA repair mechanisms such as PARP inhibitors22,27.
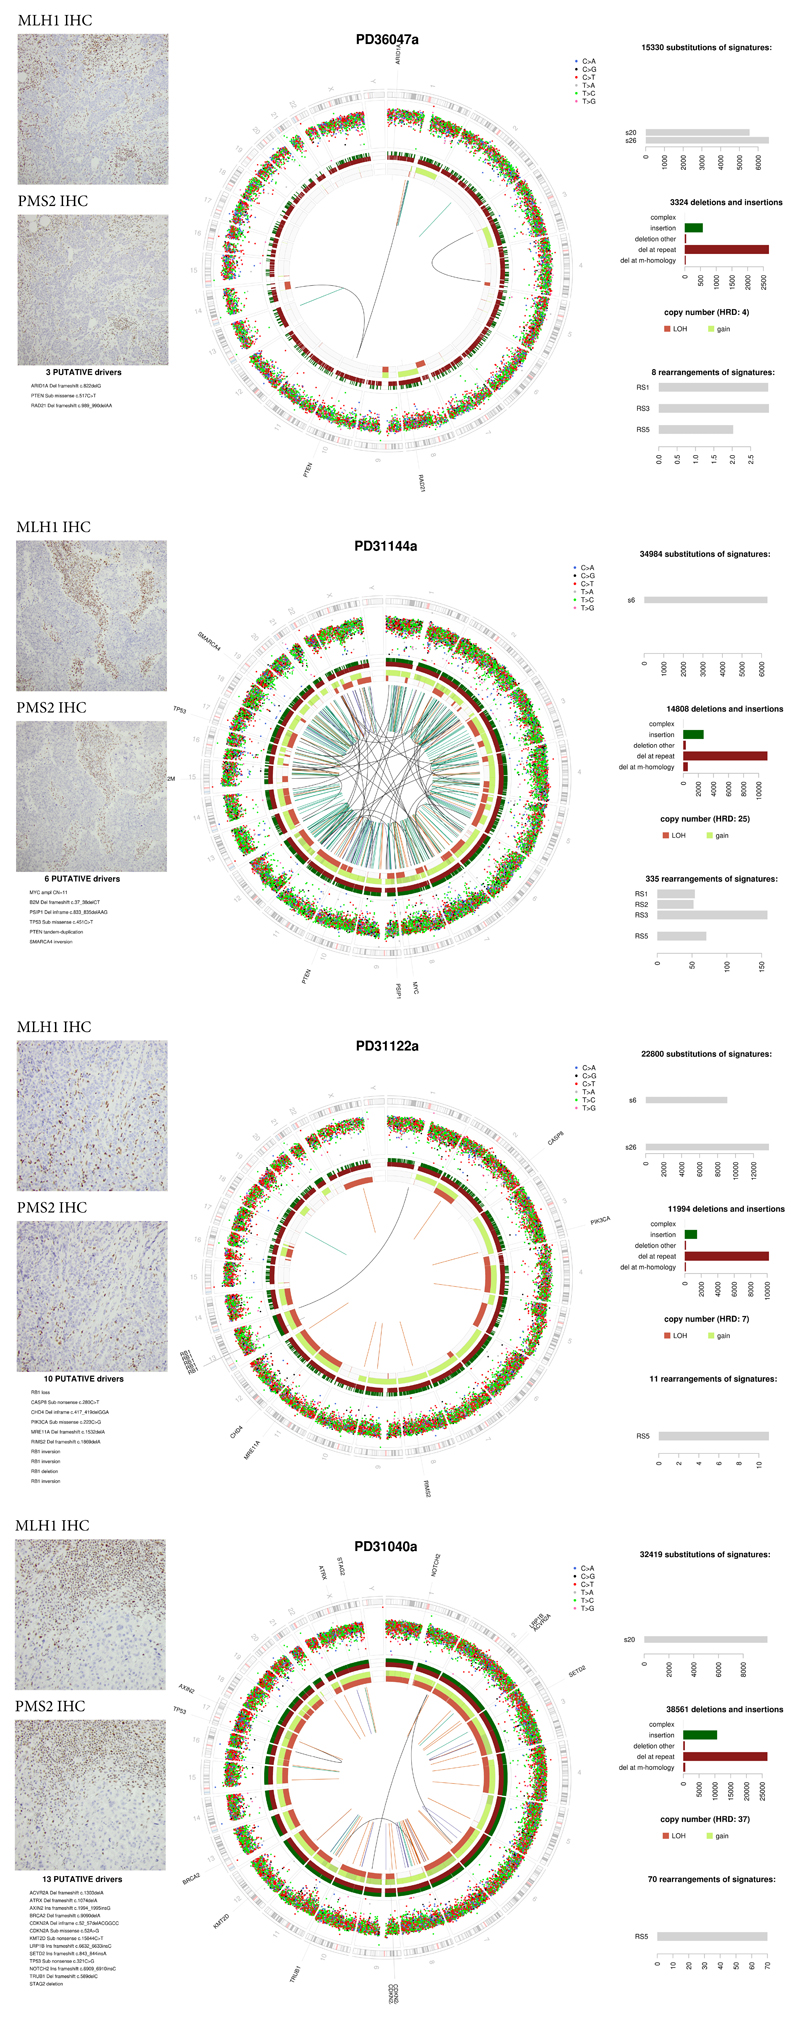
We note that four HRDetect-low patients (4.7%) had mismatch-repair deficient (MMRd) tumors23 (Extended Data 5). One occurred in association with HRD. Despite lack of genetic/epigenetic confirmation of MMR abrogation in these cases, independent analyses by protein immunohistochemistry (IHC) confirmed tumor-cell-specific loss of MLH1 and PMS2 expression in all cases (Extended Data 5). This is of particular interest, as checkpoint inhibitors have been FDA-approved for MMRd in the metastatic setting irrespective of tumor of origin, emphasising the therapeutically valuable incidental insights that can be obtained via a WGS-based approach.
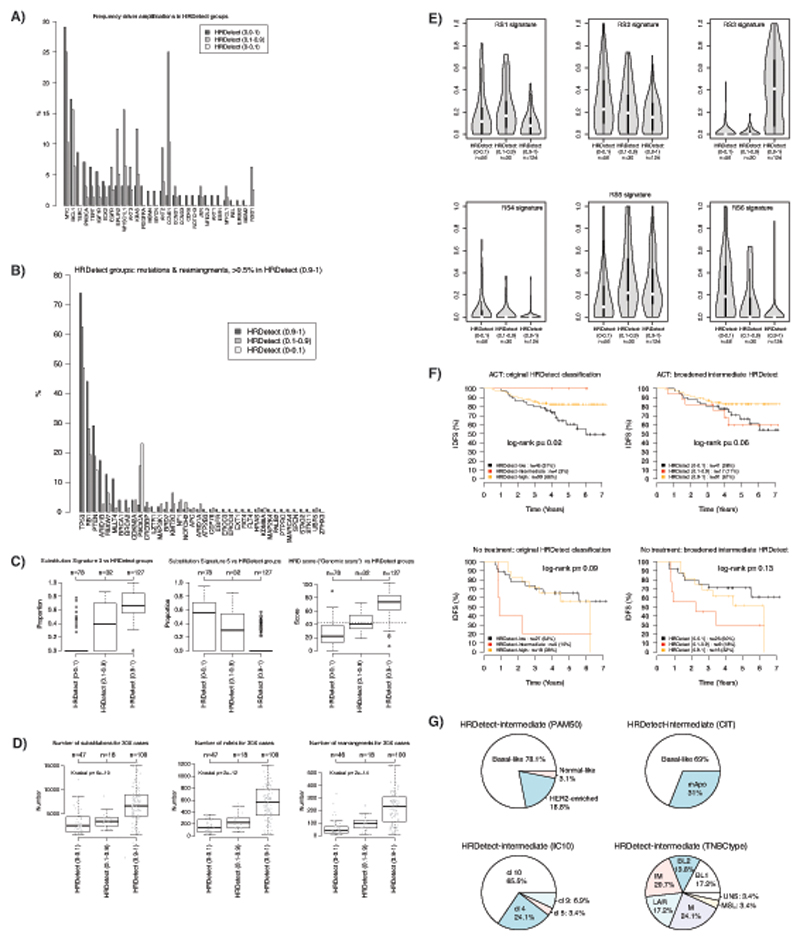
Finally, we explored the HRDetect-intermediate cohort (scores 0.2-0.7, n=13, 5.5%). We noted that 83.5% of HRDetect-high tumors had scores exceeding 0.99, and nearly all were BRCA1/BRCA2-null tumors. Additionally, based on mutational, indel and rearrangement signature patterns, cases with HRDetect-intermediate scores had different characteristics (Figure 2A).
We thus broadened the HRDetect-intermediate category to scores between 0.1-0.9 (n=32). Driver alterations and mutational signatures for the re-defined groups were examined in a new analysis (Extended Data 6). The broadened HRDetect-intermediate group had high prevalence of driver amplifications (75%, 24/32 cases) and harbored 47% of all CCNE1 amplifications. CCNE1 was the most enriched amplification constituting 25% of all amplifications in this new intermediate group. This is interesting, as CCNE1 is implicated in oncogene-induced replicative stress24,25. The intermediate category is also enriched for hypermutators of a rearrangement signature of long tandem-duplications (RS1) (where RS1 is predominant, exceeding 100 RS1 rearrangements)26. This pattern has been shown in prostate cancer26, and in ovarian27,28 cancer associated with CDK12 mutations. CCNE1 and CDK12 over-expression has been shown to deregulate cell cycle progression and disrupt DNA replication during S phase in vitro29,30. Recently, inhibitors of replication stress response such as Wee1 kinase inhibitors, ATR inhibitors and CHK1-inhibitors were developed targeting tumors with hallmarks of replication stress31 and CCNE1 overexpression was reported to sensitize TNBCs to these compounds32. When assessing outcomes, the broadened intermediate group showed poorer IDFS regardless of whether the patients received adjuvant chemotherapy or not (Extended Data 6). Therefore, the HRDetect-intermediate group is a subset of tumors that are difficult to distinguish using customary genomic scar approaches or individual substitution signatures but are important to recognize because their idiosyncratic tumor biology is a harbinger of poor outcome and may be differently targetable in terms of therapeutics.
This population-based study of TNBC in a routine diagnostic setting demonstrates what can be revealed by WGS. We surmise that it is valuable to identify HRDetect status whether high, intermediate or low: all groups are informative. Combinations of targeted-sequencing, MSI-assays and CNA approaches may be used increasingly. However, the value of holistic WGS as a single assay is reinforced when we consider three matters. First, patients may be mis-classified based on individual mutations. For example, we show that PIK3CA/AKT1/PTEN mutations identified through targeted sequencing are differentially enriched in HRDetect categories, with different survival likelihoods. Using mutations alone to stratify patients should thus be carefully considered in clinical trials. Second, it is possible to identify poor responders to current standard-of-care that cannot be detected by any other method. The HRDetect low category has many more patients than would be detected by binary PIK3CA/AKT1/PTEN targeted assays alone. These limited assays will also not identify the HRDetect-intermediate category, an interesting now-detectable subset in which to explore alternative therapeutic strategies. Third, limited sequencing assays will miss the substantial proportion of tumors with HRD signatures that do not have genetic/epigenetic drivers but are predicted to have good outcomes. In short, this study argues for WGS to improve TNBC patient stratification.
Online Methods
A reporting summary of methods and analysis steps are found in the “Life Sciences Reporting Summary” document.
Ethics approval and consent to participate
The SCAN-B study was approved by the Regional Ethical Review Board in Lund, Sweden (applicable registration numbers 2009/658, 2015/277, 2016/742, 2018/267, and 2019/01252 for this study). All patients provided written informed consent prior to enrolment.
Patient cohort
In Sweden, the definition of TNBC is a tumor with ≤10% of cells with IHC-staining for ER and PR (thus including tumors with 1-10% stained cells) and an IHC HER2-staining score < 2, or for patients with IHC 2+ a non-amplified ISH-status. During September 1 2010 to March 31 2015, 408 patients were diagnosed with TNBC (localized or advanced disease with specified treatment status) in the Skåne healthcare region in southern Sweden, Scandinavia, based on data from the Swedish national breast cancer quality registry (NKBC) (Figure 1). 340 of these patients were enrolled in the SCAN-B study5,33,34 (ClinicalTrials.gov ID NCT02306096), which is a prospective, observational, population-based cohort study, from which 254 with concurrent RNAseq were selected for extensive clinical review and WGS. Of reviewed cases, 153 (60%) patients were eligible for OS/IDFS survival analysis after standard of care adjuvant chemotherapy (FEC-based [combination of 5 fluorouracil, epirubicin, and cyclophosphamide] ± a taxane in 96% of cases) according to national guidelines. Of these (irrespective of clinical endpoint status), 41% had ≥5 years of follow-up, 25% 4-5 years, 31% 2-4 years, and 4% <2 years of follow-up. 148 of 153 patients (97%) were eligible for relapse analysis, of which 20% developed a relapse of some type (loco-regional or distant). Remaining cases received either neoadjuvant treatment, no adjuvant treatment (n=58), or were not treated in an adjuvant context (e.g. metastatic disease at diagnosis). As part of routine oncogenetic clinical screening, 49 of 254 recruited patients were previously screened for pathogenic germline variants in BRCA1 and BRCA2, with 12 positive findings (nine BRCA1- and three BRCA2-carriers). Patient cohort characteristics, enrolled SCAN-B patients, WGS analysed SCAN-B patients, and WGS analysed SCAN-B treatment subsets are described in Supplementary Table S2. Individual patient characteristics are provided in the Supplementary Data Table.
Tissue sampling, DNA and RNA extraction
Fresh tumor samples preserved in RNAlater (Qiagen, Hilden, Germany) were obtained in conjunction with routine clinical sampling by a diagnostic pathologist in regional pathology departments (see 5). RNA and DNA were extracted using the Qiagen Allprep extraction kit (Qiagen) as described33. DNA from whole blood was extracted by the Labmedicin Skåne Biobank.
Whole genome sequencing
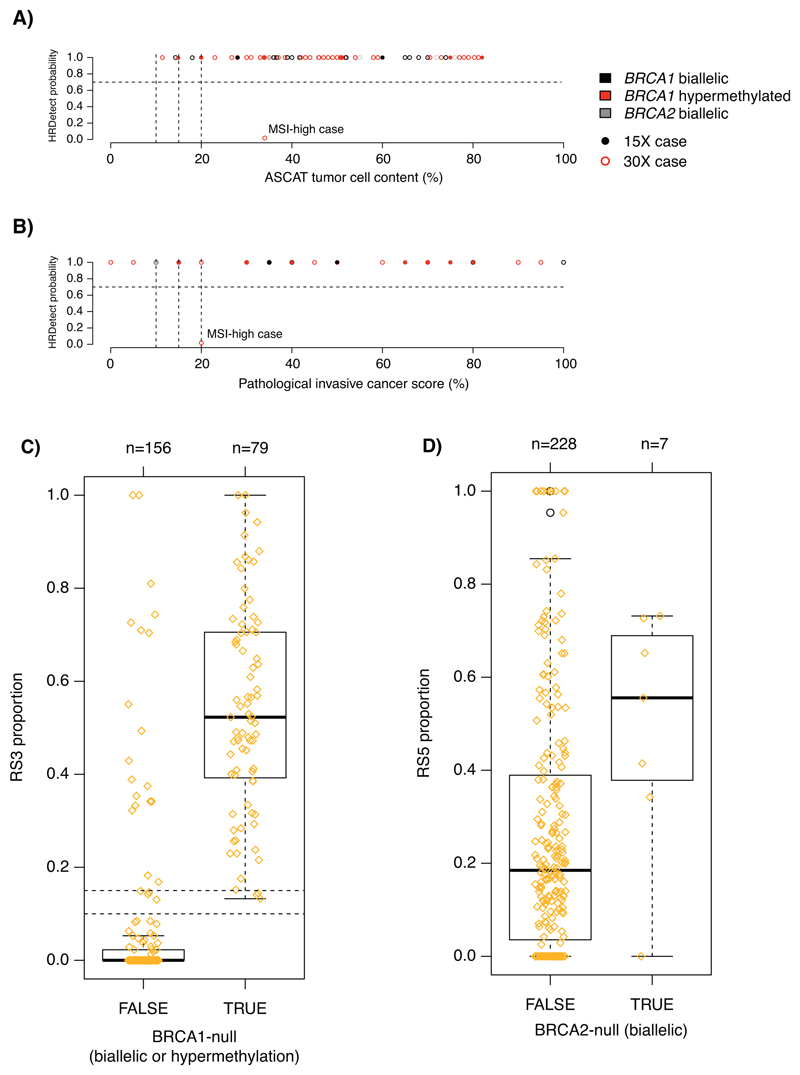
WGS of TNBCs were performed using Illumina sequencing technology to achieve average coverage of 15-30 fold depth as previously described in matched tumor-normal samples8. Each patient was sequenced only once. Patients that received adjuvant chemotherapy were primarily selected for 30X coverage, whereas untreated patients were sequenced to 15-fold depth. WGS data quality, basic data analysis, variant calling, Mobile Element analysis, and HRD classification by the HRDetect algorithm were performed as outlined8,9 (Supplementary Information). HRDetect classification was verified for known BRCA1/BRCA2-deficient cases versus tumor cellularity by WGS or pathology estimation for both 30-fold and 15-fold sequencing depth (Extended Data 7) to demonstrate that there was no systematic bias as a result of sequencing coverage or tumor cellularity.
DNA promoter methylation analysis
DNA promoter hypermethylation analysis of bisulfite treated DNA for specific CpG promoter sites in BRCA1, RAD51C, RAD51, and PALB2 was performed as described (Supplementary Information).
Gene expression analyses
Gene expression profiling of all TNBCs were performed using RNA sequencing as described33 and data has been reported elsewhere35. Molecular subtype classification according to PAM50 (by AIMS)11, IC1015, CIT12, and reported TNBC subtypes (TNBCtype)14,36, unsupervised clustering and machine-learning based supervised classification were performed as described (Supplementary Information).
Statistical analyses
Survival analyses were performed in R (ver 3.3.0) using the survival package with overall survival (OS), invasive disease-free survival (IDFS), or distant relapse-free interval (DRFI), as endpoints defined according with the STEEP criteria37 (see Supplementary Information for endpoint definitions and analysis exclusion criteria). Survival curves were compared using Kaplan-Meier estimates and the log-rank test. Hazard ratios were calculated through univariable or multivariable Cox regression using the coxph R function. Harrell’s C-index was computed using the dynpred R package. Statistical comparisons between groups were performed using Wilcoxon’s or Kruskal-Wallis tests for numerical values, or Chi-square test for ordinal values. All p-values reported from statistical tests are two-sided if not otherwise specified. Box-plot elements correspond to: i) center line = median, ii) box limits = upper and lower quartiles, iii) whiskers = 1.5x interquartile range
Extended Data
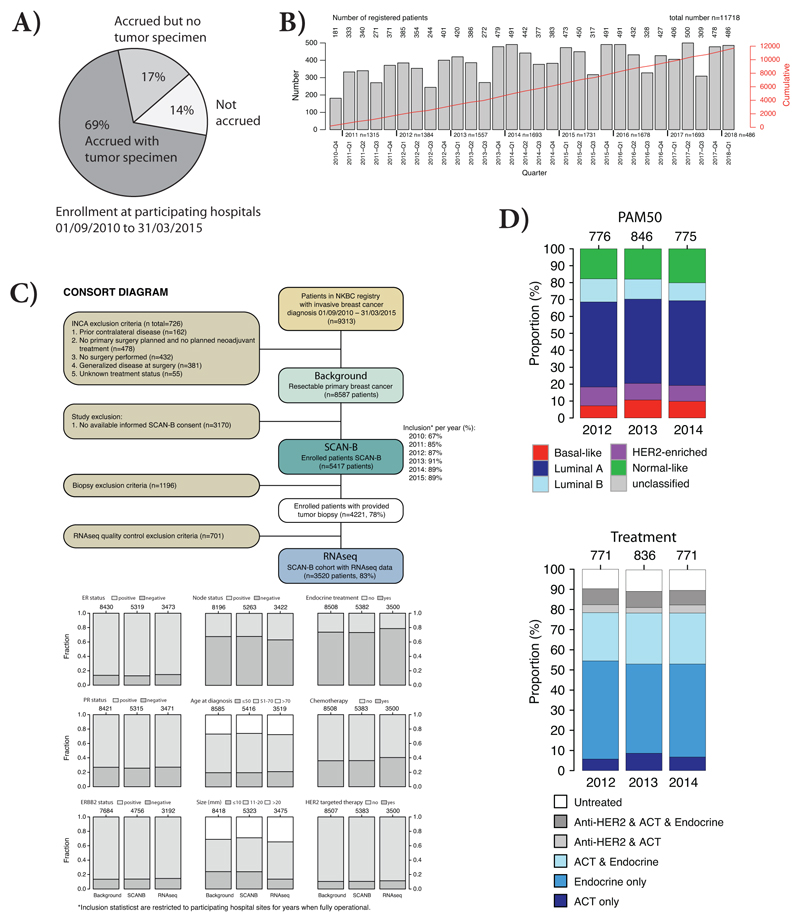
Extended Data Fig. 1. Sweden Cancerome Analysis Network - Breast (SCAN-B).
In the Skåne healthcare region (Region Skåne) four main hospitals are participating in the SCAN-B study: Lund, Malmö, Helsingborg, and Kristianstad. (A) SCAN-B overall enrolment rate at all participating hospitals, including Skåne healthcare region, during September 1 2010 to March 31 2015, corresponding to the same time period from which the TNBC cases in the current study were selected. The statistics are restricted to the seven hospitals were enrolment was operational from the start in 2010. (B) Overall accrual rate per quarter of a year (Q1-Q4) for the SCAN-B study since the start in 2010 Q4 up until 2018 Q1. Red line corresponds to the cumulative number of enrolled patients, reaching nearly 12000 in 2018 Q1. (C) Illustration of the population-based nature of the SCAN-B study for primary resectable breast cancer. Based on data from the national breast cancer quality registry in Sweden (NKBC), a background population of primary resectable breast cancers from the entire SCAN-B catchment region during September 1 2010 to March 31 2015 was identified (same time period from which the TNBC cases in the current study were selected), comprising of 8587 patients. Of these 8587 patients, 5417 were enrolled in SCAN-B, with 3520 patients having RNA sequencing data passing basic quality criteria. The lower panels demonstrate the clinicopathological characteristics of the different subgroups in the consort diagram, demonstrating the representativity of the end RNA sequencing cohort compared to all enrolled SCAN-B patients and the total patient population in the catchment region. To note, the RNA sequencing cohort has a slightly lower inclusion of smaller tumors, due to that the SCAN-B tissue sampling is performed by a pathologist after enough tissue has been secured for routine diagnostics. (D) Demonstration of the year to year representativity of molecular subtypes in breast cancer (PAM50, top panel) and administered treatments based on data from the NKBC (lower panel) for patients identified in D. The bars show patients in the RNA sequencing cohort from D, stratified by year of diagnosis (all patients diagnosed a particular year are included). PAM50 subtyping was performed using the AIMS method (Paquet et al.) (as for the TNBC cases in the current study) as this classifier is a single sample classifier that does not rely on a mean centering of gene expression data across a cohort (thus is not sensitive to e.g. potential bias in year to year inclusion). ACT: adjuvant chemotherapy.
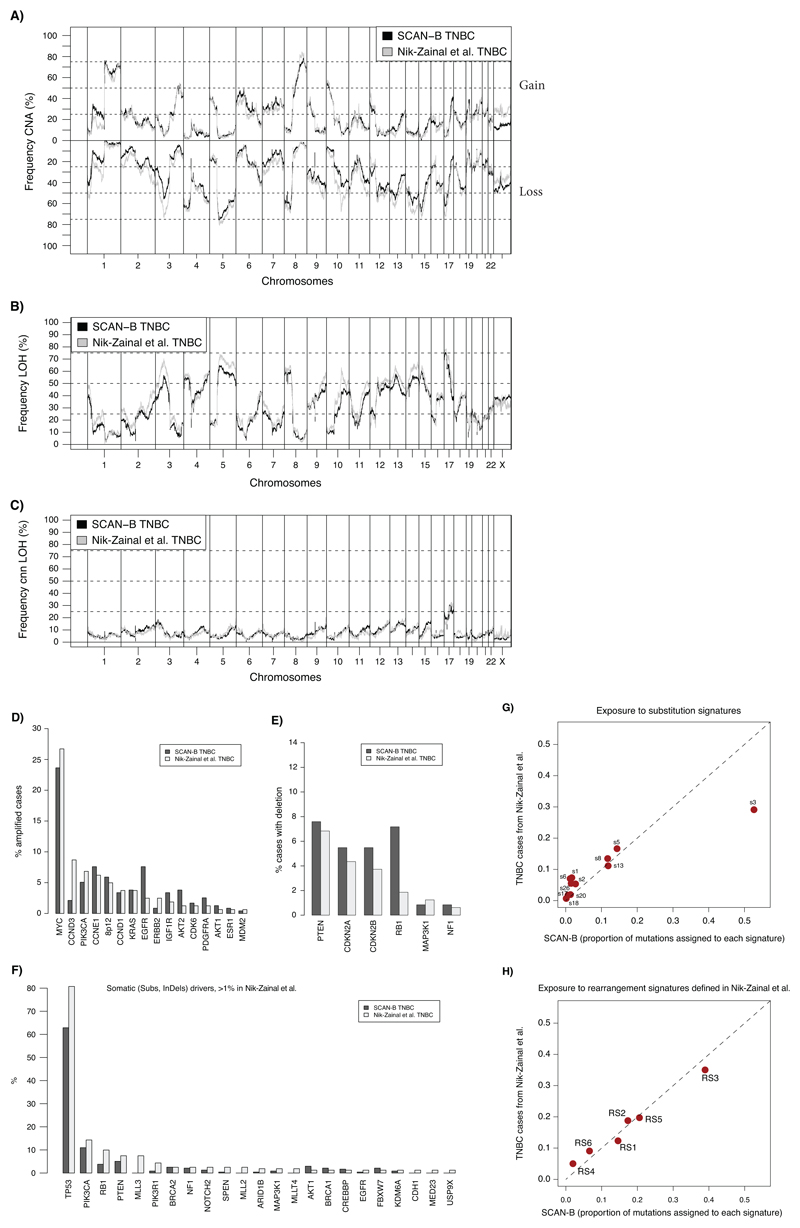
Extended Data Fig. 2. Similar genomic characteristics of SCAN-B TNBC cases compared to previously reported WGS analysed TNBCs.
(A) Comparison of copy number alterations (CNA) as defined by Nik-Zainal et al. (Nature, 2016) in the 237 SCAN-B TNBC cases versus 162 TNBC cases from Nik-Zainal et al. (one case of 163 cases in total not analyzed). Frequencies below 0 means frequency of copy number loss. (B) Comparison of frequency of LOH defined as in Nik-Zainal et al. between the same SCAN-B cases and Nik-Zainal et al. TNBC cases. (C) Comparison of copy number neutral (cnn) LOH defined as in Nik-Zainal et al. between the same set of samples. (D) Comparison of the frequency of driver gene amplifications between the same set of samples. Only amplifications matched in both cohorts are displayed. Driver gene list was obtained from Nik-Zainal et al. (E) Comparison of the frequency of homozygous deletions based on ASCAT data, as described in Nik-Zainal et al., between the same set of samples. Only deletions matched in both cohorts showed. (F) Frequency of somatic substitutions and indels for driver genes from Nik-Zainal et al. in the two cohorts. Only genes with >1% mutation frequency in Nik-Zainal is displayed. (G) Exposure to mutation substitution signatures as defined in Nik-Zainal et al. for the same set of samples. Line corresponds to a 1:1 relationship. (H) Exposure to rearrangement signatures (RS1-RS6) as defined in Nik-Zainal et al. for the same set of samples. Line corresponds to a 1:1 relationship.
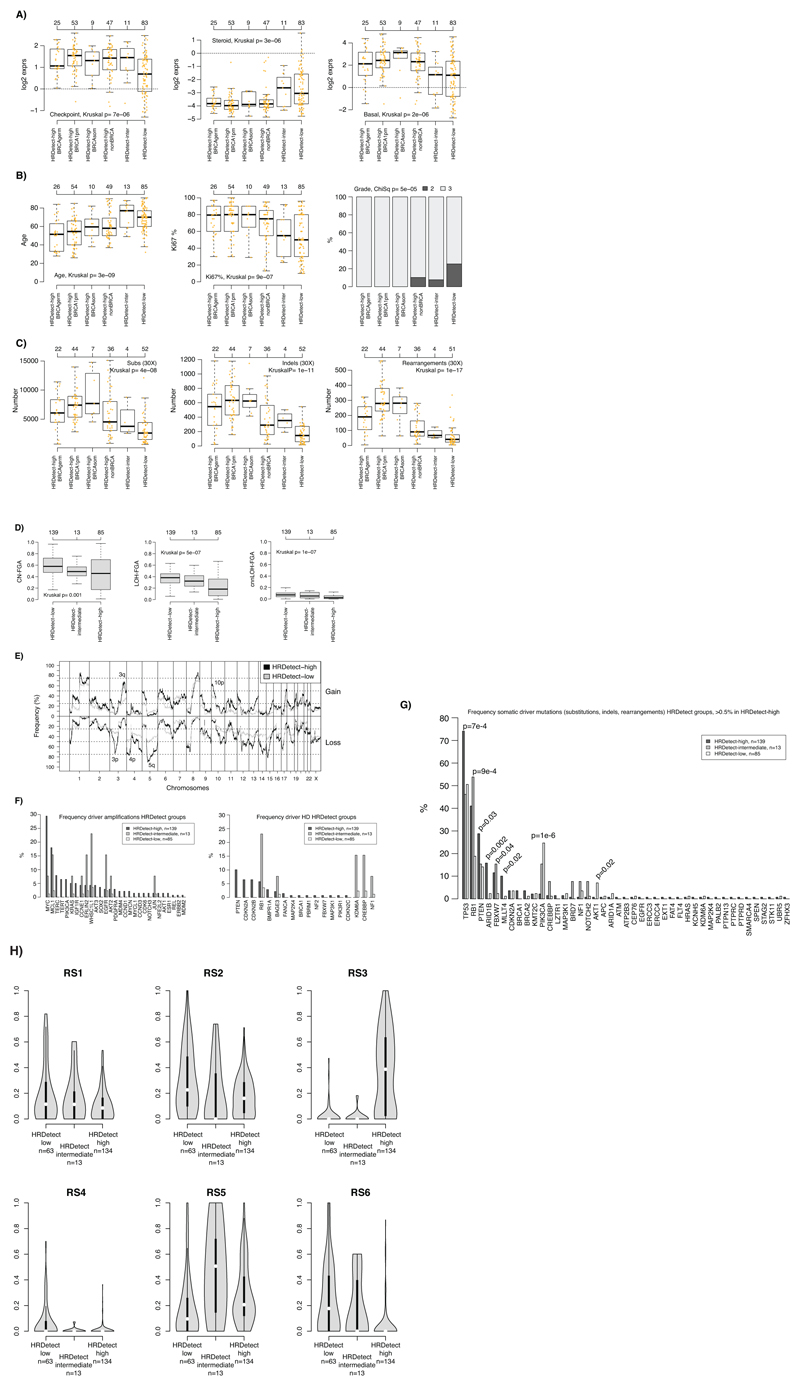
Extended Data Fig. 3. Clinicopathological and genomic characteristics of HRDetect groups.
(A) Expression of the checkpoint proliferation (left), steroid (center), and basal (right) metagene from Fredlund et al. (Breast Cancer Research, 2012) across HRDetect groups stratified by BRCA-status. HRDetect-inter: intermediate subgroup. BRCA1pm: BRCA1 promoter hypermethylated. BRCAgerm: BRCA1/2 germline carriers. BRCAsom: BRCA1/2 somatic cases. (B) Distribution of patient age (left), Ki67 staining (%, center) and clinical grade (right) across the same groups (same set of patient numbers). (C) Distribution of number of detected substitutions (left), indels (center), and rearrangements (right) for the same groups limited to cases with 30X sequence coverage. Two-sided p-values were calculated using Kruskal-Wallis test. (D) Frequency of the genome altered by copy number gain and loss (CN-FGA, left), LOH (LOH-FGA, center), and copy number neutral LOH (cnnLOH-FGA, right) defined as in Nik-Zainal et al. (Nature, 2016). (E) Frequency of copy number gain (above zero centerline) and copy number loss across the genome for HRDetect-high tumors versus HRDetect-low tumors defined as in Nik-Zainal et al. HRDetect-intermediate tumors omitted due to small numbers. (F) Frequency of amplification of driver genes from Nik-Zainal et al. (Nature, 2016) across HRDetect groups (left) and putative homozygous deletions (HD) called using ASCAT (right) as defined in Nik-Zainal et al. (G) Comparison of somatic mutation frequency (substitutions, indels & curated rearrangements) for driver genes from Nik-Zainal et al. versus HRDetect groups. Two-sided p-values calculated using the Chi-square test. (H) Violin plot of the distribution of Rearrangement Signature (RS) proportions per sample defined in Nik-Zainal et al. versus HRDetect groups for patients with at least 20 called rearrangements. Violin plot line elements correspond to: i) center line = median, ii) thick limits = upper and lower quartiles, iii) whiskers = 1.5x interquartile range.
In all box-plots the top axis shows the number of patients in each group. Box-plot elements correspond to: i) center line = median, ii) box limits = upper and lower quartiles, iii) whiskers = 1.5x interquartile range.
Kruskal: Kruskal-Wallis test. ChiSq: Chi-square test. All calculated p-values are two-sided.
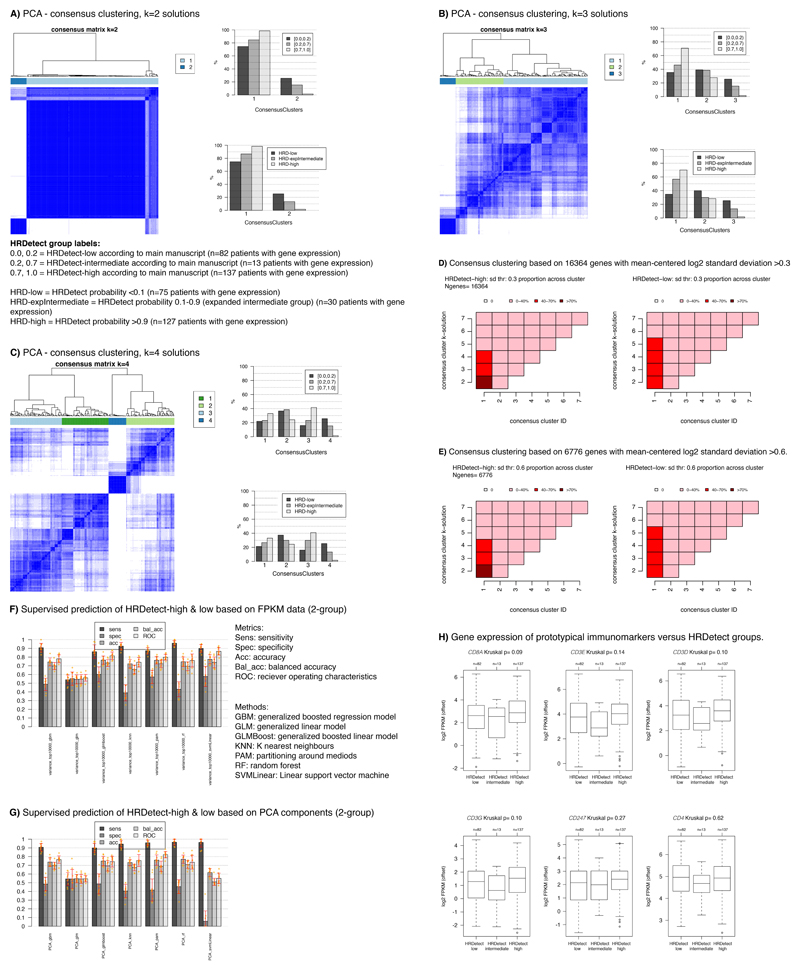
Extended Data Fig. 4. Unsupervised and supervised gene expression analyses versus HRDetect groups.
In all analyses, raw expression data (FPKM) was offset by addition of +0.1, followed by log2 transformation prior to further analyzes. Only RefSeq annotated genes were used. 232 cases with gene expression were included in all analyses. In all consensus cluster analyses, clustering was performed using pearson correlation and ward.d2 linkage, with 2000 repetitions using the R ConsensusClusterPlus package. For PCA analyses pItem=0.8, and pFeature=0.98 were used in the consensus cluster function. For non-PCA analyses corresponding values were 0.8 and 0.8. (A) Consensus clustering of PCA components from PCA analysis of 19102 genes using a 2-group solution. Heatmap to the left shows consensus, with blue color indicating that samples often cluster together across repetitions (rows = samples = columns). Bars to the right show proportion of HRDetect groups in different consensus clusters according to the legend. PCA captures all variation in the data in different principal componets, on which clustering was performed. (B) Same as in A, but for a 3-group consensus solution. (C) Same as in A but for a 4-group solution. (D) Consensus clustering performed on 16364 genes with mean-centered log2 data as input (i.e. no PCA). HRDetect-high implies probabilities >0.7, HRDetect-low probabilities <0.2, i.e. according to main manuscript definitions. Heatmaps show the percentage of samples for a group in respective consensus clusters (x-axis), across different cluster solutions = y-axis. E.g., for HRDetect-high cases (left heatmap) using a k=2 solution, >70% of these tumors are located in cluster 1, together with 40-70% of HRDetect-low samples (as seen in right heatmap). (E) Same visualization as in D, but now for 6776 genes with a standard deviation >0.6. (F) Supervised prediction of HRDetect-high (prob >0.7) and HRDetect-low (prob<0.2) according to main manuscript definitions based on the top 10000 varying RefSeq genes across all 232 cases using 7 different types of machine learning methods. FPKM values were offset by +0.1, log2 transformed. 10000 most varying genes across all relevant cases were selected. For each method, cases were divided into training (70% of cohort) and test (30%), balanced for age, lymph node status, and grade. HRDetect-intermediate cases were omitted. Training and test cohorts were individually mean-centered. ROC was used as optimization metric, 4-fold cross validation repeated 10 times for training using the training cohort. The optimized model was applied to the test set. The entire procedure was repeated 10 times through an outer loop, with different division of samples in the training and test set in each loop to assure that sample selection was not skewing results. This generated for each model e.g. 10 ROC metrics as each outer loop iteration created a (potentially) new model. The summarized results are shown to the left. For all methods bar height corresponds to the average metric across the 10 iterations with one standard deviation range shown in red and individual values in orange. All analyses were performed using the Caret R-package using the classifier names indicated in the plot and with the tuneLength variable set to 10. (G) (G) The same analysis as in panel F, but instead using PCA components as input data for machine learning. PCA components were derived originally in panel A to capture all variation in the data and now used as input for supervised prediction using the same setup and parameters as in F. (H) Gene expression (log2(FPKM+offset)) of prototypical immunomarkers versus HRDetect groups. Two-sided P-values calculated using Kruskal-Wallis test.
sd=standard deviation. In all box-plots the top axis shows the number of patients in each group. Box-plot elements correspond to: i) center line = median, ii) box limits = upper and lower quartiles, iii) whiskers = 1.5x interquartile range.
Extended Data Fig. 5. MMRd SCAN-B tumors.
To note, unlike in colorectal cancer, mismatch repair deficient (MMRd) tumors are also able to carry signs of chromosomal or genomic instability as seen in PD31144a (BRCA1 promoter hypermethylated case) and PD31040a. Thus the mutational processes driving these two features are not mutually exclusive in breast cancer.
Extended Data Fig. 6. Characteristics of expanded HRDetect-intermediate cases.
(A) Comparison of driver amplifications from Nik-Zainal et al. (Nature, 2016) between HRDetect groups defined from a broadened intermediate group (0.1-0.9 in HRDetect score). HRDetect (0.9-1) = 127 cases; HRDetect (0.1-0.9) = 32 cases; HRDetect (0-0.1) = 78 cases. (B) Comparison of somatic driver mutations (substitutions, indels) for driver genes defined in Nik-Zainal et al. (Nature, 2016). For the specific set of genes curated for rearrangements in Nik-Zainal et al. (e.g. RB1 and PTEN) these are included as events in the analysis (i.e., for instance RB1 includes both mutations and rearrangements). (C) Distribution of mutational signature exposure for signature s3 (e.3) and 5 (e.5) defined in Nik-Zainal et al. (Nature, 2016), and a HRD score defined by Telli et al. (Clinical Cancer Research, 2016) (originally based on SNP arrays, “genomic scars”) across HRDetect subgroups defined by a broadened intermediate group. In all box-plots the top axis shows the number of patients in each group. Box-plot elements correspond to: i) center line = median, ii) box limits = upper and lower quartiles, iii) whiskers = 1.5x interquartile range. (D) Distribution of total number of detected substitutions, indels, and rearrangements for 30X sequenced cases across HRDetect subgroups defined by a broadened intermediate group. In all box-plots the top axis shows the number of patients in each group. Box-plot elements correspond to: i) center line = median, ii) box limits = upper and lower quartiles, iii) whiskers = 1.5x interquartile range. Two-sided p-values were calculated using Kruskal-Wallis test. (E) Distribution of exposure (displayed as a violin plot) to the six rearrangement signatures defined in Nik-Zainal et al. (Nature, 2016) versus HRDetect subgroups defined by a broadened intermediate group. Only cases with at least 20 rearrangements are included in the plots. Violin plot line elements correspond to: i) center line = median, ii) thick limits = upper and lower quartiles, iii) whiskers = 1.5x interquartile range. (F) Outcome analysis for original HRDetect-groups (left panels) and new division with a broadened HRDetect-intermediate group (right panels) stratified by treatment status using invasive disease-free survival (IDFS) as clinical endpoint. Top two panels show IDFS for patients receiving adjuvant chemotherapy (ACT) and bottom two panels show IDFS for untreated patients according to division by HRDetect score. Log-rank p-values are two-sided. (G) Distribution of different molecular subtypes in the broadened HRDetect-intermediate group based on 232 cases with gene expression data. mApo: molecular apocrine, BL1, basal-like 1: BL 2, basal-like 2: IM, immunomodulatory: M, mesenchymal: MSL, mesenchymal stem-like: LAR, luminal androgen receptor : UNS, uncertain.
Extended Data Fig. 7. Tumor cellularity versus HRDetect probability scores and characteristic rearrangement signature proportions for BRCA1-null (biallelic alteration or promoter hypermethylation) and BRCA2-null (biallelic alterations) tumors.
(A) HRDetect probabilities versus WGS estimated tumor cell content based on the ASCAT algorithm (n=84 cases). (B) HRDetect probabilities versus a pathological assessment of the invasive cancer proportion from a section adjacent to the extracted tumor piece (n=67 cases). Tumors are further stratified by their intended sequencing depth (30X or 15X) in panels A-B. (C) Proportions of the Rearrangement Signature 3 (Nik-Zainal et al. Nature 2016) for BRCA1-null cases. (D) Proportions of the Rearrangement Signature 5 for BRCA2-null cases. One outlier exists, corresponding to a tumor with concurrent BRCA1 hypermethylation that has a genetic phenotype very similar to a BRCA1-null tumor rather than a BRCA2-null tumor, as shown in panel.
In all box-plots the top axis shows the number of patients in each group. Box-plot elements correspond to: i) center line = median, ii) box limits = upper and lower quartiles, iii) whiskers = 1.5x interquartile range.
Supplementary Material
Acknowledgements
The authors would like to acknowledge patients and clinicians participating in the SCAN-B study, the staff at the central SCAN-B laboratory at the Division of Oncology and Pathology, Lund University, the Swedish national breast cancer quality registry (NKBC), RBC Syd, the South Sweden Breast Cancer Group (SSBCG), the CASM IT and Wellcome Sanger Institute sequencing team for support, Dr Rebecca Harris for administrative, technical and coordination support, Kristina Lövgren and Eva Rambech for technical assistance with MMRd cases, and Pär-Ola Bendahl for statistical comments.
Funding
Financial support for this study was provided by the Swedish Cancer Society (CAN 2016/659, CAN 2018/685, and Senior Investigator Award SIA190013), the Mrs Berta Kamprad Foundation (FBKS-2018-3-166 and FBKS-2018-4-146), the Crafoord Foundation (20180543), the Swedish Research Council, the Lund-Lausanne L2-Bridge/Biltema Foundation (F 2016/1330), the Mats Paulsson Foundation (IACD 2017), the Gustav V:s Jubilee Foundation (174271), Governmental Funding of Clinical Research within the National Health Service (ALF) (2018/40612). Whole genome sequencing and analysis was funded by a Wellcome Trust Intermediate Clinical Fellowship (WT100183MA) and a CRUK Advanced Clinician Scientist Award (C60100/A23916) and a CRUK Grand Challenge Award (C60100/A25274).
Footnotes
Data availability statement
Somatic mutational data is available here (https://data.mendeley.com/datasets/2mn4ctdpxp/1).
Raw sequence data may be obtained by contacting Swedish corresponding authors with a request that is compliant with Swedish regulations on data protection, ethical permissions and patient consent.
Competing Interests
D. Glodzik, H.R. Davies and S. Nik-Zainal are inventors on a patent encompassing the code and intellectual principle of the HRDetect algorithm. The remaining authors declare that they have no competing interests.
Authors Contributions
Conception and design: J.S., S.N.-Z., A.B.
Collection and assembly of data: J.S., S.N.-Z., D.G., A.B., C.R., J.V.-C., J.H., C.H.
Provision of study material or patients: C.L., N.L., L.R., A.B., M.M., A.E., L.H.S., C.H., H.E.
Data analysis and interpretation: J.S., D.G., S.N.-Z., H.R.D., T.D.A., A.D., A.K.
Financial support: S.N.-Z., A.B., J.S.
Administrative support: J.S., S.N.-Z., D.G., J.V.-C., C.H., J.H.
Manuscript writing: All authors
Final approval of manuscript: All authors
Agree to be accountable for all aspects of the work: All authors
References
- 1.Bentley DR, et al. Accurate whole human genome sequencing using reversible terminator chemistry. Nature. 2008;456:53–59. doi: 10.1038/nature07517. [DOI] [PMC free article] [PubMed] [Google Scholar]
- 2.Nik-Zainal S, et al. Mutational processes molding the genomes of 21 breast cancers. Cell. 2012;149:979–993. doi: 10.1016/j.cell.2012.04.024. S0092-8674(12)00528-4 [pii] [DOI] [PMC free article] [PubMed] [Google Scholar]
- 3.Nik-Zainal S, et al. The life history of 21 breast cancers. Cell. 2012;149:994–1007. doi: 10.1016/j.cell.2012.04.023. S0092-8674(12)00527-2 [pii] [DOI] [PMC free article] [PubMed] [Google Scholar]
- 4.Coe BP, et al. Resolving the resolution of array CGH. Genomics. 2007;89:647–653. doi: 10.1016/j.ygeno.2006.12.012. [DOI] [PubMed] [Google Scholar]
- 5.Ryden L, et al. Minimizing inequality in access to precision medicine in breast cancer by real-time population-based molecular analysis in the SCAN-B initiative. Br J Surg. 2018;105:e158–e168. doi: 10.1002/bjs.10741. [DOI] [PMC free article] [PubMed] [Google Scholar]
- 6.Haffty BG, et al. Locoregional relapse and distant metastasis in conservatively managed triple negative early-stage breast cancer. J Clin Oncol. 2006;24:5652–5657. doi: 10.1200/JCO.2006.06.5664. [DOI] [PubMed] [Google Scholar]
- 7.Liedtke C, et al. Response to neoadjuvant therapy and long-term survival in patients with triple-negative breast cancer. J Clin Oncol. 2008;26:1275–1281. doi: 10.1200/JCO.2007.14.4147. [DOI] [PubMed] [Google Scholar]
- 8.Nik-Zainal S, et al. Landscape of somatic mutations in 560 breast cancer whole-genome sequences. Nature. 2016;534:47–54. doi: 10.1038/nature17676. [DOI] [PMC free article] [PubMed] [Google Scholar]
- 9.Davies H, et al. HRDetect is a predictor of BRCA1 and BRCA2 deficiency based on mutational signatures. Nature medicine. 2017;23:517–525. doi: 10.1038/nm.4292. [DOI] [PMC free article] [PubMed] [Google Scholar]
- 10.Telli ML, et al. Homologous Recombination Deficiency (HRD) Score Predicts Response to Platinum-Containing Neoadjuvant Chemotherapy in Patients with Triple-Negative Breast Cancer. Clin Cancer Res. 2016;22:3764–3773. doi: 10.1158/1078-0432.CCR-15-2477. [DOI] [PMC free article] [PubMed] [Google Scholar]
- 11.Paquet ER, Hallett MT. Absolute Assignment of Breast Cancer Intrinsic Molecular Subtype. Journal of the National Cancer Institute. 2015;107 doi: 10.1093/jnci/dju357. [DOI] [PubMed] [Google Scholar]
- 12.Guedj M, et al. A refined molecular taxonomy of breast cancer. Oncogene. 2012;31:1196–1206. doi: 10.1038/onc.2011.301. [DOI] [PMC free article] [PubMed] [Google Scholar]
- 13.Curtis C, et al. The genomic and transcriptomic architecture of 2,000 breast tumours reveals novel subgroups. Nature. 2012;486:346–352. doi: 10.1038/nature10983. [DOI] [PMC free article] [PubMed] [Google Scholar]
- 14.Lehmann BD, et al. Identification of human triple-negative breast cancer subtypes and preclinical models for selection of targeted therapies. J Clin Invest. 2011;121:2750–2767. doi: 10.1172/JCI45014. [DOI] [PMC free article] [PubMed] [Google Scholar]
- 15.Ali HR, et al. Genome-driven integrated classification of breast cancer validated in over 7,500 samples. Genome biology. 2014;15:431. doi: 10.1186/s13059-014-0431-1. [DOI] [PMC free article] [PubMed] [Google Scholar]
- 16.Polak P, et al. A mutational signature reveals alterations underlying deficient homologous recombination repair in breast cancer. Nature genetics. 2017 doi: 10.1038/ng.3934. [DOI] [PMC free article] [PubMed] [Google Scholar]
- 17.Evans DGR, et al. A Dominantly Inherited 5' UTR Variant Causing Methylation-Associated Silencing of BRCA1 as a Cause of Breast and Ovarian Cancer. American journal of human genetics. 2018;103:213–220. doi: 10.1016/j.ajhg.2018.07.002. [DOI] [PMC free article] [PubMed] [Google Scholar]
- 18.Park JY, et al. Breast cancer-associated missense mutants of the PALB2 WD40 domain, which directly binds RAD51C, RAD51 and BRCA2, disrupt DNA repair. Oncogene. 2014;33:4803–4812. doi: 10.1038/onc.2013.421. [DOI] [PMC free article] [PubMed] [Google Scholar]
- 19.Park JY, Zhang F, Andreassen PR. PALB2: the hub of a network of tumor suppressors involved in DNA damage responses. Biochim Biophys Acta. 2014;1846:263–275. doi: 10.1016/j.bbcan.2014.06.003. [DOI] [PMC free article] [PubMed] [Google Scholar]
- 20.Qian Y, et al. Identification of pathogenic retrotransposon insertions in cancer predisposition genes. Cancer Genet. 2017;216-217:159–169. doi: 10.1016/j.cancergen.2017.08.002. [DOI] [PubMed] [Google Scholar]
- 21.Nilsson MP, et al. Germline mutations in BRCA1 and BRCA2 incidentally revealed in a biobank research study: experiences from re-contacting mutation carriers and relatives. J Community Genet. 2017 doi: 10.1007/s12687-017-0341-5. [DOI] [PMC free article] [PubMed] [Google Scholar]
- 22.Sharma P. Biology and Management of Patients With Triple-Negative Breast Cancer. The oncologist. 2016;21:1050–1062. doi: 10.1634/theoncologist.2016-0067. [DOI] [PMC free article] [PubMed] [Google Scholar]
- 23.Davies H, et al. Whole-Genome Sequencing Reveals Breast Cancers with Mismatch Repair Deficiency. Cancer research. 2017;77:4755–4762. doi: 10.1158/0008-5472.CAN-17-1083. [DOI] [PubMed] [Google Scholar]
- 24.Mazouzi A, Velimezi G, Loizou JI. DNA replication stress: causes, resolution and disease. Experimental cell research. 2014;329:85–93. doi: 10.1016/j.yexcr.2014.09.030. [DOI] [PubMed] [Google Scholar]
- 25.Halazonetis TD, Gorgoulis VG, Bartek J. An oncogene-induced DNA damage model for cancer development. Science (New York, N.Y. 2008;319:1352–1355. doi: 10.1126/science.1140735. [DOI] [PubMed] [Google Scholar]
- 26.Glodzik D, et al. A somatic-mutational process recurrently duplicates germline susceptibility loci and tissue-specific super-enhancers in breast cancers. Nature genetics. 2017;49:341–348. doi: 10.1038/ng.3771. [DOI] [PMC free article] [PubMed] [Google Scholar]
- 27.Popova T, et al. Ovarian Cancers Harboring Inactivating Mutations in CDK12 Display a Distinct Genomic Instability Pattern Characterized by Large Tandem Duplications. Cancer research. 2016;76:1882–1891. doi: 10.1158/0008-5472.CAN-15-2128. [DOI] [PubMed] [Google Scholar]
- 28.Hillman RT, Chisholm GB, Lu KH, Futreal PA. Genomic Rearrangement Signatures and Clinical Outcomes in High-Grade Serous Ovarian Cancer. Journal of the National Cancer Institute. 2018;110 doi: 10.1093/jnci/djx176. [DOI] [PMC free article] [PubMed] [Google Scholar]
- 29.Bartkova J, et al. Oncogene-induced senescence is part of the tumorigenesis barrier imposed by DNA damage checkpoints. Nature. 2006;444:633–637. doi: 10.1038/nature05268. [DOI] [PubMed] [Google Scholar]
- 30.Di Micco R, et al. Oncogene-induced senescence is a DNA damage response triggered by DNA hyper-replication. Nature. 2006;444:638–642. doi: 10.1038/nature05327. [DOI] [PubMed] [Google Scholar]
- 31.Forment JV, O'Connor MJ. Targeting the replication stress response in cancer. Pharmacol Ther. 2018;188:155–167. doi: 10.1016/j.pharmthera.2018.03.005. [DOI] [PubMed] [Google Scholar]
- 32.Chen X, et al. Cyclin E Overexpression Sensitizes Triple-Negative Breast Cancer to Wee1 Kinase Inhibition. Clin Cancer Res. 2018 doi: 10.1158/1078-0432.CCR-18-1446. [DOI] [PMC free article] [PubMed] [Google Scholar]
- 33.Saal LH, et al. The Sweden Cancerome Analysis Network - Breast (SCAN-B) Initiative: a large-scale multicenter infrastructure towards implementation of breast cancer genomic analyses in the clinical routine. Genome Med. 2015;7:20. doi: 10.1186/s13073-015-0131-9. [DOI] [PMC free article] [PubMed] [Google Scholar]
- 34.Colella S, et al. QuantiSNP: an Objective Bayes Hidden-Markov Model to detect and accurately map copy number variation using SNP genotyping data. Nucleic acids research. 2007;35:2013–2025. doi: 10.1093/nar/gkm076. [DOI] [PMC free article] [PubMed] [Google Scholar]
- 35.Brueffer C, et al. Clinical Value of RNA Sequencing–Based Classifiers for Prediction of the Five Conventional Breast Cancer Biomarkers: A Report From the Population-Based Multicenter Sweden Cancerome Analysis Network—Breast Initiative. JCO Precision Oncology. 2018:1–18. doi: 10.1200/po.17.00135. [DOI] [PMC free article] [PubMed] [Google Scholar]
- 36.Chen X, et al. TNBCtype: A Subtyping Tool for Triple-Negative Breast Cancer. Cancer Inform. 2012;11:147–156. doi: 10.4137/CIN.S9983. [DOI] [PMC free article] [PubMed] [Google Scholar]
- 37.Hudis CA, et al. Proposal for standardized definitions for efficacy end points in adjuvant breast cancer trials: the STEEP system. J Clin Oncol. 2007;25:2127–2132. doi: 10.1200/JCO.2006.10.3523. [DOI] [PubMed] [Google Scholar]
Associated Data
This section collects any data citations, data availability statements, or supplementary materials included in this article.


