

Summary
In some plant–virus interactions plants show a sign of healing from virus infection, a phenomenon called symptom recovery. It is assumed that the meristem exclusion of the virus is essential to this process. The discovery of RNA silencing provided a possible mechanism to explain meristem exclusion and recovery. Here we show evidence that silencing is not the reason for meristem exclusion in Nicotiana benthamiana plants infected with Cymbidium ringspot virus (CymRSV). Transcriptome analysis followed by in situ hybridization shed light on the changes in gene expression in the shoot apical meristem (SAM) on virus infection. We observed the down‐regulation of meristem‐specific genes, including WUSCHEL (WUS). However, WUS was not down‐regulated in the SAM of plants infected with meristem‐invading viruses such as turnip vein‐clearing virus (TVCV) and cucumber mosaic virus (CMV). Moreover, there is no connection between loss of meristem function and fast shoot necrosis since TVCV necrotized the shoot while CMV did not. Our findings suggest that the observed transcriptional changes on virus infection in the shoot are key factors in tip necrosis and symptom recovery. We observed a lack of GLYCERALDEHYDE 3-PHOSPHATE DEHYDROGENASE (GAPDH) expression in tissues around the meristem, which likely stops virus replication and spread into the meristem.
Keywords: CymRSV, Nicotiana benthamiana, shoot apical meristem, silencing, transcriptome
The outcome of virus infections of plants may be symptom recovery, which is characterized by the emergence of new leaves showing attenuated or no symptoms. Symptom recovery is often associated with the exclusion of viruses from plant shoot apical meristems (SAM), but the underlying mechanisms of virus exclusion are still poorly understood. Recovery of plants from virus‐induced symptoms is one of the oldest mysteries in plant virology. The earliest report describing a plant defence mechanism was published almost 100 years ago, describing plant recovery from virus infection (Wingard, 1928). Infection of tobacco plants with tobacco ringspot nepovirus (ToRSV) induced very strong necrotic symptoms in the initially infected leaves, but later these plants recovered from the disease. The upper newly developed leaves looked healthy and were resistant to secondary infection of the same virus. At that time there was no explanation for this very interesting phenomenon. After the discovery of RNA silencing as a defence mechanism against invading molecular parasites, it was shown that RNA silencing plays a key role in the development of plant recovery from virus disease (Ghoshal and Sanfaçon, 2015; Ratcliff et al., 1997; Silhavy et al., 2002).
RNA silencing is a conserved eukaryotic pathway involved in almost all cellular processes, such as development, stress responses and genome defence. RNA silencing relies on the 21–24 nucleotide (nt) short interfering RNAs (siRNAs) and microRNAs (miRNAs), the hallmark molecules of silencing (Brodersen and Voinnet, 2006; Hamilton and Baulcombe, 1999; Llave, 2010; Parent et al., 2012). These siRNAs have been shown to be mobile and to play an important role in the cell‐to‐cell and long‐distance (systemic) spreading of silencing (Dunoyer et al., 2005; Havelda et al., 2005; Schwach et al., 2005). Viruses can suppress RNA silencing in different ways, from interfering with its initiation to causing an arrest in the assembly of a functional RNA‐induced silencing complex (RISC) (Burgyán and Havelda, 2011; Csorba et al., 2015). One of the best characterized viral‐encoded silencing suppressor proteins (VSR) is the p19 protein of Cymbidium ringspot virus (CymRSV), which inhibits silencing by binding the siRNAs in a size‐specific manner (Silhavy et al., 2002; Vargason et al., 2003; Ye et al., 2003) thereby inhibiting their incorporation into the RISC (Havelda et al., 2003; Lakatos et al., 2004).
The essential role of RNA silencing in the recovery phenotype was further demonstrated using mutant virus infection in which VSR was inactivated (Silhavy et al., 2002; Szittya et al., 2002). In these reports it was shown that the VSR‐inactivated virus initially caused severe symptoms, which gradually disappeared in the newly developed upper leaves. The viral RNA content of these leaves decreased below the detection level and they showed resistance against virus‐containing homologous sequences (Havelda et al., 2003; Silhavy et al., 2002; Szittya et al., 2002). It is assumed that the virus causing the initial symptoms had activated viral RNA silencing. This inhibited the spread of virus infection into the upper leaves and caused them to be specifically immune to secondary infection of the same virus (Baulcombe, 2004; Szittya et al., 2002). However, a recent report demonstrated the complexity of the plant antiviral response, showing that leaves recovered from viral symptoms contain infectious, replicating virus, but exhibit a loss of VSR activity as a result of overloading with a high amount of antiviral secondary siRNAs and this affected the viral symptoms (Kørner et al., 2018).
Moreover, it turned out that although RNA silencing explains plant recovery from virus infection in specific virus–host combinations (Baulcombe, 2004; Burgyán and Havelda, 2011; Havelda et al., 2003; Ratcliff et al., 1997; Szittya et al., 2002), this is not true for recovery in all plant–virus interactions. For example, the originally described recovery of ToRSV‐infected tobacco plants relies on the translational repression of the viral RNAs: it has been shown that Nicotiana benthamiana plants infected by ToRSV induced necrotic symptoms at the early stage of infection, which disappeared at a later stage although the level of viral RNA was not reduced in symptomless leaves (Ghoshal and Sanfaçon, 2015; Jovel et al., 2007).
Plant recovery is often also associated with the exclusion of viruses from the plant SAM, which is one of the main plant meristems. The stem cells in these niches are maintained by a regulatory network. One of the main components of this network in the SAM is the homeodomain transcription factor WUSCHEL (WUS) and the CLAVATA (CLV) ligand‐receptor system (Brand et al., 2000; Fletcher et al., 1999; Schoof et al., 2000). WUS is expressed in the organizing centre, the middle of the central zone of the meristem, and is required to induce and maintain the overlaying stem cells in an undifferentiated state (Mayer et al., 1998). The loss of WUS function results in meristem collapse and differentiation caused by the lack of stem cell maintenance (Laux et al., 1996). Another homeodomain transcription factor that acts in parallel with WUS in maintaining the meristem is SHOOT MERISTEMLESS (STM) (Long et al., 1996). STM is expressed uniformly throughout the meristem and it stimulates cytokinin biosynthesis that inhibits differentiation (Andersen et al., 2008; Yanai et al., 2005).
There are hints and suggestions that virus exclusion from the meristem has a role in plant recovery and meristem exclusion has been attributed to RNA silencing mechanisms (Schwach et al., 2005). A tobacco rattle virus (TRV) mutant deficient in the 16K protein, a weak suppressor of silencing, caused enhanced symptomatology on systemically infected leaves but failed to enter the meristem (Ghoshal and Sanfaçon, 2015; Martín‐Hernández and Baulcombe, 2008). It was suggested that meristem entry facilitated by the weak VSR and invasion of meristem is necessary to trigger antiviral systemic silencing. The movement of generated vsiRNAs leads to symptom recovery (Martín‐Hernández and Baulcombe, 2008). A similar role in transient meristem invasion was attributed to the cucumber mosaic virus (CMV) 2b VSR and this was also linked to the induction of symptom recovery (Mochizuki and Ohki, 2004; Sunpapao et al., 2009). Moreover, a kinetic study demonstrated that the induction of RNA silencing occurred before the meristem entry of the invading virus and the RNA silencing was triggered by virus accumulation in infected leaves rather than by meristem invasion (Santovito et al., 2014).
In line with this model, plants infected with viruses expressing VSRs often show tip necrosis, suggesting that the virus is able to invade the plant shoot, including the apical meristem, which finally leads to shoot necrosis and then plant death (Di Serio et al., 2010; Martín‐Hernández and Baulcombe, 2008; Schwach et al., 2005). Indeed, a recent report showed that transgenic expression of RDR1, which likely enhances antiviral RNA silencing, inhibits severe symptom development by limiting the spread of the virus into the growing tips of infected plants, similarly to RDR6 (Lee et al., 2016). Although these studies strongly suggest a key role of RNA silencing in virus exclusion from the plant SAM, direct evidence for the generalization of this model for all viruses is still missing.
To test whether antiviral silencing has a key role in meristem invasion, we infected N. benthamiana plants with CymRSV, which expresses the strong RNA silencing suppressor protein p19. Since the CymRSV‐induced shoot necrosis is quite fast, we also used the Cym19stop mutant virus (Dalmay et al., 1993), which carries a stop codon in the p19 gene and cannot spread further than a few cell layers from the veins (Havelda et al., 2003) (Fig. S1). We also infected transgenic N. benthamiana plants expressing a synthetic version of p19 VSR of CymRSV (p19syn plant) (Kontra et al., 2016). p19syn plants express wild‐type (wt) p19 but the RNA sequence of the synthetic p19 gene has low homology with wt virus RNA to avoid transgene‐induced silencing against the Cym19stop virus. The p19 mutant virus can spread in these plants similarly to CymRSV in wt plants, although the process is a bit slower due to the lower amount of p19 (Kontra et al., 2016) (Fig. S1). We performed in situ hybridization on the infected N. benthamiana shoots following the protocol previously described (Medzihradszky et al., 2014). Contrary to our expectations (based on previous studies with other viruses), we could not detect the CymRSV in any of the shoot meristems of virus‐infected plants, not even in the presence of an enhanced amount of p19 (p19syn plant infected with CymRSV) and at low temperature, which also inhibits RNA silencing (Fig. 1) (Szittya et al., 2003). This experiment demonstrates that the inactivation of the antiviral silencing response by p19 VSR or low temperature is not enough to allow the replicating virus to invade the SAM. On the other hand, the suppression of virus‐induced antiviral silencing is crucial for the high accumulation of viral RNAs in the plant shoot (excluding the meristem) and for the development of fast shoot apical necrosis, as was previously demonstrated (Havelda et al., 2003; Szittya et al., 2002, 2003). To have a piece of more solid evidence, we also inoculated DCL2/4‐silenced plants (Cordero et al., 2016) with Cym19stop virus. In this case, the viral p19 silencing suppressor and the antiviral silencing response of the host are both inactivated. The obtained results also show that the virus was excluded from the meristem (Fig. 1B). Apparently, it does not matter how we inactivate the host silencing machinery (either with a strong viral silencing suppressor or knocking down a host silencing component); the virus cannot invade the meristem. This finding further supports our hypothesis that RNA silencing is not the key factor in the viral meristem exclusion in this virus–host system.
Figure 1.
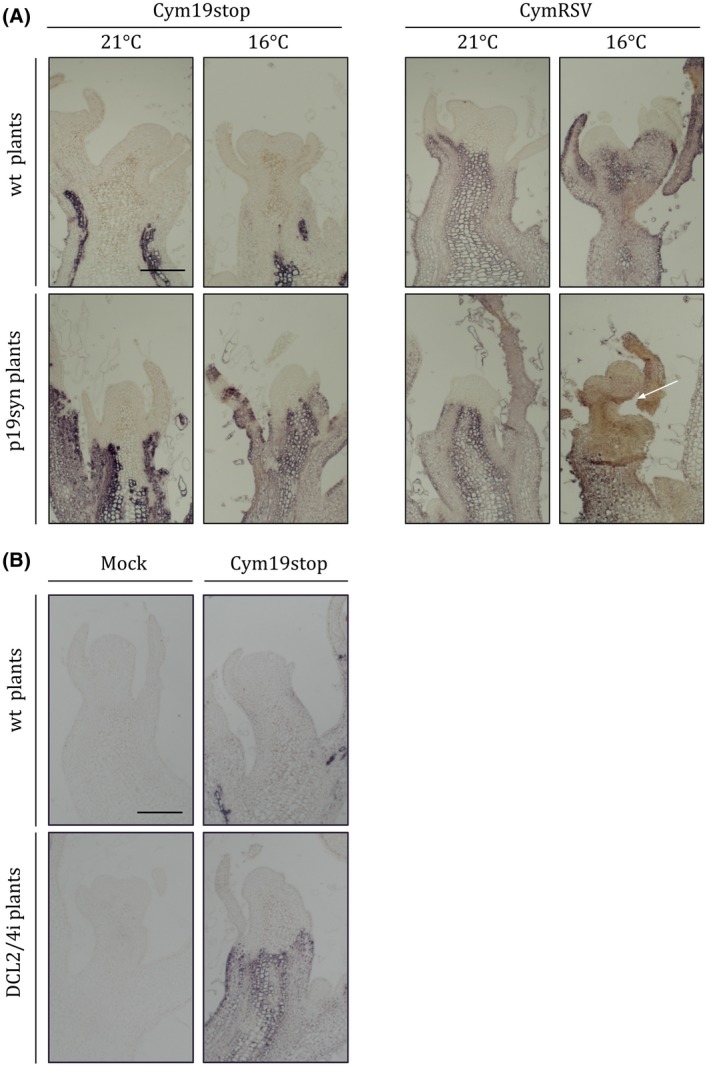
Detection of CymRSV in the shoot apical meristem (SAM) by in situ hybridization. Representative pictures of in situ hybridizations of consecutive longitudinal sections of infected meristems (n = 3–10) hybridized with CymRSV‐specific probes. Wild‐type Nicotiana benthamiana and transgenic plants expressing the p19 viral‐encoded silencing suppressor protein (VSR) of CymRSV (p19syn) (A) or DCL2/4‐silenced (DCL2/4i) plants (B) (Cordero et al., 2016) were infected either with wild‐type (wt) CymRSV or the VSR mutant Cym19stop as indicated. Plants were grown at 21 °C for 5 days (A and B) or at 16 °C for 9 days (A) after inoculation. Arrow indicates necrotic tissue. Bars = 200 µm.
To have a better view of the spatiotemporal progression of infection and the transcriptional changes in virus‐infected plant shoot apices, we performed a series of in situ hybridizations (Fig. 2). This experiment showed that after 3 days post‐inoculation (dpi) the virus is already present in the shoot, but the endogenous transcription of the housekeeping GLYCERALDEHYDE 3-PHOSPHATE DEHYDROGENASE (GAPDH) and the PATHOGENESIS-RELATED PROTEIN Q (PRQ) (Li et al., 2018b; Pesti et al., 2019) are unchanged. In contrast, after 4 dpi, in the virus‐invaded plant tissues close to the SAM, the GAPDH level is undetectable, while PRQ is greatly induced. It is worth noting that GAPDH is essential for the replication of the invading virus (Havelda et al., 2008; Wang and Nagy, 2008) and lack of GAPDH stops the virus replication and spread. Although the wt virus was clearly excluded from the SAM, it was able to induce shoot necrosis of the plant. More importantly, the virus infection specifically inhibited the expression of SAM‐specific genes such as WUS, the central player of the meristem‐specific regulatory network (Fig. 3). One would expect that the loss of WUS results in meristem collapse, and the high accumulation of virus close to the meristem leads to tip necrosis. However, meristem collapse alone does not induce shoot necrosis, as was observed using the wus‐1 loss‐of‐function mutant (Laux et al., 1996).
Figure 2.
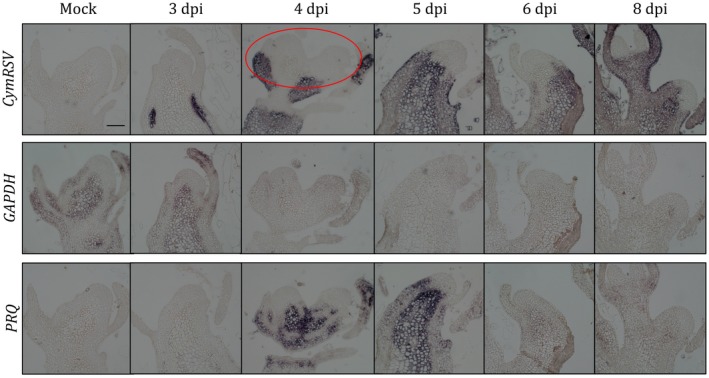
Monitoring the movement of CymRSV in shoot apices in time. In situ hybridization of longitudinal sections of mock‐treated or CymRSV‐infected shoot apical meristems 3 to 8 days post‐inoculation (dpi), as indicated. Sections were hybridized with CymRSV‐ or gene‐specific probes to detect GLYCERALDEHYDE 3‐PHOSPHATE DEHYDROGENASE A subunit 2 (GAPDH), PATHOGENESIS‐RELATED PROTEIN Q (PRQ). The red circle indicates the tissue collected for the RNA‐Seq experiments. Bar = 100 µm.
Figure 3.
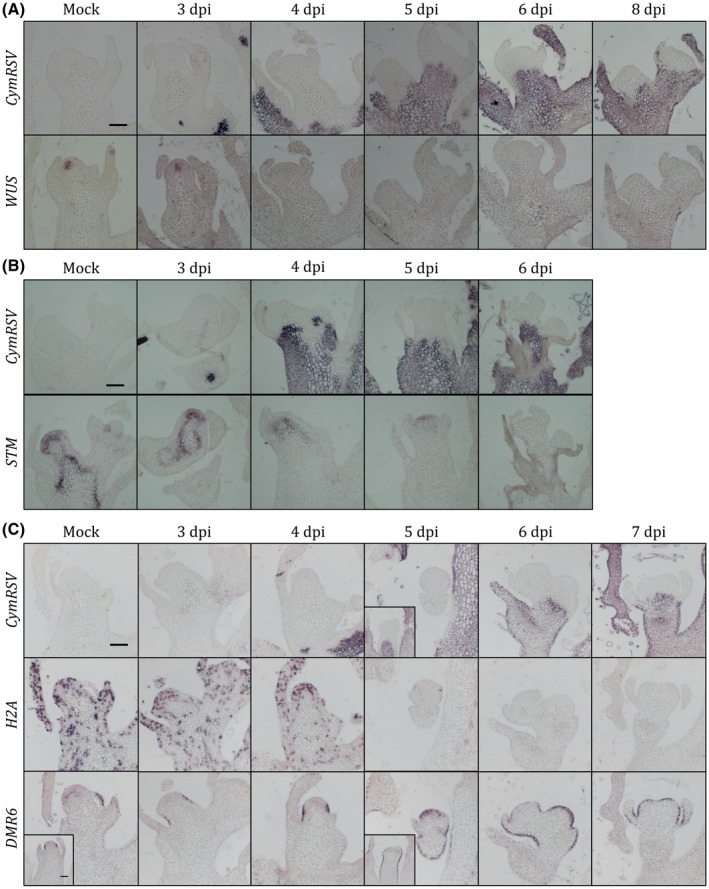
Expression pattern of selected genes in CymRSV‐infected shoot apices. In situ hybridization of longitudinal sections of mock and CymRSV‐infected plants hybridized with CymRSV‐ or gene‐specific probes as indicated on the left side: (A) WUSCHEL (WUS), (B) SHOOT MERISTEMLESS (STM), (C) HISTONE 2A (H2A) and DOWNY MILDEW RESISTANT 6 (DMR6). Note that meristems in (C) are from a different infection and embedding that can cause different timing (days post‐inoculation, dpi) in the expression changes. Bars = 100 µm.
The above in situ data suggest that there is a sharp change in the expression patterns from 3 to 4 dpi. Thus, to capture the genome‐wide gene expression changes caused by the advancing virus infection, we collected meristem tissue samples from 4 dpi mock‐ and CymRSV‐infected plants in four biological replicates (45 meristems for each replicate) for transcriptome analysis. RNA extraction was performed as described previously (Burgyán et al., 2000). It is important to note that these samples contained not only meristem cells but tissues close to the meristem, as indicated in Fig. 2. Using the purified RNAs, we prepared polyA‐selected, unstranded sequencing libraries and sequenced them on an Illumina HiSeq 2000 platform with a 75 bp single‐end chemistry. The alignment of the sequences to the N. benthamiana v. 1.0.1 reference transcriptome and the differential expression analysis was carried out with kallisto and sleuth, respectively (Pimentel et al., 2017). For the criteria considering a transcript as differentially expressed see the legend of Fig. S2. Applying the filtering rules we identified 5747 significantly up‐regulated and 4369 down‐regulated transcripts (Fig. S2 and Table S1A,B). We checked the expression pattern of some marker genes and potentially meristem‐specific genes in the sequencing data (Fig. S3). We verified the results of the sequencing data by RT‐qPCR (Fig. S4). We also checked the expression of the known meristem‐specific genes (Fig. S5 and Table S1C). To characterize the transcriptional changes functionally, we performed Gene Ontology (GO)‐term enrichment analysis of the significantly changed genes using PlantRegMap (Jin et al., 2017) and REVIGO (Supek et al., 2011). Analysing the results in detail, we can conclude that the up‐regulated genes are mainly related to cell defence (plasma membrane‐located receptor kinases, hypersensitive response, salicylic acid and ethylene signalling, programmed cell death; Fig. 4 and Table S2A), while the down‐regulated genes are related to DNA replication and organization, shoot meristem development and plasmodesmata function (Fig. 4 and Table S2B).
Figure 4.
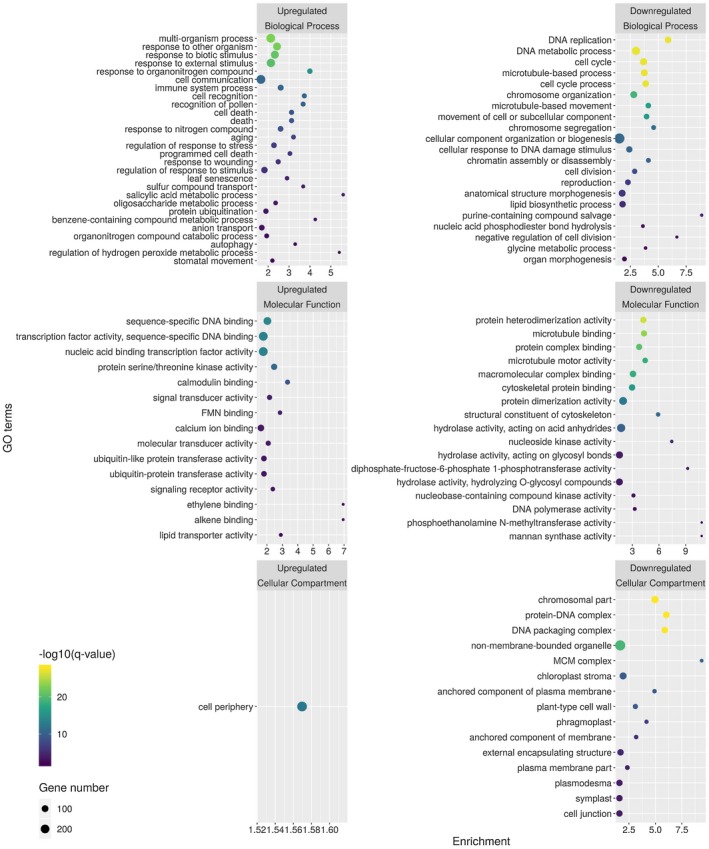
Significantly enriched GO categories among the up‐ and down‐regulated genes. The differential expression analysis was performed with sleuth (Pimentel et al., 2017). For the criteria considering a gene as differentially expressed see Fig. S2. We performed the GO‐term enrichment analysis using PlantRegMap (Jin et al., 2017) and REVIGO (Supek et al., 2011). Enrichment of GO terms was calculated by dividing the number of the observed term in the query list with the expected number of that particular term. Only terms with an enrichment greater than 1.5 and a q‐value less than 0.01 are shown. The result of the GO‐term enrichment analysis is in Table S2.
Although many transcripts were up‐regulated on CymRSV infection, most of the already known meristem‐regulating genes were down‐regulated in our dataset (Fig. S5 and Table S1C). To explore how well the transcriptome analysis captured the changes in the meristem and to distinguish these changes from those in the infected tissue part, we performed in situ hybridization with a few selected genes (Fig. 3 and Table S3). According to this experiment, WUSCHEL (WUS), which is essential to maintain the meristem, was not detectable in the organizing centre after 4 dpi (Fig. 3). The level of SHOOT MERISTEMLESS (STM) also decreased (Fig. 3), indicating that the meristem function is disturbed. HISTONE 2A (H2A) was also strongly down‐regulated in the infected shoots (Fig. 3C). In a recent study, down‐regulation of H2B was implicated in the salicylic acid‐mediated defence against potato virus X infection (Yang et al., 2019).
Since even the stress‐related PRQ was up‐regulated only in the infected tissues and not detectable in the meristem, we wondered if we would find any genes up‐regulated in the meristem. For this purpose, we selected a few genes showing up‐regulation in our RNA‐Seq data (Fig. S3 and Table S3) and performed in situ hybridizations with them. This showed that most of the selected up‐regulated genes expressed at a higher level only in the infected tissue (Fig. S6). However, DOWNY MILDEW RESISTANT 6 (DMR6), which is a salicylic acid 5‐hydroxylase, was strongly expressed in the peripheral zone of the meristem but only in the uninfected meristem cells (Fig. 3C).
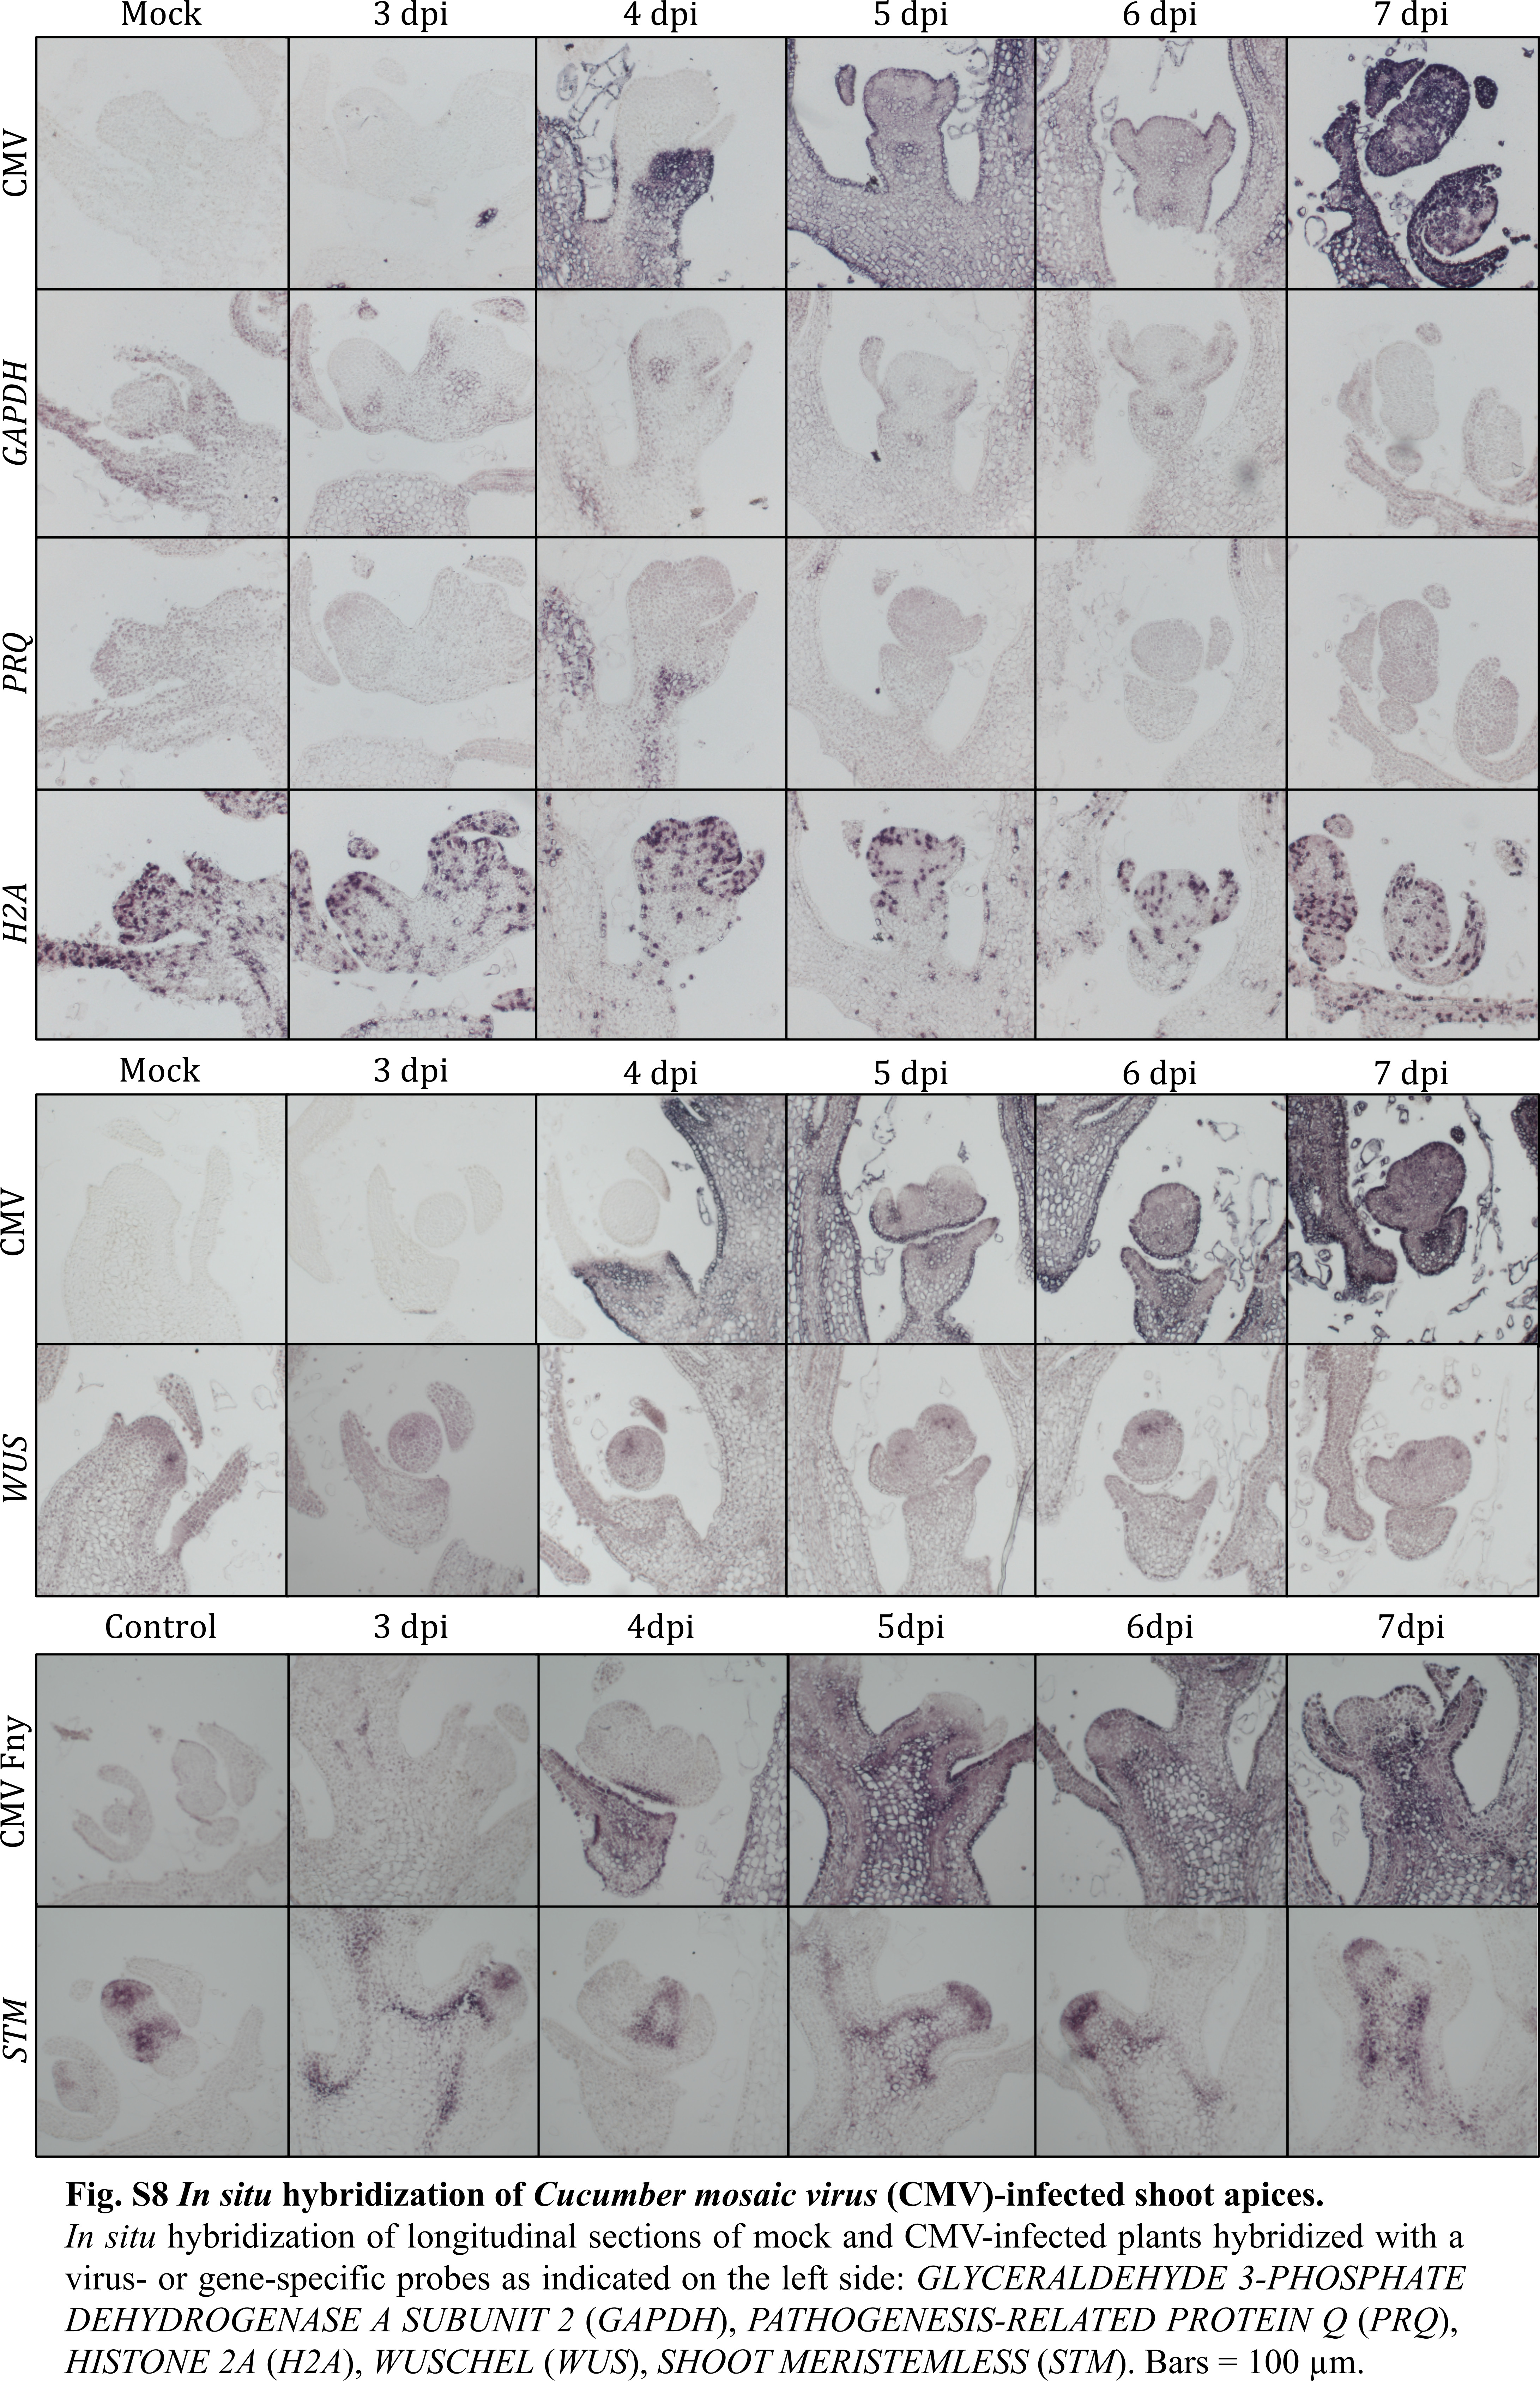
These data suggest that the meristem is not functional anymore and that these changes are likely programmed as a consequence of the accumulated virus in the tissues around the meristem. We wondered if the down‐regulation of WUS has any connection to the shut‐off phenomenon when the down‐regulation of host gene expression is associated with the virus replication (Wang and Maule, 1995). To test this, we extended our experiments with turnip vein‐clearing virus (TVCV) (Csorba et al., 2007) and cucumber mosaic virus (CMV) infected samples. TVCV causes shut‐off (Havelda et al., 2008; Pesti et al., 2019) and similar symptoms (shoot necrosis) as the CymRSV infection. We got similar results as with CymRSV except for WUS, which was unchanged compared to mock even after 6 dpi (Figs 5 and S7). CMV infection does not cause shut‐off and results in weak symptoms. Importantly, in these samples the WUS expression stays on, similarly to the TVCV infection, and, as expected, the GAPDH, H2A and STM expressions were also unchanged (Fig. S8). Interestingly, the PRQ expression is up‐regulated at 4 dpi but then decreases again. Taken together, these results show that the down‐regulation of WUS is specific to CymRSV infection and is not the consequence of the activated shut‐off. Moreover, there is no direct connection between the down‐regulation of WUS and the shoot necrosis in general, since TVCV necrotized the shoot while CMV did not.
Figure 5.
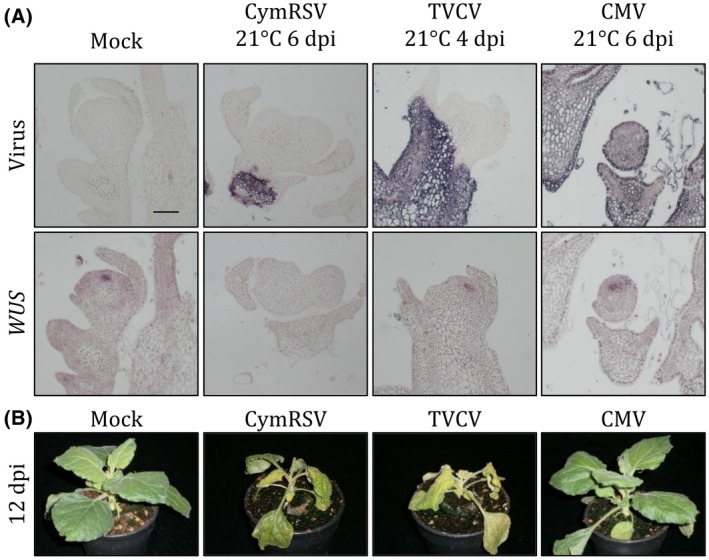
WUS expression and viral symptoms of plants infected with three different viruses. (A) In situ hybridization of consecutive longitudinal sections of mock‐, CymRSV‐, TVCV‐ and CMV‐infected shoot apical meristems hybridized with probes to detect the virus or WUSCHEL (WUS). Bar = 100 µm. (B) Symptoms of mock‐, CymRSV‐, TVCV‐ or CMV‐infected Nicotiana benthamiana plants 12 days after infection.
Our results clearly demonstrate that in a compatible interaction between a virus and its host plant, the virus infection causes drastic alterations in the plant transcriptome, leading to symptom development. In many cases, symptom attenuation can be seen in the upper part of the plant, called recovery (Ghoshal and Sanfaçon, 2015). The capability for recovery depends on the host plant species/variety–virus interaction (Bengyella et al., 2015; Paudel and Sanfaçon, 2018) and is influenced by environmental factors, such as temperature (Fondong et al., 2000). Recovery is also linked to gene silencing and its dependence on temperature (Szittya et al., 2003). In the reported experiments, the infected plants were grown at various temperatures after infection. At 27 °C, the virus could not invade the whole leaf blade or spread close to the meristem, leading to recovering from the infection. Here we tested whether the plants can recover at 27 °C after they developed symptoms at 21 °C. We found that most of the plants could recover but only from the axillary buds (Fig. S9), showing that the reprogramming of the transcriptome is not reversible by temperature and leads to the loss of SAM function. Our data also suggest that the loss of meristem function is not because of lost WUS expression, but might be a result of a reprogrammed hormonal network.
It is worth noting that the expression of three E3 SUMO‐protein ligase SIZ1 homologues is up‐regulated (Fig. S10). SIZ1 is a regulator of salicylic acid signalling, immunity and shoot development (Hammoudi et al., 2018; Lee et al., 2007; Miura et al., 2010; Niu et al., 2019), making it a good candidate as a silencing‐independent factor of virus‐induced meristem shut‐down. Recently, an autophagy‐related gene, Beclin‐1 (BECN1, ATG6), was shown to be induced by turnip mosaic virus (TuMV) infection and to restrict viral replication in N. benthamiana plants by binding to the viral replicase protein (Li et al., 2018a, p. 1). Beclin‐1 was also induced in our samples, along with other autophagy‐related genes (Fig. S11), which suggests that this mechanism of viral restriction is not TuMV‐specific and that virus‐induced autophagy is a common response to virus infection. In a comparative transcriptome analysis of chrysanthemum infected with three different viruses, the authors identified 33 differentially expressed genes that were common between the three viral infections (Choi et al., 2015). Notably, members of the minichromosome maintenance complex were found to be down‐regulated, just like in our dataset (Figs 4 and S12). This suggests that functions related to DNA replication and cell division are usually corrupted during viral infection, which might lead to genome instability and programmed cell death.
Taken together, our results highlight the high variability of plant strategies to counteract invading viral pathogens.
Supporting information
Fig. S1 Testing the CymRSV probe. In situ hybridization of cross‐sections of mock, Cym19stop‐, and CymRSV‐infected plant leaves using an RNA probe against CymRSV. Bars = 200 µm.
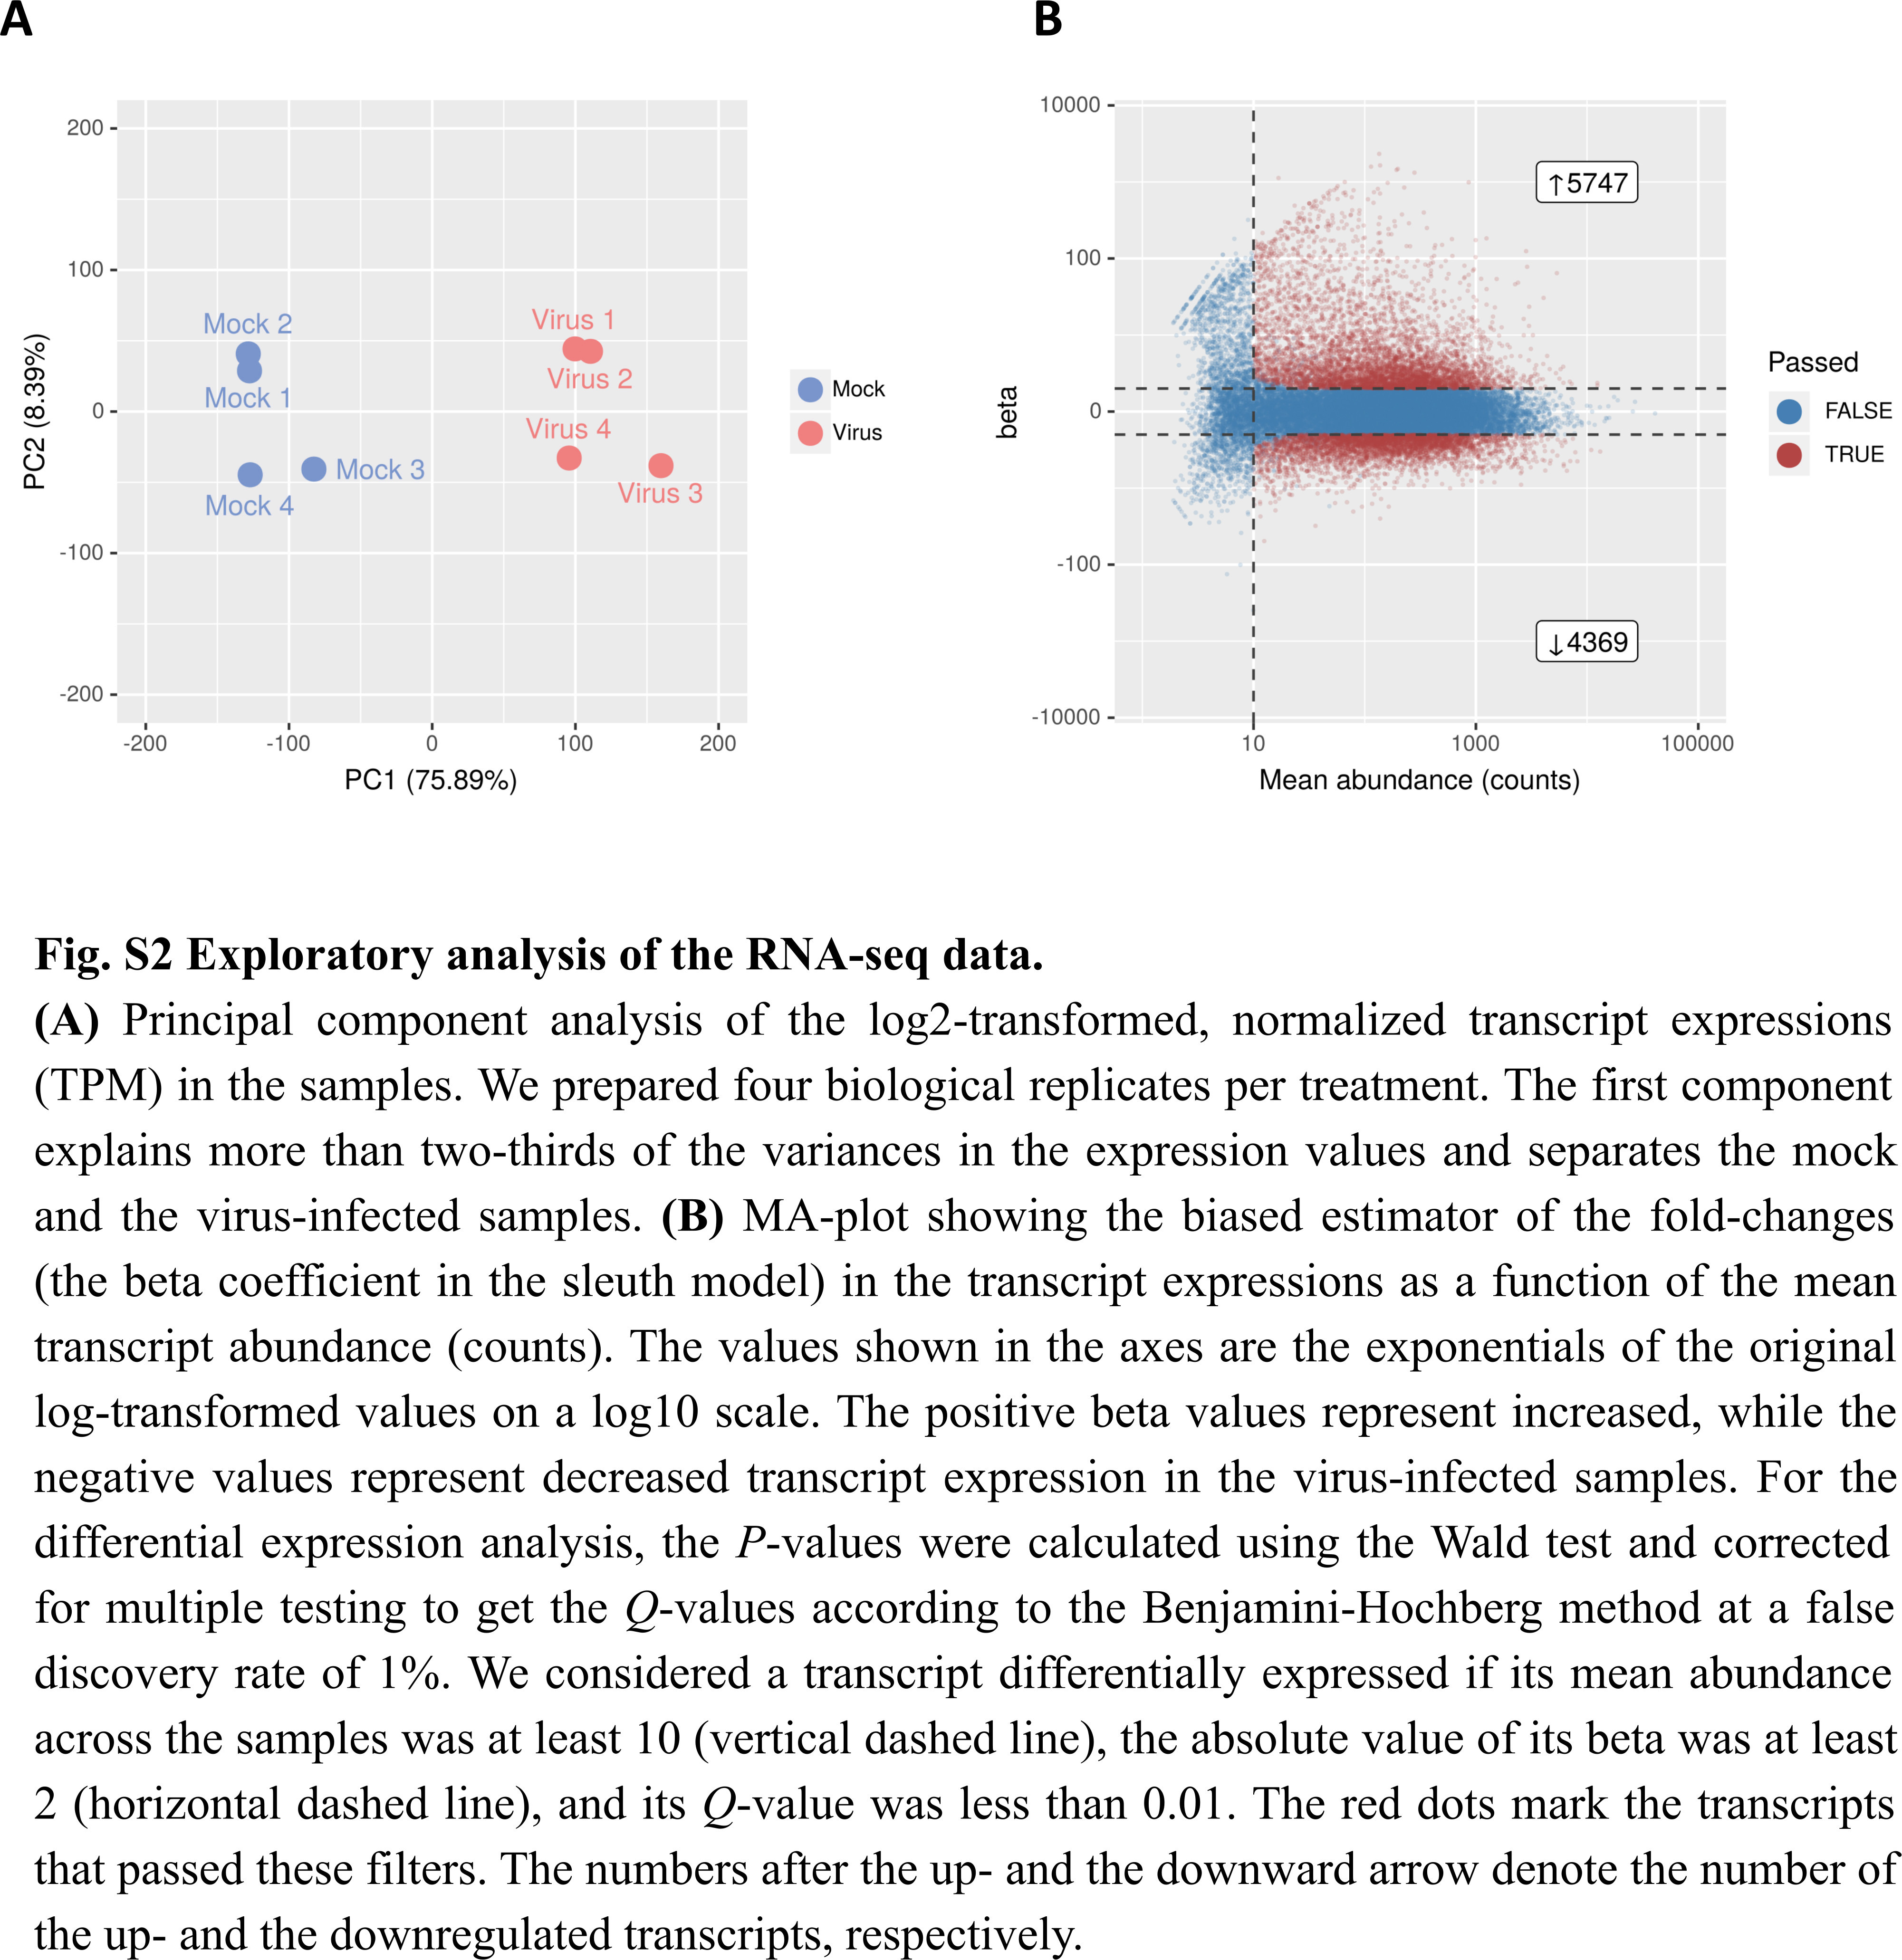
Fig. S2 Exploratory analysis of the RNA‐Seq data. (A) Principal component analysis of the log2‐transformed, normalized transcript expressions (TPM) in the samples. We prepared four biological replicates per treatment. The first component explains more than two‐thirds of the variances in the expression values and separates the mock and the virus‐infected samples. (B) MA‐plot showing the biased estimator of the fold‐changes (the beta coefficient in the sleuth model) in the transcript expressions as a function of the mean transcript abundance (counts). The values shown in the axes are the exponentials of the original log‐transformed values on a log10 scale. The positive beta values represent increased, while the negative values represent decreased transcript expression in the virus‐infected samples. For the differential expression analysis, the P‐values were calculated using the Wald test and corrected for multiple testing to get the Q‐values according to the Benjamini–Hochberg method at a false discovery rate of 1%. We considered a transcript differentially expressed if its mean abundance across the samples was at least 10 (vertical dashed line), the absolute value of its beta was at least 2 (horizontal dashed line), and its Q‐value was less than 0.01. The red dots mark the transcripts that passed these filters. The numbers after the upward and the downward arrow denote the number of the up‐ and the down‐regulated transcripts, respectively.
Fig. S3 Expression of selected genes that were analysed by in situ hybridization experiments. The normalized expression values (transcript per million, TPM) of the indicated genes were estimated by kallisto (Pimentel et al., 2017). The boxplots represent the summary of the bootstrap analysis which estimates the technical variances in a sample. Four biological replicates were prepared (Mock 1–4, Virus 1–4). The WUSCHEL (WUS) and the SHOOT MERISTEMLESS (STM) gene strictly expresses in the meristem, while the GLYCERALDEHYDE‐PHOSPHATE DEHYDROGENASE (GAPDH) is an enzyme that is required for virus replication. The PATHOGENESIS‐RELATED PROTEIN Q (PRQ) is a well‐known stress‐induced marker gene. HISTONE 2A (H2A), DOWNY MILDEW RESISTANT 6 (DMR6) is a salicylic acid 5‐hydroxylase, UDP‐GLYCOSYLTRANSFERASE 74 F1 (UGT74F1) transfers UDP:glucose to salicylic acid, CYTOCHROME P450 (CYP450) is a hydroxylase involved in the metabolism of many bioactive compounds, including hormones, while CALMODULIN‐BINDING PROTEIN (CaM‐binding) is a component of many stress‐related signalling pathways.
Fig. S4 Validation of the high‐throughput sequencing results by quantitative real‐time RT‐PCR. Some of the investigated genes shown in Fig. S3 was also measured by RT‐qPCR. Gene levels were normalized to the SEC23 and PRX2B (Table S3) reference gene levels in the same sample. Reference genes were selected from the least significantly changed genes according to the RNA‐Seq analysis, with moderate (~50 and ~600 TPM) mean expression levels and minimal variation of expression levels across all the samples. The values are means of three independent experiments with SE. An unpaired, one‐tailed t‐test was performed to estimate statistical significance. ***, P ≤ 0.001; **, P ≤ 0.01; *, P ≤ 0.05, ns = not significant.
Fig. S5 Expression of meristem‐specific genes. The normalized expression values (transcript per million, TPM) of the indicated genes were estimated by kallisto (Pimentel et al., 2017), log2‐transformed and z‐scores were calculated. The z‐scores show how many standard deviations the given value is above (red) or below (blue) from the mean (white) of all the values in the row. We show the values of the four biological replicates (Mock 1–4, Virus 1–4).
Fig. S6 Expression pattern of selected genes in CymRSV‐infected shoot apices. In situ hybridization of longitudinal sections of shoot apices of mock‐ and CymRSV‐infected plants 4 or 5 dpi, hybridized with CymRSV‐ or gene‐specific probes as indicated: UDP‐GLYCOSYLTRANSFERASE 74 F1 (UGT74F1), CYTOCHROME P450 SUPERFAMILY PROTEIN (CYP450), or Calmodulin‐binding (CaM‐BP). Bars = 100 µm.
Fig. S7 In situ hybridization of TVCV‐infected shoot apices. In situ hybridization of longitudinal sections of mock‐ and TVCV‐infected plants 4 or 5 dpi hybridized with a virus‐ or gene‐specific probes as indicated: GLYCERALDEHYDE 3‐PHOSPHATE DEHYDROGENASE A SUBUNIT 2 (GAPDH), PATHOGENESIS‐RELATED PROTEIN Q (PRQ), WUSCHEL (WUS), SHOOT MERISTEMLESS (STM). Bars = 100 µm.
Fig. S8 In situ hybridization of CMV‐infected shoot apices. In situ hybridization of longitudinal sections of mock‐ and CMV‐infected plants hybridized with a virus‐ or gene‐specific probes as indicated on the left side: GLYCERALDEHYDE 3‐PHOSPHATE DEHYDROGENASE A SUBUNIT 2 (GAPDH), PATHOGENESIS‐RELATED PROTEIN Q (PRQ), HISTONE 2A (H2A), WUSCHEL (WUS), SHOOT MERISTEMLESS (STM). Bars = 100 µm.
Fig. S9 Recovery from side shoots. Symptoms of mock and CymRSV‐infected Nicotiana benthamiana plants grown at 21 °C 4–8 days after infection, then transferred to 27 °C for 3 weeks. Symptoms of a representative mock‐ and CymRSV‐infected plant grown at 21 °C one week after infection (upper picture) and at 27 °C four weeks after infection (lower picture).
Fig. S10 Expression of the significantly up‐regulated SIZ1 homologue genes in the SAM region. The normalized expression values (transcript per million, TPM) of the indicated genes were estimated by kallisto (Pimentel et al., 2017), log2‐transformed and z‐scores were calculated. The z‐scores show how many standard deviations the given value is above (red) or below (blue) from the mean (white) of all the values in the row. We show the values of the four biological replicates (Mock 1–4, Virus 1–4). For criteria of the significantly changed expressions see legend of Fig. S2.
Fig. S11 Expression of the significantly up‐regulated autophagy‐related genes in the SAM region. The normalized expression values (transcript per million, TPM) of the indicated genes were estimated by kallisto (Pimentel et al., 2017), log2‐transformed and z‐scores were calculated. The z‐scores show how many standard deviations the given value is above (red) or below (blue) from the mean (white) of all the values in the row. We show the values of the four biological replicates (Mock 1–4, Virus 1–4). For criteria of the significantly changed expressions see legend of Fig. S2.
Fig. S12 Expression of the significantly down‐regulated MCM‐complex genes in the SAM region. The normalized expression values (transcript per million, TPM) of the indicated genes were estimated by kallisto (Pimentel et al., 2017), log2‐transformed and z‐scores were calculated. The z‐scores show how many standard deviations the given value is above (red) or below (blue) from the mean (white) of all the values in the row. We show the values of the four biological replicates (Mock 1–4, Virus 1–4). For criteria of the significantly changed expressions see legend of Fig. S2.
Table S1 RNA‐Seq analysis. The annotated expression tables and the result of the differential expression analysis for the up‐regulated (Table S1A) and down‐regulated transcripts (Table S1B), the meristem‐specific genes (Table S1C), and all the tested transcripts (Table S1D).
Table S2 GO‐term enrichment analysis. The result of the GO‐term enrichment analysis without the simplification by REViGO. Significantly enriched GO‐terms among the up‐regulated (Table S2A) and down‐regulated (Table S2B) genes.
Table S3 Primers and probes. Information about the primers and probes used in this study.
Acknowledgements
This work was financially supported by grants from the National Research, Development and Innovation Office (http://nkfih.gov.hu; NKFI‐K112737 was granted to J.B., NKFI‐K119701 was granted to G.S.). The authors declare no conflict of interest. The authors thank Mátyás Medzihradszky for the critical review of the article.
Data Availability Statement
The data that support the findings of this study are openly available in the Gene Expression Omnibus (GEO) database at www.ncbi.nlm.nih.gov/geo, accession number GSE131476.
References
- Andersen, S.U. , Buechel, S. , Zhao, Z. , Ljung, K. , Novák, O. , Busch, W. , Schuster, C. and Lohmann, J.U. (2008) Requirement of B2‐type cyclin‐dependent kinases for meristem integrity in Arabidopsis thaliana . Plant Cell, 20, 88–100. [DOI] [PMC free article] [PubMed] [Google Scholar]
- Baulcombe, D. (2004) RNA silencing in plants. Nature, 431, 356–363. [DOI] [PubMed] [Google Scholar]
- Bengyella, L. , Waikhom, S.D. , Allie, F. and Rey, C. (2015) Virus tolerance and recovery from viral‐induced symptoms in plants are associated with transcriptome reprograming. Plant Mol. Biol. 89, 243–252. [DOI] [PubMed] [Google Scholar]
- Brand, U. , Fletcher, J.C. , Hobe, M. , Meyerowitz, E.M. and Simon, R. (2000) Dependence of stem cell fate in Arabidopsis on a feedback loop regulated by CLV3 activity. Science, 289, 617–619. [DOI] [PubMed] [Google Scholar]
- Brodersen, P. and Voinnet, O. (2006) The diversity of RNA silencing pathways in plants. Trends Genet. 22, 268–280. [DOI] [PubMed] [Google Scholar]
- Burgyán, J. and Havelda, Z. (2011) Viral suppressors of RNA silencing. Trends Plant Sci. 16, 265–272. [DOI] [PubMed] [Google Scholar]
- Burgyán, J. , Hornyik, C. , Szittya, G. , Silhavy, D. and Bisztray, G. (2000) The ORF1 products of tombusviruses play a crucial role in lethal necrosis of virus‐infected plants. J. Virol. 74, 10873–10881. [DOI] [PMC free article] [PubMed] [Google Scholar]
- Choi, H. , Jo, Y. , Lian, S. , Jo, K.‐M. , Chu, H. , Yoon, J.‐Y. , Choi, S.‐K. , Kim, K.‐H. and Cho, W.K. (2015) Comparative analysis of chrysanthemum transcriptome in response to three RNA viruses: cucumber mosaic virus, tomato spotted wilt virus and potato virus X. Plant Mol. Biol. 88, 233–248. [DOI] [PubMed] [Google Scholar]
- Cordero, T. , Cerdán, L. , Carbonell, A. , Katsarou, K. , Kalantidis, K. and Daròs, J.‐A. (2016) Dicer‐Like 4 is involved in restricting the systemic movement of zucchini yellow mosaic virus in Nicotiana benthamiana . Mol. Plant–Microbe Interact. 30, 63–71. [DOI] [PubMed] [Google Scholar]
- Csorba, T. , Bovi, A. , Dalmay, T. and Burgyán, J. (2007) The p122 subunit of tobacco mosaic virus replicase is a potent silencing suppressor and compromises both small interfering RNA‐ and microRNA‐mediated pathways. J. Virol. 81, 11768–11780. [DOI] [PMC free article] [PubMed] [Google Scholar]
- Csorba, T. , Kontra, L. and Burgyán, J. (2015) Viral silencing suppressors: tools forged to fine‐tune host–pathogen coexistence. Virology, 479, 85–103. [DOI] [PubMed] [Google Scholar]
- Dalmay, T. , Rubino, L. , Burgyán, J. , Kollár, Á. and Russo, M. (1993) Functional analysis of Cymbidium ringspot virus genome. Virology, 194, 697–704. [DOI] [PubMed] [Google Scholar]
- Di Serio, F. , Martínez de Alba, A.‐E. , Navarro, B. , Gisel, A. and Flores, R. (2010) RNA‐dependent RNA polymerase 6 delays accumulation and precludes meristem invasion of a viroid that replicates in the nucleus. J. Virol. 84, 2477–2489. [DOI] [PMC free article] [PubMed] [Google Scholar]
- Dunoyer, P. , Himber, C. and Voinnet, O. (2005) DICER‐LIKE 4 is required for RNA interference and produces the 21‐nucleotide small interfering RNA component of the plant cell‐to‐cell silencing signal. Nat. Genet. 37, 1356. [DOI] [PubMed] [Google Scholar]
- Fletcher, J.C. , Brand, U. , Running, M.P. , Simon, R. and Meyerowitz, E.M. (1999) Signaling of cell fate decisions by CLAVATA3 in Arabidopsis shoot meristems. Science, 283, 1911–1914. [DOI] [PubMed] [Google Scholar]
- Fondong, V.N. , Thresh, J.M. and Fauquet, C. (2000) Field experiments in Cameroon on cassava mosaic virus disease and the reversion phenomenon in susceptible and resistant cassava cultivars. Int. J. Pest Manag. 46, 211–217. [Google Scholar]
- Ghoshal, B. and Sanfaçon, H. (2015) Symptom recovery in virus‐infected plants: revisiting the role of RNA silencing mechanisms. Virology, 479–480, 167–179. [DOI] [PubMed] [Google Scholar]
- Hamilton, A.J. and Baulcombe, D.C. (1999) A species of small antisense RNA in posttranscriptional gene silencing in plants. Science, 286, 950–952. [DOI] [PubMed] [Google Scholar]
- Hammoudi, V. , Fokkens, L. , Beerens, B. , Vlachakis, G. , Chatterjee, S. , Arroyo‐Mateos, M. , Wackers, P.F.K. , Jonker, M.J. and van den Burg, H.A. (2018) The Arabidopsis SUMO E3 ligase SIZ1 mediates the temperature dependent trade‐off between plant immunity and growth. PLoS Genet. 14, e1007157. [DOI] [PMC free article] [PubMed] [Google Scholar]
- Havelda, Z. , Hornyik, C. , Crescenzi, A. and Burgyán, J. (2003) In situ characterization of Cymbidium ringspot tombusvirus infection‐induced posttranscriptional gene silencing in Nicotiana benthamiana . J. Virol. 77, 6082–6086. [DOI] [PMC free article] [PubMed] [Google Scholar]
- Havelda, Z. , Hornyik, C. , Válóczi, A. and Burgyán, J. (2005) Defective interfering RNA hinders the activity of a tombusvirus‐encoded posttranscriptional gene silencing suppressor. J. Virol. 79, 450–457. [DOI] [PMC free article] [PubMed] [Google Scholar]
- Havelda, Z. , Várallyay, E. , Válóczi, A. and Burgyán, J. (2008) Plant virus infection‐induced persistent host gene downregulation in systemically infected leaves. Plant J. Cell Mol. Biol. 55, 278–288. [DOI] [PubMed] [Google Scholar]
- Jin, J. , Tian, F. , Yang, D.‐C. , Meng, Y.‐Q. , Kong, L. , Luo, J. and Gao, G. (2017) PlantTFDB 4.0: toward a central hub for transcription factors and regulatory interactions in plants. Nucleic Acids Res. 45, D1040–D1045. [DOI] [PMC free article] [PubMed] [Google Scholar]
- Jovel, J. , Walker, M. and Sanfaçon, H. (2007) Recovery of Nicotiana benthamiana plants from a necrotic response induced by a nepovirus is associated with RNA silencing but not with reduced virus titer. J. Virol. 81, 12285–12297. [DOI] [PMC free article] [PubMed] [Google Scholar]
- Kontra, L. , Csorba, T. , Tavazza, M. , Lucioli, A. , Tavazza, R. , Moxon, S. , Tisza, V. , Medzihradszky, A. , Turina, M. and Burgyán, J. (2016) Distinct effects of p19 RNA silencing suppressor on small RNA mediated pathways in plants. PLoS Pathog. 12, e1005935. [DOI] [PMC free article] [PubMed] [Google Scholar]
- Kørner, C.J. , Pitzalis, N. , Peña, E.J. , Erhardt, M. , Vazquez, F. and Heinlein, M. (2018) Crosstalk between PTGS and TGS pathways in natural antiviral immunity and disease recovery. Nat. Plants, 4, 157–164. [DOI] [PubMed] [Google Scholar]
- Lakatos, L. , Szittya, G. , Silhavy, D. and Burgyán, J. (2004) Molecular mechanism of RNA silencing suppression mediated by p19 protein of tombusviruses. EMBO J. 23, 876–884. [DOI] [PMC free article] [PubMed] [Google Scholar]
- Laux, T. , Mayer, K.F. , Berger, J. and Jurgens, G. (1996) The WUSCHEL gene is required for shoot and floral meristem integrity in Arabidopsis. Development, 122, 87–96. [DOI] [PubMed] [Google Scholar]
- Lee, J. , Nam, J. , Park, H.C. , Na, G. , Miura, K. , Jin, J.B. , Yoo, C.Y. , Baek, D. , Kim, D.H. , Jeong, J.C. , Kim, D. , Lee, S.Y. , Salt, D.E. , Mengiste, T. , Gong, Q. , Ma, S. , Bohnert, H.J. , Kwak, S.‐S. , Bressan, R.A. , Hasegawa, P.M. and Yun, D.‐J. (2007) Salicylic acid‐mediated innate immunity in Arabidopsis is regulated by SIZ1 SUMO E3 ligase. Plant J. 49, 79–90. [DOI] [PubMed] [Google Scholar]
- Lee, W.‐S. , Fu, S.‐F. , Li, Z. , Murphy, A.M. , Dobson, E.A. , Garland, L. , Chaluvadi, S.R. , Lewsey, M.G. , Nelson, R.S. and Carr, J.P. (2016) Salicylic acid treatment and expression of an RNA‐dependent RNA polymerase 1 transgene inhibit lethal symptoms and meristem invasion during tobacco mosaic virus infection in Nicotiana benthamiana . BMC Plant Biol. 16, 15. [DOI] [PMC free article] [PubMed] [Google Scholar]
- Li, F. , Zhang, C. , Li, Y. , Wu, G. , Hou, X. , Zhou, X. and Wang, A. (2018a) Beclin1 restricts RNA virus infection in plants through suppression and degradation of the viral polymerase. Nat. Commun. 9, 1268. [DOI] [PMC free article] [PubMed] [Google Scholar]
- Li, K. , Wu, G. , Li, M. , Ma, M. , Du, J. , Sun, M. , Sun, X. and Qing, L. (2018b) Transcriptome analysis of Nicotiana benthamiana infected by tobacco curly shoot virus. Virol. J. 15, 138. [DOI] [PMC free article] [PubMed] [Google Scholar]
- Llave, C. (2010) Virus‐derived small interfering RNAs at the core of plant–virus interactions. Trends Plant Sci. 15, 701–707. [DOI] [PubMed] [Google Scholar]
- Long, J.A. , Moan, E.I. , Medford, J.I. and Barton, M.K. (1996) A member of the KNOTTED class of homeodomain proteins encoded by the STM gene of Arabidopsis . Nature, 379, 66–69. [DOI] [PubMed] [Google Scholar]
- Martín‐Hernández, A.M. and Baulcombe, D.C. (2008) Tobacco rattle virus 16‐kilodalton protein encodes a suppressor of RNA silencing that allows transient viral entry in meristems. J. Virol. 82, 4064–4071. [DOI] [PMC free article] [PubMed] [Google Scholar]
- Mayer, K.F. , Schoof, H. , Haecker, A. , Lenhard, M. , Jürgens, G. and Laux, T. (1998) Role of WUSCHEL in regulating stem cell fate in the Arabidopsis shoot meristem. Cell, 95, 805–815. [DOI] [PubMed] [Google Scholar]
- Medzihradszky, A. , Schneitz, K. and Lohmann, J.U. (2014) Detection of mRNA expression patterns by nonradioactive in situ hybridization on histological sections of floral tissue In: Flower Development: Methods and Protocols. (Riechmann J.L. and Wellmer F., eds), Methods in Molecular Biology. pp. 275–293. New York, NY: Springer. [DOI] [PubMed] [Google Scholar]
- Miura, K. , Lee, J. , Miura, T. and Hasegawa, P.M. (2010) SIZ1 controls cell growth and plant development in Arabidopsis through salicylic acid. Plant Cell Physiol. 51, 103–113. [DOI] [PubMed] [Google Scholar]
- Mochizuki, T. and Ohki, S.T. (2004) Shoot meristem tissue of tobacco inoculated with cucumber mosaic virus is infected with the virus and subsequently recovers from infection by RNA silencing. J. Gen. Plant Pathol. 70, 363–366. [Google Scholar]
- Niu, D. , Lin, X.‐L. , Kong, X. , Qu, G.‐P. , Cai, B. , Lee, J. and Jin, J.B. (2019) SIZ1‐mediated SUMOylation of TPR1 suppresses plant immunity in Arabidopsis. Mol. Plant, 12, 215–228. [DOI] [PubMed] [Google Scholar]
- Parent, J.‐S. , Martínez de Alba, A.E. and Vaucheret, H. (2012) The origin and effect of small RNA signaling in plants. Front. Plant Sci. 3, 179. [DOI] [PMC free article] [PubMed] [Google Scholar]
- Paudel, D.B. and Sanfaçon, H. (2018) Exploring the diversity of mechanisms associated with plant tolerance to virus infection. Front. Plant Sci. 9, 1575. [DOI] [PMC free article] [PubMed] [Google Scholar]
- Pesti, R. , Kontra, L. , Paul, K. , Vass, I. , Csorba, T. , Havelda, Z. and Várallyay, É. (2019) Differential gene expression and physiological changes during acute or persistent plant virus interactions may contribute to viral symptom differences. PLoS ONE, 14, e0216618. [DOI] [PMC free article] [PubMed] [Google Scholar]
- Pimentel, H. , Bray, N.L. , Puente, S. , Melsted, P. and Pachter, L. (2017) Differential analysis of RNA‐Seq incorporating quantification uncertainty. Nat. Methods, 14, 687–690. [DOI] [PubMed] [Google Scholar]
- Ratcliff, F. , Harrison, B.D. and Baulcombe, D.C. (1997) A similarity between viral defense and gene silencing in plants. Science, 276, 1558–1560. [DOI] [PubMed] [Google Scholar]
- Santovito, E. , Mascia, T. , Siddiqui, S.A. , Minutillo, S.A. , Valkonen, J.P.T. and Gallitelli, D. (2014) Infection cycle of artichoke Italian latent virus in tobacco plants: meristem invasion and recovery from disease symptoms. PLoS ONE, 9, e99446. [DOI] [PMC free article] [PubMed] [Google Scholar]
- Schoof, H. , Lenhard, M. , Haecker, A. , Mayer, K.F. , Jürgens, G. and Laux, T. (2000) The stem cell population of Arabidopsis shoot meristems in maintained by a regulatory loop between the CLAVATA and WUSCHEL genes. Cell, 100, 635–644. [DOI] [PubMed] [Google Scholar]
- Schwach, F. , Vaistij, F.E. , Jones, L. and Baulcombe, D.C. (2005) An RNA‐dependent RNA polymerase prevents meristem invasion by potato virus X and is required for the activity but not the production of a systemic silencing signal. Plant Physiol. 138, 1842–1852. [DOI] [PMC free article] [PubMed] [Google Scholar]
- Silhavy, D. , Molnár, A. , Lucioli, A. , Szittya, G. , Hornyik, C. , Tavazza, M. and Burgyán, J. (2002) A viral protein suppresses RNA silencing and binds silencing‐generated, 21‐ to 25‐nucleotide double‐stranded RNAs. EMBO J. 21, 3070–3080. [DOI] [PMC free article] [PubMed] [Google Scholar]
- Sunpapao, A. , Nakai, T. , Dong, F. , Mochizuki, T. and Ohki, S.T. (2009) The 2b protein of cucumber mosaic virus is essential for viral infection of the shoot apical meristem and for efficient invasion of leaf primordia in infected tobacco plants. J. Gen. Virol. 90, 3015–3021. [DOI] [PubMed] [Google Scholar]
- Supek, F. , Bošnjak, M. , Škunca, N. and Šmuc, T. (2011) REVIGO summarizes and visualizes long lists of gene ontology terms. PLoS ONE, 6, e21800. [DOI] [PMC free article] [PubMed] [Google Scholar]
- Szittya, G. , Molnár, A. , Silhavy, D. , Hornyik, C. and Burgyán, J. (2002) Short defective interfering RNAs of tombusviruses are not targeted but trigger post‐transcriptional gene silencing against their helper virus. Plant Cell, 14, 359–372. [DOI] [PMC free article] [PubMed] [Google Scholar]
- Szittya, G. , Silhavy, D. , Molnár, A. , Havelda, Z. , Lovas, Á. , Lakatos, L. , Bánfalvi, Z. and Burgyán, J. (2003) Low temperature inhibits RNA silencing‐mediated defence by the control of siRNA generation. EMBO J. 22, 633–640. [DOI] [PMC free article] [PubMed] [Google Scholar]
- Vargason, J.M. , Szittya, G. , Burgyán, J. and Hall, T.M.T. (2003) Size selective recognition of siRNA by an RNA silencing suppressor. Cell, 115, 799–811. [DOI] [PubMed] [Google Scholar]
- Wang, D. and Maule, A.J. (1995) Inhibition of host gene expression associated with plant virus replication. Science, 267, 229–231. [DOI] [PubMed] [Google Scholar]
- Wang, R.Y.‐L. and Nagy, P.D. (2008) Tomato bushy stunt virus co‐opts the RNA‐binding function of a host metabolic enzyme for viral genomic RNA synthesis. Cell Host Microbe, 3, 178–187. [DOI] [PubMed] [Google Scholar]
- Wingard, S.A. (1928) Hosts and symptoms of ring spot, a virus disease of plants. J. Agric. Res. 37, 127–153. [Google Scholar]
- Yanai, O. , Shani, E. , Dolezal, K. , Tarkowski, P. , Sablowski, R. , Sandberg, G. , Samach, A. and Ori, N. (2005) Arabidopsis KNOXI proteins activate cytokinin biosynthesis. Curr. Biol. CB, 15, 1566–1571. [DOI] [PubMed] [Google Scholar]
- Yang, X. , Lu, Y. , Zhao, X. , Jiang, L. , Xu, S. , Peng, J. , Zheng, H. , Lin, L. , Wu, Y. , MacFarlane, S. , Chen, J. and Yan, F. (2019) Downregulation of nuclear protein H2B induces salicylic acid mediated defense against PVX infection in Nicotiana benthamiana . Front. Microbiol. 10, 1000. [DOI] [PMC free article] [PubMed] [Google Scholar]
- Ye, K. , Malinina, L. and Patel, D.J. (2003) Recognition of small interfering RNA by a viral suppressor of RNA silencing. Nature, 426, 874–878. [DOI] [PMC free article] [PubMed] [Google Scholar]
Associated Data
This section collects any data citations, data availability statements, or supplementary materials included in this article.
Supplementary Materials
Fig. S1 Testing the CymRSV probe. In situ hybridization of cross‐sections of mock, Cym19stop‐, and CymRSV‐infected plant leaves using an RNA probe against CymRSV. Bars = 200 µm.
Fig. S2 Exploratory analysis of the RNA‐Seq data. (A) Principal component analysis of the log2‐transformed, normalized transcript expressions (TPM) in the samples. We prepared four biological replicates per treatment. The first component explains more than two‐thirds of the variances in the expression values and separates the mock and the virus‐infected samples. (B) MA‐plot showing the biased estimator of the fold‐changes (the beta coefficient in the sleuth model) in the transcript expressions as a function of the mean transcript abundance (counts). The values shown in the axes are the exponentials of the original log‐transformed values on a log10 scale. The positive beta values represent increased, while the negative values represent decreased transcript expression in the virus‐infected samples. For the differential expression analysis, the P‐values were calculated using the Wald test and corrected for multiple testing to get the Q‐values according to the Benjamini–Hochberg method at a false discovery rate of 1%. We considered a transcript differentially expressed if its mean abundance across the samples was at least 10 (vertical dashed line), the absolute value of its beta was at least 2 (horizontal dashed line), and its Q‐value was less than 0.01. The red dots mark the transcripts that passed these filters. The numbers after the upward and the downward arrow denote the number of the up‐ and the down‐regulated transcripts, respectively.
Fig. S3 Expression of selected genes that were analysed by in situ hybridization experiments. The normalized expression values (transcript per million, TPM) of the indicated genes were estimated by kallisto (Pimentel et al., 2017). The boxplots represent the summary of the bootstrap analysis which estimates the technical variances in a sample. Four biological replicates were prepared (Mock 1–4, Virus 1–4). The WUSCHEL (WUS) and the SHOOT MERISTEMLESS (STM) gene strictly expresses in the meristem, while the GLYCERALDEHYDE‐PHOSPHATE DEHYDROGENASE (GAPDH) is an enzyme that is required for virus replication. The PATHOGENESIS‐RELATED PROTEIN Q (PRQ) is a well‐known stress‐induced marker gene. HISTONE 2A (H2A), DOWNY MILDEW RESISTANT 6 (DMR6) is a salicylic acid 5‐hydroxylase, UDP‐GLYCOSYLTRANSFERASE 74 F1 (UGT74F1) transfers UDP:glucose to salicylic acid, CYTOCHROME P450 (CYP450) is a hydroxylase involved in the metabolism of many bioactive compounds, including hormones, while CALMODULIN‐BINDING PROTEIN (CaM‐binding) is a component of many stress‐related signalling pathways.
Fig. S4 Validation of the high‐throughput sequencing results by quantitative real‐time RT‐PCR. Some of the investigated genes shown in Fig. S3 was also measured by RT‐qPCR. Gene levels were normalized to the SEC23 and PRX2B (Table S3) reference gene levels in the same sample. Reference genes were selected from the least significantly changed genes according to the RNA‐Seq analysis, with moderate (~50 and ~600 TPM) mean expression levels and minimal variation of expression levels across all the samples. The values are means of three independent experiments with SE. An unpaired, one‐tailed t‐test was performed to estimate statistical significance. ***, P ≤ 0.001; **, P ≤ 0.01; *, P ≤ 0.05, ns = not significant.
Fig. S5 Expression of meristem‐specific genes. The normalized expression values (transcript per million, TPM) of the indicated genes were estimated by kallisto (Pimentel et al., 2017), log2‐transformed and z‐scores were calculated. The z‐scores show how many standard deviations the given value is above (red) or below (blue) from the mean (white) of all the values in the row. We show the values of the four biological replicates (Mock 1–4, Virus 1–4).
Fig. S6 Expression pattern of selected genes in CymRSV‐infected shoot apices. In situ hybridization of longitudinal sections of shoot apices of mock‐ and CymRSV‐infected plants 4 or 5 dpi, hybridized with CymRSV‐ or gene‐specific probes as indicated: UDP‐GLYCOSYLTRANSFERASE 74 F1 (UGT74F1), CYTOCHROME P450 SUPERFAMILY PROTEIN (CYP450), or Calmodulin‐binding (CaM‐BP). Bars = 100 µm.
Fig. S7 In situ hybridization of TVCV‐infected shoot apices. In situ hybridization of longitudinal sections of mock‐ and TVCV‐infected plants 4 or 5 dpi hybridized with a virus‐ or gene‐specific probes as indicated: GLYCERALDEHYDE 3‐PHOSPHATE DEHYDROGENASE A SUBUNIT 2 (GAPDH), PATHOGENESIS‐RELATED PROTEIN Q (PRQ), WUSCHEL (WUS), SHOOT MERISTEMLESS (STM). Bars = 100 µm.
Fig. S8 In situ hybridization of CMV‐infected shoot apices. In situ hybridization of longitudinal sections of mock‐ and CMV‐infected plants hybridized with a virus‐ or gene‐specific probes as indicated on the left side: GLYCERALDEHYDE 3‐PHOSPHATE DEHYDROGENASE A SUBUNIT 2 (GAPDH), PATHOGENESIS‐RELATED PROTEIN Q (PRQ), HISTONE 2A (H2A), WUSCHEL (WUS), SHOOT MERISTEMLESS (STM). Bars = 100 µm.
Fig. S9 Recovery from side shoots. Symptoms of mock and CymRSV‐infected Nicotiana benthamiana plants grown at 21 °C 4–8 days after infection, then transferred to 27 °C for 3 weeks. Symptoms of a representative mock‐ and CymRSV‐infected plant grown at 21 °C one week after infection (upper picture) and at 27 °C four weeks after infection (lower picture).
Fig. S10 Expression of the significantly up‐regulated SIZ1 homologue genes in the SAM region. The normalized expression values (transcript per million, TPM) of the indicated genes were estimated by kallisto (Pimentel et al., 2017), log2‐transformed and z‐scores were calculated. The z‐scores show how many standard deviations the given value is above (red) or below (blue) from the mean (white) of all the values in the row. We show the values of the four biological replicates (Mock 1–4, Virus 1–4). For criteria of the significantly changed expressions see legend of Fig. S2.
Fig. S11 Expression of the significantly up‐regulated autophagy‐related genes in the SAM region. The normalized expression values (transcript per million, TPM) of the indicated genes were estimated by kallisto (Pimentel et al., 2017), log2‐transformed and z‐scores were calculated. The z‐scores show how many standard deviations the given value is above (red) or below (blue) from the mean (white) of all the values in the row. We show the values of the four biological replicates (Mock 1–4, Virus 1–4). For criteria of the significantly changed expressions see legend of Fig. S2.
Fig. S12 Expression of the significantly down‐regulated MCM‐complex genes in the SAM region. The normalized expression values (transcript per million, TPM) of the indicated genes were estimated by kallisto (Pimentel et al., 2017), log2‐transformed and z‐scores were calculated. The z‐scores show how many standard deviations the given value is above (red) or below (blue) from the mean (white) of all the values in the row. We show the values of the four biological replicates (Mock 1–4, Virus 1–4). For criteria of the significantly changed expressions see legend of Fig. S2.
Table S1 RNA‐Seq analysis. The annotated expression tables and the result of the differential expression analysis for the up‐regulated (Table S1A) and down‐regulated transcripts (Table S1B), the meristem‐specific genes (Table S1C), and all the tested transcripts (Table S1D).
Table S2 GO‐term enrichment analysis. The result of the GO‐term enrichment analysis without the simplification by REViGO. Significantly enriched GO‐terms among the up‐regulated (Table S2A) and down‐regulated (Table S2B) genes.
Table S3 Primers and probes. Information about the primers and probes used in this study.
Data Availability Statement
The data that support the findings of this study are openly available in the Gene Expression Omnibus (GEO) database at www.ncbi.nlm.nih.gov/geo, accession number GSE131476.